Estimated zip code population in 2022: 29,040
Zip code population in 2010: 27,035
Zip code population in 2000: 28,873
Houses and condos: 13,993
Renter-occupied apartments: 4,666
% of renters here:
36%State:
31%
March 2022 cost of living index in zip code 19119: 104.5
(near average, U.S. average is 100)
Land area: 3.2
sq. mi.
Water area: 0.0
sq. mi.
Population density: 8,972 people per square mile (high).
OSM Map
General Map
Google Map
MSN Map
OSM Map
General Map
Google Map
MSN Map
OSM Map
General Map
Google Map
MSN Map
OSM Map
General Map
Google Map
MSN Map
Please wait while loading the map...
Real estate property taxes paid for housing units in 2022:
This zip code:
0.8% ($2,818)Pennsylvania:
1.3% ($3,094)
Median real estate property taxes paid for housing units with mortgages in 2022: $2,824 (0.8%)
Median real estate property taxes paid for housing units with no mortgage in 2022: $2,813 (0.9%)
Profiles of local businesses
Business Search - 14 Million verified businesses
Males: 13,057 Females: 15,983
For population 25 years and over in 19119:
High school or higher: 97.3%Bachelor's degree or higher: 57.2%Graduate or professional degree: 34.8%Unemployed: 5.4%Mean travel time to work (commute): 34.8 minutes
For population 15 years and over in 19119:
Never married: 38.7%Now married: 42.5%Separated: 2.2%Widowed: 7.3%Divorced: 9.3%
Zip code 19119 compared to state average:
Black race population percentage significantly above state average. Hispanic race population percentage below state average. Length of stay since moving in significantly above state average. House age above state average. Percentage of population with a bachelor's degree or higher above state average. 16,239 55.9% Black 9,606 33.1% White 1,372 4.7% Two or more races 1,075 3.7% Hispanic or Latino 423 1.5% Asian 185 0.6% Some other race 137 0.5% American Indian
Data:
Median household income ($)
Median household income (% change since 2000)
Household income diversity
Ratio of average income to average house value (%)
Ratio of average income to average rent
Median household income ($) - White
Median household income ($) - Black or African American
Median household income ($) - Asian
Median household income ($) - Hispanic or Latino
Median household income ($) - American Indian and Alaska Native
Median household income ($) - Multirace
Median household income ($) - Other Race
Median household income for houses/condos with a mortgage ($)
Median household income for apartments without a mortgage ($)
Races - White alone (%)
Races - White alone (% change since 2000)
Races - Black alone (%)
Races - Black alone (% change since 2000)
Races - American Indian alone (%)
Races - American Indian alone (% change since 2000)
Races - Asian alone (%)
Races - Asian alone (% change since 2000)
Races - Hispanic (%)
Races - Hispanic (% change since 2000)
Races - Native Hawaiian and Other Pacific Islander alone (%)
Races - Native Hawaiian and Other Pacific Islander alone (% change since 2000)
Races - Two or more races (%)
Races - Two or more races (% change since 2000)
Races - Other race alone (%)
Races - Other race alone (% change since 2000)
Racial diversity
Unemployment (%)
Unemployment (% change since 2000)
Unemployment (%) - White
Unemployment (%) - Black or African American
Unemployment (%) - Asian
Unemployment (%) - Hispanic or Latino
Unemployment (%) - American Indian and Alaska Native
Unemployment (%) - Multirace
Unemployment (%) - Other Race
Population density (people per square mile)
Population - Males (%)
Population - Females (%)
Population - Males (%) - White
Population - Males (%) - Black or African American
Population - Males (%) - Asian
Population - Males (%) - Hispanic or Latino
Population - Males (%) - American Indian and Alaska Native
Population - Males (%) - Multirace
Population - Males (%) - Other Race
Population - Females (%) - White
Population - Females (%) - Black or African American
Population - Females (%) - Asian
Population - Females (%) - Hispanic or Latino
Population - Females (%) - American Indian and Alaska Native
Population - Females (%) - Multirace
Population - Females (%) - Other Race
Coronavirus confirmed cases (Apr 27, 2024)
Deaths caused by coronavirus (Apr 27, 2024)
Coronavirus confirmed cases (per 100k population) (Apr 27, 2024)
Deaths caused by coronavirus (per 100k population) (Apr 27, 2024)
Daily increase in number of cases (Apr 27, 2024)
Weekly increase in number of cases (Apr 27, 2024)
Cases doubled (in days) (Apr 27, 2024)
Hospitalized patients (Apr 18, 2022)
Negative test results (Apr 18, 2022)
Total test results (Apr 18, 2022)
COVID Vaccine doses distributed (per 100k population) (Sep 19, 2023)
COVID Vaccine doses administered (per 100k population) (Sep 19, 2023)
COVID Vaccine doses distributed (Sep 19, 2023)
COVID Vaccine doses administered (Sep 19, 2023)
Likely homosexual households (%)
Likely homosexual households (% change since 2000)
Likely homosexual households - Lesbian couples (%)
Likely homosexual households - Lesbian couples (% change since 2000)
Likely homosexual households - Gay men (%)
Likely homosexual households - Gay men (% change since 2000)
Cost of living index
Median gross rent ($)
Median contract rent ($)
Median monthly housing costs ($)
Median house or condo value ($)
Median house or condo value ($ change since 2000)
Mean house or condo value by units in structure - 1, detached ($)
Mean house or condo value by units in structure - 1, attached ($)
Mean house or condo value by units in structure - 2 ($)
Mean house or condo value by units in structure by units in structure - 3 or 4 ($)
Mean house or condo value by units in structure - 5 or more ($)
Mean house or condo value by units in structure - Boat, RV, van, etc. ($)
Mean house or condo value by units in structure - Mobile home ($)
Median house or condo value ($) - White
Median house or condo value ($) - Black or African American
Median house or condo value ($) - Asian
Median house or condo value ($) - Hispanic or Latino
Median house or condo value ($) - American Indian and Alaska Native
Median house or condo value ($) - Multirace
Median house or condo value ($) - Other Race
Median resident age
Resident age diversity
Median resident age - Males
Median resident age - Females
Median resident age - White
Median resident age - Black or African American
Median resident age - Asian
Median resident age - Hispanic or Latino
Median resident age - American Indian and Alaska Native
Median resident age - Multirace
Median resident age - Other Race
Median resident age - Males - White
Median resident age - Males - Black or African American
Median resident age - Males - Asian
Median resident age - Males - Hispanic or Latino
Median resident age - Males - American Indian and Alaska Native
Median resident age - Males - Multirace
Median resident age - Males - Other Race
Median resident age - Females - White
Median resident age - Females - Black or African American
Median resident age - Females - Asian
Median resident age - Females - Hispanic or Latino
Median resident age - Females - American Indian and Alaska Native
Median resident age - Females - Multirace
Median resident age - Females - Other Race
Commute - mean travel time to work (minutes)
Travel time to work - Less than 5 minutes (%)
Travel time to work - Less than 5 minutes (% change since 2000)
Travel time to work - 5 to 9 minutes (%)
Travel time to work - 5 to 9 minutes (% change since 2000)
Travel time to work - 10 to 19 minutes (%)
Travel time to work - 10 to 19 minutes (% change since 2000)
Travel time to work - 20 to 29 minutes (%)
Travel time to work - 20 to 29 minutes (% change since 2000)
Travel time to work - 30 to 39 minutes (%)
Travel time to work - 30 to 39 minutes (% change since 2000)
Travel time to work - 40 to 59 minutes (%)
Travel time to work - 40 to 59 minutes (% change since 2000)
Travel time to work - 60 to 89 minutes (%)
Travel time to work - 60 to 89 minutes (% change since 2000)
Travel time to work - 90 or more minutes (%)
Travel time to work - 90 or more minutes (% change since 2000)
Marital status - Never married (%)
Marital status - Now married (%)
Marital status - Separated (%)
Marital status - Widowed (%)
Marital status - Divorced (%)
Median family income ($)
Median family income (% change since 2000)
Median non-family income ($)
Median non-family income (% change since 2000)
Median per capita income ($)
Median per capita income (% change since 2000)
Median family income ($) - White
Median family income ($) - Black or African American
Median family income ($) - Asian
Median family income ($) - Hispanic or Latino
Median family income ($) - American Indian and Alaska Native
Median family income ($) - Multirace
Median family income ($) - Other Race
Median year house/condo built
Median year apartment built
Year house built - Built 2005 or later (%)
Year house built - Built 2000 to 2004 (%)
Year house built - Built 1990 to 1999 (%)
Year house built - Built 1980 to 1989 (%)
Year house built - Built 1970 to 1979 (%)
Year house built - Built 1960 to 1969 (%)
Year house built - Built 1950 to 1959 (%)
Year house built - Built 1940 to 1949 (%)
Year house built - Built 1939 or earlier (%)
Average household size
Household density (households per square mile)
Average household size - White
Average household size - Black or African American
Average household size - Asian
Average household size - Hispanic or Latino
Average household size - American Indian and Alaska Native
Average household size - Multirace
Average household size - Other Race
Occupied housing units (%)
Vacant housing units (%)
Owner occupied housing units (%)
Renter occupied housing units (%)
Vacancy status - For rent (%)
Vacancy status - For sale only (%)
Vacancy status - Rented or sold, not occupied (%)
Vacancy status - For seasonal, recreational, or occasional use (%)
Vacancy status - For migrant workers (%)
Vacancy status - Other vacant (%)
Residents with income below the poverty level (%)
Residents with income below 50% of the poverty level (%)
Children below poverty level (%)
Poor families by family type - Married-couple family (%)
Poor families by family type - Male, no wife present (%)
Poor families by family type - Female, no husband present (%)
Poverty status for native-born residents (%)
Poverty status for foreign-born residents (%)
Poverty among high school graduates not in families (%)
Poverty among people who did not graduate high school not in families (%)
Residents with income below the poverty level (%) - White
Residents with income below the poverty level (%) - Black or African American
Residents with income below the poverty level (%) - Asian
Residents with income below the poverty level (%) - Hispanic or Latino
Residents with income below the poverty level (%) - American Indian and Alaska Native
Residents with income below the poverty level (%) - Multirace
Residents with income below the poverty level (%) - Other Race
Air pollution - Air Quality Index (AQI)
Air pollution - CO
Air pollution - NO2
Air pollution - SO2
Air pollution - Ozone
Air pollution - PM10
Air pollution - PM25
Air pollution - Pb
Crime - Murders per 100,000 population
Crime - Rapes per 100,000 population
Crime - Robberies per 100,000 population
Crime - Assaults per 100,000 population
Crime - Burglaries per 100,000 population
Crime - Thefts per 100,000 population
Crime - Auto thefts per 100,000 population
Crime - Arson per 100,000 population
Crime - City-data.com crime index
Crime - Violent crime index
Crime - Property crime index
Crime - Murders per 100,000 population (5 year average)
Crime - Rapes per 100,000 population (5 year average)
Crime - Robberies per 100,000 population (5 year average)
Crime - Assaults per 100,000 population (5 year average)
Crime - Burglaries per 100,000 population (5 year average)
Crime - Thefts per 100,000 population (5 year average)
Crime - Auto thefts per 100,000 population (5 year average)
Crime - Arson per 100,000 population (5 year average)
Crime - City-data.com crime index (5 year average)
Crime - Violent crime index (5 year average)
Crime - Property crime index (5 year average)
1996 Presidential Elections Results (%) - Democratic Party (Clinton)
1996 Presidential Elections Results (%) - Republican Party (Dole)
1996 Presidential Elections Results (%) - Other
2000 Presidential Elections Results (%) - Democratic Party (Gore)
2000 Presidential Elections Results (%) - Republican Party (Bush)
2000 Presidential Elections Results (%) - Other
2004 Presidential Elections Results (%) - Democratic Party (Kerry)
2004 Presidential Elections Results (%) - Republican Party (Bush)
2004 Presidential Elections Results (%) - Other
2008 Presidential Elections Results (%) - Democratic Party (Obama)
2008 Presidential Elections Results (%) - Republican Party (McCain)
2008 Presidential Elections Results (%) - Other
2012 Presidential Elections Results (%) - Democratic Party (Obama)
2012 Presidential Elections Results (%) - Republican Party (Romney)
2012 Presidential Elections Results (%) - Other
2016 Presidential Elections Results (%) - Democratic Party (Clinton)
2016 Presidential Elections Results (%) - Republican Party (Trump)
2016 Presidential Elections Results (%) - Other
2020 Presidential Elections Results (%) - Democratic Party (Biden)
2020 Presidential Elections Results (%) - Republican Party (Trump)
2020 Presidential Elections Results (%) - Other
Ancestries Reported - Arab (%)
Ancestries Reported - Czech (%)
Ancestries Reported - Danish (%)
Ancestries Reported - Dutch (%)
Ancestries Reported - English (%)
Ancestries Reported - French (%)
Ancestries Reported - French Canadian (%)
Ancestries Reported - German (%)
Ancestries Reported - Greek (%)
Ancestries Reported - Hungarian (%)
Ancestries Reported - Irish (%)
Ancestries Reported - Italian (%)
Ancestries Reported - Lithuanian (%)
Ancestries Reported - Norwegian (%)
Ancestries Reported - Polish (%)
Ancestries Reported - Portuguese (%)
Ancestries Reported - Russian (%)
Ancestries Reported - Scotch-Irish (%)
Ancestries Reported - Scottish (%)
Ancestries Reported - Slovak (%)
Ancestries Reported - Subsaharan African (%)
Ancestries Reported - Swedish (%)
Ancestries Reported - Swiss (%)
Ancestries Reported - Ukrainian (%)
Ancestries Reported - United States (%)
Ancestries Reported - Welsh (%)
Ancestries Reported - West Indian (%)
Ancestries Reported - Other (%)
Educational Attainment - No schooling completed (%)
Educational Attainment - Less than high school (%)
Educational Attainment - High school or equivalent (%)
Educational Attainment - Less than 1 year of college (%)
Educational Attainment - 1 or more years of college (%)
Educational Attainment - Associate degree (%)
Educational Attainment - Bachelor's degree (%)
Educational Attainment - Master's degree (%)
Educational Attainment - Professional school degree (%)
Educational Attainment - Doctorate degree (%)
School Enrollment - Nursery, preschool (%)
School Enrollment - Kindergarten (%)
School Enrollment - Grade 1 to 4 (%)
School Enrollment - Grade 5 to 8 (%)
School Enrollment - Grade 9 to 12 (%)
School Enrollment - College undergrad (%)
School Enrollment - Graduate or professional (%)
School Enrollment - Not enrolled in school (%)
School enrollment - Public schools (%)
School enrollment - Private schools (%)
School enrollment - Not enrolled (%)
Median number of rooms in houses and condos
Median number of rooms in apartments
Housing units lacking complete plumbing facilities (%)
Housing units lacking complete kitchen facilities (%)
Density of houses
Urban houses (%)
Rural houses (%)
Households with people 60 years and over (%)
Households with people 65 years and over (%)
Households with people 75 years and over (%)
Households with one or more nonrelatives (%)
Households with no nonrelatives (%)
Population in households (%)
Family households (%)
Nonfamily households (%)
Population in families (%)
Family households with own children (%)
Median number of bedrooms in owner occupied houses
Mean number of bedrooms in owner occupied houses
Median number of bedrooms in renter occupied houses
Mean number of bedrooms in renter occupied houses
Median number of vehichles in owner occupied houses
Mean number of vehichles in owner occupied houses
Median number of vehichles in renter occupied houses
Mean number of vehichles in renter occupied houses
Mortgage status - with mortgage (%)
Mortgage status - with second mortgage (%)
Mortgage status - with home equity loan (%)
Mortgage status - with both second mortgage and home equity loan (%)
Mortgage status - without a mortgage (%)
Average family size
Average family size - White
Average family size - Black or African American
Average family size - Asian
Average family size - Hispanic or Latino
Average family size - American Indian and Alaska Native
Average family size - Multirace
Average family size - Other Race
Geographical mobility - Same house 1 year ago (%)
Geographical mobility - Moved within same county (%)
Geographical mobility - Moved from different county within same state (%)
Geographical mobility - Moved from different state (%)
Geographical mobility - Moved from abroad (%)
Place of birth - Born in state of residence (%)
Place of birth - Born in other state (%)
Place of birth - Native, outside of US (%)
Place of birth - Foreign born (%)
Housing units in structures - 1, detached (%)
Housing units in structures - 1, attached (%)
Housing units in structures - 2 (%)
Housing units in structures - 3 or 4 (%)
Housing units in structures - 5 to 9 (%)
Housing units in structures - 10 to 19 (%)
Housing units in structures - 20 to 49 (%)
Housing units in structures - 50 or more (%)
Housing units in structures - Mobile home (%)
Housing units in structures - Boat, RV, van, etc. (%)
House/condo owner moved in on average (years ago)
Renter moved in on average (years ago)
Year householder moved into unit - Moved in 1999 to March 2000 (%)
Year householder moved into unit - Moved in 1995 to 1998 (%)
Year householder moved into unit - Moved in 1990 to 1994 (%)
Year householder moved into unit - Moved in 1980 to 1989 (%)
Year householder moved into unit - Moved in 1970 to 1979 (%)
Year householder moved into unit - Moved in 1969 or earlier (%)
Means of transportation to work - Drove car alone (%)
Means of transportation to work - Carpooled (%)
Means of transportation to work - Public transportation (%)
Means of transportation to work - Bus or trolley bus (%)
Means of transportation to work - Streetcar or trolley car (%)
Means of transportation to work - Subway or elevated (%)
Means of transportation to work - Railroad (%)
Means of transportation to work - Ferryboat (%)
Means of transportation to work - Taxicab (%)
Means of transportation to work - Motorcycle (%)
Means of transportation to work - Bicycle (%)
Means of transportation to work - Walked (%)
Means of transportation to work - Other means (%)
Working at home (%)
Industry diversity
Most Common Industries - Agriculture, forestry, fishing and hunting, and mining (%)
Most Common Industries - Agriculture, forestry, fishing and hunting (%)
Most Common Industries - Mining, quarrying, and oil and gas extraction (%)
Most Common Industries - Construction (%)
Most Common Industries - Manufacturing (%)
Most Common Industries - Wholesale trade (%)
Most Common Industries - Retail trade (%)
Most Common Industries - Transportation and warehousing, and utilities (%)
Most Common Industries - Transportation and warehousing (%)
Most Common Industries - Utilities (%)
Most Common Industries - Information (%)
Most Common Industries - Finance and insurance, and real estate and rental and leasing (%)
Most Common Industries - Finance and insurance (%)
Most Common Industries - Real estate and rental and leasing (%)
Most Common Industries - Professional, scientific, and management, and administrative and waste management services (%)
Most Common Industries - Professional, scientific, and technical services (%)
Most Common Industries - Management of companies and enterprises (%)
Most Common Industries - Administrative and support and waste management services (%)
Most Common Industries - Educational services, and health care and social assistance (%)
Most Common Industries - Educational services (%)
Most Common Industries - Health care and social assistance (%)
Most Common Industries - Arts, entertainment, and recreation, and accommodation and food services (%)
Most Common Industries - Arts, entertainment, and recreation (%)
Most Common Industries - Accommodation and food services (%)
Most Common Industries - Other services, except public administration (%)
Most Common Industries - Public administration (%)
Occupation diversity
Most Common Occupations - Management, business, science, and arts occupations (%)
Most Common Occupations - Management, business, and financial occupations (%)
Most Common Occupations - Management occupations (%)
Most Common Occupations - Business and financial operations occupations (%)
Most Common Occupations - Computer, engineering, and science occupations (%)
Most Common Occupations - Computer and mathematical occupations (%)
Most Common Occupations - Architecture and engineering occupations (%)
Most Common Occupations - Life, physical, and social science occupations (%)
Most Common Occupations - Education, legal, community service, arts, and media occupations (%)
Most Common Occupations - Community and social service occupations (%)
Most Common Occupations - Legal occupations (%)
Most Common Occupations - Education, training, and library occupations (%)
Most Common Occupations - Arts, design, entertainment, sports, and media occupations (%)
Most Common Occupations - Healthcare practitioners and technical occupations (%)
Most Common Occupations - Health diagnosing and treating practitioners and other technical occupations (%)
Most Common Occupations - Health technologists and technicians (%)
Most Common Occupations - Service occupations (%)
Most Common Occupations - Healthcare support occupations (%)
Most Common Occupations - Protective service occupations (%)
Most Common Occupations - Fire fighting and prevention, and other protective service workers including supervisors (%)
Most Common Occupations - Law enforcement workers including supervisors (%)
Most Common Occupations - Food preparation and serving related occupations (%)
Most Common Occupations - Building and grounds cleaning and maintenance occupations (%)
Most Common Occupations - Personal care and service occupations (%)
Most Common Occupations - Sales and office occupations (%)
Most Common Occupations - Sales and related occupations (%)
Most Common Occupations - Office and administrative support occupations (%)
Most Common Occupations - Natural resources, construction, and maintenance occupations (%)
Most Common Occupations - Farming, fishing, and forestry occupations (%)
Most Common Occupations - Construction and extraction occupations (%)
Most Common Occupations - Installation, maintenance, and repair occupations (%)
Most Common Occupations - Production, transportation, and material moving occupations (%)
Most Common Occupations - Production occupations (%)
Most Common Occupations - Transportation occupations (%)
Most Common Occupations - Material moving occupations (%)
People in Group quarters - Institutionalized population (%)
People in Group quarters - Correctional institutions (%)
People in Group quarters - Federal prisons and detention centers (%)
People in Group quarters - Halfway houses (%)
People in Group quarters - Local jails and other confinement facilities (including police lockups) (%)
People in Group quarters - Military disciplinary barracks (%)
People in Group quarters - State prisons (%)
People in Group quarters - Other types of correctional institutions (%)
People in Group quarters - Nursing homes (%)
People in Group quarters - Hospitals/wards, hospices, and schools for the handicapped (%)
People in Group quarters - Hospitals/wards and hospices for chronically ill (%)
People in Group quarters - Hospices or homes for chronically ill (%)
People in Group quarters - Military hospitals or wards for chronically ill (%)
People in Group quarters - Other hospitals or wards for chronically ill (%)
People in Group quarters - Hospitals or wards for drug/alcohol abuse (%)
People in Group quarters - Mental (Psychiatric) hospitals or wards (%)
People in Group quarters - Schools, hospitals, or wards for the mentally retarded (%)
People in Group quarters - Schools, hospitals, or wards for the physically handicapped (%)
People in Group quarters - Institutions for the deaf (%)
People in Group quarters - Institutions for the blind (%)
People in Group quarters - Orthopedic wards and institutions for the physically handicapped (%)
People in Group quarters - Wards in general hospitals for patients who have no usual home elsewhere (%)
People in Group quarters - Wards in military hospitals for patients who have no usual home elsewhere (%)
People in Group quarters - Juvenile institutions (%)
People in Group quarters - Long-term care (%)
People in Group quarters - Homes for abused, dependent, and neglected children (%)
People in Group quarters - Residential treatment centers for emotionally disturbed children (%)
People in Group quarters - Training schools for juvenile delinquents (%)
People in Group quarters - Short-term care, detention or diagnostic centers for delinquent children (%)
People in Group quarters - Type of juvenile institution unknown (%)
People in Group quarters - Noninstitutionalized population (%)
People in Group quarters - College dormitories (includes college quarters off campus) (%)
People in Group quarters - Military quarters (%)
People in Group quarters - On base (%)
People in Group quarters - Barracks, unaccompanied personnel housing (UPH), (Enlisted/Officer), ;and similar group living quarters for military personnel (%)
People in Group quarters - Transient quarters for temporary residents (%)
People in Group quarters - Military ships (%)
People in Group quarters - Group homes (%)
People in Group quarters - Homes or halfway houses for drug/alcohol abuse (%)
People in Group quarters - Homes for the mentally ill (%)
People in Group quarters - Homes for the mentally retarded (%)
People in Group quarters - Homes for the physically handicapped (%)
People in Group quarters - Other group homes (%)
People in Group quarters - Religious group quarters (%)
People in Group quarters - Dormitories (%)
People in Group quarters - Agriculture workers' dormitories on farms (%)
People in Group quarters - Job Corps and vocational training facilities (%)
People in Group quarters - Other workers' dormitories (%)
People in Group quarters - Crews of maritime vessels (%)
People in Group quarters - Other nonhousehold living situations (%)
People in Group quarters - Other noninstitutional group quarters (%)
Residents speaking English at home (%)
Residents speaking English at home - Born in the United States (%)
Residents speaking English at home - Native, born elsewhere (%)
Residents speaking English at home - Foreign born (%)
Residents speaking Spanish at home (%)
Residents speaking Spanish at home - Born in the United States (%)
Residents speaking Spanish at home - Native, born elsewhere (%)
Residents speaking Spanish at home - Foreign born (%)
Residents speaking other language at home (%)
Residents speaking other language at home - Born in the United States (%)
Residents speaking other language at home - Native, born elsewhere (%)
Residents speaking other language at home - Foreign born (%)
Class of Workers - Employee of private company (%)
Class of Workers - Self-employed in own incorporated business (%)
Class of Workers - Private not-for-profit wage and salary workers (%)
Class of Workers - Local government workers (%)
Class of Workers - State government workers (%)
Class of Workers - Federal government workers (%)
Class of Workers - Self-employed workers in own not incorporated business and Unpaid family workers (%)
House heating fuel used in houses and condos - Utility gas (%)
House heating fuel used in houses and condos - Bottled, tank, or LP gas (%)
House heating fuel used in houses and condos - Electricity (%)
House heating fuel used in houses and condos - Fuel oil, kerosene, etc. (%)
House heating fuel used in houses and condos - Coal or coke (%)
House heating fuel used in houses and condos - Wood (%)
House heating fuel used in houses and condos - Solar energy (%)
House heating fuel used in houses and condos - Other fuel (%)
House heating fuel used in houses and condos - No fuel used (%)
House heating fuel used in apartments - Utility gas (%)
House heating fuel used in apartments - Bottled, tank, or LP gas (%)
House heating fuel used in apartments - Electricity (%)
House heating fuel used in apartments - Fuel oil, kerosene, etc. (%)
House heating fuel used in apartments - Coal or coke (%)
House heating fuel used in apartments - Wood (%)
House heating fuel used in apartments - Solar energy (%)
House heating fuel used in apartments - Other fuel (%)
House heating fuel used in apartments - No fuel used (%)
Armed forces status - In Armed Forces (%)
Armed forces status - Civilian (%)
Armed forces status - Civilian - Veteran (%)
Armed forces status - Civilian - Nonveteran (%)
Fatal accidents locations in years 2005-2021
Fatal accidents locations in 2005
Fatal accidents locations in 2006
Fatal accidents locations in 2007
Fatal accidents locations in 2008
Fatal accidents locations in 2009
Fatal accidents locations in 2010
Fatal accidents locations in 2011
Fatal accidents locations in 2012
Fatal accidents locations in 2013
Fatal accidents locations in 2014
Fatal accidents locations in 2015
Fatal accidents locations in 2016
Fatal accidents locations in 2017
Fatal accidents locations in 2018
Fatal accidents locations in 2019
Fatal accidents locations in 2020
Fatal accidents locations in 2021
Alcohol use - People drinking some alcohol every month (%)
Alcohol use - People not drinking at all (%)
Alcohol use - Average days/month drinking alcohol
Alcohol use - Average drinks/week
Alcohol use - Average days/year people drink much
Audiometry - Average condition of hearing (%)
Audiometry - People that can hear a whisper from across a quiet room (%)
Audiometry - People that can hear normal voice from across a quiet room (%)
Audiometry - Ears ringing, roaring, buzzing (%)
Audiometry - Had a job exposure to loud noise (%)
Audiometry - Had off-work exposure to loud noise (%)
Blood Pressure & Cholesterol - Has high blood pressure (%)
Blood Pressure & Cholesterol - Checking blood pressure at home (%)
Blood Pressure & Cholesterol - Frequently checking blood cholesterol (%)
Blood Pressure & Cholesterol - Has high cholesterol level (%)
Consumer Behavior - Money monthly spent on food at supermarket/grocery store
Consumer Behavior - Money monthly spent on food at other stores
Consumer Behavior - Money monthly spent on eating out
Consumer Behavior - Money monthly spent on carryout/delivered foods
Consumer Behavior - Income spent on food at supermarket/grocery store (%)
Consumer Behavior - Income spent on food at other stores (%)
Consumer Behavior - Income spent on eating out (%)
Consumer Behavior - Income spent on carryout/delivered foods (%)
Current Health Status - General health condition (%)
Current Health Status - Blood donors (%)
Current Health Status - Has blood ever tested for HIV virus (%)
Current Health Status - Left-handed people (%)
Dermatology - People using sunscreen (%)
Diabetes - Diabetics (%)
Diabetes - Had a blood test for high blood sugar (%)
Diabetes - People taking insulin (%)
Diet Behavior & Nutrition - Diet health (%)
Diet Behavior & Nutrition - Milk product consumption (# of products/month)
Diet Behavior & Nutrition - Meals not home prepared (#/week)
Diet Behavior & Nutrition - Meals from fast food or pizza place (#/week)
Diet Behavior & Nutrition - Ready-to-eat foods (#/month)
Diet Behavior & Nutrition - Frozen meals/pizza (#/month)
Drug Use - People that ever used marijuana or hashish (%)
Drug Use - Ever used hard drugs (%)
Drug Use - Ever used any form of cocaine (%)
Drug Use - Ever used heroin (%)
Drug Use - Ever used methamphetamine (%)
Health Insurance - People covered by health insurance (%)
Kidney Conditions-Urology - Avg. # of times urinating at night
Medical Conditions - People with asthma (%)
Medical Conditions - People with anemia (%)
Medical Conditions - People with psoriasis (%)
Medical Conditions - People with overweight (%)
Medical Conditions - Elderly people having difficulties in thinking or remembering (%)
Medical Conditions - People who ever received blood transfusion (%)
Medical Conditions - People having trouble seeing even with glass/contacts (%)
Medical Conditions - People with arthritis (%)
Medical Conditions - People with gout (%)
Medical Conditions - People with congestive heart failure (%)
Medical Conditions - People with coronary heart disease (%)
Medical Conditions - People with angina pectoris (%)
Medical Conditions - People who ever had heart attack (%)
Medical Conditions - People who ever had stroke (%)
Medical Conditions - People with emphysema (%)
Medical Conditions - People with thyroid problem (%)
Medical Conditions - People with chronic bronchitis (%)
Medical Conditions - People with any liver condition (%)
Medical Conditions - People who ever had cancer or malignancy (%)
Mental Health - People who have little interest in doing things (%)
Mental Health - People feeling down, depressed, or hopeless (%)
Mental Health - People who have trouble sleeping or sleeping too much (%)
Mental Health - People feeling tired or having little energy (%)
Mental Health - People with poor appetite or overeating (%)
Mental Health - People feeling bad about themself (%)
Mental Health - People who have trouble concentrating on things (%)
Mental Health - People moving or speaking slowly or too fast (%)
Mental Health - People having thoughts they would be better off dead (%)
Oral Health - Average years since last visit a dentist
Oral Health - People embarrassed because of mouth (%)
Oral Health - People with gum disease (%)
Oral Health - General health of teeth and gums (%)
Oral Health - Average days a week using dental floss/device
Oral Health - Average days a week using mouthwash for dental problem
Oral Health - Average number of teeth
Pesticide Use - Households using pesticides to control insects (%)
Pesticide Use - Households using pesticides to kill weeds (%)
Physical Activity - People doing vigorous-intensity work activities (%)
Physical Activity - People doing moderate-intensity work activities (%)
Physical Activity - People walking or bicycling (%)
Physical Activity - People doing vigorous-intensity recreational activities (%)
Physical Activity - People doing moderate-intensity recreational activities (%)
Physical Activity - Average hours a day doing sedentary activities
Physical Activity - Average hours a day watching TV or videos
Physical Activity - Average hours a day using computer
Physical Functioning - People having limitations keeping them from working (%)
Physical Functioning - People limited in amount of work they can do (%)
Physical Functioning - People that need special equipment to walk (%)
Physical Functioning - People experiencing confusion/memory problems (%)
Physical Functioning - People requiring special healthcare equipment (%)
Prescription Medications - Average number of prescription medicines taking
Preventive Aspirin Use - Adults 40+ taking low-dose aspirin (%)
Reproductive Health - Vaginal deliveries (%)
Reproductive Health - Cesarean deliveries (%)
Reproductive Health - Deliveries resulted in a live birth (%)
Reproductive Health - Pregnancies resulted in a delivery (%)
Reproductive Health - Women breastfeeding newborns (%)
Reproductive Health - Women that had a hysterectomy (%)
Reproductive Health - Women that had both ovaries removed (%)
Reproductive Health - Women that have ever taken birth control pills (%)
Reproductive Health - Women taking birth control pills (%)
Reproductive Health - Women that have ever used Depo-Provera or injectables (%)
Reproductive Health - Women that have ever used female hormones (%)
Sexual Behavior - People 18+ that ever had sex (vaginal, anal, or oral) (%)
Sexual Behavior - Males 18+ that ever had vaginal sex with a woman (%)
Sexual Behavior - Males 18+ that ever performed oral sex on a woman (%)
Sexual Behavior - Males 18+ that ever had anal sex with a woman (%)
Sexual Behavior - Males 18+ that ever had any sex with a man (%)
Sexual Behavior - Females 18+ that ever had vaginal sex with a man (%)
Sexual Behavior - Females 18+ that ever performed oral sex on a man (%)
Sexual Behavior - Females 18+ that ever had anal sex with a man (%)
Sexual Behavior - Females 18+ that ever had any kind of sex with a woman (%)
Sexual Behavior - Average age people first had sex
Sexual Behavior - Average number of female sex partners in lifetime (males 18+)
Sexual Behavior - Average number of female vaginal sex partners in lifetime (males 18+)
Sexual Behavior - Average age people first performed oral sex on a woman (18+)
Sexual Behavior - Average number of woman performed oral sex on in lifetime (18+)
Sexual Behavior - Average number of male sex partners in lifetime (males 18+)
Sexual Behavior - Average number of male anal sex partners in lifetime (males 18+)
Sexual Behavior - Average age people first performed oral sex on a man (18+)
Sexual Behavior - Average number of male oral sex partners in lifetime (18+)
Sexual Behavior - People using protection when performing oral sex (%)
Sexual Behavior - Average number of times people have vaginal or anal sex a year
Sexual Behavior - People having sex without condom (%)
Sexual Behavior - Average number of male sex partners in lifetime (females 18+)
Sexual Behavior - Average number of male vaginal sex partners in lifetime (females 18+)
Sexual Behavior - Average number of female sex partners in lifetime (females 18+)
Sexual Behavior - Circumcised males 18+ (%)
Sleep Disorders - Average hours sleeping at night
Sleep Disorders - People that has trouble sleeping (%)
Smoking-Cigarette Use - People smoking cigarettes (%)
Taste & Smell - People 40+ having problems with smell (%)
Taste & Smell - People 40+ having problems with taste (%)
Taste & Smell - People 40+ that ever had wisdom teeth removed (%)
Taste & Smell - People 40+ that ever had tonsils teeth removed (%)
Taste & Smell - People 40+ that ever had a loss of consciousness because of a head injury (%)
Taste & Smell - People 40+ that ever had a broken nose or other serious injury to face or skull (%)
Taste & Smell - People 40+ that ever had two or more sinus infections (%)
Weight - Average height (inches)
Weight - Average weight (pounds)
Weight - Average BMI
Weight - People that are obese (%)
Weight - People that ever were obese (%)
Weight - People trying to lose weight (%)
100%
urban population.
Estimated median house/condo value in 2022: $350,017
19119:
$350,017Pennsylvania:
$245,500
According to our research of Pennsylvania and other state lists, there were 33 registered sex offenders living in 19119 zip code as of April 26, 2024 . The ratio of all residents to sex offenders in zip code 19119 is 879 to 1.The ratio of registered sex offenders to all residents in this zip code is lower than the state average.
Median resident age: This zip code:
42.8 yearsPennsylvania median age:
40.9 years
Average household size: This zip code:
2.1 peoplePennsylvania:
2.4 people
Averages for the 2020 tax year for zip code 19119, filed in 2021:
Average Adjusted Gross Income (AGI) in 2020: $85,992 (Individual Income Tax Returns) Here:
$85,992State:
$75,707
Salary/wage: $73,444 (reported on 78.9% of returns )Here:
$73,444State:
$62,806
(% of AGI for various income ranges: 990.4% for AGIs below $25k , 3475.6% for AGIs $25k-50k , 6362.7% for AGIs $50k-75k , 10162.9% for AGIs $75k-100k , 19199.3% for AGIs $100k-200k , 102648.9% for AGIs over 200k ) Taxable interest for individuals: $1,553 (reported on 31.4% of returns )This zip code:
$1,553Pennsylvania:
$1,633
(% of AGI for various income ranges: 7.6% for AGIs below $25k , 12.8% for AGIs $25k-50k , 23.8% for AGIs $50k-75k , 41.6% for AGIs $75k-100k , 134.6% for AGIs $100k-200k , 1411.1% for AGIs over 200k ) Ordinary dividends: $10,312 (reported on 22.8% of returns )(% of AGI for various income ranges: 30.3% for AGIs below $25k , 37.9% for AGIs $25k-50k , 91.0% for AGIs $50k-75k , 202.2% for AGIs $75k-100k , 594.5% for AGIs $100k-200k , 7416.4% for AGIs over 200k ) Net capital gain/loss in AGI: +$25,519 (reported on 19.7% of returns )Here:
+$25,519State:
+$23,522
(% of AGI for various income ranges: 16.4% for AGIs below $25k , 39.6% for AGIs $25k-50k , 96.6% for AGIs $50k-75k , 213.9% for AGIs $75k-100k , 731.6% for AGIs $100k-200k , 19847.5% for AGIs over 200k ) Profit/loss from business: +$16,552 (reported on 19.1% of returns )Here:
+$16,552State:
+$16,274
(% of AGI for various income ranges: 107.5% for AGIs below $25k , 151.7% for AGIs $25k-50k , 236.2% for AGIs $50k-75k , 508.4% for AGIs $75k-100k , 986.1% for AGIs $100k-200k , 6452.5% for AGIs over 200k ) Taxable individual retirement arrangement distribution: $19,531 (reported on 9.0% of returns )19119:
$19,531Pennsylvania:
$18,583
(% of AGI for various income ranges: 36.8% for AGIs below $25k , 74.7% for AGIs $25k-50k , 143.0% for AGIs $50k-75k , 355.6% for AGIs $75k-100k , 876.8% for AGIs $100k-200k , 2340.4% for AGIs over 200k ) Self-employed (Keogh) retirement plans: $24,132 (reported on 1.4% of returns )19119:
$24,132Pennsylvania:
$25,407
(% of AGI for various income ranges: 21.9% for AGIs $50k-75k , 59.2% for AGIs $100k-200k , 1292.5% for AGIs over 200k ) Total itemized deductions: $32,064 (reported on 15.0% of returns )Here:
$32,064State:
$34,850
(% of AGI for various income ranges: 71.8% for AGIs below $25k , 154.4% for AGIs $25k-50k , 485.1% for AGIs $50k-75k , 928.9% for AGIs $75k-100k , 1557.3% for AGIs $100k-200k , 9907.5% for AGIs over 200k ) Charity contributions: $12,922 (reported on 13.0% of returns )Here:
$12,922State:
$12,392
(% of AGI for various income ranges: 5.7% for AGIs below $25k , 32.4% for AGIs $25k-50k , 113.8% for AGIs $50k-75k , 204.2% for AGIs $75k-100k , 380.8% for AGIs $100k-200k , 5089.6% for AGIs over 200k ) Taxes paid: $8,088 (reported on 15.0% of returns )(% of AGI for various income ranges: 11.4% for AGIs below $25k , 39.9% for AGIs $25k-50k , 139.0% for AGIs $50k-75k , 313.8% for AGIs $75k-100k , 506.5% for AGIs $100k-200k , 1806.8% for AGIs over 200k ) Earned income credit: $1,857 (reported on 12.6% of returns )(% of AGI for various income ranges: 75.2% for AGIs below $25k , 49.6% for AGIs $25k-50k ) Percentage of individuals using paid preparers for their 2020 taxes: 90.3%(% for various income ranges: 89.6% for AGIs below $25k , 91.2% for AGIs $25k-50k , 88.8% for AGIs $50k-75k , 89.9% for AGIs $75k-100k , 90.0% for AGIs $100k-200k , 94.2% for AGIs over 200k )
Averages for the 2012 tax year for zip code 19119, filed in 2013:
Average Adjusted Gross Income (AGI) in 2012: $69,645 (Individual Income Tax Returns) Here:
$69,645State:
$61,346
Salary/wage: $60,410 (reported on 81.0% of returns )Here:
$60,410State:
$51,902
(% of AGI for various income ranges: 67.1% for AGIs below $25k , 77.2% for AGIs $25k-50k , 75.5% for AGIs $50k-75k , 72.0% for AGIs $75k-100k , 73.7% for AGIs $100k-200k , 62.9% for AGIs over 200k ) Taxable interest for individuals: $1,005 (reported on 32.7% of returns )This zip code:
$1,005Pennsylvania:
$1,588
(% of AGI for various income ranges: 0.6% for AGIs below $25k , 0.4% for AGIs $25k-50k , 0.4% for AGIs $50k-75k , 0.5% for AGIs $75k-100k , 0.5% for AGIs $100k-200k , 0.5% for AGIs over 200k ) Ordinary dividends: $6,991 (reported on 21.6% of returns )(% of AGI for various income ranges: 1.6% for AGIs below $25k , 1.0% for AGIs $25k-50k , 1.2% for AGIs $50k-75k , 1.5% for AGIs $75k-100k , 2.0% for AGIs $100k-200k , 3.5% for AGIs over 200k ) Net capital gain/loss in AGI: +$16,667 (reported on 16.3% of returns )Here:
+$16,667State:
+$14,495
(% of AGI for various income ranges: 0.4% for AGIs below $25k , 0.2% for AGIs $25k-50k , 0.3% for AGIs $50k-75k , 0.7% for AGIs $75k-100k , 1.5% for AGIs $100k-200k , 10.4% for AGIs over 200k ) Profit/loss from business: +$16,342 (reported on 17.4% of returns )Here:
+$16,342State:
+$16,268
(% of AGI for various income ranges: 8.4% for AGIs below $25k , 3.2% for AGIs $25k-50k , 2.1% for AGIs $50k-75k , 4.2% for AGIs $75k-100k , 4.1% for AGIs $100k-200k , 4.5% for AGIs over 200k ) Taxable individual retirement arrangement distribution: $19,820 (reported on 9.9% of returns )19119:
$19,820Pennsylvania:
$14,550
(% of AGI for various income ranges: 1.9% for AGIs below $25k , 1.8% for AGIs $25k-50k , 2.0% for AGIs $50k-75k , 3.0% for AGIs $75k-100k , 3.2% for AGIs $100k-200k , 3.4% for AGIs over 200k ) Self-employment retirement plans: $22,742 (reported on 1.5% of returns )19119:
$22,742Pennsylvania:
$20,922
(% of AGI for various income ranges: 0.3% for AGIs $25k-50k , 0.3% for AGIs $100k-200k , 1.1% for AGIs over 200k ) Total itemized deductions: $25,264 (21% of AGI, reported on 43.1% of returns )Here:
$25,264State:
$23,538
Here:
20.5% of AGIState:
18.4% of AGI
(% of AGI for various income ranges: 10.0% for AGIs below $25k , 13.8% for AGIs $25k-50k , 17.2% for AGIs $50k-75k , 18.2% for AGIs $75k-100k , 18.3% for AGIs $100k-200k , 14.0% for AGIs over 200k ) Charity contributions: $5,114 (reported on 37.2% of returns )(% of AGI for various income ranges: 1.2% for AGIs below $25k , 2.2% for AGIs $25k-50k , 2.8% for AGIs $50k-75k , 2.9% for AGIs $75k-100k , 2.7% for AGIs $100k-200k , 3.2% for AGIs over 200k ) Taxes paid: $10,871 (reported on 42.9% of returns )19119:
$10,871State:
$9,982
(% of AGI for various income ranges: 2.2% for AGIs below $25k , 3.9% for AGIs $25k-50k , 6.1% for AGIs $50k-75k , 7.2% for AGIs $75k-100k , 8.2% for AGIs $100k-200k , 7.6% for AGIs over 200k ) Earned income credit: $2,052 (reported on 17.2% of returns )(% of AGI for various income ranges: 6.6% for AGIs below $25k , 0.9% for AGIs $25k-50k ) Percentage of individuals using paid preparers for their 2012 taxes: 47.4%(% for various income ranges: 42.7% for AGIs below $25k , 42.0% for AGIs $25k-50k , 46.9% for AGIs $50k-75k , 50.9% for AGIs $75k-100k , 58.2% for AGIs $100k-200k , 77.0% for AGIs over 200k )
Averages for the 2004 tax year for zip code 19119, filed in 2005:
Average Adjusted Gross Income (AGI) in 2004: $52,060 (Individual Income Tax Returns) Here:
$52,060State:
$48,049
Salary/wage: $46,860 (reported on 83.1% of returns )Here:
$46,860State:
$42,646
(% of AGI for various income ranges: 110.5% for AGIs below $10k , 73.8% for AGIs $10k-25k , 82.8% for AGIs $25k-50k , 80.8% for AGIs $50k-75k , 80.5% for AGIs $75k-100k , 66.7% for AGIs over 100k ) Taxable interest for individuals: $1,354 (reported on 41.2% of returns )This zip code:
$1,354Pennsylvania:
$1,657
(% of AGI for various income ranges: 4.5% for AGIs below $10k , 1.3% for AGIs $10k-25k , 0.9% for AGIs $25k-50k , 0.9% for AGIs $50k-75k , 1.0% for AGIs $75k-100k , 1.1% for AGIs over 100k ) Taxable dividends: $4,334 (reported on 24.1% of returns )(% of AGI for various income ranges: 8.1% for AGIs below $10k , 1.0% for AGIs $10k-25k , 0.8% for AGIs $25k-50k , 1.0% for AGIs $50k-75k , 1.3% for AGIs $75k-100k , 3.2% for AGIs over 100k ) Net capital gain/loss: +$13,340 (reported on 17.8% of returns )Here:
+$13,340State:
+$9,716
(% of AGI for various income ranges: 1.0% for AGIs below $10k , 0.4% for AGIs $10k-25k , 0.3% for AGIs $25k-50k , 0.9% for AGIs $50k-75k , 1.3% for AGIs $75k-100k , 9.5% for AGIs over 100k ) Profit/loss from business: +$13,140 (reported on 14.9% of returns )Here:
+$13,140State:
+$14,267
(% of AGI for various income ranges: 12.4% for AGIs below $10k , 4.7% for AGIs $10k-25k , 2.2% for AGIs $25k-50k , 1.8% for AGIs $50k-75k , 2.8% for AGIs $75k-100k , 5.1% for AGIs over 100k ) IRA payment deduction: $2,434 (reported on 2.1% of returns )19119:
$2,434Pennsylvania:
$2,903
(% of AGI for various income ranges: 0.3% for AGIs below $10k , 0.2% for AGIs $10k-25k , 0.2% for AGIs $25k-50k , 0.1% for AGIs $50k-75k , 0.1% for AGIs $75k-100k , 0.1% for AGIs over 100k ) Self-employed pension: $15,801 (reported on 2.0% of returns )Here:
$15,801Pennsylvania:
$14,674
(% of AGI for various income ranges: 0.2% for AGIs $10k-25k , 0.1% for AGIs $25k-50k , 0.1% for AGIs $50k-75k , 0.2% for AGIs $75k-100k , 1.2% for AGIs over 100k ) Total itemized deductions: $20,238 (23% of AGI, reported on 44.3% of returns )Here:
$20,238State:
$18,804
Here:
22.8% of AGIState:
19.5% of AGI
(% of AGI for various income ranges: 20.4% for AGIs below $10k , 12.2% for AGIs $10k-25k , 15.4% for AGIs $25k-50k , 20.1% for AGIs $50k-75k , 20.4% for AGIs $75k-100k , 16.8% for AGIs over 100k ) Charity contributions deductions: $4,495 (5% of AGI, reported on 41.0% of returns )Here:
4.9% of AGIState:
3.3% of AGI
(% of AGI for various income ranges: 1.4% for AGIs below $10k , 2.0% for AGIs $10k-25k , 3.1% for AGIs $25k-50k , 4.1% for AGIs $50k-75k , 3.8% for AGIs $75k-100k , 3.8% for AGIs over 100k ) Total tax: $8,912 (reported on 76.1% of returns )(% of AGI for various income ranges: 3.9% for AGIs below $10k , 4.0% for AGIs $10k-25k , 7.2% for AGIs $25k-50k , 10.1% for AGIs $50k-75k , 11.0% for AGIs $75k-100k , 18.9% for AGIs over 100k ) Earned income credit: $1,634 (reported on 15.7% of returns )Percentage of individuals using paid preparers for their 2004 taxes: 53.2%(% for various income ranges: 50.0% for AGIs below $10k , 54.2% for AGIs $10k-25k , 50.7% for AGIs $25k-50k , 51.6% for AGIs $50k-75k , 53.6% for AGIs $75k-100k , 64.8% for AGIs over 100k )
Estimated median household income in 2022: This zip code:
$79,009Pennsylvania:
$71,798
Nearest zip codes: 19144 ,
19150 ,
19118 ,
19138 ,
19128 ,
19129 .
Philadelphia Zip Code Map
Percentage of family households: This zip code:
39.3%Pennsylvania:
42.6%
Percentage of households with unmarried partners: This zip code:
4.2%Pennsylvania:
46.5%
Likely homosexual households (counted as self-reported same-sex unmarried-partner households)
Lesbian couples: 0.5% of all households Gay men: 0.3% of all households
Household received Food Stamps/SNAP in the past 12 months: 1,988Household did not receive Food Stamps/SNAP in the past 12 months: 11,155
Women who had a birth in the past 12 months: 342 (258 now married , 86 unmarried) Women who did not have a birth in the past 12 months: 6,592 (2,350 now married , 4,250 unmarried)
Housing units in zip code 19119 with a mortgage: 5,556 (512
second mortgage , 17
home equity loan , 474
both second mortgage and home equity loan )
Houses without a mortgage: 250
Median monthly owner costs for units with a mortgage: $1,757
Median monthly owner costs for units without a mortgage: $727
Residents with income below the poverty level in 2022:
This zip code:
9.4%Whole state:
11.8%
Residents with income below 50% of the poverty level in 2022:
This zip code:
3.7%Whole state:
6.1%
Median number of rooms in houses and condos: Median number of rooms in apartments: Notable locations in this zip code not listed on our city pages
Click to draw/clear zip code borders Notable locations in zip code 19119: (A) , Carpenter Station (B) , Allen Lane Station (C) , Sedgwick Station (D) , Upsal Station (E) , Philadelphia Fire Department Engine 9 (F) , Sacred Heart Home (G) , Lutheran Orphans Home (H) , Lovett Memorial Library (I) . Display/hide their locations on the map
Lake: (A) . Display/hide its location on the map
Creek: (A) . Display/hide its location on the map
Parks in zip code 19119 include: (1) , Carpenter Woods (2) , Mount Airy Playground (3) , Carpenter Park (4) , Cliveden Park (5) . Display/hide their locations on the map
Year house built (houses)
0 2020 or later245 2010 to 2019482 2000 to 2009195 1990 to 1999104 1980 to 1989584 1970 to 1979837 1960 to 19691,817 1950 to 19591,965 1940 to 19497,479 1939 or earlier
Zip code 19119 household income distribution in 2022 714 Less than $10,000503 $10,000 to $14,999394 $15,000 to $19,999428 $20,000 to $24,999453 $25,000 to $29,999279 $30,000 to $34,999413 $35,000 to $39,999497 $40,000 to $44,999467 $45,000 to $49,999790 $50,000 to $59,9991,305 $60,000 to $74,9991,991 $75,000 to $99,9991,147 $100,000 to $124,999710 $125,000 to $149,9991,250 $150,000 to $199,9991,774 $200,000 or moreEstimate of home value of owner-occupied houses/condos in 2022 in zip code 19119 40 Less than $10,00021 $10,000 to $14,99912 $15,000 to $19,99954 $25,000 to $29,99938 $30,000 to $34,99919 $40,000 to $49,99918 $50,000 to $59,99941 $60,000 to $69,99911 $70,000 to $79,99928 $80,000 to $89,99917 $90,000 to $99,999476 $100,000 to $124,999245 $125,000 to $149,999238 $150,000 to $174,999295 $175,000 to $199,9991,058 $200,000 to $249,999969 $250,000 to $299,9991,999 $300,000 to $399,9991,375 $400,000 to $499,9991,156 $500,000 to $749,999440 $750,000 to $999,999249 $1,000,000 to $1,499,99951 $1,500,000 to $1,999,99935 $2,000,000 or moreRent paid by renters in 2022 in zip code 19119 31 Less than $10055 $150 to $19954 $200 to $24962 $250 to $299101 $300 to $34940 $350 to $39940 $450 to $499100 $500 to $54981 $650 to $699114 $700 to $749140 $750 to $799266 $800 to $899689 $900 to $9991,001 $1,000 to $1,249990 $1,250 to $1,499492 $1,500 to $1,99992 $2,000 to $2,49944 $3,000 to $3,499238 No cash rent
Median gross rent in 2022: $1,223.
Median price asked for vacant for-sale houses and condos in 2022: $359,388.
Estimated median house (or condo) value in 2022 for: White Non-Hispanic householders: $519,656Black or African American householders: $306,353American Indian or Alaska Native householders: $402,626Asian householders: $477,067Some other race householders: $353,595Two or more races householders: $453,446Hispanic or Latino householders: $336,058Estimated median house or condo value in 2022: $350,017
19119:
$350,017Pennsylvania:
$245,500
Lower value quartile - upper value quartile: $238,383 - $491,869
Mean price in 2022: Detached houses: $736,907Here:
$736,907State:
$317,202
Townhouses or other attached units: $372,963Here:
$372,963State:
$254,369
In 2-unit structures: $802,442Here:
$802,442State:
$249,182
In 3-to-4-unit structures: $320,511Here:
$320,511State:
$297,446
In 5-or-more-unit structures: $101,194Here:
$101,194State:
$320,068
Housing units in structures:
One, detached: 2,282One, attached: 7,102Two: 3973 or 4: 1,0495 to 9: 51210 to 19: 38520 to 49: 1,27950 or more: 1,001Mobile homes: 20Unemployment : 5.4%
Means of transportation to work in zip code 19119 49.5% 7,040 Drove a car alone4.3% 609 Carpooled6.5% 923 Bus or trolley bus1.9% 266 Streetcar or trolley car6.0% 853 Subway or elevated0.8% 109 Railroad0.9% 121 Taxi0.0% 5 Motorcycle0.9% 123 Bicycle1.2% 173 Walked0.8% 117 Other means26.9% 3,819 Worked at homeTravel time to work (commute) in zip code 19119 129 Less than 5 minutes244 5 to 9 minutes561 10 to 14 minutes901 15 to 19 minutes1,221 20 to 24 minutes1,092 25 to 29 minutes2,187 30 to 34 minutes470 35 to 39 minutes932 40 to 44 minutes1,415 45 to 59 minutes1,240 60 to 89 minutes419 90 or more minutes
Neighborhoods in zip code 19119: Percentage of zip code residents living and working in this county: 78.9%
Household type by relationship:
Households: 29,040
Male householders: 5,175 (1,555 living alone ), Female householders: 7,995 (3,600 living alone )4,641 spouses (4,441 opposite-sex spouses ), 834 unmarried partners , (796 opposite-sex unmarried partners ), 7,289 children (6,741 natural , 264 adopted , 280 stepchildren ), 921 grandchildren , 209 brothers or sisters , 414 parents , 28 foster children , 316 other relatives , 415 non-relatives In group quarters: 910 (-1 institutionalized population )
Size of family households: 3,412 2-persons , 1,939 3-persons , 1,325 4-persons , 441 5-persons , 245 6-persons , 23 7-or-more-persons
Size of nonfamily households: 5,154 1-person , 532 2-persons , 28 3-persons , 24 5-persons
2,934 married couples with children. single-parent households (848 men , 1,113 women ).
92.1% of residents of 19119 zip code speak English at home. of residents speak Spanish at home (73% very well, 17% well, 8% not well, 2% not at all ).of residents speak other Indo-European language at home (83% very well, 15% well, 2% not well ).of residents speak Asian or Pacific Island language at home (65% very well, 5% well, 22% not well, 8% not at all ).of residents speak other language at home (96% very well, 2% well, 2% not well ).
Foreign born population: 1,478 (5.1%)
(79.9%
of them are naturalized citizens )
This zip code:
5.1%Whole state:
7.5%
13% Haiti 8% Sweden 7% United Kingdom, excluding England and Scotland 6% Eritrea 6% France 6% Ivory Coast 6% Cuba 3% English 3% Irish 2% German 2% Jamaican 2% Italian 1% African 1% European
Year of entry for the foreign-born population
368 2010 or later 375 2000 to 2009 431 1990 to 1999 617 Before 1990
There are
149 Medical Specialists in Zip Code 19119 .
Facilities with environmental interests located in this zip code:
AMY NORTHWEST MIDDLE SCHOOL (7500 GERMANTOWN AVE in PHILADELPHIA, PA)
(National Center for Education Statistics) - STATE ID-7024 Organizations: PHILADELPHIA CITY SD (SCHOOL DISTRICT)
Housing units lacking complete plumbing facilities: 2.6%
Housing units lacking complete kitchen facilities: 2.6%
79.1% Utility gas 13.7% Electricity 4.6% Fuel oil, kerosene, etc. 1.3% Bottled, tank, or LP gas 0.7% No fuel used
Population in 1990: 29,935.
Place of birth for U.S.-born residents:
This state: 18,866Northeast: 3,402Midwest: 980South: 2,929West: 1,073
63% of the 19119 zip code residents lived in the same house 5 years ago.
Out of people who lived in different houses, 75% lived in this county.
Out of people who lived in different counties, 50% lived in Pennsylvania.
91% of the 19119 zip code residents lived in the same house 1 year ago.
Out of people who lived in different houses, 56% moved from this county.
Out of people who lived in different houses, 13% moved from different county within same state.
Out of people who lived in different houses, 27% moved from different state.
Out of people who lived in different houses, 5% moved from abroad.
Private vs. public school enrollment:
Students in private schools in grades 1 to 8 (elementary and middle school): 1,003
Here:
44.9%Pennsylvania:
15.7%
Students in private schools in grades 9 to 12 (high school): 543
Here:
37.6%Pennsylvania:
13.4%
Students in private undergraduate colleges: 514
Here:
55.0%Pennsylvania:
39.8%
Occupation by median earnings in the past 12 months ($)
112,278 Law enforcement workers including supervisors 103,081 Legal occupations 101,426 Health diagnosing and treating practitioners and other technical occupations 98,036 Management occupations 82,749 Life, physical, and social science occupations 81,881 Business and financial operations occupations
Companies with federal contracts located in this zip code:
LAWSONS ENTERPRISES INC (7500 GERMANTOWN AVE in PHILADELPHIA, PA; small business) in 8 contracts from 1999 to 2001
Contracts for Maintenance, Repair or Alteration of Real Property -- Highways, Roads, Streets, Bridges, and Railways (includes resurfacing), Maintenance, Repair or Alteration of Real Property -- Hospitals and Infirmaries, Maintenance, Repair or Alteration of Real Property -- Other Hospital Buildings, Construction of Structures and Facilities -- Miscellaneous Buildings by Bureau of Prisoners/Federal Prison System, Department of Veterans Affairs, Defense Logistics Agency, Navy, and others Signed by year: 2000: $263,289; 2001: $17,500; 2002: $0; 2003: $0; 2004: $0; 2005: $0; 2006: $0.
Biggest contracts: with Bureau of Prisoners/Federal Prison System for Maintenance, Repair or Alteration of Real Property -- Highways, Roads, Streets, Bridges, and Railways (includes resurfacing). Signed on 2000-11-15. Completion date: 2001-03-15.
with Department of Veterans Affairs for Maintenance, Repair or Alteration of Real Property -- Hospitals and Infirmaries. Signed on 2000-08-15. Completion date: 2001-04-15.
with Defense Logistics Agency for Maintenance, Repair or Alteration of Real Property -- Highways, Roads, Streets, Bridges, and Railways (includes resurfacing). Signed on 2000-04-04. Completion date: 2000-04-29.
with Department of Veterans Affairs for Maintenance, Repair or Alteration of Real Property -- Other Hospital Buildings. Signed on 1999-12-15. Completion date: 2000-04-15.
Top industries in this zip code by the number of employees in 2005:
Health Care and Social Assistance: Nursing Care Facilities (250-499 employees: 1 establishment, 100-249 employees: 2 establishments, 50-99 employees: 1 establishment, 5-9 employees: 1 establishment)Health Care and Social Assistance: Outpatient Mental Health and Substance Abuse Centers (500-999: 1)Other Services (except Public Administration): Religious Organizations (50-99: 1, 20-49: 4, 10-19: 1, 5-9: 6, 1-4: 7)Educational Services: Elementary and Secondary Schools (50-99: 1, 20-49: 3, 10-19: 1, 5-9: 1, 1-4: 1)Management of Companies and Enterprises: Corporate, Subsidiary, and Regional Managing Offices (100-249: 1, 5-9: 1)Accommodation and Food Services: Full-Service Restaurants (50-99: 1, 20-49: 1, 10-19: 1, 5-9: 1, 1-4: 9)Health Care and Social Assistance: Child Day Care Services (20-49: 2, 10-19: 2, 5-9: 2, 1-4: 6)Health Care and Social Assistance: Offices of Physicians (except Mental Health Specialists) (20-49: 2, 10-19: 2, 5-9: 1, 1-4: 7)Health Care and Social Assistance: Other Individual and Family Services (20-49: 2, 10-19: 1, 1-4: 6)
People in group quarters in 2010:
433 people in nursing facilities/skilled-nursing facilities
66 people in college/university student housing
50 people in group homes intended for adults
48 people in other noninstitutional facilities
45 people in residential treatment centers for adults
25 people in group homes for juveniles (non-correctional)
24 people in emergency and transitional shelters (with sleeping facilities) for people experiencing homelessness
3 people in residential treatment centers for juveniles (non-correctional)
People in group quarters in 2000:
325 people in nursing homes
294 people in other group homes
191 people in homes for the mentally ill
159 people in homes for the mentally retarded
93 people in college dormitories (includes college quarters off campus)
54 people in homes or halfway houses for drug/alcohol abuse
52 people in other noninstitutional group quarters
41 people in homes for abused, dependent, and neglected children
35 people in homes for the physically handicapped
28 people in religious group quarters
12 people in other nonhousehold living situations
Fatal accident statistics in 2014:
Fatal accident count: 3Vehicles involved in fatal accidents: 4Fatal accidents caused by drunken drivers: 0Fatalities: 3Persons involved in fatal accidents: 6Pedestrians involved in fatal accidents: 1
Fatal accident statistics in 2012:
Fatal accident count: 1Vehicles involved in fatal accidents: 1Fatal accidents caused by drunken drivers: 0Fatalities: 1Persons involved in fatal accidents: 1Pedestrians involved in fatal accidents: 1
Home Mortgage Disclosure Act Aggregated Statistics For Year 2009(Based on 13 full and 12 partial tracts) A) FHA, FSA/RHS & VA B) Conventional C) Refinancings D) Home Improvement Loans E) Loans on Dwellings For 5+ Families F) Non-occupant Loans on Number Average Value Number Average Value Number Average Value Number Average Value Number Average Value Number Average Value
LOANS ORIGINATED 160 $215,452 226 $242,137 1,051 $209,349 138 $72,822 3 $486,800 76 $168,991 APPLICATIONS APPROVED, NOT ACCEPTED 4 $219,822 11 $191,798 82 $168,908 24 $37,942 0 $0 8 $81,176 APPLICATIONS DENIED 29 $164,552 55 $177,803 470 $180,481 190 $37,543 0 $0 47 $111,371 APPLICATIONS WITHDRAWN 24 $206,681 36 $254,536 281 $191,378 24 $60,909 0 $0 18 $164,067 FILES CLOSED FOR INCOMPLETENESS 0 $0 17 $143,862 70 $230,668 2 $47,500 0 $0 2 $162,275
Aggregated Statistics For Year 2008(Based on 13 full and 12 partial tracts) A) FHA, FSA/RHS & VA B) Conventional C) Refinancings D) Home Improvement Loans E) Loans on Dwellings For 5+ Families F) Non-occupant Loans on G) Loans On Manufactured Number Average Value Number Average Value Number Average Value Number Average Value Number Average Value Number Average Value Number Average Value
LOANS ORIGINATED 128 $189,936 366 $230,530 740 $161,299 212 $44,400 4 $3,060,765 104 $137,585 0 $0 APPLICATIONS APPROVED, NOT ACCEPTED 4 $137,068 39 $223,707 155 $164,253 54 $58,626 0 $0 17 $200,339 2 $99,050 APPLICATIONS DENIED 13 $157,955 81 $201,704 605 $168,419 262 $47,712 1 $205,900 94 $148,163 0 $0 APPLICATIONS WITHDRAWN 13 $157,430 67 $219,434 191 $192,206 23 $88,161 0 $0 25 $137,298 0 $0 FILES CLOSED FOR INCOMPLETENESS 1 $184,110 11 $205,459 68 $165,901 10 $41,263 0 $0 6 $167,440 0 $0
Aggregated Statistics For Year 2007(Based on 13 full and 12 partial tracts) A) FHA, FSA/RHS & VA B) Conventional C) Refinancings D) Home Improvement Loans E) Loans on Dwellings For 5+ Families F) Non-occupant Loans on G) Loans On Manufactured Number Average Value Number Average Value Number Average Value Number Average Value Number Average Value Number Average Value Number Average Value
LOANS ORIGINATED 37 $158,040 640 $189,138 907 $156,506 327 $76,150 21 $1,321,641 182 $144,265 2 $109,450 APPLICATIONS APPROVED, NOT ACCEPTED 3 $215,153 95 $183,252 240 $150,224 80 $56,128 2 $762,940 38 $121,798 2 $69,935 APPLICATIONS DENIED 7 $130,450 172 $186,318 839 $176,511 347 $52,689 6 $481,303 160 $128,657 4 $66,475 APPLICATIONS WITHDRAWN 7 $170,660 92 $189,170 348 $161,562 27 $75,883 1 $1,743,040 32 $105,405 4 $59,592 FILES CLOSED FOR INCOMPLETENESS 0 $0 22 $229,428 119 $170,379 9 $170,881 0 $0 9 $147,486 0 $0
Aggregated Statistics For Year 2006(Based on 13 full and 12 partial tracts) A) FHA, FSA/RHS & VA B) Conventional C) Refinancings D) Home Improvement Loans E) Loans on Dwellings For 5+ Families F) Non-occupant Loans on G) Loans On Manufactured Number Average Value Number Average Value Number Average Value Number Average Value Number Average Value Number Average Value Number Average Value
LOANS ORIGINATED 33 $162,399 807 $164,152 1,204 $151,202 390 $57,437 7 $3,284,303 226 $122,020 2 $10,525 APPLICATIONS APPROVED, NOT ACCEPTED 1 $209,160 76 $144,033 298 $147,049 67 $54,190 4 $2,101,838 43 $100,777 0 $0 APPLICATIONS DENIED 5 $182,710 204 $132,204 912 $151,740 353 $41,317 8 $281,574 109 $113,897 0 $0 APPLICATIONS WITHDRAWN 2 $134,165 143 $166,529 546 $148,124 49 $79,591 2 $358,020 64 $126,379 2 $82,740 FILES CLOSED FOR INCOMPLETENESS 1 $64,000 34 $120,416 169 $142,776 16 $49,978 0 $0 8 $101,670 2 $48,730
Aggregated Statistics For Year 2005(Based on 13 full and 12 partial tracts) A) FHA, FSA/RHS & VA B) Conventional C) Refinancings D) Home Improvement Loans E) Loans on Dwellings For 5+ Families F) Non-occupant Loans on G) Loans On Manufactured Number Average Value Number Average Value Number Average Value Number Average Value Number Average Value Number Average Value Number Average Value
LOANS ORIGINATED 14 $150,823 822 $163,650 1,327 $140,407 322 $47,322 22 $2,757,527 219 $124,612 0 $0 APPLICATIONS APPROVED, NOT ACCEPTED 7 $167,576 121 $164,004 305 $123,122 56 $59,144 0 $0 41 $101,720 0 $0 APPLICATIONS DENIED 5 $109,774 211 $128,118 974 $130,416 337 $46,634 4 $592,925 155 $81,583 3 $128,873 APPLICATIONS WITHDRAWN 3 $117,967 144 $144,914 584 $149,029 88 $133,531 2 $7,945,600 64 $116,324 0 $0 FILES CLOSED FOR INCOMPLETENESS 0 $0 38 $165,611 244 $158,851 6 $196,645 0 $0 22 $125,784 2 $64,380
Aggregated Statistics For Year 2004(Based on 13 full and 12 partial tracts) A) FHA, FSA/RHS & VA B) Conventional C) Refinancings D) Home Improvement Loans E) Loans on Dwellings For 5+ Families F) Non-occupant Loans on G) Loans On Manufactured Number Average Value Number Average Value Number Average Value Number Average Value Number Average Value Number Average Value Number Average Value
LOANS ORIGINATED 32 $101,484 699 $166,470 1,376 $133,686 264 $51,078 19 $1,758,288 205 $106,339 0 $0 APPLICATIONS APPROVED, NOT ACCEPTED 3 $66,417 120 $164,867 325 $118,520 55 $50,474 3 $243,293 44 $92,552 2 $17,680 APPLICATIONS DENIED 2 $80,905 155 $131,157 1,069 $124,228 362 $39,743 1 $312,600 129 $68,959 4 $88,992 APPLICATIONS WITHDRAWN 8 $77,692 128 $169,931 561 $124,921 71 $100,645 1 $124,190 44 $90,118 0 $0 FILES CLOSED FOR INCOMPLETENESS 2 $120,170 22 $112,318 270 $135,580 12 $83,738 0 $0 11 $98,813 1 $20,000
Aggregated Statistics For Year 2003(Based on 13 full and 12 partial tracts) A) FHA, FSA/RHS & VA B) Conventional C) Refinancings D) Home Improvement Loans E) Loans on Dwellings For 5+ Families F) Non-occupant Loans on Number Average Value Number Average Value Number Average Value Number Average Value Number Average Value Number Average Value
LOANS ORIGINATED 69 $110,801 559 $142,588 2,174 $129,251 219 $63,576 12 $1,713,136 205 $82,169 APPLICATIONS APPROVED, NOT ACCEPTED 7 $79,896 75 $122,579 435 $105,068 56 $46,587 0 $0 52 $87,528 APPLICATIONS DENIED 3 $97,223 90 $114,239 1,230 $104,827 286 $39,134 1 $930,350 98 $62,021 APPLICATIONS WITHDRAWN 15 $79,447 65 $129,915 456 $104,752 38 $70,801 4 $2,325,240 28 $74,892 FILES CLOSED FOR INCOMPLETENESS 0 $0 23 $139,910 114 $120,455 13 $66,378 0 $0 11 $70,400
Aggregated Statistics For Year 2002(Based on 13 full and 12 partial tracts) A) FHA, FSA/RHS & VA B) Conventional C) Refinancings D) Home Improvement Loans E) Loans on Dwellings For 5+ Families F) Non-occupant Loans on Number Average Value Number Average Value Number Average Value Number Average Value Number Average Value Number Average Value
LOANS ORIGINATED 107 $100,864 454 $2,086,131 1,241 $658,128 178 $39,801 20 $893,078 107 $1,150,028 APPLICATIONS APPROVED, NOT ACCEPTED 6 $112,978 66 $121,033 366 $88,077 66 $41,307 1 $359,500 24 $72,007 APPLICATIONS DENIED 7 $117,299 92 $97,233 855 $94,075 169 $35,161 0 $0 51 $81,124 APPLICATIONS WITHDRAWN 8 $2,508,202 47 $2,221,646 308 $528,066 10 $41,843 0 $0 25 $114,627 FILES CLOSED FOR INCOMPLETENESS 2 $89,635 22 $118,275 193 $95,073 6 $42,170 0 $0 13 $65,581
Aggregated Statistics For Year 2001(Based on 13 full and 12 partial tracts) A) FHA, FSA/RHS & VA B) Conventional C) Refinancings D) Home Improvement Loans E) Loans on Dwellings For 5+ Families F) Non-occupant Loans on Number Average Value Number Average Value Number Average Value Number Average Value Number Average Value Number Average Value
LOANS ORIGINATED 129 $94,938 352 $127,780 878 $118,395 170 $26,046 11 $861,115 83 $112,287 APPLICATIONS APPROVED, NOT ACCEPTED 11 $71,785 67 $108,482 220 $78,758 47 $29,165 0 $0 23 $91,136 APPLICATIONS DENIED 8 $59,802 73 $95,674 724 $72,200 231 $22,775 1 $262,000 39 $90,637 APPLICATIONS WITHDRAWN 13 $76,955 31 $142,925 305 $86,151 58 $26,598 1 $560,000 20 $67,410 FILES CLOSED FOR INCOMPLETENESS 6 $83,155 5 $70,506 103 $110,323 12 $55,052 0 $0 5 $88,182
Aggregated Statistics For Year 2000(Based on 13 full and 12 partial tracts) A) FHA, FSA/RHS & VA B) Conventional C) Refinancings D) Home Improvement Loans E) Loans on Dwellings For 5+ Families F) Non-occupant Loans on Number Average Value Number Average Value Number Average Value Number Average Value Number Average Value Number Average Value
LOANS ORIGINATED 126 $93,153 402 $130,306 467 $76,775 236 $24,088 9 $1,218,350 86 $77,810 APPLICATIONS APPROVED, NOT ACCEPTED 3 $96,157 68 $105,460 188 $65,853 86 $20,299 0 $0 15 $69,427 APPLICATIONS DENIED 4 $54,758 121 $83,430 606 $66,437 278 $18,815 0 $0 49 $71,935 APPLICATIONS WITHDRAWN 5 $68,220 40 $89,133 319 $64,546 54 $42,087 2 $3,774,160 20 $73,589 FILES CLOSED FOR INCOMPLETENESS 0 $0 17 $90,640 98 $89,245 9 $23,404 0 $0 6 $47,077
Aggregated Statistics For Year 1999(Based on 7 full and 7 partial tracts) A) FHA, FSA/RHS & VA B) Conventional C) Refinancings D) Home Improvement Loans E) Loans on Dwellings For 5+ Families F) Non-occupant Loans on Number Average Value Number Average Value Number Average Value Number Average Value Number Average Value Number Average Value
LOANS ORIGINATED 81 $88,558 209 $116,981 432 $77,310 146 $20,458 2 $247,950 47 $69,068 APPLICATIONS APPROVED, NOT ACCEPTED 2 $58,000 33 $86,600 188 $64,305 55 $19,159 0 $0 16 $76,432 APPLICATIONS DENIED 4 $125,208 50 $71,694 464 $67,410 196 $19,443 0 $0 29 $56,673 APPLICATIONS WITHDRAWN 9 $98,760 45 $89,070 243 $66,091 46 $45,821 2 $600,000 14 $71,116 FILES CLOSED FOR INCOMPLETENESS 0 $0 7 $81,737 78 $66,690 0 $0 0 $0 2 $74,970
Private Mortgage Insurance Companies Aggregated Statistics For Year 2009(Based on 12 full and 10 partial tracts) A) Conventional B) Refinancings C) Non-occupant Loans on Number Average Value Number Average Value Number Average Value
LOANS ORIGINATED 58 $237,207 33 $250,977 0 $0 APPLICATIONS APPROVED, NOT ACCEPTED 24 $153,865 13 $281,435 2 $67,000 APPLICATIONS DENIED 8 $166,090 8 $218,951 0 $0 APPLICATIONS WITHDRAWN 6 $224,550 7 $230,706 0 $0 FILES CLOSED FOR INCOMPLETENESS 2 $222,860 2 $90,665 0 $0
Aggregated Statistics For Year 2008(Based on 13 full and 12 partial tracts) A) Conventional B) Refinancings C) Non-occupant Loans on Number Average Value Number Average Value Number Average Value
LOANS ORIGINATED 145 $223,356 41 $232,290 11 $206,624 APPLICATIONS APPROVED, NOT ACCEPTED 41 $185,562 17 $294,404 13 $147,868 APPLICATIONS DENIED 8 $143,532 3 $106,387 5 $131,450 APPLICATIONS WITHDRAWN 3 $170,610 0 $0 0 $0 FILES CLOSED FOR INCOMPLETENESS 5 $155,354 0 $0 1 $94,490
Aggregated Statistics For Year 2007(Based on 13 full and 10 partial tracts) A) Conventional B) Refinancings C) Non-occupant Loans on Number Average Value Number Average Value Number Average Value
LOANS ORIGINATED 182 $181,128 43 $215,398 19 $139,548 APPLICATIONS APPROVED, NOT ACCEPTED 35 $174,890 15 $194,812 7 $144,054 APPLICATIONS DENIED 10 $95,640 2 $492,280 8 $97,076 APPLICATIONS WITHDRAWN 11 $233,810 4 $180,012 2 $48,500 FILES CLOSED FOR INCOMPLETENESS 0 $0 2 $89,390 0 $0
Aggregated Statistics For Year 2006(Based on 13 full and 12 partial tracts) A) Conventional B) Refinancings C) Non-occupant Loans on Number Average Value Number Average Value Number Average Value
LOANS ORIGINATED 123 $176,448 25 $196,224 9 $103,763 APPLICATIONS APPROVED, NOT ACCEPTED 23 $171,617 6 $213,347 2 $76,305 APPLICATIONS DENIED 3 $179,577 1 $98,050 1 $53,170 APPLICATIONS WITHDRAWN 3 $215,463 3 $151,440 1 $227,680 FILES CLOSED FOR INCOMPLETENESS 0 $0 2 $127,130 0 $0
Aggregated Statistics For Year 2005(Based on 12 full and 10 partial tracts) A) Conventional B) Refinancings C) Non-occupant Loans on Number Average Value Number Average Value Number Average Value
LOANS ORIGINATED 186 $148,766 32 $162,110 36 $131,298 APPLICATIONS APPROVED, NOT ACCEPTED 32 $145,580 16 $145,605 7 $63,164 APPLICATIONS DENIED 3 $221,017 2 $161,080 1 $80,000 APPLICATIONS WITHDRAWN 15 $94,161 6 $110,207 5 $110,384 FILES CLOSED FOR INCOMPLETENESS 3 $113,893 0 $0 2 $120,840
Aggregated Statistics For Year 2004(Based on 12 full and 12 partial tracts) A) Conventional B) Refinancings C) Non-occupant Loans on Number Average Value Number Average Value Number Average Value
LOANS ORIGINATED 171 $137,745 27 $125,354 28 $95,745 APPLICATIONS APPROVED, NOT ACCEPTED 20 $131,808 20 $140,256 2 $81,815 APPLICATIONS DENIED 0 $0 2 $165,865 0 $0 APPLICATIONS WITHDRAWN 15 $107,263 6 $119,063 2 $124,000 FILES CLOSED FOR INCOMPLETENESS 2 $420,140 0 $0 0 $0
Aggregated Statistics For Year 2003(Based on 13 full and 10 partial tracts) A) Conventional B) Refinancings C) Non-occupant Loans on Number Average Value Number Average Value Number Average Value
LOANS ORIGINATED 199 $131,353 88 $129,442 27 $85,982 APPLICATIONS APPROVED, NOT ACCEPTED 35 $160,330 21 $152,150 2 $66,460 APPLICATIONS DENIED 2 $53,635 6 $147,818 2 $53,635 APPLICATIONS WITHDRAWN 3 $188,620 8 $147,860 0 $0 FILES CLOSED FOR INCOMPLETENESS 0 $0 0 $0 0 $0
Aggregated Statistics For Year 2002(Based on 13 full and 10 partial tracts) A) Conventional B) Refinancings C) Non-occupant Loans on Number Average Value Number Average Value Number Average Value
LOANS ORIGINATED 188 $124,948 43 $144,422 15 $95,064 APPLICATIONS APPROVED, NOT ACCEPTED 27 $140,666 53 $158,222 5 $69,116 APPLICATIONS DENIED 5 $101,844 2 $92,675 2 $47,175 APPLICATIONS WITHDRAWN 16 $122,312 6 $128,760 4 $99,040 FILES CLOSED FOR INCOMPLETENESS 4 $221,518 0 $0 0 $0
Aggregated Statistics For Year 2001(Based on 13 full and 10 partial tracts) A) Conventional B) Refinancings C) Non-occupant Loans on Number Average Value Number Average Value Number Average Value
LOANS ORIGINATED 162 $115,708 49 $124,964 10 $72,889 APPLICATIONS APPROVED, NOT ACCEPTED 36 $97,376 11 $135,539 10 $85,751 APPLICATIONS DENIED 8 $113,001 5 $87,450 1 $36,000 APPLICATIONS WITHDRAWN 0 $0 0 $0 0 $0 FILES CLOSED FOR INCOMPLETENESS 3 $79,167 0 $0 0 $0
Aggregated Statistics For Year 2000(Based on 13 full and 10 partial tracts) A) Conventional B) Refinancings C) Non-occupant Loans on Number Average Value Number Average Value Number Average Value
LOANS ORIGINATED 141 $117,395 24 $103,982 2 $40,355 APPLICATIONS APPROVED, NOT ACCEPTED 11 $82,174 5 $110,508 2 $35,000 APPLICATIONS DENIED 10 $94,082 3 $94,320 6 $93,897 APPLICATIONS WITHDRAWN 3 $119,717 0 $0 0 $0 FILES CLOSED FOR INCOMPLETENESS 1 $64,680 0 $0 0 $0
Aggregated Statistics For Year 1999(Based on 7 full and 6 partial tracts) A) Conventional B) Refinancings C) Non-occupant Loans on Number Average Value Number Average Value Number Average Value
LOANS ORIGINATED 84 $119,374 24 $82,831 4 $72,160 APPLICATIONS APPROVED, NOT ACCEPTED 11 $112,826 3 $68,810 1 $43,890 APPLICATIONS DENIED 8 $103,408 2 $175,820 3 $82,980 APPLICATIONS WITHDRAWN 2 $153,040 1 $255,000 1 $158,000 FILES CLOSED FOR INCOMPLETENESS 0 $0 0 $0 0 $0
2010 - 2018 National Fire Incident Reporting System (NFIRS) incidents See full 2006 National Fire Incident Reporting System statistics for zip code 19119, Pennsylvania
Most common first names in zip code 19119 among deceased individuals Name Count Lived (average)
Mary 409 82.7 years William 351 76.6 years John 299 76.3 years James 267 73.6 years Margaret 215 81.9 years Anna 214 84.8 years Elizabeth 208 81.3 years Helen 170 81.9 years George 165 74.1 years Robert 164 72.7 years
Most common last names in zip code 19119 among deceased individuals Last name Count Lived (average)
Johnson 160 75.9 years Smith 155 77.8 years Brown 144 76.4 years Williams 133 74.3 years Jones 127 76.0 years Harris 81 73.9 years Robinson 72 78.5 years Davis 70 77.0 years Jackson 68 75.1 years Wilson 57 76.2 years
Businesses in zip code 19119
CVS: 1H&R Block: 1UPS: 2
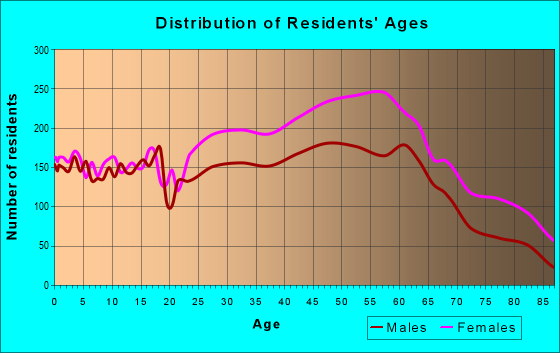
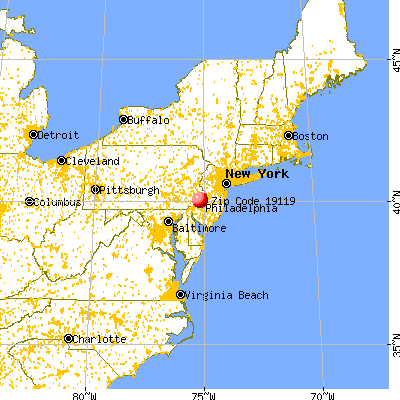


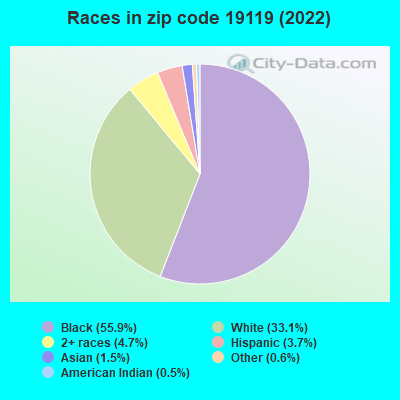


 Nearest zip codes: 19144, 19150, 19118, 19138, 19128, 19129.
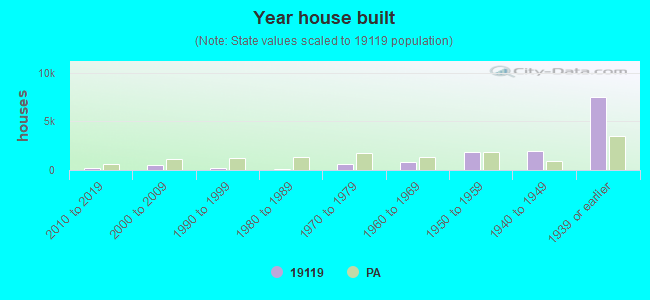

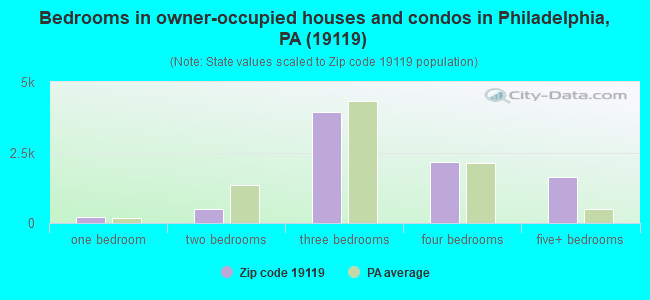
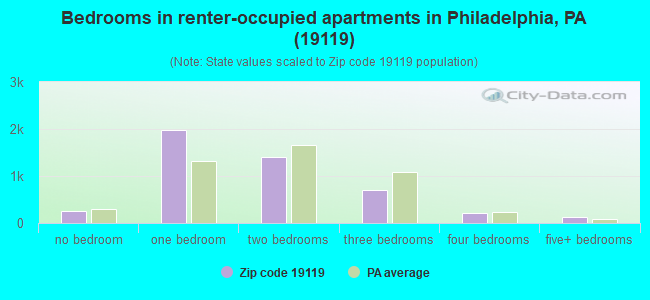
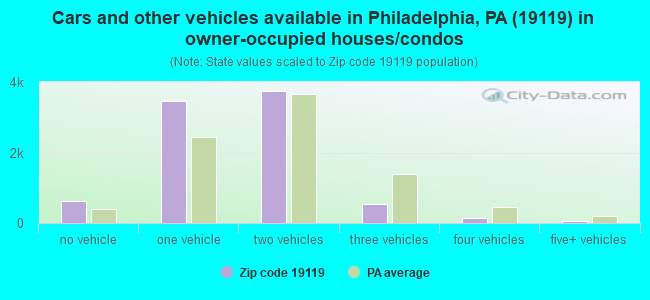
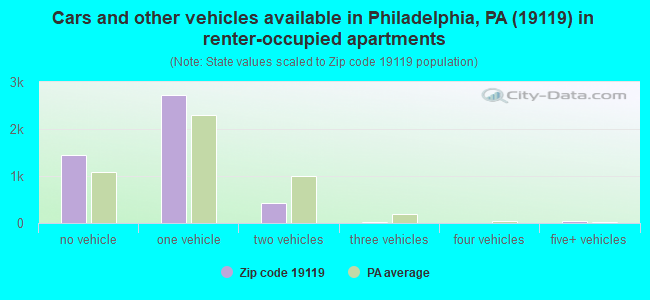


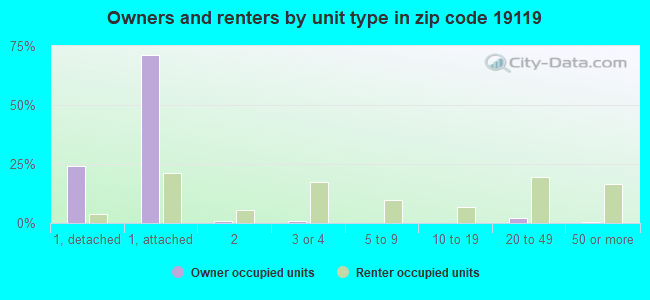


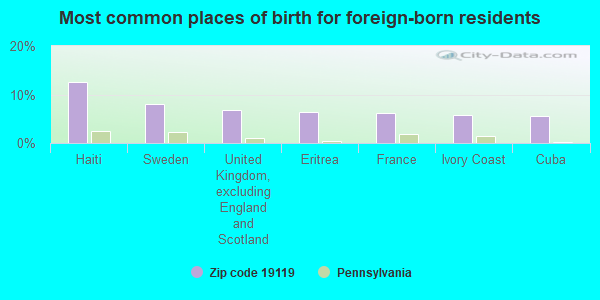
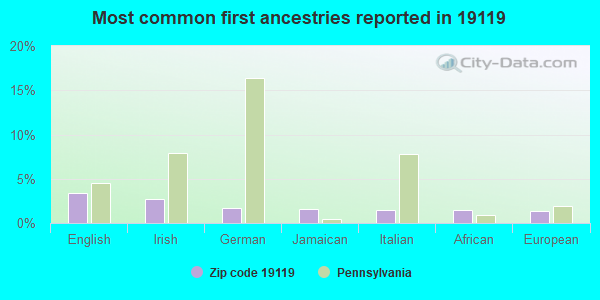
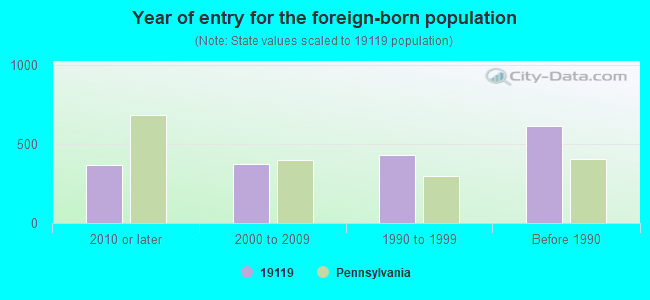


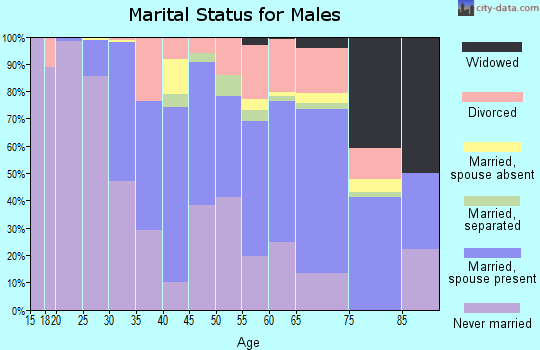
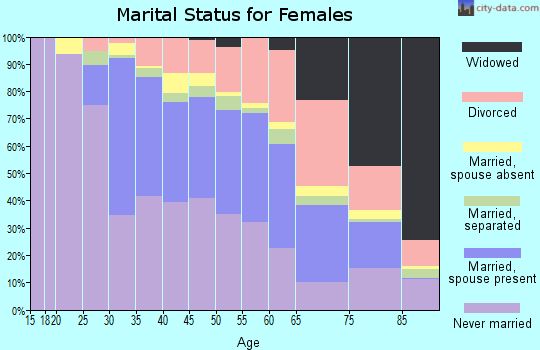
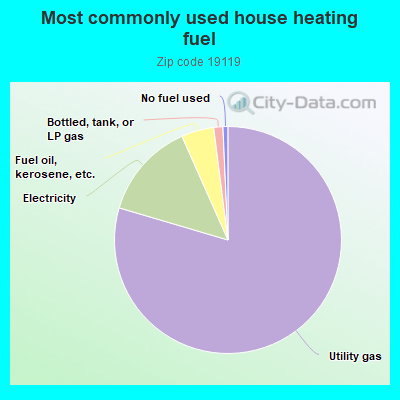
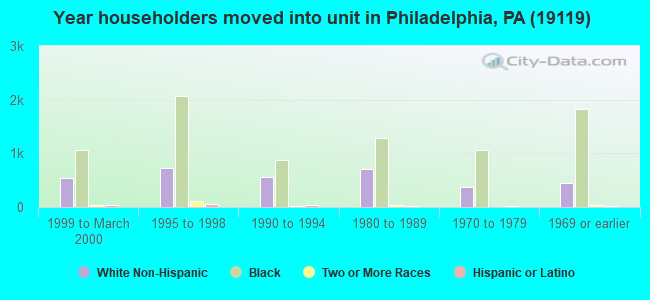
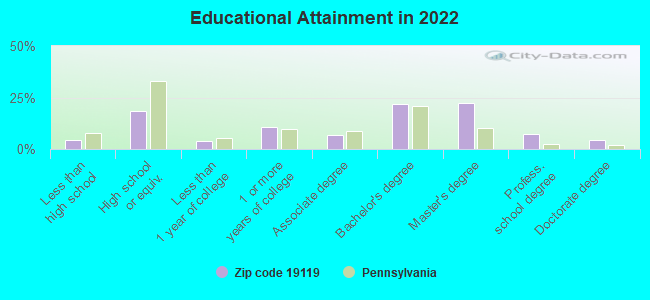
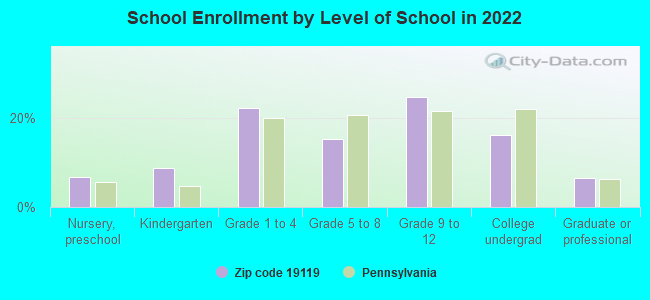
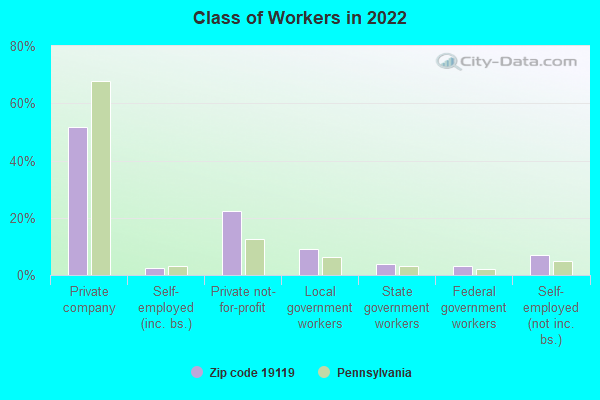
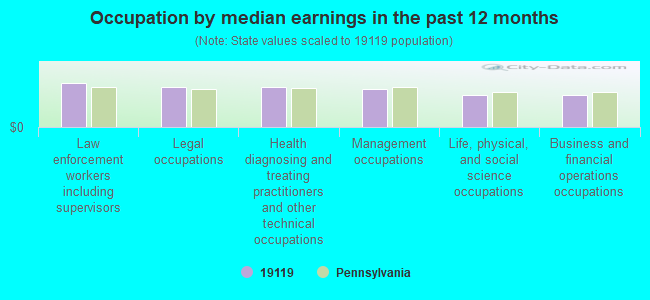
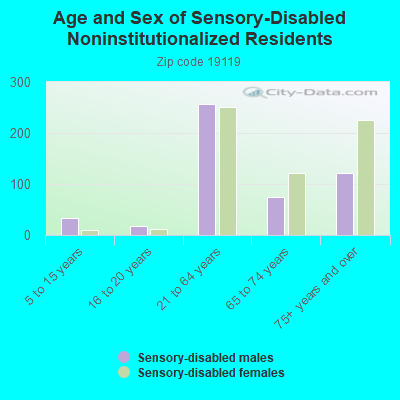
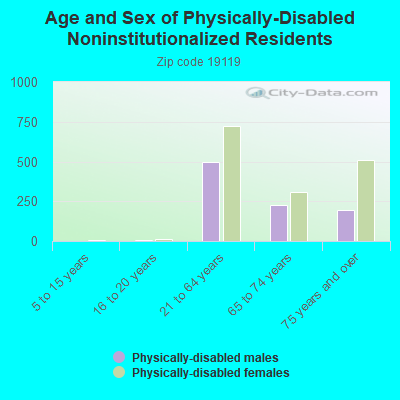
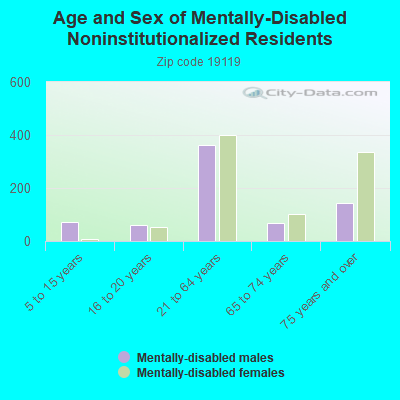
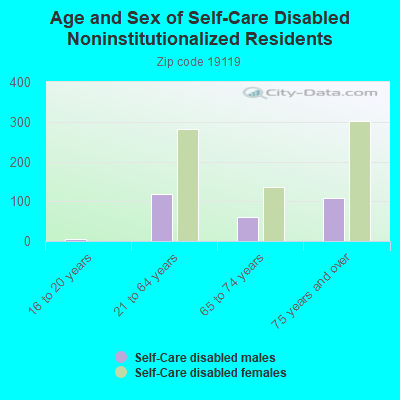
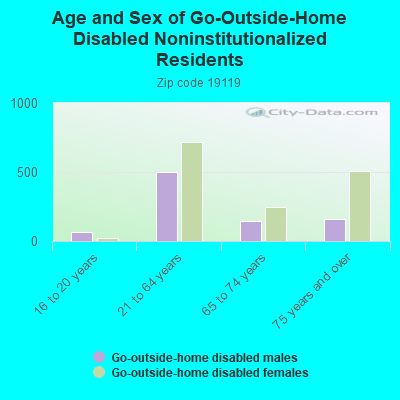
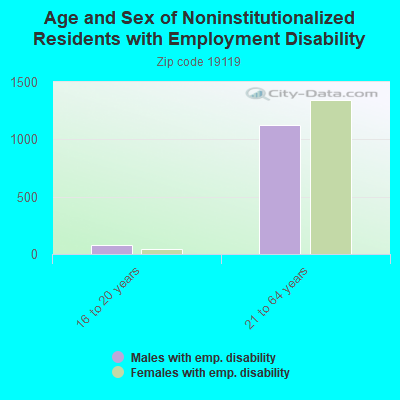
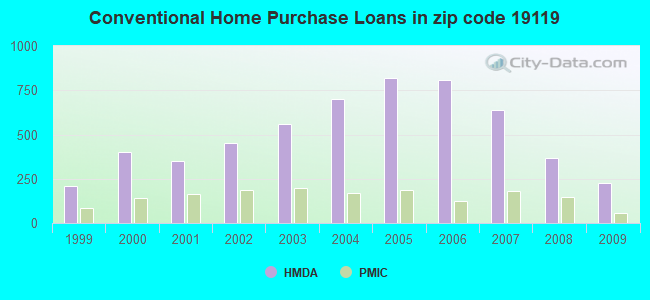
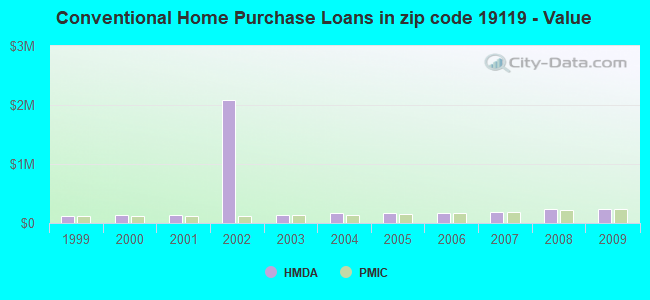
 According to the data from the years 2010 - 2018 the average number of fire incidents per year is 80. The highest number of reported fires - 157 took place in 2018, and the least - 0 in 2016. The data has a growing trend.
 When looking into fire subcategories, the most reports belonged to: Structure Fires (63.7%), and Outside Fires (20.8%).