Estimated zip code population in 2022: 38,330
Zip code population in 2010: 35,239
Zip code population in 2000: 36,420
Houses and condos: 19,411
Renter-occupied apartments: 8,022
% of renters here:
43%State:
31%
March 2022 cost of living index in zip code 19128: 104.9
(near average, U.S. average is 100)
Land area: 7.1
sq. mi.
Water area: 0.1
sq. mi.
Population density: 5,426 people per square mile (average).
OSM Map
General Map
Google Map
MSN Map
OSM Map
General Map
Google Map
MSN Map
OSM Map
General Map
Google Map
MSN Map
OSM Map
General Map
Google Map
MSN Map
Please wait while loading the map...
Real estate property taxes paid for housing units in 2022:
This zip code:
0.9% ($2,901)Pennsylvania:
1.3% ($3,094)
Median real estate property taxes paid for housing units with mortgages in 2022: $2,862 (0.8%)
Median real estate property taxes paid for housing units with no mortgage in 2022: $3,013 (1.0%)
Profiles of local businesses
Business Search - 14 Million verified businesses
Males: 18,591 Females: 19,739
For population 25 years and over in 19128:
High school or higher: 96.3%Bachelor's degree or higher: 56.4%Graduate or professional degree: 24.6%Unemployed: 3.7%Mean travel time to work (commute): 30.4 minutes
For population 15 years and over in 19128:
Never married: 41.8%Now married: 44.5%Separated: 1.9%Widowed: 4.5%Divorced: 7.3%
Zip code 19128 compared to state average:
Median age below state average. Length of stay since moving in significantly above state average. Percentage of population with a bachelor's degree or higher above state average. 28,563 74.5% White 4,560 11.9% Black 2,625 6.8% Hispanic or Latino 1,304 3.4% Two or more races 1,027 2.7% Asian 239 0.6% Some other race 2 0.01% American Indian 5 0.01% Native Hawaiian and Other
Data:
Median household income ($)
Median household income (% change since 2000)
Household income diversity
Ratio of average income to average house value (%)
Ratio of average income to average rent
Median household income ($) - White
Median household income ($) - Black or African American
Median household income ($) - Asian
Median household income ($) - Hispanic or Latino
Median household income ($) - American Indian and Alaska Native
Median household income ($) - Multirace
Median household income ($) - Other Race
Median household income for houses/condos with a mortgage ($)
Median household income for apartments without a mortgage ($)
Races - White alone (%)
Races - White alone (% change since 2000)
Races - Black alone (%)
Races - Black alone (% change since 2000)
Races - American Indian alone (%)
Races - American Indian alone (% change since 2000)
Races - Asian alone (%)
Races - Asian alone (% change since 2000)
Races - Hispanic (%)
Races - Hispanic (% change since 2000)
Races - Native Hawaiian and Other Pacific Islander alone (%)
Races - Native Hawaiian and Other Pacific Islander alone (% change since 2000)
Races - Two or more races (%)
Races - Two or more races (% change since 2000)
Races - Other race alone (%)
Races - Other race alone (% change since 2000)
Racial diversity
Unemployment (%)
Unemployment (% change since 2000)
Unemployment (%) - White
Unemployment (%) - Black or African American
Unemployment (%) - Asian
Unemployment (%) - Hispanic or Latino
Unemployment (%) - American Indian and Alaska Native
Unemployment (%) - Multirace
Unemployment (%) - Other Race
Population density (people per square mile)
Population - Males (%)
Population - Females (%)
Population - Males (%) - White
Population - Males (%) - Black or African American
Population - Males (%) - Asian
Population - Males (%) - Hispanic or Latino
Population - Males (%) - American Indian and Alaska Native
Population - Males (%) - Multirace
Population - Males (%) - Other Race
Population - Females (%) - White
Population - Females (%) - Black or African American
Population - Females (%) - Asian
Population - Females (%) - Hispanic or Latino
Population - Females (%) - American Indian and Alaska Native
Population - Females (%) - Multirace
Population - Females (%) - Other Race
Coronavirus confirmed cases (Apr 27, 2024)
Deaths caused by coronavirus (Apr 27, 2024)
Coronavirus confirmed cases (per 100k population) (Apr 27, 2024)
Deaths caused by coronavirus (per 100k population) (Apr 27, 2024)
Daily increase in number of cases (Apr 27, 2024)
Weekly increase in number of cases (Apr 27, 2024)
Cases doubled (in days) (Apr 27, 2024)
Hospitalized patients (Apr 18, 2022)
Negative test results (Apr 18, 2022)
Total test results (Apr 18, 2022)
COVID Vaccine doses distributed (per 100k population) (Sep 19, 2023)
COVID Vaccine doses administered (per 100k population) (Sep 19, 2023)
COVID Vaccine doses distributed (Sep 19, 2023)
COVID Vaccine doses administered (Sep 19, 2023)
Likely homosexual households (%)
Likely homosexual households (% change since 2000)
Likely homosexual households - Lesbian couples (%)
Likely homosexual households - Lesbian couples (% change since 2000)
Likely homosexual households - Gay men (%)
Likely homosexual households - Gay men (% change since 2000)
Cost of living index
Median gross rent ($)
Median contract rent ($)
Median monthly housing costs ($)
Median house or condo value ($)
Median house or condo value ($ change since 2000)
Mean house or condo value by units in structure - 1, detached ($)
Mean house or condo value by units in structure - 1, attached ($)
Mean house or condo value by units in structure - 2 ($)
Mean house or condo value by units in structure by units in structure - 3 or 4 ($)
Mean house or condo value by units in structure - 5 or more ($)
Mean house or condo value by units in structure - Boat, RV, van, etc. ($)
Mean house or condo value by units in structure - Mobile home ($)
Median house or condo value ($) - White
Median house or condo value ($) - Black or African American
Median house or condo value ($) - Asian
Median house or condo value ($) - Hispanic or Latino
Median house or condo value ($) - American Indian and Alaska Native
Median house or condo value ($) - Multirace
Median house or condo value ($) - Other Race
Median resident age
Resident age diversity
Median resident age - Males
Median resident age - Females
Median resident age - White
Median resident age - Black or African American
Median resident age - Asian
Median resident age - Hispanic or Latino
Median resident age - American Indian and Alaska Native
Median resident age - Multirace
Median resident age - Other Race
Median resident age - Males - White
Median resident age - Males - Black or African American
Median resident age - Males - Asian
Median resident age - Males - Hispanic or Latino
Median resident age - Males - American Indian and Alaska Native
Median resident age - Males - Multirace
Median resident age - Males - Other Race
Median resident age - Females - White
Median resident age - Females - Black or African American
Median resident age - Females - Asian
Median resident age - Females - Hispanic or Latino
Median resident age - Females - American Indian and Alaska Native
Median resident age - Females - Multirace
Median resident age - Females - Other Race
Commute - mean travel time to work (minutes)
Travel time to work - Less than 5 minutes (%)
Travel time to work - Less than 5 minutes (% change since 2000)
Travel time to work - 5 to 9 minutes (%)
Travel time to work - 5 to 9 minutes (% change since 2000)
Travel time to work - 10 to 19 minutes (%)
Travel time to work - 10 to 19 minutes (% change since 2000)
Travel time to work - 20 to 29 minutes (%)
Travel time to work - 20 to 29 minutes (% change since 2000)
Travel time to work - 30 to 39 minutes (%)
Travel time to work - 30 to 39 minutes (% change since 2000)
Travel time to work - 40 to 59 minutes (%)
Travel time to work - 40 to 59 minutes (% change since 2000)
Travel time to work - 60 to 89 minutes (%)
Travel time to work - 60 to 89 minutes (% change since 2000)
Travel time to work - 90 or more minutes (%)
Travel time to work - 90 or more minutes (% change since 2000)
Marital status - Never married (%)
Marital status - Now married (%)
Marital status - Separated (%)
Marital status - Widowed (%)
Marital status - Divorced (%)
Median family income ($)
Median family income (% change since 2000)
Median non-family income ($)
Median non-family income (% change since 2000)
Median per capita income ($)
Median per capita income (% change since 2000)
Median family income ($) - White
Median family income ($) - Black or African American
Median family income ($) - Asian
Median family income ($) - Hispanic or Latino
Median family income ($) - American Indian and Alaska Native
Median family income ($) - Multirace
Median family income ($) - Other Race
Median year house/condo built
Median year apartment built
Year house built - Built 2005 or later (%)
Year house built - Built 2000 to 2004 (%)
Year house built - Built 1990 to 1999 (%)
Year house built - Built 1980 to 1989 (%)
Year house built - Built 1970 to 1979 (%)
Year house built - Built 1960 to 1969 (%)
Year house built - Built 1950 to 1959 (%)
Year house built - Built 1940 to 1949 (%)
Year house built - Built 1939 or earlier (%)
Average household size
Household density (households per square mile)
Average household size - White
Average household size - Black or African American
Average household size - Asian
Average household size - Hispanic or Latino
Average household size - American Indian and Alaska Native
Average household size - Multirace
Average household size - Other Race
Occupied housing units (%)
Vacant housing units (%)
Owner occupied housing units (%)
Renter occupied housing units (%)
Vacancy status - For rent (%)
Vacancy status - For sale only (%)
Vacancy status - Rented or sold, not occupied (%)
Vacancy status - For seasonal, recreational, or occasional use (%)
Vacancy status - For migrant workers (%)
Vacancy status - Other vacant (%)
Residents with income below the poverty level (%)
Residents with income below 50% of the poverty level (%)
Children below poverty level (%)
Poor families by family type - Married-couple family (%)
Poor families by family type - Male, no wife present (%)
Poor families by family type - Female, no husband present (%)
Poverty status for native-born residents (%)
Poverty status for foreign-born residents (%)
Poverty among high school graduates not in families (%)
Poverty among people who did not graduate high school not in families (%)
Residents with income below the poverty level (%) - White
Residents with income below the poverty level (%) - Black or African American
Residents with income below the poverty level (%) - Asian
Residents with income below the poverty level (%) - Hispanic or Latino
Residents with income below the poverty level (%) - American Indian and Alaska Native
Residents with income below the poverty level (%) - Multirace
Residents with income below the poverty level (%) - Other Race
Air pollution - Air Quality Index (AQI)
Air pollution - CO
Air pollution - NO2
Air pollution - SO2
Air pollution - Ozone
Air pollution - PM10
Air pollution - PM25
Air pollution - Pb
Crime - Murders per 100,000 population
Crime - Rapes per 100,000 population
Crime - Robberies per 100,000 population
Crime - Assaults per 100,000 population
Crime - Burglaries per 100,000 population
Crime - Thefts per 100,000 population
Crime - Auto thefts per 100,000 population
Crime - Arson per 100,000 population
Crime - City-data.com crime index
Crime - Violent crime index
Crime - Property crime index
Crime - Murders per 100,000 population (5 year average)
Crime - Rapes per 100,000 population (5 year average)
Crime - Robberies per 100,000 population (5 year average)
Crime - Assaults per 100,000 population (5 year average)
Crime - Burglaries per 100,000 population (5 year average)
Crime - Thefts per 100,000 population (5 year average)
Crime - Auto thefts per 100,000 population (5 year average)
Crime - Arson per 100,000 population (5 year average)
Crime - City-data.com crime index (5 year average)
Crime - Violent crime index (5 year average)
Crime - Property crime index (5 year average)
1996 Presidential Elections Results (%) - Democratic Party (Clinton)
1996 Presidential Elections Results (%) - Republican Party (Dole)
1996 Presidential Elections Results (%) - Other
2000 Presidential Elections Results (%) - Democratic Party (Gore)
2000 Presidential Elections Results (%) - Republican Party (Bush)
2000 Presidential Elections Results (%) - Other
2004 Presidential Elections Results (%) - Democratic Party (Kerry)
2004 Presidential Elections Results (%) - Republican Party (Bush)
2004 Presidential Elections Results (%) - Other
2008 Presidential Elections Results (%) - Democratic Party (Obama)
2008 Presidential Elections Results (%) - Republican Party (McCain)
2008 Presidential Elections Results (%) - Other
2012 Presidential Elections Results (%) - Democratic Party (Obama)
2012 Presidential Elections Results (%) - Republican Party (Romney)
2012 Presidential Elections Results (%) - Other
2016 Presidential Elections Results (%) - Democratic Party (Clinton)
2016 Presidential Elections Results (%) - Republican Party (Trump)
2016 Presidential Elections Results (%) - Other
2020 Presidential Elections Results (%) - Democratic Party (Biden)
2020 Presidential Elections Results (%) - Republican Party (Trump)
2020 Presidential Elections Results (%) - Other
Ancestries Reported - Arab (%)
Ancestries Reported - Czech (%)
Ancestries Reported - Danish (%)
Ancestries Reported - Dutch (%)
Ancestries Reported - English (%)
Ancestries Reported - French (%)
Ancestries Reported - French Canadian (%)
Ancestries Reported - German (%)
Ancestries Reported - Greek (%)
Ancestries Reported - Hungarian (%)
Ancestries Reported - Irish (%)
Ancestries Reported - Italian (%)
Ancestries Reported - Lithuanian (%)
Ancestries Reported - Norwegian (%)
Ancestries Reported - Polish (%)
Ancestries Reported - Portuguese (%)
Ancestries Reported - Russian (%)
Ancestries Reported - Scotch-Irish (%)
Ancestries Reported - Scottish (%)
Ancestries Reported - Slovak (%)
Ancestries Reported - Subsaharan African (%)
Ancestries Reported - Swedish (%)
Ancestries Reported - Swiss (%)
Ancestries Reported - Ukrainian (%)
Ancestries Reported - United States (%)
Ancestries Reported - Welsh (%)
Ancestries Reported - West Indian (%)
Ancestries Reported - Other (%)
Educational Attainment - No schooling completed (%)
Educational Attainment - Less than high school (%)
Educational Attainment - High school or equivalent (%)
Educational Attainment - Less than 1 year of college (%)
Educational Attainment - 1 or more years of college (%)
Educational Attainment - Associate degree (%)
Educational Attainment - Bachelor's degree (%)
Educational Attainment - Master's degree (%)
Educational Attainment - Professional school degree (%)
Educational Attainment - Doctorate degree (%)
School Enrollment - Nursery, preschool (%)
School Enrollment - Kindergarten (%)
School Enrollment - Grade 1 to 4 (%)
School Enrollment - Grade 5 to 8 (%)
School Enrollment - Grade 9 to 12 (%)
School Enrollment - College undergrad (%)
School Enrollment - Graduate or professional (%)
School Enrollment - Not enrolled in school (%)
School enrollment - Public schools (%)
School enrollment - Private schools (%)
School enrollment - Not enrolled (%)
Median number of rooms in houses and condos
Median number of rooms in apartments
Housing units lacking complete plumbing facilities (%)
Housing units lacking complete kitchen facilities (%)
Density of houses
Urban houses (%)
Rural houses (%)
Households with people 60 years and over (%)
Households with people 65 years and over (%)
Households with people 75 years and over (%)
Households with one or more nonrelatives (%)
Households with no nonrelatives (%)
Population in households (%)
Family households (%)
Nonfamily households (%)
Population in families (%)
Family households with own children (%)
Median number of bedrooms in owner occupied houses
Mean number of bedrooms in owner occupied houses
Median number of bedrooms in renter occupied houses
Mean number of bedrooms in renter occupied houses
Median number of vehichles in owner occupied houses
Mean number of vehichles in owner occupied houses
Median number of vehichles in renter occupied houses
Mean number of vehichles in renter occupied houses
Mortgage status - with mortgage (%)
Mortgage status - with second mortgage (%)
Mortgage status - with home equity loan (%)
Mortgage status - with both second mortgage and home equity loan (%)
Mortgage status - without a mortgage (%)
Average family size
Average family size - White
Average family size - Black or African American
Average family size - Asian
Average family size - Hispanic or Latino
Average family size - American Indian and Alaska Native
Average family size - Multirace
Average family size - Other Race
Geographical mobility - Same house 1 year ago (%)
Geographical mobility - Moved within same county (%)
Geographical mobility - Moved from different county within same state (%)
Geographical mobility - Moved from different state (%)
Geographical mobility - Moved from abroad (%)
Place of birth - Born in state of residence (%)
Place of birth - Born in other state (%)
Place of birth - Native, outside of US (%)
Place of birth - Foreign born (%)
Housing units in structures - 1, detached (%)
Housing units in structures - 1, attached (%)
Housing units in structures - 2 (%)
Housing units in structures - 3 or 4 (%)
Housing units in structures - 5 to 9 (%)
Housing units in structures - 10 to 19 (%)
Housing units in structures - 20 to 49 (%)
Housing units in structures - 50 or more (%)
Housing units in structures - Mobile home (%)
Housing units in structures - Boat, RV, van, etc. (%)
House/condo owner moved in on average (years ago)
Renter moved in on average (years ago)
Year householder moved into unit - Moved in 1999 to March 2000 (%)
Year householder moved into unit - Moved in 1995 to 1998 (%)
Year householder moved into unit - Moved in 1990 to 1994 (%)
Year householder moved into unit - Moved in 1980 to 1989 (%)
Year householder moved into unit - Moved in 1970 to 1979 (%)
Year householder moved into unit - Moved in 1969 or earlier (%)
Means of transportation to work - Drove car alone (%)
Means of transportation to work - Carpooled (%)
Means of transportation to work - Public transportation (%)
Means of transportation to work - Bus or trolley bus (%)
Means of transportation to work - Streetcar or trolley car (%)
Means of transportation to work - Subway or elevated (%)
Means of transportation to work - Railroad (%)
Means of transportation to work - Ferryboat (%)
Means of transportation to work - Taxicab (%)
Means of transportation to work - Motorcycle (%)
Means of transportation to work - Bicycle (%)
Means of transportation to work - Walked (%)
Means of transportation to work - Other means (%)
Working at home (%)
Industry diversity
Most Common Industries - Agriculture, forestry, fishing and hunting, and mining (%)
Most Common Industries - Agriculture, forestry, fishing and hunting (%)
Most Common Industries - Mining, quarrying, and oil and gas extraction (%)
Most Common Industries - Construction (%)
Most Common Industries - Manufacturing (%)
Most Common Industries - Wholesale trade (%)
Most Common Industries - Retail trade (%)
Most Common Industries - Transportation and warehousing, and utilities (%)
Most Common Industries - Transportation and warehousing (%)
Most Common Industries - Utilities (%)
Most Common Industries - Information (%)
Most Common Industries - Finance and insurance, and real estate and rental and leasing (%)
Most Common Industries - Finance and insurance (%)
Most Common Industries - Real estate and rental and leasing (%)
Most Common Industries - Professional, scientific, and management, and administrative and waste management services (%)
Most Common Industries - Professional, scientific, and technical services (%)
Most Common Industries - Management of companies and enterprises (%)
Most Common Industries - Administrative and support and waste management services (%)
Most Common Industries - Educational services, and health care and social assistance (%)
Most Common Industries - Educational services (%)
Most Common Industries - Health care and social assistance (%)
Most Common Industries - Arts, entertainment, and recreation, and accommodation and food services (%)
Most Common Industries - Arts, entertainment, and recreation (%)
Most Common Industries - Accommodation and food services (%)
Most Common Industries - Other services, except public administration (%)
Most Common Industries - Public administration (%)
Occupation diversity
Most Common Occupations - Management, business, science, and arts occupations (%)
Most Common Occupations - Management, business, and financial occupations (%)
Most Common Occupations - Management occupations (%)
Most Common Occupations - Business and financial operations occupations (%)
Most Common Occupations - Computer, engineering, and science occupations (%)
Most Common Occupations - Computer and mathematical occupations (%)
Most Common Occupations - Architecture and engineering occupations (%)
Most Common Occupations - Life, physical, and social science occupations (%)
Most Common Occupations - Education, legal, community service, arts, and media occupations (%)
Most Common Occupations - Community and social service occupations (%)
Most Common Occupations - Legal occupations (%)
Most Common Occupations - Education, training, and library occupations (%)
Most Common Occupations - Arts, design, entertainment, sports, and media occupations (%)
Most Common Occupations - Healthcare practitioners and technical occupations (%)
Most Common Occupations - Health diagnosing and treating practitioners and other technical occupations (%)
Most Common Occupations - Health technologists and technicians (%)
Most Common Occupations - Service occupations (%)
Most Common Occupations - Healthcare support occupations (%)
Most Common Occupations - Protective service occupations (%)
Most Common Occupations - Fire fighting and prevention, and other protective service workers including supervisors (%)
Most Common Occupations - Law enforcement workers including supervisors (%)
Most Common Occupations - Food preparation and serving related occupations (%)
Most Common Occupations - Building and grounds cleaning and maintenance occupations (%)
Most Common Occupations - Personal care and service occupations (%)
Most Common Occupations - Sales and office occupations (%)
Most Common Occupations - Sales and related occupations (%)
Most Common Occupations - Office and administrative support occupations (%)
Most Common Occupations - Natural resources, construction, and maintenance occupations (%)
Most Common Occupations - Farming, fishing, and forestry occupations (%)
Most Common Occupations - Construction and extraction occupations (%)
Most Common Occupations - Installation, maintenance, and repair occupations (%)
Most Common Occupations - Production, transportation, and material moving occupations (%)
Most Common Occupations - Production occupations (%)
Most Common Occupations - Transportation occupations (%)
Most Common Occupations - Material moving occupations (%)
People in Group quarters - Institutionalized population (%)
People in Group quarters - Correctional institutions (%)
People in Group quarters - Federal prisons and detention centers (%)
People in Group quarters - Halfway houses (%)
People in Group quarters - Local jails and other confinement facilities (including police lockups) (%)
People in Group quarters - Military disciplinary barracks (%)
People in Group quarters - State prisons (%)
People in Group quarters - Other types of correctional institutions (%)
People in Group quarters - Nursing homes (%)
People in Group quarters - Hospitals/wards, hospices, and schools for the handicapped (%)
People in Group quarters - Hospitals/wards and hospices for chronically ill (%)
People in Group quarters - Hospices or homes for chronically ill (%)
People in Group quarters - Military hospitals or wards for chronically ill (%)
People in Group quarters - Other hospitals or wards for chronically ill (%)
People in Group quarters - Hospitals or wards for drug/alcohol abuse (%)
People in Group quarters - Mental (Psychiatric) hospitals or wards (%)
People in Group quarters - Schools, hospitals, or wards for the mentally retarded (%)
People in Group quarters - Schools, hospitals, or wards for the physically handicapped (%)
People in Group quarters - Institutions for the deaf (%)
People in Group quarters - Institutions for the blind (%)
People in Group quarters - Orthopedic wards and institutions for the physically handicapped (%)
People in Group quarters - Wards in general hospitals for patients who have no usual home elsewhere (%)
People in Group quarters - Wards in military hospitals for patients who have no usual home elsewhere (%)
People in Group quarters - Juvenile institutions (%)
People in Group quarters - Long-term care (%)
People in Group quarters - Homes for abused, dependent, and neglected children (%)
People in Group quarters - Residential treatment centers for emotionally disturbed children (%)
People in Group quarters - Training schools for juvenile delinquents (%)
People in Group quarters - Short-term care, detention or diagnostic centers for delinquent children (%)
People in Group quarters - Type of juvenile institution unknown (%)
People in Group quarters - Noninstitutionalized population (%)
People in Group quarters - College dormitories (includes college quarters off campus) (%)
People in Group quarters - Military quarters (%)
People in Group quarters - On base (%)
People in Group quarters - Barracks, unaccompanied personnel housing (UPH), (Enlisted/Officer), ;and similar group living quarters for military personnel (%)
People in Group quarters - Transient quarters for temporary residents (%)
People in Group quarters - Military ships (%)
People in Group quarters - Group homes (%)
People in Group quarters - Homes or halfway houses for drug/alcohol abuse (%)
People in Group quarters - Homes for the mentally ill (%)
People in Group quarters - Homes for the mentally retarded (%)
People in Group quarters - Homes for the physically handicapped (%)
People in Group quarters - Other group homes (%)
People in Group quarters - Religious group quarters (%)
People in Group quarters - Dormitories (%)
People in Group quarters - Agriculture workers' dormitories on farms (%)
People in Group quarters - Job Corps and vocational training facilities (%)
People in Group quarters - Other workers' dormitories (%)
People in Group quarters - Crews of maritime vessels (%)
People in Group quarters - Other nonhousehold living situations (%)
People in Group quarters - Other noninstitutional group quarters (%)
Residents speaking English at home (%)
Residents speaking English at home - Born in the United States (%)
Residents speaking English at home - Native, born elsewhere (%)
Residents speaking English at home - Foreign born (%)
Residents speaking Spanish at home (%)
Residents speaking Spanish at home - Born in the United States (%)
Residents speaking Spanish at home - Native, born elsewhere (%)
Residents speaking Spanish at home - Foreign born (%)
Residents speaking other language at home (%)
Residents speaking other language at home - Born in the United States (%)
Residents speaking other language at home - Native, born elsewhere (%)
Residents speaking other language at home - Foreign born (%)
Class of Workers - Employee of private company (%)
Class of Workers - Self-employed in own incorporated business (%)
Class of Workers - Private not-for-profit wage and salary workers (%)
Class of Workers - Local government workers (%)
Class of Workers - State government workers (%)
Class of Workers - Federal government workers (%)
Class of Workers - Self-employed workers in own not incorporated business and Unpaid family workers (%)
House heating fuel used in houses and condos - Utility gas (%)
House heating fuel used in houses and condos - Bottled, tank, or LP gas (%)
House heating fuel used in houses and condos - Electricity (%)
House heating fuel used in houses and condos - Fuel oil, kerosene, etc. (%)
House heating fuel used in houses and condos - Coal or coke (%)
House heating fuel used in houses and condos - Wood (%)
House heating fuel used in houses and condos - Solar energy (%)
House heating fuel used in houses and condos - Other fuel (%)
House heating fuel used in houses and condos - No fuel used (%)
House heating fuel used in apartments - Utility gas (%)
House heating fuel used in apartments - Bottled, tank, or LP gas (%)
House heating fuel used in apartments - Electricity (%)
House heating fuel used in apartments - Fuel oil, kerosene, etc. (%)
House heating fuel used in apartments - Coal or coke (%)
House heating fuel used in apartments - Wood (%)
House heating fuel used in apartments - Solar energy (%)
House heating fuel used in apartments - Other fuel (%)
House heating fuel used in apartments - No fuel used (%)
Armed forces status - In Armed Forces (%)
Armed forces status - Civilian (%)
Armed forces status - Civilian - Veteran (%)
Armed forces status - Civilian - Nonveteran (%)
Fatal accidents locations in years 2005-2021
Fatal accidents locations in 2005
Fatal accidents locations in 2006
Fatal accidents locations in 2007
Fatal accidents locations in 2008
Fatal accidents locations in 2009
Fatal accidents locations in 2010
Fatal accidents locations in 2011
Fatal accidents locations in 2012
Fatal accidents locations in 2013
Fatal accidents locations in 2014
Fatal accidents locations in 2015
Fatal accidents locations in 2016
Fatal accidents locations in 2017
Fatal accidents locations in 2018
Fatal accidents locations in 2019
Fatal accidents locations in 2020
Fatal accidents locations in 2021
Alcohol use - People drinking some alcohol every month (%)
Alcohol use - People not drinking at all (%)
Alcohol use - Average days/month drinking alcohol
Alcohol use - Average drinks/week
Alcohol use - Average days/year people drink much
Audiometry - Average condition of hearing (%)
Audiometry - People that can hear a whisper from across a quiet room (%)
Audiometry - People that can hear normal voice from across a quiet room (%)
Audiometry - Ears ringing, roaring, buzzing (%)
Audiometry - Had a job exposure to loud noise (%)
Audiometry - Had off-work exposure to loud noise (%)
Blood Pressure & Cholesterol - Has high blood pressure (%)
Blood Pressure & Cholesterol - Checking blood pressure at home (%)
Blood Pressure & Cholesterol - Frequently checking blood cholesterol (%)
Blood Pressure & Cholesterol - Has high cholesterol level (%)
Consumer Behavior - Money monthly spent on food at supermarket/grocery store
Consumer Behavior - Money monthly spent on food at other stores
Consumer Behavior - Money monthly spent on eating out
Consumer Behavior - Money monthly spent on carryout/delivered foods
Consumer Behavior - Income spent on food at supermarket/grocery store (%)
Consumer Behavior - Income spent on food at other stores (%)
Consumer Behavior - Income spent on eating out (%)
Consumer Behavior - Income spent on carryout/delivered foods (%)
Current Health Status - General health condition (%)
Current Health Status - Blood donors (%)
Current Health Status - Has blood ever tested for HIV virus (%)
Current Health Status - Left-handed people (%)
Dermatology - People using sunscreen (%)
Diabetes - Diabetics (%)
Diabetes - Had a blood test for high blood sugar (%)
Diabetes - People taking insulin (%)
Diet Behavior & Nutrition - Diet health (%)
Diet Behavior & Nutrition - Milk product consumption (# of products/month)
Diet Behavior & Nutrition - Meals not home prepared (#/week)
Diet Behavior & Nutrition - Meals from fast food or pizza place (#/week)
Diet Behavior & Nutrition - Ready-to-eat foods (#/month)
Diet Behavior & Nutrition - Frozen meals/pizza (#/month)
Drug Use - People that ever used marijuana or hashish (%)
Drug Use - Ever used hard drugs (%)
Drug Use - Ever used any form of cocaine (%)
Drug Use - Ever used heroin (%)
Drug Use - Ever used methamphetamine (%)
Health Insurance - People covered by health insurance (%)
Kidney Conditions-Urology - Avg. # of times urinating at night
Medical Conditions - People with asthma (%)
Medical Conditions - People with anemia (%)
Medical Conditions - People with psoriasis (%)
Medical Conditions - People with overweight (%)
Medical Conditions - Elderly people having difficulties in thinking or remembering (%)
Medical Conditions - People who ever received blood transfusion (%)
Medical Conditions - People having trouble seeing even with glass/contacts (%)
Medical Conditions - People with arthritis (%)
Medical Conditions - People with gout (%)
Medical Conditions - People with congestive heart failure (%)
Medical Conditions - People with coronary heart disease (%)
Medical Conditions - People with angina pectoris (%)
Medical Conditions - People who ever had heart attack (%)
Medical Conditions - People who ever had stroke (%)
Medical Conditions - People with emphysema (%)
Medical Conditions - People with thyroid problem (%)
Medical Conditions - People with chronic bronchitis (%)
Medical Conditions - People with any liver condition (%)
Medical Conditions - People who ever had cancer or malignancy (%)
Mental Health - People who have little interest in doing things (%)
Mental Health - People feeling down, depressed, or hopeless (%)
Mental Health - People who have trouble sleeping or sleeping too much (%)
Mental Health - People feeling tired or having little energy (%)
Mental Health - People with poor appetite or overeating (%)
Mental Health - People feeling bad about themself (%)
Mental Health - People who have trouble concentrating on things (%)
Mental Health - People moving or speaking slowly or too fast (%)
Mental Health - People having thoughts they would be better off dead (%)
Oral Health - Average years since last visit a dentist
Oral Health - People embarrassed because of mouth (%)
Oral Health - People with gum disease (%)
Oral Health - General health of teeth and gums (%)
Oral Health - Average days a week using dental floss/device
Oral Health - Average days a week using mouthwash for dental problem
Oral Health - Average number of teeth
Pesticide Use - Households using pesticides to control insects (%)
Pesticide Use - Households using pesticides to kill weeds (%)
Physical Activity - People doing vigorous-intensity work activities (%)
Physical Activity - People doing moderate-intensity work activities (%)
Physical Activity - People walking or bicycling (%)
Physical Activity - People doing vigorous-intensity recreational activities (%)
Physical Activity - People doing moderate-intensity recreational activities (%)
Physical Activity - Average hours a day doing sedentary activities
Physical Activity - Average hours a day watching TV or videos
Physical Activity - Average hours a day using computer
Physical Functioning - People having limitations keeping them from working (%)
Physical Functioning - People limited in amount of work they can do (%)
Physical Functioning - People that need special equipment to walk (%)
Physical Functioning - People experiencing confusion/memory problems (%)
Physical Functioning - People requiring special healthcare equipment (%)
Prescription Medications - Average number of prescription medicines taking
Preventive Aspirin Use - Adults 40+ taking low-dose aspirin (%)
Reproductive Health - Vaginal deliveries (%)
Reproductive Health - Cesarean deliveries (%)
Reproductive Health - Deliveries resulted in a live birth (%)
Reproductive Health - Pregnancies resulted in a delivery (%)
Reproductive Health - Women breastfeeding newborns (%)
Reproductive Health - Women that had a hysterectomy (%)
Reproductive Health - Women that had both ovaries removed (%)
Reproductive Health - Women that have ever taken birth control pills (%)
Reproductive Health - Women taking birth control pills (%)
Reproductive Health - Women that have ever used Depo-Provera or injectables (%)
Reproductive Health - Women that have ever used female hormones (%)
Sexual Behavior - People 18+ that ever had sex (vaginal, anal, or oral) (%)
Sexual Behavior - Males 18+ that ever had vaginal sex with a woman (%)
Sexual Behavior - Males 18+ that ever performed oral sex on a woman (%)
Sexual Behavior - Males 18+ that ever had anal sex with a woman (%)
Sexual Behavior - Males 18+ that ever had any sex with a man (%)
Sexual Behavior - Females 18+ that ever had vaginal sex with a man (%)
Sexual Behavior - Females 18+ that ever performed oral sex on a man (%)
Sexual Behavior - Females 18+ that ever had anal sex with a man (%)
Sexual Behavior - Females 18+ that ever had any kind of sex with a woman (%)
Sexual Behavior - Average age people first had sex
Sexual Behavior - Average number of female sex partners in lifetime (males 18+)
Sexual Behavior - Average number of female vaginal sex partners in lifetime (males 18+)
Sexual Behavior - Average age people first performed oral sex on a woman (18+)
Sexual Behavior - Average number of woman performed oral sex on in lifetime (18+)
Sexual Behavior - Average number of male sex partners in lifetime (males 18+)
Sexual Behavior - Average number of male anal sex partners in lifetime (males 18+)
Sexual Behavior - Average age people first performed oral sex on a man (18+)
Sexual Behavior - Average number of male oral sex partners in lifetime (18+)
Sexual Behavior - People using protection when performing oral sex (%)
Sexual Behavior - Average number of times people have vaginal or anal sex a year
Sexual Behavior - People having sex without condom (%)
Sexual Behavior - Average number of male sex partners in lifetime (females 18+)
Sexual Behavior - Average number of male vaginal sex partners in lifetime (females 18+)
Sexual Behavior - Average number of female sex partners in lifetime (females 18+)
Sexual Behavior - Circumcised males 18+ (%)
Sleep Disorders - Average hours sleeping at night
Sleep Disorders - People that has trouble sleeping (%)
Smoking-Cigarette Use - People smoking cigarettes (%)
Taste & Smell - People 40+ having problems with smell (%)
Taste & Smell - People 40+ having problems with taste (%)
Taste & Smell - People 40+ that ever had wisdom teeth removed (%)
Taste & Smell - People 40+ that ever had tonsils teeth removed (%)
Taste & Smell - People 40+ that ever had a loss of consciousness because of a head injury (%)
Taste & Smell - People 40+ that ever had a broken nose or other serious injury to face or skull (%)
Taste & Smell - People 40+ that ever had two or more sinus infections (%)
Weight - Average height (inches)
Weight - Average weight (pounds)
Weight - Average BMI
Weight - People that are obese (%)
Weight - People that ever were obese (%)
Weight - People trying to lose weight (%)
100%
urban population.
Estimated median house/condo value in 2022: $330,481
19128:
$330,481Pennsylvania:
$245,500
According to our research of Pennsylvania and other state lists, there were 31 registered sex offenders living in 19128 zip code as of April 27, 2024 . The ratio of all residents to sex offenders in zip code 19128 is 1,209 to 1.The ratio of registered sex offenders to all residents in this zip code is lower than the state average.
Median resident age: This zip code:
36.4 yearsPennsylvania median age:
40.9 years
Average household size: This zip code:
2.0 peoplePennsylvania:
2.4 people
Averages for the 2020 tax year for zip code 19128, filed in 2021:
Average Adjusted Gross Income (AGI) in 2020: $74,917 (Individual Income Tax Returns) Here:
$74,917State:
$75,707
Salary/wage: $70,142 (reported on 83.3% of returns )Here:
$70,142State:
$62,806
(% of AGI for various income ranges: 985.2% for AGIs below $25k , 3585.8% for AGIs $25k-50k , 6715.9% for AGIs $50k-75k , 9693.7% for AGIs $75k-100k , 17880.9% for AGIs $100k-200k , 61402.2% for AGIs over 200k ) Taxable interest for individuals: $959 (reported on 36.1% of returns )This zip code:
$959Pennsylvania:
$1,633
(% of AGI for various income ranges: 25.0% for AGIs below $25k , 19.7% for AGIs $25k-50k , 29.3% for AGIs $50k-75k , 42.5% for AGIs $75k-100k , 89.4% for AGIs $100k-200k , 481.7% for AGIs over 200k ) Ordinary dividends: $3,622 (reported on 23.5% of returns )(% of AGI for various income ranges: 28.7% for AGIs below $25k , 33.5% for AGIs $25k-50k , 64.9% for AGIs $50k-75k , 104.0% for AGIs $75k-100k , 239.7% for AGIs $100k-200k , 1533.1% for AGIs over 200k ) Net capital gain/loss in AGI: +$9,975 (reported on 19.8% of returns )Here:
+$9,975State:
+$23,522
(% of AGI for various income ranges: 9.9% for AGIs below $25k , 29.5% for AGIs $25k-50k , 57.5% for AGIs $50k-75k , 124.9% for AGIs $75k-100k , 434.2% for AGIs $100k-200k , 6614.2% for AGIs over 200k ) Profit/loss from business: +$11,214 (reported on 13.8% of returns )Here:
+$11,214State:
+$16,274
(% of AGI for various income ranges: 106.6% for AGIs below $25k , 117.9% for AGIs $25k-50k , 121.7% for AGIs $50k-75k , 211.3% for AGIs $75k-100k , 362.7% for AGIs $100k-200k , 2074.7% for AGIs over 200k ) Taxable individual retirement arrangement distribution: $17,168 (reported on 8.2% of returns )19128:
$17,168Pennsylvania:
$18,583
(% of AGI for various income ranges: 67.5% for AGIs below $25k , 77.5% for AGIs $25k-50k , 127.8% for AGIs $50k-75k , 213.9% for AGIs $75k-100k , 442.6% for AGIs $100k-200k , 1489.4% for AGIs over 200k ) Self-employed (Keogh) retirement plans: $17,500 (reported on 0.4% of returns )19128:
$17,500Pennsylvania:
$25,407
(% of AGI for various income ranges: 22.2% for AGIs $100k-200k , 203.1% for AGIs over 200k ) Total itemized deductions: $26,024 (reported on 11.9% of returns )Here:
$26,024State:
$34,850
(% of AGI for various income ranges: 60.7% for AGIs below $25k , 95.6% for AGIs $25k-50k , 314.8% for AGIs $50k-75k , 622.1% for AGIs $75k-100k , 950.9% for AGIs $100k-200k , 3857.8% for AGIs over 200k ) Charity contributions: $5,505 (reported on 9.0% of returns )(% of AGI for various income ranges: 3.7% for AGIs below $25k , 14.1% for AGIs $25k-50k , 34.8% for AGIs $50k-75k , 79.9% for AGIs $75k-100k , 167.2% for AGIs $100k-200k , 814.4% for AGIs over 200k ) Taxes paid: $8,027 (reported on 11.8% of returns )(% of AGI for various income ranges: 9.1% for AGIs below $25k , 22.0% for AGIs $25k-50k , 101.1% for AGIs $50k-75k , 238.9% for AGIs $75k-100k , 324.7% for AGIs $100k-200k , 866.1% for AGIs over 200k ) Earned income credit: $1,488 (reported on 7.4% of returns )(% of AGI for various income ranges: 42.7% for AGIs below $25k , 24.7% for AGIs $25k-50k ) Percentage of individuals using paid preparers for their 2020 taxes: 91.9%(% for various income ranges: 90.0% for AGIs below $25k , 92.8% for AGIs $25k-50k , 92.2% for AGIs $50k-75k , 91.0% for AGIs $75k-100k , 93.1% for AGIs $100k-200k , 92.6% for AGIs over 200k )
Averages for the 2012 tax year for zip code 19128, filed in 2013:
Average Adjusted Gross Income (AGI) in 2012: $58,217 (Individual Income Tax Returns) Here:
$58,217State:
$61,346
Salary/wage: $54,949 (reported on 84.7% of returns )Here:
$54,949State:
$51,902
(% of AGI for various income ranges: 69.7% for AGIs below $25k , 82.1% for AGIs $25k-50k , 83.2% for AGIs $50k-75k , 82.9% for AGIs $75k-100k , 83.1% for AGIs $100k-200k , 65.7% for AGIs over 200k ) Taxable interest for individuals: $931 (reported on 39.7% of returns )This zip code:
$931Pennsylvania:
$1,588
(% of AGI for various income ranges: 1.8% for AGIs below $25k , 0.6% for AGIs $25k-50k , 0.4% for AGIs $50k-75k , 0.6% for AGIs $75k-100k , 0.6% for AGIs $100k-200k , 0.6% for AGIs over 200k ) Ordinary dividends: $3,453 (reported on 21.9% of returns )(% of AGI for various income ranges: 1.6% for AGIs below $25k , 0.9% for AGIs $25k-50k , 1.0% for AGIs $50k-75k , 0.9% for AGIs $75k-100k , 1.1% for AGIs $100k-200k , 3.1% for AGIs over 200k ) Net capital gain/loss in AGI: +$4,229 (reported on 15.2% of returns )Here:
+$4,229State:
+$14,495
(% of AGI for various income ranges: 0.1% for AGIs $25k-50k , 0.3% for AGIs $50k-75k , 0.4% for AGIs $75k-100k , 1.1% for AGIs $100k-200k , 5.3% for AGIs over 200k ) Profit/loss from business: +$12,994 (reported on 11.1% of returns )Here:
+$12,994State:
+$16,268
(% of AGI for various income ranges: 6.2% for AGIs below $25k , 2.7% for AGIs $25k-50k , 1.6% for AGIs $50k-75k , 1.9% for AGIs $75k-100k , 1.8% for AGIs $100k-200k , 4.3% for AGIs over 200k ) Taxable individual retirement arrangement distribution: $12,731 (reported on 9.8% of returns )19128:
$12,731Pennsylvania:
$14,550
(% of AGI for various income ranges: 3.7% for AGIs below $25k , 1.9% for AGIs $25k-50k , 1.9% for AGIs $50k-75k , 2.0% for AGIs $75k-100k , 2.0% for AGIs $100k-200k , 2.6% for AGIs over 200k ) Self-employment retirement plans: $16,767 (reported on 0.5% of returns )19128:
$16,767Pennsylvania:
$20,922
(% of AGI for various income ranges: 0.1% for AGIs $50k-75k , 0.7% for AGIs over 200k ) Total itemized deductions: $20,460 (22% of AGI, reported on 40.1% of returns )Here:
$20,460State:
$23,538
Here:
21.6% of AGIState:
18.4% of AGI
(% of AGI for various income ranges: 12.3% for AGIs below $25k , 9.7% for AGIs $25k-50k , 13.7% for AGIs $50k-75k , 16.5% for AGIs $75k-100k , 16.2% for AGIs $100k-200k , 13.4% for AGIs over 200k ) Charity contributions: $2,466 (reported on 33.4% of returns )(% of AGI for various income ranges: 0.8% for AGIs below $25k , 0.9% for AGIs $25k-50k , 1.4% for AGIs $50k-75k , 1.5% for AGIs $75k-100k , 1.6% for AGIs $100k-200k , 1.8% for AGIs over 200k ) Taxes paid: $8,551 (reported on 40.0% of returns )(% of AGI for various income ranges: 2.3% for AGIs below $25k , 2.9% for AGIs $25k-50k , 5.1% for AGIs $50k-75k , 6.9% for AGIs $75k-100k , 7.8% for AGIs $100k-200k , 6.9% for AGIs over 200k ) Earned income credit: $1,534 (reported on 8.8% of returns )(% of AGI for various income ranges: 2.9% for AGIs below $25k , 0.3% for AGIs $25k-50k ) Percentage of individuals using paid preparers for their 2012 taxes: 45.3%(% for various income ranges: 41.4% for AGIs below $25k , 42.2% for AGIs $25k-50k , 45.0% for AGIs $50k-75k , 49.2% for AGIs $75k-100k , 53.6% for AGIs $100k-200k , 68.4% for AGIs over 200k )
Averages for the 2004 tax year for zip code 19128, filed in 2005:
Average Adjusted Gross Income (AGI) in 2004: $46,893 (Individual Income Tax Returns) Here:
$46,893State:
$48,049
Salary/wage: $44,875 (reported on 84.0% of returns )Here:
$44,875State:
$42,646
(% of AGI for various income ranges: 80.4% for AGIs below $10k , 70.3% for AGIs $10k-25k , 84.9% for AGIs $25k-50k , 84.5% for AGIs $50k-75k , 85.1% for AGIs $75k-100k , 73.5% for AGIs over 100k ) Taxable interest for individuals: $1,287 (reported on 54.7% of returns )This zip code:
$1,287Pennsylvania:
$1,657
(% of AGI for various income ranges: 7.5% for AGIs below $10k , 3.7% for AGIs $10k-25k , 1.3% for AGIs $25k-50k , 1.3% for AGIs $50k-75k , 1.2% for AGIs $75k-100k , 1.2% for AGIs over 100k ) Taxable dividends: $3,092 (reported on 27.5% of returns )(% of AGI for various income ranges: 4.9% for AGIs below $10k , 2.0% for AGIs $10k-25k , 1.1% for AGIs $25k-50k , 1.3% for AGIs $50k-75k , 1.0% for AGIs $75k-100k , 3.0% for AGIs over 100k ) Net capital gain/loss: +$6,632 (reported on 19.6% of returns )Here:
+$6,632State:
+$9,716
(% of AGI for various income ranges: -0.9% for AGIs below $10k , 0.3% for AGIs $10k-25k , 0.4% for AGIs $25k-50k , 0.6% for AGIs $50k-75k , 1.3% for AGIs $75k-100k , 8.0% for AGIs over 100k ) Profit/loss from business: +$10,874 (reported on 9.3% of returns )Here:
+$10,874State:
+$14,267
(% of AGI for various income ranges: 4.3% for AGIs below $10k , 4.2% for AGIs $10k-25k , 1.7% for AGIs $25k-50k , 1.6% for AGIs $50k-75k , 1.7% for AGIs $75k-100k , 2.6% for AGIs over 100k ) IRA payment deduction: $2,847 (reported on 3.1% of returns )19128:
$2,847Pennsylvania:
$2,903
(% of AGI for various income ranges: 0.3% for AGIs below $10k , 0.3% for AGIs $10k-25k , 0.3% for AGIs $25k-50k , 0.2% for AGIs $50k-75k , 0.1% for AGIs $75k-100k , 0.1% for AGIs over 100k ) Self-employed pension: $11,679 (reported on 0.6% of returns )Here:
$11,679Pennsylvania:
$14,674
(% of AGI for various income ranges: 0.1% for AGIs $10k-25k , 0.0% for AGIs $25k-50k , 0.0% for AGIs $50k-75k , 0.1% for AGIs $75k-100k , 0.4% for AGIs over 100k ) Total itemized deductions: $16,728 (22% of AGI, reported on 42.6% of returns )Here:
$16,728State:
$18,804
Here:
22.3% of AGIState:
19.5% of AGI
(% of AGI for various income ranges: 11.0% for AGIs below $10k , 10.4% for AGIs $10k-25k , 12.0% for AGIs $25k-50k , 16.9% for AGIs $50k-75k , 18.1% for AGIs $75k-100k , 16.1% for AGIs over 100k ) Charity contributions deductions: $2,502 (3% of AGI, reported on 38.6% of returns )Here:
3.2% of AGIState:
3.3% of AGI
(% of AGI for various income ranges: 0.6% for AGIs below $10k , 1.1% for AGIs $10k-25k , 1.4% for AGIs $25k-50k , 2.0% for AGIs $50k-75k , 2.3% for AGIs $75k-100k , 2.8% for AGIs over 100k ) Total tax: $6,405 (reported on 81.7% of returns )(% of AGI for various income ranges: 2.1% for AGIs below $10k , 4.6% for AGIs $10k-25k , 8.5% for AGIs $25k-50k , 10.3% for AGIs $50k-75k , 10.9% for AGIs $75k-100k , 16.2% for AGIs over 100k ) Earned income credit: $1,295 (reported on 7.1% of returns )Percentage of individuals using paid preparers for their 2004 taxes: 48.0%(% for various income ranges: 42.9% for AGIs below $10k , 48.0% for AGIs $10k-25k , 45.5% for AGIs $25k-50k , 49.8% for AGIs $50k-75k , 50.9% for AGIs $75k-100k , 59.3% for AGIs over 100k )
Estimated median household income in 2022: This zip code:
$86,606Pennsylvania:
$71,798
Nearest zip codes: 19127 ,
19118 ,
19119 ,
19072 ,
19004 ,
19444 .
Philadelphia Zip Code Map
Percentage of family households: This zip code:
34.3%Pennsylvania:
42.6%
Percentage of households with unmarried partners: This zip code:
6.8%Pennsylvania:
46.5%
Likely homosexual households (counted as self-reported same-sex unmarried-partner households)
Lesbian couples: 0.2% of all households Gay men: 0.1% of all households
Household received Food Stamps/SNAP in the past 12 months: 1,281Household did not receive Food Stamps/SNAP in the past 12 months: 17,138
Women who had a birth in the past 12 months: 459 (420 now married , 57 unmarried) Women who did not have a birth in the past 12 months: 10,407 (3,927 now married , 6,486 unmarried)
Housing units in zip code 19128 with a mortgage: 7,163 (1,032
second mortgage , 23
home equity loan , 919
both second mortgage and home equity loan )
Houses without a mortgage: 457
Median monthly owner costs for units with a mortgage: $1,807
Median monthly owner costs for units without a mortgage: $612
Residents with income below the poverty level in 2022:
This zip code:
8.2%Whole state:
11.8%
Residents with income below 50% of the poverty level in 2022:
This zip code:
3.8%Whole state:
6.1%
Median number of rooms in houses and condos: Median number of rooms in apartments: Notable locations in this zip code not listed on our city pages
Click to draw/clear zip code borders Notable locations in zip code 19128: (A) , Rockdale (B) , Walnut Lane Golf Course (C) , The Schuylkill Center (D) , Andorra Branch Library Free Library of Philadelphia (E) , Philadelphia Fire Department Engine 39 (F) , Philadelphia Fire Department Engine 66 (G) , Philadelphia District 5 Police Station (H) , Roxborough Branch Library Free Library of Philadelphia (I) , Northern Home for Children (J) . Display/hide their locations on the map
Shopping Centers: (1) , Ivyridge Shopping Center (2) . Display/hide their locations on the map
Churches in zip code 19128 include: (A) , Grace Chapel (B) , Faith Chapel (C) , Epiphany Church (D) , Cathedral Church (E) . Display/hide their locations on the map
Cemeteries: (1) , Saint Marys Cemetery (2) , Leverington Cemetery (3) , Roxborough Cemetery (4) . Display/hide their locations on the map
Reservoirs: (A) , Lower Roxborough Reservoir (B) . Display/hide their locations on the map
Creek: (A) . Display/hide its location on the map
Parks in zip code 19128 include: (1) , Kendrick Recreation Center (2) , Gorgas Park (3) , Manayunk Park (4) . Display/hide their locations on the map
Year house built (houses)
13 2020 or later1,133 2010 to 2019638 2000 to 2009648 1990 to 19991,718 1980 to 19891,799 1970 to 19794,218 1960 to 19692,507 1950 to 19591,208 1940 to 19495,427 1939 or earlier
Zip code 19128 household income distribution in 2022 890 Less than $10,000276 $10,000 to $14,999261 $15,000 to $19,999425 $20,000 to $24,999584 $25,000 to $29,999742 $30,000 to $34,999391 $35,000 to $39,999472 $40,000 to $44,999450 $45,000 to $49,9991,378 $50,000 to $59,9991,889 $60,000 to $74,9992,904 $75,000 to $99,9991,945 $100,000 to $124,9991,808 $125,000 to $149,9991,913 $150,000 to $199,9992,143 $200,000 or moreEstimate of home value of owner-occupied houses/condos in 2022 in zip code 19128 42 Less than $10,0006 $15,000 to $19,99995 $20,000 to $24,99912 $25,000 to $29,99956 $30,000 to $34,99913 $35,000 to $39,99914 $50,000 to $59,99954 $70,000 to $79,99928 $80,000 to $89,9996 $90,000 to $99,999204 $100,000 to $124,999123 $125,000 to $149,999380 $150,000 to $174,999332 $175,000 to $199,9991,215 $200,000 to $249,9992,348 $250,000 to $299,9994,028 $300,000 to $399,9991,138 $400,000 to $499,999799 $500,000 to $749,999139 $750,000 to $999,99914 $1,000,000 to $1,499,99923 $2,000,000 or moreRent paid by renters in 2022 in zip code 19128 7 $100 to $14924 $200 to $24927 $250 to $29943 $300 to $34944 $350 to $39947 $400 to $44927 $500 to $549174 $550 to $599104 $600 to $64921 $650 to $69929 $700 to $74945 $750 to $799411 $800 to $899479 $900 to $999980 $1,000 to $1,2492,053 $1,250 to $1,4992,787 $1,500 to $1,999526 $2,000 to $2,49946 $2,500 to $2,9996 $3,000 to $3,49969 $3,500 or more267 No cash rent
Median gross rent in 2022: $1,513.
Median price asked for vacant for-sale houses and condos in 2022: $301,915.
Estimated median house (or condo) value in 2022 for: White Non-Hispanic householders: $331,516Black or African American householders: $338,423Asian householders: $359,143Some other race householders: $315,631Two or more races householders: $351,200Hispanic or Latino householders: $279,026Estimated median house or condo value in 2022: $330,481
19128:
$330,481Pennsylvania:
$245,500
Lower value quartile - upper value quartile: $268,829 - $404,482
Mean price in 2022: Detached houses: $408,485Here:
$408,485State:
$317,202
Townhouses or other attached units: $311,243Here:
$311,243State:
$254,369
In 2-unit structures: $340,872Here:
$340,872State:
$249,182
In 3-to-4-unit structures: $530,888Here:
$530,888State:
$297,446
In 5-or-more-unit structures: $153,607Here:
$153,607State:
$320,068
Housing units in structures:
One, detached: 3,007One, attached: 8,606Two: 1,3923 or 4: 1,0255 to 9: 1,25010 to 19: 62020 to 49: 1,13650 or more: 2,228Mobile homes: 234Boats, RVs, vans, etc.: 4Unemployment : 3.7%
Means of transportation to work in zip code 19128 59.3% 13,983 Drove a car alone4.2% 981 Carpooled4.9% 1,147 Bus or trolley bus1.0% 224 Streetcar or trolley car1.9% 450 Subway or elevated0.2% 42 Railroad0.1% 16 Motorcycle0.7% 161 Bicycle2.3% 535 Walked0.9% 210 Other means25.9% 6,110 Worked at homeTravel time to work (commute) in zip code 19128 350 Less than 5 minutes686 5 to 9 minutes1,627 10 to 14 minutes1,523 15 to 19 minutes2,368 20 to 24 minutes1,472 25 to 29 minutes3,871 30 to 34 minutes1,026 35 to 39 minutes1,227 40 to 44 minutes2,142 45 to 59 minutes1,543 60 to 89 minutes253 90 or more minutes
Neighborhoods in zip code 19128: Percentage of zip code residents living and working in this county: 69.3%
Household type by relationship:
Households: 38,330
Male householders: 8,851 (2,547 living alone ), Female householders: 9,661 (3,941 living alone )7,140 spouses (6,901 opposite-sex spouses ), 1,878 unmarried partners , (1,765 opposite-sex unmarried partners ), 7,042 children (6,702 natural , 132 adopted , 209 stepchildren ), 485 grandchildren , 198 brothers or sisters , 378 parents , 37 foster children , 140 other relatives , 2,048 non-relatives In group quarters: 541 (-1 institutionalized population )
Size of family households: 4,864 2-persons , 2,041 3-persons , 1,389 4-persons , 410 5-persons , 281 6-persons , 18 7-or-more-persons
Size of nonfamily households: 6,487 1-person , 2,749 2-persons , 268 3-persons , 147 4-persons , 33 5-persons
3,893 married couples with children. single-parent households (223 men , 737 women ).
89.6% of residents of 19128 zip code speak English at home. of residents speak Spanish at home (86% very well, 5% well, 6% not well, 3% not at all ).of residents speak other Indo-European language at home (74% very well, 23% well, 3% not well ).of residents speak Asian or Pacific Island language at home (67% very well, 27% well, 5% not well, 1% not at all ).of residents speak other language at home (91% very well, 9% well ).
Foreign born population: 2,389 (6.2%)
(50.8%
of them are naturalized citizens )
This zip code:
6.2%Whole state:
7.5%
11% Liberia 9% Japan 7% Sri Lanka 5% Greece 5% Bhutan 5% Honduras 4% Bolivia 15% Irish 13% Italian 7% German 6% Polish 4% English 4% American 2% European
Year of entry for the foreign-born population
1,393 2010 or later 524 2000 to 2009 264 1990 to 1999 890 Before 1990
There are
276 Other Medical Specialists in Zip Code 19128.
Facilities with environmental interests located in this zip code:
AWARDS CLEANERS (5711 RIDGE AVE in PHILADELPHIA, PA)
AIR MINOR (AIRS/AFS) Conditionally Exempt Small Quantity Generators, less than 100 kg/month of hazardous waste (Resource Conservation and Recovery Act (tracking hazardous waste)) Business SIC classification: COIN-OPERATED LAUNDRIES AND DRYCLEANINGOrganizations: HARVEY RUSSAKOFF (CONTACT/OPERATOR)
, RUSSAKOFF, LILLIAN (CONTACT/OWNER)
Alternative names: AWARD CLEANERS, AWARD CLNR SVC
AMOCO #60937 (5643 RIDGE AVENUE in PHILADELPHIA, PA)
Small Quantity Generators, between 100 kg and 1000 kg of hazardous waste/month (Resource Conservation and Recovery Act (tracking hazardous waste)) - notification Organizations: AMOCO OIL CO (CONTACT/OWNER)
Alternative names: AMOCO 60937 TANKS
Housing units lacking complete plumbing facilities: 0.9%
Housing units lacking complete kitchen facilities: 0.6%
75.1% Utility gas 17.3% Electricity 3.2% Fuel oil, kerosene, etc. 2.1% Bottled, tank, or LP gas 1.6% No fuel used
Population in 1990: 36,845.
Place of birth for U.S.-born residents:
This state: 25,392Northeast: 4,640Midwest: 1,733South: 2,532West: 1,081
62% of the 19128 zip code residents lived in the same house 5 years ago.
Out of people who lived in different houses, 60% lived in this county.
Out of people who lived in different counties, 50% lived in Pennsylvania.
86% of the 19128 zip code residents lived in the same house 1 year ago.
Out of people who lived in different houses, 50% moved from this county.
Out of people who lived in different houses, 20% moved from different county within same state.
Out of people who lived in different houses, 26% moved from different state.
Out of people who lived in different houses, 2% moved from abroad.
Private vs. public school enrollment:
Students in private schools in grades 1 to 8 (elementary and middle school): 781
Here:
43.1%Pennsylvania:
15.7%
Students in private schools in grades 9 to 12 (high school): 364
Here:
34.0%Pennsylvania:
13.4%
Students in private undergraduate colleges: 590
Here:
42.8%Pennsylvania:
39.8%
Occupation by median earnings in the past 12 months ($)
93,145 Law enforcement workers including supervisors 86,377 Computer and mathematical occupations 85,307 Health diagnosing and treating practitioners and other technical occupations 84,546 Management occupations 83,870 Life, physical, and social science occupations 81,955 Architecture and engineering occupations
Companies with federal contracts located in this zip code:
PROTECT-A-CHECK CORP (5460 RIDGE AVE in PHILADELPHIA, PA; small business)
$3,365 with Navy for Miscellaneous Office Machines. Signed on 2004-10-01. Completion date: 2004-10-01.
Top industries in this zip code by the number of employees in 2005:
Finance and Insurance: Savings Institutions (500-999 employees: 1 establishment, 20-49 employees: 3 establishments, 10-19 employees: 1 establishment, 5-9 employees: 2 establishments)Accommodation and Food Services: Full-Service Restaurants (50-99: 1, 20-49: 4, 10-19: 7, 5-9: 6, 1-4: 9)Health Care and Social Assistance: Nursing Care Facilities (250-499: 1, 1-4: 1)Health Care and Social Assistance: Continuing Care Retirement Communities (250-499: 1)Health Care and Social Assistance: Psychiatric and Substance Abuse Hospitals (250-499: 1)Accommodation and Food Services: Limited-Service Restaurants (50-99: 1, 20-49: 2, 10-19: 3, 5-9: 6, 1-4: 15)Health Care and Social Assistance: Residential Mental Retardation Facilities (10-19: 10, 5-9: 6, 1-4: 3)Health Care and Social Assistance: Offices of Physicians (except Mental Health Specialists) (20-49: 2, 10-19: 4, 5-9: 6, 1-4: 9)
People in group quarters in 2010:
158 people in nursing facilities/skilled-nursing facilities
142 people in group homes intended for adults
22 people in residential treatment centers for juveniles (non-correctional)
10 people in residential treatment centers for adults
9 people in other noninstitutional facilities
People in group quarters in 2000:
424 people in nursing homes
126 people in homes or halfway houses for drug/alcohol abuse
68 people in other noninstitutional group quarters
67 people in other group homes
39 people in schools, hospitals, or wards for the intellectually disabled
16 people in homes for the mentally retarded
16 people in religious group quarters
12 people in homes for the physically handicapped
9 people in mental (psychiatric) hospitals or wards
6 people in other nonhousehold living situations
Fatal accident statistics in 2012:
Fatal accident count: 2Vehicles involved in fatal accidents: 3Fatal accidents caused by drunken drivers: 0Fatalities: 2Persons involved in fatal accidents: 3Pedestrians involved in fatal accidents: 1
Fatal accident statistics in 2011:
Fatal accident count: 3Vehicles involved in fatal accidents: 12Fatal accidents caused by drunken drivers: 1Fatalities: 3Persons involved in fatal accidents: 6Pedestrians involved in fatal accidents: 1
Home Mortgage Disclosure Act Aggregated Statistics For Year 2009(Based on 13 full and 14 partial tracts) A) FHA, FSA/RHS & VA B) Conventional C) Refinancings D) Home Improvement Loans E) Loans on Dwellings For 5+ Families F) Non-occupant Loans on G) Loans On Manufactured Number Average Value Number Average Value Number Average Value Number Average Value Number Average Value Number Average Value Number Average Value
LOANS ORIGINATED 343 $223,042 374 $209,305 1,512 $186,780 141 $72,873 12 $5,422,762 170 $186,857 0 $0 APPLICATIONS APPROVED, NOT ACCEPTED 19 $218,858 29 $181,275 115 $185,471 8 $92,081 2 $75,000 6 $275,083 0 $0 APPLICATIONS DENIED 28 $217,984 45 $173,181 431 $205,640 115 $57,302 4 $29,322,550 63 $174,825 4 $77,222 APPLICATIONS WITHDRAWN 31 $229,329 54 $215,689 435 $192,432 15 $108,159 1 $625,800 27 $207,220 0 $0 FILES CLOSED FOR INCOMPLETENESS 5 $217,554 12 $230,423 72 $208,395 1 $243,370 0 $0 9 $166,097 0 $0
Aggregated Statistics For Year 2008(Based on 13 full and 14 partial tracts) A) FHA, FSA/RHS & VA B) Conventional C) Refinancings D) Home Improvement Loans E) Loans on Dwellings For 5+ Families F) Non-occupant Loans on G) Loans On Manufactured Number Average Value Number Average Value Number Average Value Number Average Value Number Average Value Number Average Value Number Average Value
LOANS ORIGINATED 154 $227,110 649 $215,551 948 $165,477 197 $55,156 9 $300,759 215 $183,639 5 $77,822 APPLICATIONS APPROVED, NOT ACCEPTED 8 $229,760 80 $234,165 132 $155,652 39 $42,141 0 $0 24 $192,847 0 $0 APPLICATIONS DENIED 5 $242,630 104 $228,949 469 $189,465 152 $58,455 1 $284,450 75 $163,657 2 $50,000 APPLICATIONS WITHDRAWN 16 $222,578 78 $221,464 246 $186,808 21 $84,435 0 $0 34 $200,683 2 $174,615 FILES CLOSED FOR INCOMPLETENESS 4 $282,305 20 $203,278 54 $197,595 8 $35,318 0 $0 13 $167,292 0 $0
Aggregated Statistics For Year 2007(Based on 13 full and 14 partial tracts) A) FHA, FSA/RHS & VA B) Conventional C) Refinancings D) Home Improvement Loans E) Loans on Dwellings For 5+ Families F) Non-occupant Loans on G) Loans On Manufactured Number Average Value Number Average Value Number Average Value Number Average Value Number Average Value Number Average Value Number Average Value
LOANS ORIGINATED 39 $222,257 1,118 $176,926 1,091 $146,737 358 $50,794 15 $5,459,408 287 $166,836 0 $0 APPLICATIONS APPROVED, NOT ACCEPTED 1 $189,000 77 $172,104 219 $145,769 53 $68,687 1 $380,490 41 $150,220 0 $0 APPLICATIONS DENIED 1 $294,580 168 $196,241 639 $169,004 224 $48,277 0 $0 117 $140,571 2 $71,295 APPLICATIONS WITHDRAWN 1 $315,960 113 $190,340 308 $161,992 42 $62,586 0 $0 45 $178,051 0 $0 FILES CLOSED FOR INCOMPLETENESS 0 $0 29 $164,319 76 $194,541 7 $113,207 0 $0 6 $167,032 0 $0
Aggregated Statistics For Year 2006(Based on 13 full and 14 partial tracts) A) FHA, FSA/RHS & VA B) Conventional C) Refinancings D) Home Improvement Loans E) Loans on Dwellings For 5+ Families F) Non-occupant Loans on G) Loans On Manufactured Number Average Value Number Average Value Number Average Value Number Average Value Number Average Value Number Average Value Number Average Value
LOANS ORIGINATED 34 $223,321 1,430 $157,707 1,331 $134,511 450 $63,935 14 $4,332,202 373 $158,918 2 $122,540 APPLICATIONS APPROVED, NOT ACCEPTED 2 $171,430 160 $152,368 265 $134,110 76 $59,040 0 $0 44 $146,496 1 $48,000 APPLICATIONS DENIED 1 $138,000 179 $187,808 629 $162,945 253 $39,353 0 $0 89 $144,870 0 $0 APPLICATIONS WITHDRAWN 4 $253,390 161 $167,925 414 $164,624 40 $80,610 3 $1,664,737 42 $165,358 0 $0 FILES CLOSED FOR INCOMPLETENESS 0 $0 36 $177,285 137 $187,073 22 $52,662 0 $0 14 $160,201 0 $0
Aggregated Statistics For Year 2005(Based on 13 full and 14 partial tracts) A) FHA, FSA/RHS & VA B) Conventional C) Refinancings D) Home Improvement Loans E) Loans on Dwellings For 5+ Families F) Non-occupant Loans on G) Loans On Manufactured Number Average Value Number Average Value Number Average Value Number Average Value Number Average Value Number Average Value Number Average Value
LOANS ORIGINATED 24 $177,742 1,735 $155,171 1,741 $136,538 454 $57,572 9 $1,489,092 487 $147,370 5 $155,770 APPLICATIONS APPROVED, NOT ACCEPTED 1 $204,700 182 $162,061 301 $116,863 71 $61,661 0 $0 69 $150,668 1 $70,000 APPLICATIONS DENIED 0 $0 215 $169,148 633 $141,836 288 $42,285 0 $0 143 $87,331 2 $32,910 APPLICATIONS WITHDRAWN 1 $218,000 218 $161,965 419 $144,779 101 $134,639 1 $120,000 90 $157,563 1 $70,350 FILES CLOSED FOR INCOMPLETENESS 0 $0 36 $162,724 211 $150,893 15 $42,256 0 $0 14 $144,710 2 $54,270
Aggregated Statistics For Year 2004(Based on 13 full and 14 partial tracts) A) FHA, FSA/RHS & VA B) Conventional C) Refinancings D) Home Improvement Loans E) Loans on Dwellings For 5+ Families F) Non-occupant Loans on G) Loans On Manufactured Number Average Value Number Average Value Number Average Value Number Average Value Number Average Value Number Average Value Number Average Value
LOANS ORIGINATED 36 $156,619 1,246 $143,817 1,770 $118,059 399 $50,272 9 $4,276,677 493 $117,790 2 $88,405 APPLICATIONS APPROVED, NOT ACCEPTED 3 $168,493 145 $164,843 310 $113,242 78 $51,126 0 $0 59 $139,094 1 $1,000 APPLICATIONS DENIED 3 $205,343 162 $170,450 634 $121,790 288 $40,445 2 $4,601,260 138 $95,469 2 $10,455 APPLICATIONS WITHDRAWN 4 $121,560 129 $145,167 446 $119,100 68 $60,525 1 $160,080 45 $122,126 1 $58,000 FILES CLOSED FOR INCOMPLETENESS 0 $0 46 $165,072 241 $131,791 10 $50,126 0 $0 19 $139,009 0 $0
Aggregated Statistics For Year 2003(Based on 13 full and 14 partial tracts) A) FHA, FSA/RHS & VA B) Conventional C) Refinancings D) Home Improvement Loans E) Loans on Dwellings For 5+ Families F) Non-occupant Loans on Number Average Value Number Average Value Number Average Value Number Average Value Number Average Value Number Average Value
LOANS ORIGINATED 46 $142,478 1,041 $124,953 3,226 $106,614 361 $55,163 8 $1,422,156 557 $101,617 APPLICATIONS APPROVED, NOT ACCEPTED 4 $152,628 80 $134,029 447 $97,131 66 $44,067 1 $203,460 47 $101,878 APPLICATIONS DENIED 3 $152,333 108 $141,347 923 $110,112 209 $37,479 0 $0 103 $93,218 APPLICATIONS WITHDRAWN 3 $113,463 107 $139,215 516 $101,354 55 $61,017 0 $0 58 $105,012 FILES CLOSED FOR INCOMPLETENESS 1 $164,000 27 $124,241 144 $107,884 19 $45,844 0 $0 7 $82,639
Aggregated Statistics For Year 2002(Based on 13 full and 14 partial tracts) A) FHA, FSA/RHS & VA B) Conventional C) Refinancings D) Home Improvement Loans E) Loans on Dwellings For 5+ Families F) Non-occupant Loans on Number Average Value Number Average Value Number Average Value Number Average Value Number Average Value Number Average Value
LOANS ORIGINATED 63 $602,461 887 $619,626 1,843 $156,654 302 $38,201 13 $555,561 440 $409,407 APPLICATIONS APPROVED, NOT ACCEPTED 1 $144,000 54 $116,159 323 $91,041 80 $30,478 0 $0 55 $88,224 APPLICATIONS DENIED 3 $75,270 75 $118,598 661 $94,621 117 $30,774 2 $214,970 63 $90,211 APPLICATIONS WITHDRAWN 7 $79,454 55 $2,184,845 320 $132,442 27 $31,333 0 $0 36 $95,221 FILES CLOSED FOR INCOMPLETENESS 0 $0 28 $115,229 163 $215,391 9 $21,486 0 $0 13 $86,506
Aggregated Statistics For Year 2001(Based on 13 full and 14 partial tracts) A) FHA, FSA/RHS & VA B) Conventional C) Refinancings D) Home Improvement Loans E) Loans on Dwellings For 5+ Families F) Non-occupant Loans on Number Average Value Number Average Value Number Average Value Number Average Value Number Average Value Number Average Value
LOANS ORIGINATED 104 $102,133 745 $94,700 1,176 $93,520 234 $28,640 6 $889,168 368 $81,254 APPLICATIONS APPROVED, NOT ACCEPTED 5 $75,644 49 $101,675 169 $74,905 42 $27,034 0 $0 27 $80,320 APPLICATIONS DENIED 4 $84,750 52 $87,047 453 $75,874 143 $24,931 0 $0 43 $66,927 APPLICATIONS WITHDRAWN 4 $107,310 34 $102,175 217 $74,146 53 $23,528 0 $0 19 $71,707 FILES CLOSED FOR INCOMPLETENESS 2 $77,815 9 $86,981 100 $94,720 15 $24,765 0 $0 7 $68,179
Aggregated Statistics For Year 2000(Based on 13 full and 14 partial tracts) A) FHA, FSA/RHS & VA B) Conventional C) Refinancings D) Home Improvement Loans E) Loans on Dwellings For 5+ Families F) Non-occupant Loans on Number Average Value Number Average Value Number Average Value Number Average Value Number Average Value Number Average Value
LOANS ORIGINATED 119 $90,427 753 $97,442 385 $65,131 210 $27,068 1 $525,590 216 $80,094 APPLICATIONS APPROVED, NOT ACCEPTED 2 $86,725 62 $101,367 134 $56,461 56 $18,841 0 $0 26 $59,285 APPLICATIONS DENIED 6 $101,835 78 $86,855 318 $62,190 181 $19,591 0 $0 57 $61,249 APPLICATIONS WITHDRAWN 6 $82,215 88 $118,012 178 $51,595 26 $36,537 0 $0 25 $76,398 FILES CLOSED FOR INCOMPLETENESS 3 $89,333 13 $105,746 44 $74,243 9 $25,170 0 $0 4 $73,125
Aggregated Statistics For Year 1999(Based on 9 full and 7 partial tracts) A) FHA, FSA/RHS & VA B) Conventional C) Refinancings D) Home Improvement Loans E) Loans on Dwellings For 5+ Families F) Non-occupant Loans on Number Average Value Number Average Value Number Average Value Number Average Value Number Average Value Number Average Value
LOANS ORIGINATED 97 $87,773 387 $84,628 463 $67,959 168 $27,787 1 $2,386,760 129 $66,553 APPLICATIONS APPROVED, NOT ACCEPTED 1 $69,000 27 $77,599 126 $63,984 34 $26,990 0 $0 11 $55,715 APPLICATIONS DENIED 5 $92,684 52 $84,307 237 $63,125 73 $21,798 1 $24,460 30 $53,000 APPLICATIONS WITHDRAWN 8 $87,199 56 $73,975 179 $66,474 23 $32,641 0 $0 23 $74,657 FILES CLOSED FOR INCOMPLETENESS 0 $0 10 $68,519 45 $72,572 1 $6,900 0 $0 6 $91,508
Private Mortgage Insurance Companies Aggregated Statistics For Year 2009(Based on 13 full and 12 partial tracts) A) Conventional B) Refinancings C) Non-occupant Loans on Number Average Value Number Average Value Number Average Value
LOANS ORIGINATED 126 $223,039 62 $234,837 0 $0 APPLICATIONS APPROVED, NOT ACCEPTED 20 $229,540 21 $259,814 1 $168,510 APPLICATIONS DENIED 11 $269,750 6 $202,487 1 $172,230 APPLICATIONS WITHDRAWN 9 $175,131 8 $236,034 0 $0 FILES CLOSED FOR INCOMPLETENESS 4 $169,525 2 $151,000 0 $0
Aggregated Statistics For Year 2008(Based on 13 full and 14 partial tracts) A) Conventional B) Refinancings C) Non-occupant Loans on Number Average Value Number Average Value Number Average Value
LOANS ORIGINATED 263 $231,610 78 $232,777 13 $183,019 APPLICATIONS APPROVED, NOT ACCEPTED 64 $233,343 39 $235,777 14 $205,403 APPLICATIONS DENIED 19 $311,695 6 $234,500 7 $218,559 APPLICATIONS WITHDRAWN 14 $219,771 3 $236,430 0 $0 FILES CLOSED FOR INCOMPLETENESS 5 $226,072 0 $0 3 $198,380
Aggregated Statistics For Year 2007(Based on 13 full and 14 partial tracts) A) Conventional B) Refinancings C) Non-occupant Loans on Number Average Value Number Average Value Number Average Value
LOANS ORIGINATED 290 $213,594 87 $238,171 34 $192,399 APPLICATIONS APPROVED, NOT ACCEPTED 46 $216,780 23 $212,000 11 $270,920 APPLICATIONS DENIED 3 $269,440 1 $296,340 0 $0 APPLICATIONS WITHDRAWN 16 $223,716 4 $271,148 5 $278,914 FILES CLOSED FOR INCOMPLETENESS 1 $112,340 1 $281,610 0 $0
Aggregated Statistics For Year 2006(Based on 13 full and 14 partial tracts) A) Conventional B) Refinancings C) Non-occupant Loans on Number Average Value Number Average Value Number Average Value
LOANS ORIGINATED 197 $208,700 32 $228,228 16 $188,201 APPLICATIONS APPROVED, NOT ACCEPTED 48 $176,985 21 $206,448 8 $161,221 APPLICATIONS DENIED 1 $272,850 3 $274,333 0 $0 APPLICATIONS WITHDRAWN 12 $169,043 7 $214,933 2 $197,640 FILES CLOSED FOR INCOMPLETENESS 2 $263,370 0 $0 0 $0
Aggregated Statistics For Year 2005(Based on 13 full and 14 partial tracts) A) Conventional B) Refinancings C) Non-occupant Loans on Number Average Value Number Average Value Number Average Value
LOANS ORIGINATED 285 $188,602 40 $197,128 49 $162,159 APPLICATIONS APPROVED, NOT ACCEPTED 67 $202,528 14 $167,840 14 $170,019 APPLICATIONS DENIED 0 $0 0 $0 0 $0 APPLICATIONS WITHDRAWN 18 $193,384 0 $0 5 $174,866 FILES CLOSED FOR INCOMPLETENESS 4 $144,688 0 $0 0 $0
Aggregated Statistics For Year 2004(Based on 13 full and 14 partial tracts) A) Conventional B) Refinancings C) Non-occupant Loans on Number Average Value Number Average Value Number Average Value
LOANS ORIGINATED 338 $155,571 66 $136,354 67 $141,130 APPLICATIONS APPROVED, NOT ACCEPTED 45 $143,564 16 $125,844 6 $149,228 APPLICATIONS DENIED 3 $138,557 3 $177,183 4 $132,002 APPLICATIONS WITHDRAWN 15 $150,125 3 $153,597 0 $0 FILES CLOSED FOR INCOMPLETENESS 6 $143,377 1 $63,660 4 $164,910
Aggregated Statistics For Year 2003(Based on 13 full and 14 partial tracts) A) Conventional B) Refinancings C) Non-occupant Loans on Number Average Value Number Average Value Number Average Value
LOANS ORIGINATED 367 $134,801 146 $127,727 55 $108,080 APPLICATIONS APPROVED, NOT ACCEPTED 66 $133,408 39 $117,810 12 $133,895 APPLICATIONS DENIED 8 $93,690 1 $147,690 5 $104,638 APPLICATIONS WITHDRAWN 14 $130,583 17 $88,848 2 $64,065 FILES CLOSED FOR INCOMPLETENESS 0 $0 0 $0 0 $0
Aggregated Statistics For Year 2002(Based on 13 full and 14 partial tracts) A) Conventional B) Refinancings C) Non-occupant Loans on Number Average Value Number Average Value Number Average Value
LOANS ORIGINATED 462 $117,954 122 $118,431 115 $101,957 APPLICATIONS APPROVED, NOT ACCEPTED 62 $114,869 28 $120,630 15 $102,104 APPLICATIONS DENIED 10 $116,797 5 $96,888 8 $96,124 APPLICATIONS WITHDRAWN 21 $139,776 12 $134,637 8 $106,241 FILES CLOSED FOR INCOMPLETENESS 0 $0 2 $263,385 0 $0
Aggregated Statistics For Year 2001(Based on 13 full and 12 partial tracts) A) Conventional B) Refinancings C) Non-occupant Loans on Number Average Value Number Average Value Number Average Value
LOANS ORIGINATED 369 $100,627 100 $119,415 73 $82,935 APPLICATIONS APPROVED, NOT ACCEPTED 32 $107,712 14 $99,294 7 $73,900 APPLICATIONS DENIED 10 $86,572 4 $149,560 5 $80,314 APPLICATIONS WITHDRAWN 7 $120,047 5 $122,344 3 $115,243 FILES CLOSED FOR INCOMPLETENESS 0 $0 1 $210,270 0 $0
Aggregated Statistics For Year 2000(Based on 13 full and 14 partial tracts) A) Conventional B) Refinancings C) Non-occupant Loans on Number Average Value Number Average Value Number Average Value
LOANS ORIGINATED 264 $106,101 28 $82,684 49 $79,337 APPLICATIONS APPROVED, NOT ACCEPTED 36 $112,972 3 $115,470 6 $48,098 APPLICATIONS DENIED 10 $82,417 1 $89,870 3 $55,533 APPLICATIONS WITHDRAWN 9 $137,351 0 $0 0 $0 FILES CLOSED FOR INCOMPLETENESS 0 $0 0 $0 0 $0
Aggregated Statistics For Year 1999(Based on 9 full and 7 partial tracts) A) Conventional B) Refinancings C) Non-occupant Loans on Number Average Value Number Average Value Number Average Value
LOANS ORIGINATED 146 $90,021 47 $83,741 17 $75,989 APPLICATIONS APPROVED, NOT ACCEPTED 13 $86,997 9 $80,634 1 $81,510 APPLICATIONS DENIED 7 $105,077 2 $77,235 3 $61,127 APPLICATIONS WITHDRAWN 4 $77,710 2 $56,165 2 $79,310 FILES CLOSED FOR INCOMPLETENESS 0 $0 1 $79,390 0 $0
2010 - 2018 National Fire Incident Reporting System (NFIRS) incidents See full 2006 National Fire Incident Reporting System statistics for zip code 19128, Pennsylvania
Most common first names in zip code 19128 among deceased individuals Name Count Lived (average)
John 627 73.9 years Mary 571 80.8 years Joseph 552 74.1 years William 435 74.9 years Anna 353 81.2 years Helen 304 79.7 years James 302 72.0 years Margaret 288 78.2 years Charles 260 74.7 years Elizabeth 247 79.5 years
Most common last names in zip code 19128 among deceased individuals Last name Count Lived (average)
Smith 118 74.5 years Miller 90 76.9 years Brown 57 77.4 years Jones 56 76.9 years Gallagher 51 73.4 years Robinson 44 77.8 years Moore 41 78.6 years Williams 40 75.4 years Johnson 39 78.1 years Martin 38 75.0 years
Businesses in zip code 19128
Name Count Name Count
7-Eleven 3 McDonald's 1 AT&T 1 Nike 2 Applebee's 1 Papa John's Pizza 1 AutoZone 1 Payless 1 Baskin-Robbins 1 Penske 1 Blockbuster 1 Quiznos 1 CVS 3 RadioShack 1 Cricket Wireless 1 Rite Aid 2 DHL 1 Staples 1 Dunkin Donuts 3 Starbucks 1 FedEx 3 Subway 1 GNC 2 Superfresh 1 GameStop 1 T-Mobile 1 H&R Block 1 True Value 1 Jones New York 1 U-Haul 2 Kohl's 1 UPS 6 LA Fitness 1 YMCA 1

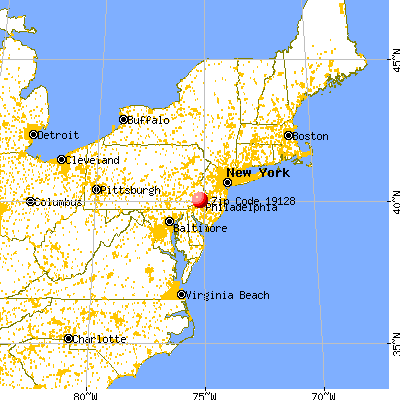


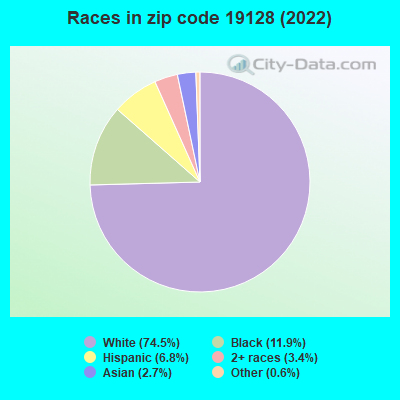


 Nearest zip codes: 19127, 19118, 19119, 19072, 19004, 19444.
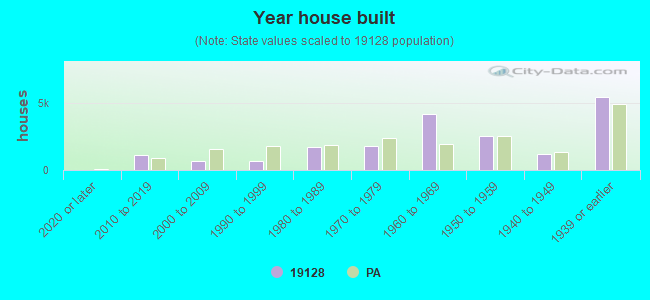
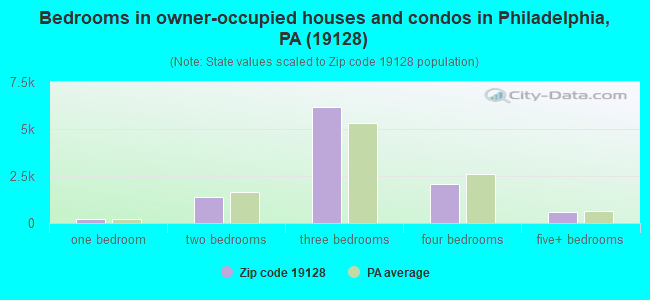
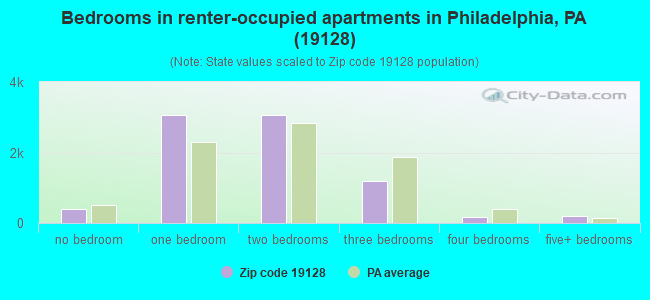
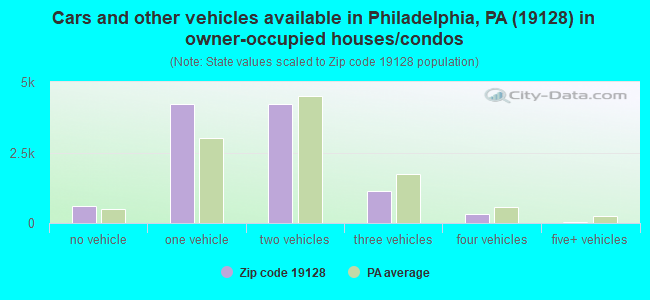
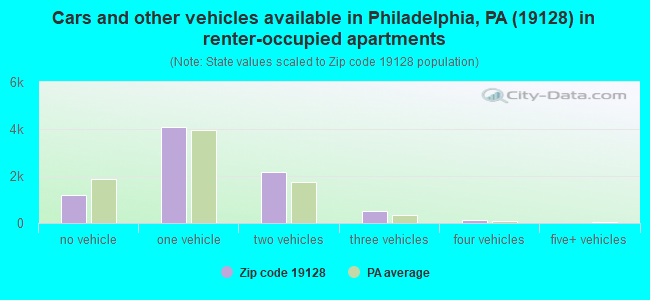


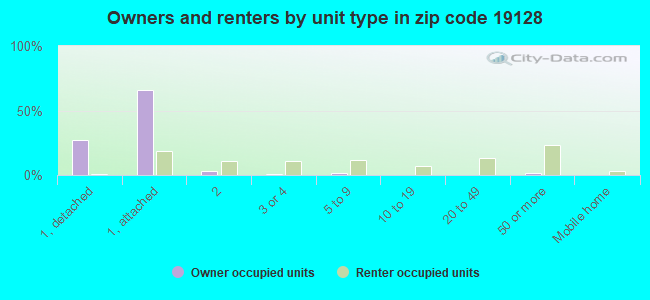
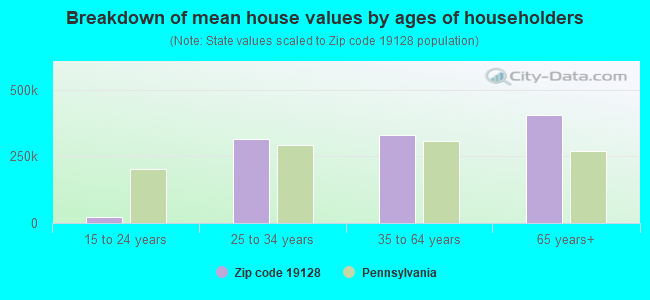


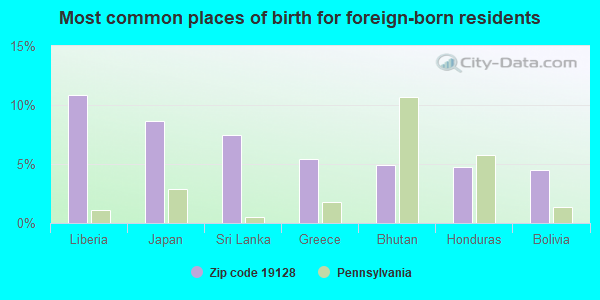
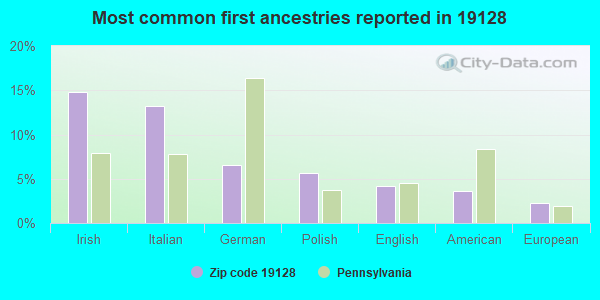
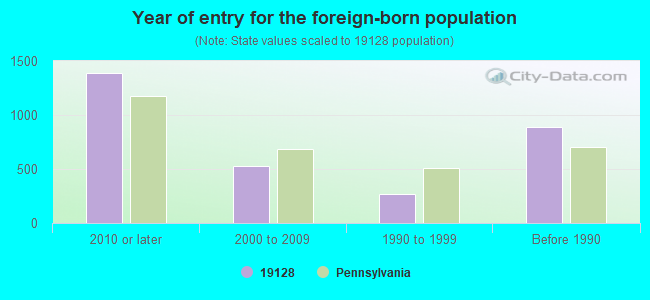


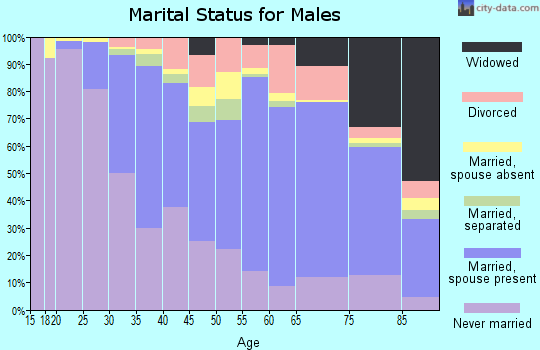
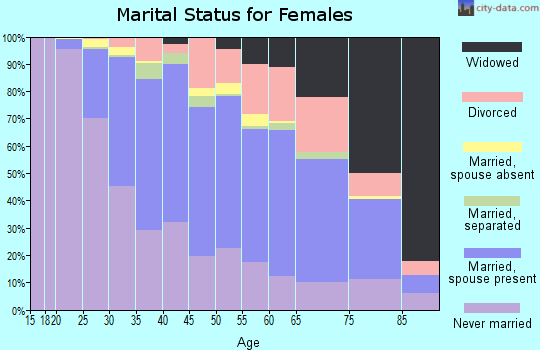
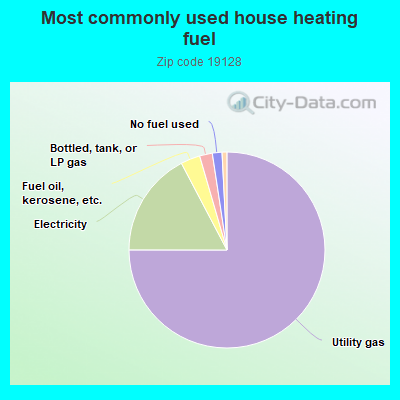
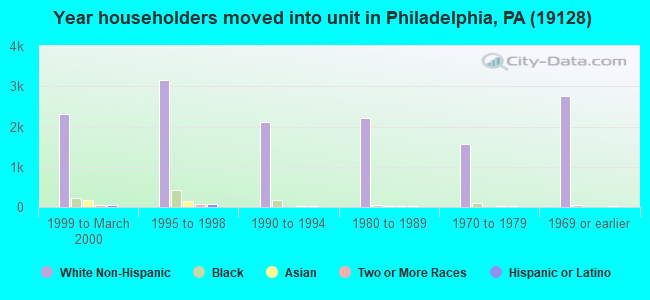
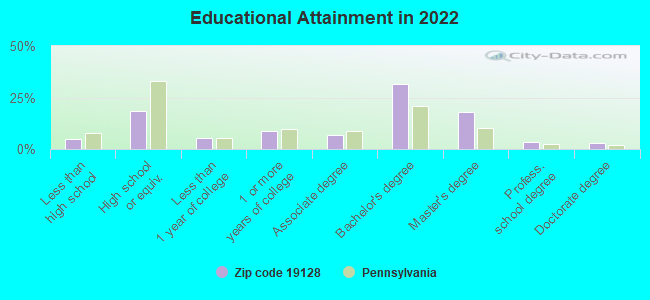
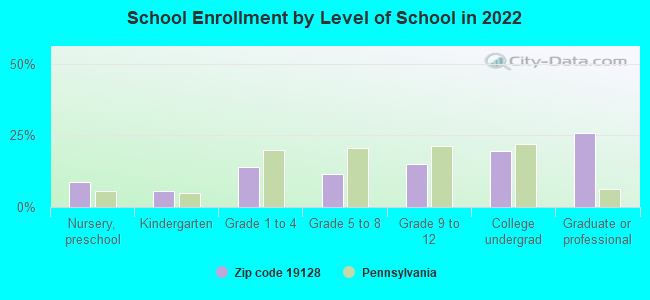
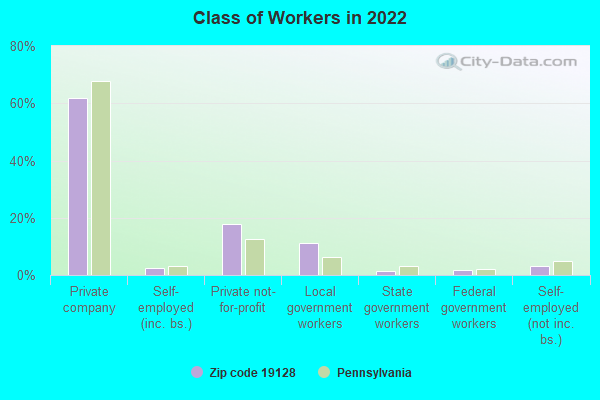
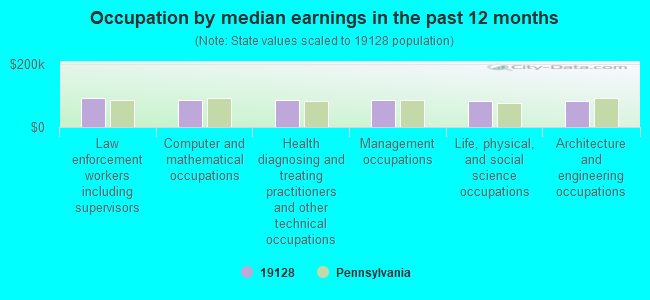
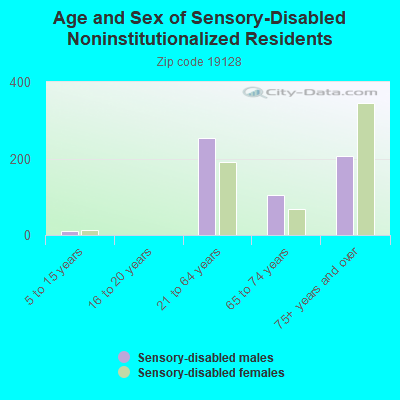
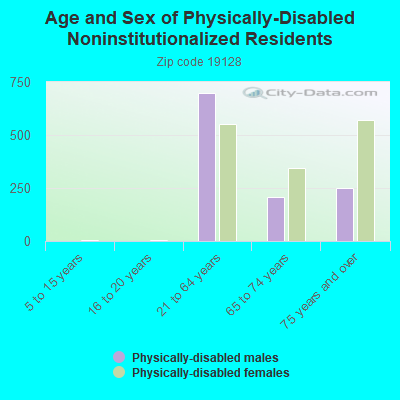
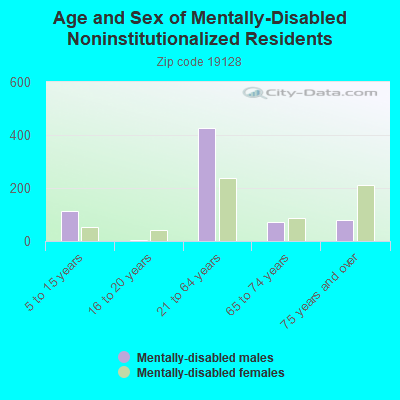

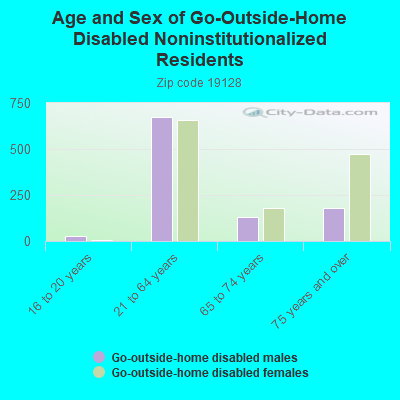
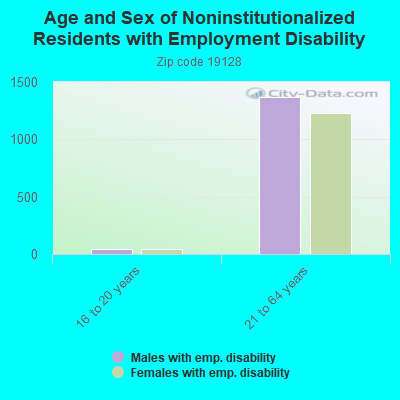
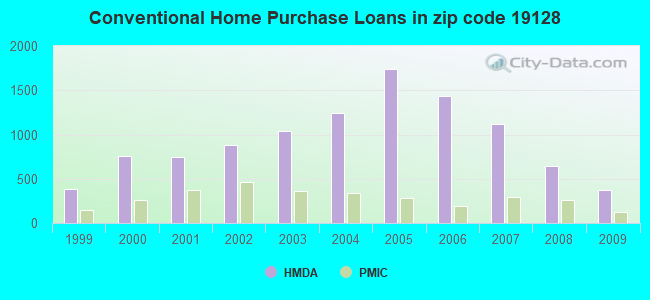
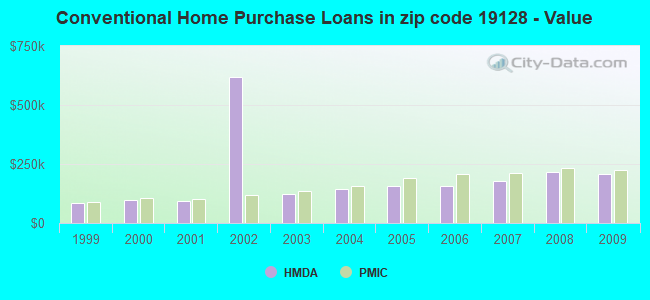
 According to the data from the years 2010 - 2018 the average number of fire incidents per year is 76. The highest number of reported fires - 116 took place in 2018, and the least - 0 in 2016. The data has a growing trend.
 When looking into fire subcategories, the most reports belonged to: Outside Fires (43.3%), and Structure Fires (41.2%).