Estimated zip code population in 2022: 11,354
Zip code population in 2010: 10,975
Zip code population in 2000: 10,748
Houses and condos: 5,890
Renter-occupied apartments: 2,766
% of renters here:
50%State:
31%
March 2022 cost of living index in zip code 19129: 104.9
(near average, U.S. average is 100)
Land area: 2.2
sq. mi.
Water area: 0.1
sq. mi.
Population density: 5,164 people per square mile (average).
OSM Map
General Map
Google Map
MSN Map
OSM Map
General Map
Google Map
MSN Map
OSM Map
General Map
Google Map
MSN Map
OSM Map
General Map
Google Map
MSN Map
Please wait while loading the map...
Real estate property taxes paid for housing units in 2022:
This zip code:
1.0% ($3,092)Pennsylvania:
1.3% ($3,094)
Median real estate property taxes paid for housing units with mortgages in 2022: $3,198 (0.9%)
Median real estate property taxes paid for housing units with no mortgage in 2022: $2,742 (1.1%)
Profiles of local businesses
Business Search - 14 Million verified businesses
Males: 5,582 Females: 5,772
For population 25 years and over in 19129:
High school or higher: 98.5%Bachelor's degree or higher: 65.0%Graduate or professional degree: 32.8%Unemployed: 5.3%Mean travel time to work (commute): 33.1 minutes
For population 15 years and over in 19129:
Never married: 46.2%Now married: 42.5%Separated: 2.0%Widowed: 3.0%Divorced: 6.4%
Zip code 19129 compared to state average:
Black race population percentage above state average. Median age below state average. Renting percentage above state average. Number of college students above state average. Percentage of population with a bachelor's degree or higher above state average. 6,420 56.6% White 3,211 28.3% Black 737 6.5% Two or more races 556 4.9% Hispanic or Latino 379 3.3% Asian 23 0.2% American Indian 25 0.2% Some other race
Data:
Median household income ($)
Median household income (% change since 2000)
Household income diversity
Ratio of average income to average house value (%)
Ratio of average income to average rent
Median household income ($) - White
Median household income ($) - Black or African American
Median household income ($) - Asian
Median household income ($) - Hispanic or Latino
Median household income ($) - American Indian and Alaska Native
Median household income ($) - Multirace
Median household income ($) - Other Race
Median household income for houses/condos with a mortgage ($)
Median household income for apartments without a mortgage ($)
Races - White alone (%)
Races - White alone (% change since 2000)
Races - Black alone (%)
Races - Black alone (% change since 2000)
Races - American Indian alone (%)
Races - American Indian alone (% change since 2000)
Races - Asian alone (%)
Races - Asian alone (% change since 2000)
Races - Hispanic (%)
Races - Hispanic (% change since 2000)
Races - Native Hawaiian and Other Pacific Islander alone (%)
Races - Native Hawaiian and Other Pacific Islander alone (% change since 2000)
Races - Two or more races (%)
Races - Two or more races (% change since 2000)
Races - Other race alone (%)
Races - Other race alone (% change since 2000)
Racial diversity
Unemployment (%)
Unemployment (% change since 2000)
Unemployment (%) - White
Unemployment (%) - Black or African American
Unemployment (%) - Asian
Unemployment (%) - Hispanic or Latino
Unemployment (%) - American Indian and Alaska Native
Unemployment (%) - Multirace
Unemployment (%) - Other Race
Population density (people per square mile)
Population - Males (%)
Population - Females (%)
Population - Males (%) - White
Population - Males (%) - Black or African American
Population - Males (%) - Asian
Population - Males (%) - Hispanic or Latino
Population - Males (%) - American Indian and Alaska Native
Population - Males (%) - Multirace
Population - Males (%) - Other Race
Population - Females (%) - White
Population - Females (%) - Black or African American
Population - Females (%) - Asian
Population - Females (%) - Hispanic or Latino
Population - Females (%) - American Indian and Alaska Native
Population - Females (%) - Multirace
Population - Females (%) - Other Race
Coronavirus confirmed cases (Apr 27, 2024)
Deaths caused by coronavirus (Apr 27, 2024)
Coronavirus confirmed cases (per 100k population) (Apr 27, 2024)
Deaths caused by coronavirus (per 100k population) (Apr 27, 2024)
Daily increase in number of cases (Apr 27, 2024)
Weekly increase in number of cases (Apr 27, 2024)
Cases doubled (in days) (Apr 27, 2024)
Hospitalized patients (Apr 18, 2022)
Negative test results (Apr 18, 2022)
Total test results (Apr 18, 2022)
COVID Vaccine doses distributed (per 100k population) (Sep 19, 2023)
COVID Vaccine doses administered (per 100k population) (Sep 19, 2023)
COVID Vaccine doses distributed (Sep 19, 2023)
COVID Vaccine doses administered (Sep 19, 2023)
Likely homosexual households (%)
Likely homosexual households (% change since 2000)
Likely homosexual households - Lesbian couples (%)
Likely homosexual households - Lesbian couples (% change since 2000)
Likely homosexual households - Gay men (%)
Likely homosexual households - Gay men (% change since 2000)
Cost of living index
Median gross rent ($)
Median contract rent ($)
Median monthly housing costs ($)
Median house or condo value ($)
Median house or condo value ($ change since 2000)
Mean house or condo value by units in structure - 1, detached ($)
Mean house or condo value by units in structure - 1, attached ($)
Mean house or condo value by units in structure - 2 ($)
Mean house or condo value by units in structure by units in structure - 3 or 4 ($)
Mean house or condo value by units in structure - 5 or more ($)
Mean house or condo value by units in structure - Boat, RV, van, etc. ($)
Mean house or condo value by units in structure - Mobile home ($)
Median house or condo value ($) - White
Median house or condo value ($) - Black or African American
Median house or condo value ($) - Asian
Median house or condo value ($) - Hispanic or Latino
Median house or condo value ($) - American Indian and Alaska Native
Median house or condo value ($) - Multirace
Median house or condo value ($) - Other Race
Median resident age
Resident age diversity
Median resident age - Males
Median resident age - Females
Median resident age - White
Median resident age - Black or African American
Median resident age - Asian
Median resident age - Hispanic or Latino
Median resident age - American Indian and Alaska Native
Median resident age - Multirace
Median resident age - Other Race
Median resident age - Males - White
Median resident age - Males - Black or African American
Median resident age - Males - Asian
Median resident age - Males - Hispanic or Latino
Median resident age - Males - American Indian and Alaska Native
Median resident age - Males - Multirace
Median resident age - Males - Other Race
Median resident age - Females - White
Median resident age - Females - Black or African American
Median resident age - Females - Asian
Median resident age - Females - Hispanic or Latino
Median resident age - Females - American Indian and Alaska Native
Median resident age - Females - Multirace
Median resident age - Females - Other Race
Commute - mean travel time to work (minutes)
Travel time to work - Less than 5 minutes (%)
Travel time to work - Less than 5 minutes (% change since 2000)
Travel time to work - 5 to 9 minutes (%)
Travel time to work - 5 to 9 minutes (% change since 2000)
Travel time to work - 10 to 19 minutes (%)
Travel time to work - 10 to 19 minutes (% change since 2000)
Travel time to work - 20 to 29 minutes (%)
Travel time to work - 20 to 29 minutes (% change since 2000)
Travel time to work - 30 to 39 minutes (%)
Travel time to work - 30 to 39 minutes (% change since 2000)
Travel time to work - 40 to 59 minutes (%)
Travel time to work - 40 to 59 minutes (% change since 2000)
Travel time to work - 60 to 89 minutes (%)
Travel time to work - 60 to 89 minutes (% change since 2000)
Travel time to work - 90 or more minutes (%)
Travel time to work - 90 or more minutes (% change since 2000)
Marital status - Never married (%)
Marital status - Now married (%)
Marital status - Separated (%)
Marital status - Widowed (%)
Marital status - Divorced (%)
Median family income ($)
Median family income (% change since 2000)
Median non-family income ($)
Median non-family income (% change since 2000)
Median per capita income ($)
Median per capita income (% change since 2000)
Median family income ($) - White
Median family income ($) - Black or African American
Median family income ($) - Asian
Median family income ($) - Hispanic or Latino
Median family income ($) - American Indian and Alaska Native
Median family income ($) - Multirace
Median family income ($) - Other Race
Median year house/condo built
Median year apartment built
Year house built - Built 2005 or later (%)
Year house built - Built 2000 to 2004 (%)
Year house built - Built 1990 to 1999 (%)
Year house built - Built 1980 to 1989 (%)
Year house built - Built 1970 to 1979 (%)
Year house built - Built 1960 to 1969 (%)
Year house built - Built 1950 to 1959 (%)
Year house built - Built 1940 to 1949 (%)
Year house built - Built 1939 or earlier (%)
Average household size
Household density (households per square mile)
Average household size - White
Average household size - Black or African American
Average household size - Asian
Average household size - Hispanic or Latino
Average household size - American Indian and Alaska Native
Average household size - Multirace
Average household size - Other Race
Occupied housing units (%)
Vacant housing units (%)
Owner occupied housing units (%)
Renter occupied housing units (%)
Vacancy status - For rent (%)
Vacancy status - For sale only (%)
Vacancy status - Rented or sold, not occupied (%)
Vacancy status - For seasonal, recreational, or occasional use (%)
Vacancy status - For migrant workers (%)
Vacancy status - Other vacant (%)
Residents with income below the poverty level (%)
Residents with income below 50% of the poverty level (%)
Children below poverty level (%)
Poor families by family type - Married-couple family (%)
Poor families by family type - Male, no wife present (%)
Poor families by family type - Female, no husband present (%)
Poverty status for native-born residents (%)
Poverty status for foreign-born residents (%)
Poverty among high school graduates not in families (%)
Poverty among people who did not graduate high school not in families (%)
Residents with income below the poverty level (%) - White
Residents with income below the poverty level (%) - Black or African American
Residents with income below the poverty level (%) - Asian
Residents with income below the poverty level (%) - Hispanic or Latino
Residents with income below the poverty level (%) - American Indian and Alaska Native
Residents with income below the poverty level (%) - Multirace
Residents with income below the poverty level (%) - Other Race
Air pollution - Air Quality Index (AQI)
Air pollution - CO
Air pollution - NO2
Air pollution - SO2
Air pollution - Ozone
Air pollution - PM10
Air pollution - PM25
Air pollution - Pb
Crime - Murders per 100,000 population
Crime - Rapes per 100,000 population
Crime - Robberies per 100,000 population
Crime - Assaults per 100,000 population
Crime - Burglaries per 100,000 population
Crime - Thefts per 100,000 population
Crime - Auto thefts per 100,000 population
Crime - Arson per 100,000 population
Crime - City-data.com crime index
Crime - Violent crime index
Crime - Property crime index
Crime - Murders per 100,000 population (5 year average)
Crime - Rapes per 100,000 population (5 year average)
Crime - Robberies per 100,000 population (5 year average)
Crime - Assaults per 100,000 population (5 year average)
Crime - Burglaries per 100,000 population (5 year average)
Crime - Thefts per 100,000 population (5 year average)
Crime - Auto thefts per 100,000 population (5 year average)
Crime - Arson per 100,000 population (5 year average)
Crime - City-data.com crime index (5 year average)
Crime - Violent crime index (5 year average)
Crime - Property crime index (5 year average)
1996 Presidential Elections Results (%) - Democratic Party (Clinton)
1996 Presidential Elections Results (%) - Republican Party (Dole)
1996 Presidential Elections Results (%) - Other
2000 Presidential Elections Results (%) - Democratic Party (Gore)
2000 Presidential Elections Results (%) - Republican Party (Bush)
2000 Presidential Elections Results (%) - Other
2004 Presidential Elections Results (%) - Democratic Party (Kerry)
2004 Presidential Elections Results (%) - Republican Party (Bush)
2004 Presidential Elections Results (%) - Other
2008 Presidential Elections Results (%) - Democratic Party (Obama)
2008 Presidential Elections Results (%) - Republican Party (McCain)
2008 Presidential Elections Results (%) - Other
2012 Presidential Elections Results (%) - Democratic Party (Obama)
2012 Presidential Elections Results (%) - Republican Party (Romney)
2012 Presidential Elections Results (%) - Other
2016 Presidential Elections Results (%) - Democratic Party (Clinton)
2016 Presidential Elections Results (%) - Republican Party (Trump)
2016 Presidential Elections Results (%) - Other
2020 Presidential Elections Results (%) - Democratic Party (Biden)
2020 Presidential Elections Results (%) - Republican Party (Trump)
2020 Presidential Elections Results (%) - Other
Ancestries Reported - Arab (%)
Ancestries Reported - Czech (%)
Ancestries Reported - Danish (%)
Ancestries Reported - Dutch (%)
Ancestries Reported - English (%)
Ancestries Reported - French (%)
Ancestries Reported - French Canadian (%)
Ancestries Reported - German (%)
Ancestries Reported - Greek (%)
Ancestries Reported - Hungarian (%)
Ancestries Reported - Irish (%)
Ancestries Reported - Italian (%)
Ancestries Reported - Lithuanian (%)
Ancestries Reported - Norwegian (%)
Ancestries Reported - Polish (%)
Ancestries Reported - Portuguese (%)
Ancestries Reported - Russian (%)
Ancestries Reported - Scotch-Irish (%)
Ancestries Reported - Scottish (%)
Ancestries Reported - Slovak (%)
Ancestries Reported - Subsaharan African (%)
Ancestries Reported - Swedish (%)
Ancestries Reported - Swiss (%)
Ancestries Reported - Ukrainian (%)
Ancestries Reported - United States (%)
Ancestries Reported - Welsh (%)
Ancestries Reported - West Indian (%)
Ancestries Reported - Other (%)
Educational Attainment - No schooling completed (%)
Educational Attainment - Less than high school (%)
Educational Attainment - High school or equivalent (%)
Educational Attainment - Less than 1 year of college (%)
Educational Attainment - 1 or more years of college (%)
Educational Attainment - Associate degree (%)
Educational Attainment - Bachelor's degree (%)
Educational Attainment - Master's degree (%)
Educational Attainment - Professional school degree (%)
Educational Attainment - Doctorate degree (%)
School Enrollment - Nursery, preschool (%)
School Enrollment - Kindergarten (%)
School Enrollment - Grade 1 to 4 (%)
School Enrollment - Grade 5 to 8 (%)
School Enrollment - Grade 9 to 12 (%)
School Enrollment - College undergrad (%)
School Enrollment - Graduate or professional (%)
School Enrollment - Not enrolled in school (%)
School enrollment - Public schools (%)
School enrollment - Private schools (%)
School enrollment - Not enrolled (%)
Median number of rooms in houses and condos
Median number of rooms in apartments
Housing units lacking complete plumbing facilities (%)
Housing units lacking complete kitchen facilities (%)
Density of houses
Urban houses (%)
Rural houses (%)
Households with people 60 years and over (%)
Households with people 65 years and over (%)
Households with people 75 years and over (%)
Households with one or more nonrelatives (%)
Households with no nonrelatives (%)
Population in households (%)
Family households (%)
Nonfamily households (%)
Population in families (%)
Family households with own children (%)
Median number of bedrooms in owner occupied houses
Mean number of bedrooms in owner occupied houses
Median number of bedrooms in renter occupied houses
Mean number of bedrooms in renter occupied houses
Median number of vehichles in owner occupied houses
Mean number of vehichles in owner occupied houses
Median number of vehichles in renter occupied houses
Mean number of vehichles in renter occupied houses
Mortgage status - with mortgage (%)
Mortgage status - with second mortgage (%)
Mortgage status - with home equity loan (%)
Mortgage status - with both second mortgage and home equity loan (%)
Mortgage status - without a mortgage (%)
Average family size
Average family size - White
Average family size - Black or African American
Average family size - Asian
Average family size - Hispanic or Latino
Average family size - American Indian and Alaska Native
Average family size - Multirace
Average family size - Other Race
Geographical mobility - Same house 1 year ago (%)
Geographical mobility - Moved within same county (%)
Geographical mobility - Moved from different county within same state (%)
Geographical mobility - Moved from different state (%)
Geographical mobility - Moved from abroad (%)
Place of birth - Born in state of residence (%)
Place of birth - Born in other state (%)
Place of birth - Native, outside of US (%)
Place of birth - Foreign born (%)
Housing units in structures - 1, detached (%)
Housing units in structures - 1, attached (%)
Housing units in structures - 2 (%)
Housing units in structures - 3 or 4 (%)
Housing units in structures - 5 to 9 (%)
Housing units in structures - 10 to 19 (%)
Housing units in structures - 20 to 49 (%)
Housing units in structures - 50 or more (%)
Housing units in structures - Mobile home (%)
Housing units in structures - Boat, RV, van, etc. (%)
House/condo owner moved in on average (years ago)
Renter moved in on average (years ago)
Year householder moved into unit - Moved in 1999 to March 2000 (%)
Year householder moved into unit - Moved in 1995 to 1998 (%)
Year householder moved into unit - Moved in 1990 to 1994 (%)
Year householder moved into unit - Moved in 1980 to 1989 (%)
Year householder moved into unit - Moved in 1970 to 1979 (%)
Year householder moved into unit - Moved in 1969 or earlier (%)
Means of transportation to work - Drove car alone (%)
Means of transportation to work - Carpooled (%)
Means of transportation to work - Public transportation (%)
Means of transportation to work - Bus or trolley bus (%)
Means of transportation to work - Streetcar or trolley car (%)
Means of transportation to work - Subway or elevated (%)
Means of transportation to work - Railroad (%)
Means of transportation to work - Ferryboat (%)
Means of transportation to work - Taxicab (%)
Means of transportation to work - Motorcycle (%)
Means of transportation to work - Bicycle (%)
Means of transportation to work - Walked (%)
Means of transportation to work - Other means (%)
Working at home (%)
Industry diversity
Most Common Industries - Agriculture, forestry, fishing and hunting, and mining (%)
Most Common Industries - Agriculture, forestry, fishing and hunting (%)
Most Common Industries - Mining, quarrying, and oil and gas extraction (%)
Most Common Industries - Construction (%)
Most Common Industries - Manufacturing (%)
Most Common Industries - Wholesale trade (%)
Most Common Industries - Retail trade (%)
Most Common Industries - Transportation and warehousing, and utilities (%)
Most Common Industries - Transportation and warehousing (%)
Most Common Industries - Utilities (%)
Most Common Industries - Information (%)
Most Common Industries - Finance and insurance, and real estate and rental and leasing (%)
Most Common Industries - Finance and insurance (%)
Most Common Industries - Real estate and rental and leasing (%)
Most Common Industries - Professional, scientific, and management, and administrative and waste management services (%)
Most Common Industries - Professional, scientific, and technical services (%)
Most Common Industries - Management of companies and enterprises (%)
Most Common Industries - Administrative and support and waste management services (%)
Most Common Industries - Educational services, and health care and social assistance (%)
Most Common Industries - Educational services (%)
Most Common Industries - Health care and social assistance (%)
Most Common Industries - Arts, entertainment, and recreation, and accommodation and food services (%)
Most Common Industries - Arts, entertainment, and recreation (%)
Most Common Industries - Accommodation and food services (%)
Most Common Industries - Other services, except public administration (%)
Most Common Industries - Public administration (%)
Occupation diversity
Most Common Occupations - Management, business, science, and arts occupations (%)
Most Common Occupations - Management, business, and financial occupations (%)
Most Common Occupations - Management occupations (%)
Most Common Occupations - Business and financial operations occupations (%)
Most Common Occupations - Computer, engineering, and science occupations (%)
Most Common Occupations - Computer and mathematical occupations (%)
Most Common Occupations - Architecture and engineering occupations (%)
Most Common Occupations - Life, physical, and social science occupations (%)
Most Common Occupations - Education, legal, community service, arts, and media occupations (%)
Most Common Occupations - Community and social service occupations (%)
Most Common Occupations - Legal occupations (%)
Most Common Occupations - Education, training, and library occupations (%)
Most Common Occupations - Arts, design, entertainment, sports, and media occupations (%)
Most Common Occupations - Healthcare practitioners and technical occupations (%)
Most Common Occupations - Health diagnosing and treating practitioners and other technical occupations (%)
Most Common Occupations - Health technologists and technicians (%)
Most Common Occupations - Service occupations (%)
Most Common Occupations - Healthcare support occupations (%)
Most Common Occupations - Protective service occupations (%)
Most Common Occupations - Fire fighting and prevention, and other protective service workers including supervisors (%)
Most Common Occupations - Law enforcement workers including supervisors (%)
Most Common Occupations - Food preparation and serving related occupations (%)
Most Common Occupations - Building and grounds cleaning and maintenance occupations (%)
Most Common Occupations - Personal care and service occupations (%)
Most Common Occupations - Sales and office occupations (%)
Most Common Occupations - Sales and related occupations (%)
Most Common Occupations - Office and administrative support occupations (%)
Most Common Occupations - Natural resources, construction, and maintenance occupations (%)
Most Common Occupations - Farming, fishing, and forestry occupations (%)
Most Common Occupations - Construction and extraction occupations (%)
Most Common Occupations - Installation, maintenance, and repair occupations (%)
Most Common Occupations - Production, transportation, and material moving occupations (%)
Most Common Occupations - Production occupations (%)
Most Common Occupations - Transportation occupations (%)
Most Common Occupations - Material moving occupations (%)
People in Group quarters - Institutionalized population (%)
People in Group quarters - Correctional institutions (%)
People in Group quarters - Federal prisons and detention centers (%)
People in Group quarters - Halfway houses (%)
People in Group quarters - Local jails and other confinement facilities (including police lockups) (%)
People in Group quarters - Military disciplinary barracks (%)
People in Group quarters - State prisons (%)
People in Group quarters - Other types of correctional institutions (%)
People in Group quarters - Nursing homes (%)
People in Group quarters - Hospitals/wards, hospices, and schools for the handicapped (%)
People in Group quarters - Hospitals/wards and hospices for chronically ill (%)
People in Group quarters - Hospices or homes for chronically ill (%)
People in Group quarters - Military hospitals or wards for chronically ill (%)
People in Group quarters - Other hospitals or wards for chronically ill (%)
People in Group quarters - Hospitals or wards for drug/alcohol abuse (%)
People in Group quarters - Mental (Psychiatric) hospitals or wards (%)
People in Group quarters - Schools, hospitals, or wards for the mentally retarded (%)
People in Group quarters - Schools, hospitals, or wards for the physically handicapped (%)
People in Group quarters - Institutions for the deaf (%)
People in Group quarters - Institutions for the blind (%)
People in Group quarters - Orthopedic wards and institutions for the physically handicapped (%)
People in Group quarters - Wards in general hospitals for patients who have no usual home elsewhere (%)
People in Group quarters - Wards in military hospitals for patients who have no usual home elsewhere (%)
People in Group quarters - Juvenile institutions (%)
People in Group quarters - Long-term care (%)
People in Group quarters - Homes for abused, dependent, and neglected children (%)
People in Group quarters - Residential treatment centers for emotionally disturbed children (%)
People in Group quarters - Training schools for juvenile delinquents (%)
People in Group quarters - Short-term care, detention or diagnostic centers for delinquent children (%)
People in Group quarters - Type of juvenile institution unknown (%)
People in Group quarters - Noninstitutionalized population (%)
People in Group quarters - College dormitories (includes college quarters off campus) (%)
People in Group quarters - Military quarters (%)
People in Group quarters - On base (%)
People in Group quarters - Barracks, unaccompanied personnel housing (UPH), (Enlisted/Officer), ;and similar group living quarters for military personnel (%)
People in Group quarters - Transient quarters for temporary residents (%)
People in Group quarters - Military ships (%)
People in Group quarters - Group homes (%)
People in Group quarters - Homes or halfway houses for drug/alcohol abuse (%)
People in Group quarters - Homes for the mentally ill (%)
People in Group quarters - Homes for the mentally retarded (%)
People in Group quarters - Homes for the physically handicapped (%)
People in Group quarters - Other group homes (%)
People in Group quarters - Religious group quarters (%)
People in Group quarters - Dormitories (%)
People in Group quarters - Agriculture workers' dormitories on farms (%)
People in Group quarters - Job Corps and vocational training facilities (%)
People in Group quarters - Other workers' dormitories (%)
People in Group quarters - Crews of maritime vessels (%)
People in Group quarters - Other nonhousehold living situations (%)
People in Group quarters - Other noninstitutional group quarters (%)
Residents speaking English at home (%)
Residents speaking English at home - Born in the United States (%)
Residents speaking English at home - Native, born elsewhere (%)
Residents speaking English at home - Foreign born (%)
Residents speaking Spanish at home (%)
Residents speaking Spanish at home - Born in the United States (%)
Residents speaking Spanish at home - Native, born elsewhere (%)
Residents speaking Spanish at home - Foreign born (%)
Residents speaking other language at home (%)
Residents speaking other language at home - Born in the United States (%)
Residents speaking other language at home - Native, born elsewhere (%)
Residents speaking other language at home - Foreign born (%)
Class of Workers - Employee of private company (%)
Class of Workers - Self-employed in own incorporated business (%)
Class of Workers - Private not-for-profit wage and salary workers (%)
Class of Workers - Local government workers (%)
Class of Workers - State government workers (%)
Class of Workers - Federal government workers (%)
Class of Workers - Self-employed workers in own not incorporated business and Unpaid family workers (%)
House heating fuel used in houses and condos - Utility gas (%)
House heating fuel used in houses and condos - Bottled, tank, or LP gas (%)
House heating fuel used in houses and condos - Electricity (%)
House heating fuel used in houses and condos - Fuel oil, kerosene, etc. (%)
House heating fuel used in houses and condos - Coal or coke (%)
House heating fuel used in houses and condos - Wood (%)
House heating fuel used in houses and condos - Solar energy (%)
House heating fuel used in houses and condos - Other fuel (%)
House heating fuel used in houses and condos - No fuel used (%)
House heating fuel used in apartments - Utility gas (%)
House heating fuel used in apartments - Bottled, tank, or LP gas (%)
House heating fuel used in apartments - Electricity (%)
House heating fuel used in apartments - Fuel oil, kerosene, etc. (%)
House heating fuel used in apartments - Coal or coke (%)
House heating fuel used in apartments - Wood (%)
House heating fuel used in apartments - Solar energy (%)
House heating fuel used in apartments - Other fuel (%)
House heating fuel used in apartments - No fuel used (%)
Armed forces status - In Armed Forces (%)
Armed forces status - Civilian (%)
Armed forces status - Civilian - Veteran (%)
Armed forces status - Civilian - Nonveteran (%)
Fatal accidents locations in years 2005-2021
Fatal accidents locations in 2005
Fatal accidents locations in 2006
Fatal accidents locations in 2007
Fatal accidents locations in 2008
Fatal accidents locations in 2009
Fatal accidents locations in 2010
Fatal accidents locations in 2011
Fatal accidents locations in 2012
Fatal accidents locations in 2013
Fatal accidents locations in 2014
Fatal accidents locations in 2015
Fatal accidents locations in 2016
Fatal accidents locations in 2017
Fatal accidents locations in 2018
Fatal accidents locations in 2019
Fatal accidents locations in 2020
Fatal accidents locations in 2021
Alcohol use - People drinking some alcohol every month (%)
Alcohol use - People not drinking at all (%)
Alcohol use - Average days/month drinking alcohol
Alcohol use - Average drinks/week
Alcohol use - Average days/year people drink much
Audiometry - Average condition of hearing (%)
Audiometry - People that can hear a whisper from across a quiet room (%)
Audiometry - People that can hear normal voice from across a quiet room (%)
Audiometry - Ears ringing, roaring, buzzing (%)
Audiometry - Had a job exposure to loud noise (%)
Audiometry - Had off-work exposure to loud noise (%)
Blood Pressure & Cholesterol - Has high blood pressure (%)
Blood Pressure & Cholesterol - Checking blood pressure at home (%)
Blood Pressure & Cholesterol - Frequently checking blood cholesterol (%)
Blood Pressure & Cholesterol - Has high cholesterol level (%)
Consumer Behavior - Money monthly spent on food at supermarket/grocery store
Consumer Behavior - Money monthly spent on food at other stores
Consumer Behavior - Money monthly spent on eating out
Consumer Behavior - Money monthly spent on carryout/delivered foods
Consumer Behavior - Income spent on food at supermarket/grocery store (%)
Consumer Behavior - Income spent on food at other stores (%)
Consumer Behavior - Income spent on eating out (%)
Consumer Behavior - Income spent on carryout/delivered foods (%)
Current Health Status - General health condition (%)
Current Health Status - Blood donors (%)
Current Health Status - Has blood ever tested for HIV virus (%)
Current Health Status - Left-handed people (%)
Dermatology - People using sunscreen (%)
Diabetes - Diabetics (%)
Diabetes - Had a blood test for high blood sugar (%)
Diabetes - People taking insulin (%)
Diet Behavior & Nutrition - Diet health (%)
Diet Behavior & Nutrition - Milk product consumption (# of products/month)
Diet Behavior & Nutrition - Meals not home prepared (#/week)
Diet Behavior & Nutrition - Meals from fast food or pizza place (#/week)
Diet Behavior & Nutrition - Ready-to-eat foods (#/month)
Diet Behavior & Nutrition - Frozen meals/pizza (#/month)
Drug Use - People that ever used marijuana or hashish (%)
Drug Use - Ever used hard drugs (%)
Drug Use - Ever used any form of cocaine (%)
Drug Use - Ever used heroin (%)
Drug Use - Ever used methamphetamine (%)
Health Insurance - People covered by health insurance (%)
Kidney Conditions-Urology - Avg. # of times urinating at night
Medical Conditions - People with asthma (%)
Medical Conditions - People with anemia (%)
Medical Conditions - People with psoriasis (%)
Medical Conditions - People with overweight (%)
Medical Conditions - Elderly people having difficulties in thinking or remembering (%)
Medical Conditions - People who ever received blood transfusion (%)
Medical Conditions - People having trouble seeing even with glass/contacts (%)
Medical Conditions - People with arthritis (%)
Medical Conditions - People with gout (%)
Medical Conditions - People with congestive heart failure (%)
Medical Conditions - People with coronary heart disease (%)
Medical Conditions - People with angina pectoris (%)
Medical Conditions - People who ever had heart attack (%)
Medical Conditions - People who ever had stroke (%)
Medical Conditions - People with emphysema (%)
Medical Conditions - People with thyroid problem (%)
Medical Conditions - People with chronic bronchitis (%)
Medical Conditions - People with any liver condition (%)
Medical Conditions - People who ever had cancer or malignancy (%)
Mental Health - People who have little interest in doing things (%)
Mental Health - People feeling down, depressed, or hopeless (%)
Mental Health - People who have trouble sleeping or sleeping too much (%)
Mental Health - People feeling tired or having little energy (%)
Mental Health - People with poor appetite or overeating (%)
Mental Health - People feeling bad about themself (%)
Mental Health - People who have trouble concentrating on things (%)
Mental Health - People moving or speaking slowly or too fast (%)
Mental Health - People having thoughts they would be better off dead (%)
Oral Health - Average years since last visit a dentist
Oral Health - People embarrassed because of mouth (%)
Oral Health - People with gum disease (%)
Oral Health - General health of teeth and gums (%)
Oral Health - Average days a week using dental floss/device
Oral Health - Average days a week using mouthwash for dental problem
Oral Health - Average number of teeth
Pesticide Use - Households using pesticides to control insects (%)
Pesticide Use - Households using pesticides to kill weeds (%)
Physical Activity - People doing vigorous-intensity work activities (%)
Physical Activity - People doing moderate-intensity work activities (%)
Physical Activity - People walking or bicycling (%)
Physical Activity - People doing vigorous-intensity recreational activities (%)
Physical Activity - People doing moderate-intensity recreational activities (%)
Physical Activity - Average hours a day doing sedentary activities
Physical Activity - Average hours a day watching TV or videos
Physical Activity - Average hours a day using computer
Physical Functioning - People having limitations keeping them from working (%)
Physical Functioning - People limited in amount of work they can do (%)
Physical Functioning - People that need special equipment to walk (%)
Physical Functioning - People experiencing confusion/memory problems (%)
Physical Functioning - People requiring special healthcare equipment (%)
Prescription Medications - Average number of prescription medicines taking
Preventive Aspirin Use - Adults 40+ taking low-dose aspirin (%)
Reproductive Health - Vaginal deliveries (%)
Reproductive Health - Cesarean deliveries (%)
Reproductive Health - Deliveries resulted in a live birth (%)
Reproductive Health - Pregnancies resulted in a delivery (%)
Reproductive Health - Women breastfeeding newborns (%)
Reproductive Health - Women that had a hysterectomy (%)
Reproductive Health - Women that had both ovaries removed (%)
Reproductive Health - Women that have ever taken birth control pills (%)
Reproductive Health - Women taking birth control pills (%)
Reproductive Health - Women that have ever used Depo-Provera or injectables (%)
Reproductive Health - Women that have ever used female hormones (%)
Sexual Behavior - People 18+ that ever had sex (vaginal, anal, or oral) (%)
Sexual Behavior - Males 18+ that ever had vaginal sex with a woman (%)
Sexual Behavior - Males 18+ that ever performed oral sex on a woman (%)
Sexual Behavior - Males 18+ that ever had anal sex with a woman (%)
Sexual Behavior - Males 18+ that ever had any sex with a man (%)
Sexual Behavior - Females 18+ that ever had vaginal sex with a man (%)
Sexual Behavior - Females 18+ that ever performed oral sex on a man (%)
Sexual Behavior - Females 18+ that ever had anal sex with a man (%)
Sexual Behavior - Females 18+ that ever had any kind of sex with a woman (%)
Sexual Behavior - Average age people first had sex
Sexual Behavior - Average number of female sex partners in lifetime (males 18+)
Sexual Behavior - Average number of female vaginal sex partners in lifetime (males 18+)
Sexual Behavior - Average age people first performed oral sex on a woman (18+)
Sexual Behavior - Average number of woman performed oral sex on in lifetime (18+)
Sexual Behavior - Average number of male sex partners in lifetime (males 18+)
Sexual Behavior - Average number of male anal sex partners in lifetime (males 18+)
Sexual Behavior - Average age people first performed oral sex on a man (18+)
Sexual Behavior - Average number of male oral sex partners in lifetime (18+)
Sexual Behavior - People using protection when performing oral sex (%)
Sexual Behavior - Average number of times people have vaginal or anal sex a year
Sexual Behavior - People having sex without condom (%)
Sexual Behavior - Average number of male sex partners in lifetime (females 18+)
Sexual Behavior - Average number of male vaginal sex partners in lifetime (females 18+)
Sexual Behavior - Average number of female sex partners in lifetime (females 18+)
Sexual Behavior - Circumcised males 18+ (%)
Sleep Disorders - Average hours sleeping at night
Sleep Disorders - People that has trouble sleeping (%)
Smoking-Cigarette Use - People smoking cigarettes (%)
Taste & Smell - People 40+ having problems with smell (%)
Taste & Smell - People 40+ having problems with taste (%)
Taste & Smell - People 40+ that ever had wisdom teeth removed (%)
Taste & Smell - People 40+ that ever had tonsils teeth removed (%)
Taste & Smell - People 40+ that ever had a loss of consciousness because of a head injury (%)
Taste & Smell - People 40+ that ever had a broken nose or other serious injury to face or skull (%)
Taste & Smell - People 40+ that ever had two or more sinus infections (%)
Weight - Average height (inches)
Weight - Average weight (pounds)
Weight - Average BMI
Weight - People that are obese (%)
Weight - People that ever were obese (%)
Weight - People trying to lose weight (%)
100%
urban population.
Estimated median house/condo value in 2022: $315,395
19129:
$315,395Pennsylvania:
$245,500
Median resident age: This zip code:
35.0 yearsPennsylvania median age:
40.9 years
Average household size: This zip code:
1.9 peoplePennsylvania:
2.4 people
Averages for the 2020 tax year for zip code 19129, filed in 2021:
Average Adjusted Gross Income (AGI) in 2020: $78,480 (Individual Income Tax Returns) Here:
$78,480State:
$75,707
Salary/wage: $71,315 (reported on 83.9% of returns )Here:
$71,315State:
$62,806
(% of AGI for various income ranges: 971.2% for AGIs below $25k , 3614.6% for AGIs $25k-50k , 6740.0% for AGIs $50k-75k , 10111.2% for AGIs $75k-100k , 18842.0% for AGIs $100k-200k , 79213.6% for AGIs over 200k ) Taxable interest for individuals: $876 (reported on 30.2% of returns )This zip code:
$876Pennsylvania:
$1,633
(% of AGI for various income ranges: 9.5% for AGIs below $25k , 14.1% for AGIs $25k-50k , 37.9% for AGIs $50k-75k , 31.9% for AGIs $75k-100k , 65.3% for AGIs $100k-200k , 404.5% for AGIs over 200k ) Ordinary dividends: $5,619 (reported on 22.4% of returns )(% of AGI for various income ranges: 23.9% for AGIs below $25k , 28.4% for AGIs $25k-50k , 56.7% for AGIs $50k-75k , 140.7% for AGIs $75k-100k , 276.7% for AGIs $100k-200k , 3496.4% for AGIs over 200k ) Net capital gain/loss in AGI: +$11,077 (reported on 19.5% of returns )Here:
+$11,077State:
+$23,522
(% of AGI for various income ranges: 13.2% for AGIs below $25k , 16.2% for AGIs $25k-50k , 68.3% for AGIs $50k-75k , 160.7% for AGIs $75k-100k , 296.3% for AGIs $100k-200k , 7854.5% for AGIs over 200k ) Profit/loss from business: +$13,501 (reported on 16.1% of returns )Here:
+$13,501State:
+$16,274
(% of AGI for various income ranges: 126.8% for AGIs below $25k , 100.9% for AGIs $25k-50k , 170.0% for AGIs $50k-75k , 202.8% for AGIs $75k-100k , 537.8% for AGIs $100k-200k , 4195.5% for AGIs over 200k ) Taxable individual retirement arrangement distribution: $22,879 (reported on 7.1% of returns )19129:
$22,879Pennsylvania:
$18,583
(% of AGI for various income ranges: 33.5% for AGIs below $25k , 72.3% for AGIs $25k-50k , 133.2% for AGIs $50k-75k , 221.6% for AGIs $75k-100k , 481.4% for AGIs $100k-200k , 2951.8% for AGIs over 200k ) Self-employed (Keogh) retirement plans: $36,100 (reported on 0.6% of returns )19129:
$36,100Pennsylvania:
$25,407
(% of AGI for various income ranges: 984.5% for AGIs over 200k ) Total itemized deductions: $27,223 (reported on 13.2% of returns )Here:
$27,223State:
$34,850
(% of AGI for various income ranges: 31.5% for AGIs below $25k , 126.2% for AGIs $25k-50k , 338.9% for AGIs $50k-75k , 703.7% for AGIs $75k-100k , 1112.2% for AGIs $100k-200k , 5971.8% for AGIs over 200k ) Charity contributions: $7,224 (reported on 10.8% of returns )(% of AGI for various income ranges: 29.2% for AGIs $25k-50k , 51.7% for AGIs $50k-75k , 137.2% for AGIs $75k-100k , 238.8% for AGIs $100k-200k , 1550.9% for AGIs over 200k ) Taxes paid: $8,317 (reported on 13.0% of returns )(% of AGI for various income ranges: 7.9% for AGIs below $25k , 32.2% for AGIs $25k-50k , 103.8% for AGIs $50k-75k , 265.6% for AGIs $75k-100k , 406.5% for AGIs $100k-200k , 1316.4% for AGIs over 200k ) Earned income credit: $1,870 (reported on 12.2% of returns )(% of AGI for various income ranges: 81.7% for AGIs below $25k , 41.6% for AGIs $25k-50k ) Percentage of individuals using paid preparers for their 2020 taxes: 91.7%(% for various income ranges: 89.3% for AGIs below $25k , 92.4% for AGIs $25k-50k , 92.7% for AGIs $50k-75k , 91.8% for AGIs $75k-100k , 91.9% for AGIs $100k-200k , 94.1% for AGIs over 200k )
Averages for the 2012 tax year for zip code 19129, filed in 2013:
Average Adjusted Gross Income (AGI) in 2012: $65,160 (Individual Income Tax Returns) Here:
$65,160State:
$61,346
Salary/wage: $57,608 (reported on 86.6% of returns )Here:
$57,608State:
$51,902
(% of AGI for various income ranges: 74.0% for AGIs below $25k , 84.8% for AGIs $25k-50k , 85.0% for AGIs $50k-75k , 84.6% for AGIs $75k-100k , 82.6% for AGIs $100k-200k , 58.7% for AGIs over 200k ) Taxable interest for individuals: $824 (reported on 32.6% of returns )This zip code:
$824Pennsylvania:
$1,588
(% of AGI for various income ranges: 0.8% for AGIs below $25k , 0.3% for AGIs $25k-50k , 0.5% for AGIs $50k-75k , 0.4% for AGIs $75k-100k , 0.3% for AGIs $100k-200k , 0.4% for AGIs over 200k ) Ordinary dividends: $5,165 (reported on 20.4% of returns )(% of AGI for various income ranges: 1.2% for AGIs below $25k , 0.7% for AGIs $25k-50k , 0.8% for AGIs $50k-75k , 1.0% for AGIs $75k-100k , 1.4% for AGIs $100k-200k , 3.2% for AGIs over 200k ) Net capital gain/loss in AGI: +$5,192 (reported on 14.8% of returns )Here:
+$5,192State:
+$14,495
(% of AGI for various income ranges: 0.1% for AGIs $50k-75k , 0.5% for AGIs $75k-100k , 1.0% for AGIs $100k-200k , 3.2% for AGIs over 200k ) Profit/loss from business: +$20,174 (reported on 13.8% of returns )Here:
+$20,174State:
+$16,268
(% of AGI for various income ranges: 7.1% for AGIs below $25k , 2.9% for AGIs $25k-50k , 2.1% for AGIs $50k-75k , 2.5% for AGIs $75k-100k , 2.9% for AGIs $100k-200k , 7.7% for AGIs over 200k ) Taxable individual retirement arrangement distribution: $20,690 (reported on 7.9% of returns )19129:
$20,690Pennsylvania:
$14,550
(% of AGI for various income ranges: 2.3% for AGIs below $25k , 1.3% for AGIs $25k-50k , 1.5% for AGIs $50k-75k , 2.7% for AGIs $75k-100k , 1.8% for AGIs $100k-200k , 4.4% for AGIs over 200k ) Self-employment retirement plans: $22,217 (reported on 1.2% of returns )19129:
$22,217Pennsylvania:
$20,922
(% of AGI for various income ranges: 0.6% for AGIs $50k-75k , 1.2% for AGIs over 200k ) Total itemized deductions: $23,689 (20% of AGI, reported on 38.1% of returns )Here:
$23,689State:
$23,538
Here:
19.9% of AGIState:
18.4% of AGI
(% of AGI for various income ranges: 7.3% for AGIs below $25k , 9.0% for AGIs $25k-50k , 12.4% for AGIs $50k-75k , 15.3% for AGIs $75k-100k , 15.5% for AGIs $100k-200k , 16.4% for AGIs over 200k ) Charity contributions: $3,981 (reported on 31.6% of returns )(% of AGI for various income ranges: 0.9% for AGIs below $25k , 1.2% for AGIs $25k-50k , 1.6% for AGIs $50k-75k , 1.9% for AGIs $75k-100k , 1.7% for AGIs $100k-200k , 2.9% for AGIs over 200k ) Taxes paid: $10,746 (reported on 38.1% of returns )19129:
$10,746State:
$9,982
(% of AGI for various income ranges: 1.5% for AGIs below $25k , 2.7% for AGIs $25k-50k , 4.7% for AGIs $50k-75k , 6.7% for AGIs $75k-100k , 7.6% for AGIs $100k-200k , 8.7% for AGIs over 200k ) Earned income credit: $1,980 (reported on 17.2% of returns )(% of AGI for various income ranges: 6.8% for AGIs below $25k , 0.7% for AGIs $25k-50k ) Percentage of individuals using paid preparers for their 2012 taxes: 42.7%(% for various income ranges: 38.7% for AGIs below $25k , 36.9% for AGIs $25k-50k , 42.7% for AGIs $50k-75k , 46.8% for AGIs $75k-100k , 53.3% for AGIs $100k-200k , 70.0% for AGIs over 200k )
Averages for the 2004 tax year for zip code 19129, filed in 2005:
Average Adjusted Gross Income (AGI) in 2004: $48,004 (Individual Income Tax Returns) Here:
$48,004State:
$48,049
Salary/wage: $44,369 (reported on 86.9% of returns )Here:
$44,369State:
$42,646
(% of AGI for various income ranges: 130.8% for AGIs below $10k , 80.3% for AGIs $10k-25k , 87.0% for AGIs $25k-50k , 87.7% for AGIs $50k-75k , 86.2% for AGIs $75k-100k , 70.4% for AGIs over 100k ) Taxable interest for individuals: $1,162 (reported on 40.4% of returns )This zip code:
$1,162Pennsylvania:
$1,657
(% of AGI for various income ranges: 4.0% for AGIs below $10k , 1.4% for AGIs $10k-25k , 1.0% for AGIs $25k-50k , 0.7% for AGIs $50k-75k , 0.6% for AGIs $75k-100k , 1.0% for AGIs over 100k ) Taxable dividends: $2,972 (reported on 23.6% of returns )(% of AGI for various income ranges: 7.7% for AGIs below $10k , 1.0% for AGIs $10k-25k , 1.0% for AGIs $25k-50k , 0.8% for AGIs $50k-75k , 1.6% for AGIs $75k-100k , 1.9% for AGIs over 100k ) Net capital gain/loss: +$6,326 (reported on 17.8% of returns )Here:
+$6,326State:
+$9,716
(% of AGI for various income ranges: -1.5% for AGIs below $10k , -0.1% for AGIs $10k-25k , 0.3% for AGIs $25k-50k , 0.5% for AGIs $50k-75k , -0.1% for AGIs $75k-100k , 5.6% for AGIs over 100k ) Profit/loss from business: +$12,691 (reported on 11.6% of returns )Here:
+$12,691State:
+$14,267
(% of AGI for various income ranges: 12.4% for AGIs below $10k , 3.3% for AGIs $10k-25k , 2.4% for AGIs $25k-50k , 1.9% for AGIs $50k-75k , 2.4% for AGIs $75k-100k , 3.9% for AGIs over 100k ) IRA payment deduction: $2,500 (reported on 2.2% of returns )19129:
$2,500Pennsylvania:
$2,903
(% of AGI for various income ranges: 0.2% for AGIs $10k-25k , 0.1% for AGIs $25k-50k , 0.1% for AGIs $50k-75k , 0.1% for AGIs $75k-100k , 0.1% for AGIs over 100k ) Self-employed pension: $18,386 (reported on 1.3% of returns )Here:
$18,386Pennsylvania:
$14,674
Total itemized deductions: $17,983 (20% of AGI, reported on 37.8% of returns )Here:
$17,983State:
$18,804
Here:
20.3% of AGIState:
19.5% of AGI
(% of AGI for various income ranges: 12.1% for AGIs below $10k , 7.2% for AGIs $10k-25k , 11.9% for AGIs $25k-50k , 16.1% for AGIs $50k-75k , 16.8% for AGIs $75k-100k , 15.3% for AGIs over 100k ) Charity contributions deductions: $3,421 (4% of AGI, reported on 33.9% of returns )Here:
3.7% of AGIState:
3.3% of AGI
(% of AGI for various income ranges: 0.7% for AGIs below $10k , 1.0% for AGIs $10k-25k , 2.1% for AGIs $25k-50k , 2.4% for AGIs $50k-75k , 2.4% for AGIs $75k-100k , 3.0% for AGIs over 100k ) Total tax: $8,772 (reported on 74.6% of returns )(% of AGI for various income ranges: 4.6% for AGIs below $10k , 3.6% for AGIs $10k-25k , 8.1% for AGIs $25k-50k , 11.3% for AGIs $50k-75k , 12.3% for AGIs $75k-100k , 20.4% for AGIs over 100k ) Earned income credit: $1,745 (reported on 16.5% of returns )Percentage of individuals using paid preparers for their 2004 taxes: 49.0%(% for various income ranges: 44.1% for AGIs below $10k , 49.7% for AGIs $10k-25k , 45.9% for AGIs $25k-50k , 51.0% for AGIs $50k-75k , 50.0% for AGIs $75k-100k , 62.2% for AGIs over 100k )
Estimated median household income in 2022: This zip code:
$78,099Pennsylvania:
$71,798
Nearest zip codes: 19132 ,
19144 ,
19121 ,
19131 ,
19140 ,
19119 .
Philadelphia Zip Code Map
Percentage of family households: This zip code:
37.4%Pennsylvania:
42.6%
Percentage of households with unmarried partners: This zip code:
10.3%Pennsylvania:
46.5%
Likely homosexual households (counted as self-reported same-sex unmarried-partner households)
Lesbian couples: 0.7% of all households Gay men: 0.1% of all households
Household received Food Stamps/SNAP in the past 12 months: 1,093Household did not receive Food Stamps/SNAP in the past 12 months: 4,434
Women who had a birth in the past 12 months: 214 (186 now married , 34 unmarried) Women who did not have a birth in the past 12 months: 3,223 (1,166 now married , 2,060 unmarried)
Housing units in zip code 19129 with a mortgage: 1,761 (152
second mortgage , 149
both second mortgage and home equity loan )
Houses without a mortgage: 74
Median monthly owner costs for units with a mortgage: $1,764
Median monthly owner costs for units without a mortgage: $538
Residents with income below the poverty level in 2022:
This zip code:
14.4%Whole state:
11.8%
Residents with income below 50% of the poverty level in 2022:
This zip code:
6.9%Whole state:
6.1%
Median number of rooms in houses and condos: Median number of rooms in apartments: Notable locations in this zip code not listed on our city pages
Click to draw/clear zip code borders Notable locations in zip code 19129: (A) , Philadelphia Fire Department Engine 35 (B) , Architecture Studios at Ravenhill (C) , Bertrand W Hayward Hall (D) , Fortess Hall (E) , Independence Plaza (F) , President's House - Philadelphia University (G) , Ravehill Dining Hall (H) , Ravenhill Mansion (I) , Ronson Hall (J) , Roxboro House (K) , The Design Center (L) , The Tuttleman Center (M) , Weber Design Studios (N) , Second Alarmers Association and Rescue Squad Of Philadelphia (O) , Saint Josephs Home (P) . Display/hide their locations on the map
Cemetery: (1) . Display/hide its location on the map
Lakes and reservoirs: (A) , Queen Lane Reservoir (B) . Display/hide their locations on the map
Creek: (A) . Display/hide its location on the map
Parks in zip code 19129 include: (1) , Ravenhill Athletic Field (2) . Display/hide their locations on the map
Year house built (houses)
29 2020 or later308 2010 to 2019693 2000 to 2009399 1990 to 1999114 1980 to 1989492 1970 to 1979480 1960 to 1969521 1950 to 1959687 1940 to 19492,122 1939 or earlier
Zip code 19129 household income distribution in 2022 450 Less than $10,000327 $10,000 to $14,999168 $15,000 to $19,999153 $20,000 to $24,999246 $25,000 to $29,999273 $30,000 to $34,99989 $35,000 to $39,999138 $40,000 to $44,999112 $45,000 to $49,999270 $50,000 to $59,999440 $60,000 to $74,999538 $75,000 to $99,999596 $100,000 to $124,999311 $125,000 to $149,999527 $150,000 to $199,999886 $200,000 or moreEstimate of home value of owner-occupied houses/condos in 2022 in zip code 19129 67 $40,000 to $49,999134 $50,000 to $59,99914 $60,000 to $69,9999 $70,000 to $79,9998 $80,000 to $89,99981 $100,000 to $124,99997 $125,000 to $149,999113 $150,000 to $174,999113 $175,000 to $199,999329 $200,000 to $249,999340 $250,000 to $299,999615 $300,000 to $399,999371 $400,000 to $499,999431 $500,000 to $749,99977 $750,000 to $999,99914 $1,000,000 to $1,499,999Rent paid by renters in 2022 in zip code 19129 58 $200 to $249191 $250 to $2998 $300 to $3495 $350 to $39918 $450 to $49921 $500 to $54915 $600 to $64983 $650 to $69951 $800 to $89910 $900 to $999686 $1,000 to $1,249441 $1,250 to $1,499696 $1,500 to $1,999257 $2,000 to $2,49933 $2,500 to $2,99931 $3,500 or more197 No cash rent
Median gross rent in 2022: $1,463.
Median price asked for vacant for-sale houses and condos in 2022: $280,315.
Estimated median house (or condo) value in 2022 for: White Non-Hispanic householders: $361,721Black or African American householders: $159,569Asian householders: $399,624Two or more races householders: $92,185Estimated median house or condo value in 2022: $315,395
19129:
$315,395Pennsylvania:
$245,500
Lower value quartile - upper value quartile: $206,944 - $452,673
Mean price in 2022: Detached houses: $512,384Here:
$512,384State:
$317,202
Townhouses or other attached units: $299,078Here:
$299,078State:
$254,369
In 2-unit structures: $724,160Here:
$724,160State:
$249,182
In 3-to-4-unit structures: $215,326Here:
$215,326State:
$297,446
In 5-or-more-unit structures: $78,950Here:
$78,950State:
$320,068
Housing units in structures:
One, detached: 600One, attached: 2,807Two: 3693 or 4: 5375 to 9: 24210 to 19: 38520 to 49: 28250 or more: 680Mobile homes: 17Unemployment : 5.3%
Means of transportation to work in zip code 19129 44.3% 2,809 Drove a car alone7.2% 458 Carpooled6.4% 405 Bus or trolley bus1.6% 101 Streetcar or trolley car5.5% 352 Subway or elevated0.7% 47 Railroad0.4% 26 Taxi1.3% 83 Bicycle5.5% 349 Walked0.3% 19 Other means26.2% 1,665 Worked at homeTravel time to work (commute) in zip code 19129 271 Less than 5 minutes384 5 to 9 minutes262 10 to 14 minutes445 15 to 19 minutes664 20 to 24 minutes305 25 to 29 minutes819 30 to 34 minutes198 35 to 39 minutes180 40 to 44 minutes681 45 to 59 minutes333 60 to 89 minutes308 90 or more minutes
Neighborhoods in zip code 19129: Percentage of zip code residents living and working in this county: 79.5%
Household type by relationship:
Households: 11,354
Male householders: 2,470 (945 living alone ), Female householders: 3,044 (1,166 living alone )2,067 spouses (1,991 opposite-sex spouses ), 661 unmarried partners , (631 opposite-sex unmarried partners ), 1,548 children (1,501 natural , 48 adopted , 0 stepchildren ), 231 grandchildren , 103 brothers or sisters , 114 parents , 0 foster children , 67 other relatives , 257 non-relatives In group quarters: 914 (-1 institutionalized population )
Size of family households: 1,776 2-persons , 378 3-persons , 384 4-persons , 85 5-persons , 11 6-persons
Size of nonfamily households: 2,111 1-person , 751 2-persons , 79 3-persons
981 married couples with children. single-parent households (23 men , 101 women ).
90.2% of residents of 19129 zip code speak English at home. of residents speak Spanish at home (82% very well, 8% well, 10% not well ).of residents speak other Indo-European language at home (90% very well, 7% well, 3% not well ).of residents speak Asian or Pacific Island language at home (91% very well, 9% well ).of residents speak other language at home (100% very well ).
Foreign born population: 828 (7.3%)
(60.9%
of them are naturalized citizens )
This zip code:
7.3%Whole state:
7.5%
10% Honduras 9% Dominica 9% Uruguay 8% Bhutan 6% Egypt 5% Japan 4% Bulgaria 8% American 8% Irish 6% Italian 4% German 4% English 2% European 2% Arab
Year of entry for the foreign-born population
363 2010 or later 337 2000 to 2009 54 1990 to 1999 132 Before 1990
There are
59 Medical Specialists in Zip Code 19129 .
Facilities with environmental interests located in this zip code:
ATLANTIC SVC STA (4168 RIDGE AVENUE in PHILADELPHIA, PA)
STATE MASTER (Pennsylvania database) - RCRIS-PAD987324589, HAZARDOUS WASTE PROGRAM Conditionally Exempt Small Quantity Generators, less than 100 kg/month of hazardous waste (Resource Conservation and Recovery Act (tracking hazardous waste)) - notification Organizations: OPERNAME (CONTACT/OPERATOR)
, ATLANTIC REFINING & MKTNG CO (CONTACT/OWNER)
, ATLANTIC REFINING & MARKETING CORPORATION (CONTACT/OWNER)
BERK INDUSTRIES INC (2401 W WESTMORELAND ST in PHILADELPHIA, PA)
(Resource Conservation and Recovery Act (tracking hazardous waste)) Business NAICS classification: METAL STAMPING.; CUTTING TOOL AND MACHINE TOOL ACCESSORY MANUFACTURING.Organizations: OPERNAME (CONTACT/OPERATOR)
, OWNERNAME (CONTACT/OWNER)
AMOCO (4268 RIDGE AVENUE in PHILADELPHIA, PA)
Small Quantity Generators, between 100 kg and 1000 kg of hazardous waste/month (Resource Conservation and Recovery Act (tracking hazardous waste)) - notification Organizations: AMOCO OIL CO (CONTACT/OWNER)
Alternative names: AMOCO NO 14030 TANKS
ALPHACHEM INCORPORATED EASTERN BLENDING CENTER (4041 RIDGE AVE. BUILDING 12 in PHILADELPHIA, PA)
TRI REPORTER (Tracking of toxic chemicals releasing facilities) Business SIC classification: CHEMICALS AND CHEMICAL PREPARATIONSAlternative names: ALPHACHEM INC.
Housing units lacking complete plumbing facilities: 1.4%
Housing units lacking complete kitchen facilities: 1.1%
70.7% Utility gas 25.6% Electricity 2.2% Fuel oil, kerosene, etc. 1.1% No fuel used
Population in 1990: 13,430.
Place of birth for U.S.-born residents:
This state: 7,015Northeast: 1,652Midwest: 563South: 993West: 297
63% of the 19129 zip code residents lived in the same house 5 years ago.
Out of people who lived in different houses, 44% lived in this county.
Out of people who lived in different counties, 50% lived in Pennsylvania.
84% of the 19129 zip code residents lived in the same house 1 year ago.
Out of people who lived in different houses, 41% moved from this county.
Out of people who lived in different houses, 21% moved from different county within same state.
Out of people who lived in different houses, 33% moved from different state.
Out of people who lived in different houses, 3% moved from abroad.
Private vs. public school enrollment:
Students in private schools in grades 1 to 8 (elementary and middle school): 126
Here:
33.4%Pennsylvania:
15.7%
Students in private schools in grades 9 to 12 (high school): 67
Here:
28.2%Pennsylvania:
13.4%
Students in private undergraduate colleges: 569
Here:
64.4%Pennsylvania:
39.8%
Occupation by median earnings in the past 12 months ($)
132,066 Legal occupations 94,370 Business and financial operations occupations 93,398 Life, physical, and social science occupations 87,528 Computer and mathematical occupations 87,179 Law enforcement workers including supervisors 82,349 Health diagnosing and treating practitioners and other technical occupations
Companies with federal contracts located in this zip code:
SANDA CORPORATION (4005 GYPSY LN in PHILADELPHIA, PA; small business) in 2 contracts in 2005
$26,435 with Navy for Miscellaneous Materials Handling Equipment. Signed on 2005-09-16. Completion date: 2005-10-27.
, same as above. Signed on 2005-09-16. Completion date: 2005-10-27.
MELRATH GASKET (2901 WEST HUNTING PARK AVE in PHILADELPHIA, PA; small business)
$11,125 with Navy for Fire Fighting Equipment. Signed on 2005-04-20. Completion date: 2005-05-13.
ATLANTIC MAINTENANCE CORP (3426 CONRAD ST in PHILADELPHIA, PA; small business)
$3,280 with Navy for Maintenance, Repair or Alteration of Real Property -- Office Buildings. Signed on 2001-06-28. Completion date: 2001-07-15.
Top industries in this zip code by the number of employees in 2005:
Accommodation and Food Services: Full-Service Restaurants (20-49 employees: 2 establishments, 10-19 employees: 1 establishment, 1-4 employees: 5 establishments)Educational Services: Elementary and Secondary Schools (50-99: 1)Other Services (except Public Administration): Religious Organizations (20-49: 1, 1-4: 3)
People in group quarters in 2010:
645 people in college/university student housing
254 people in correctional residential facilities
10 people in residential treatment centers for adults
7 people in in-patient hospice facilities
6 people in other noninstitutional facilities
2 people in group homes intended for adults
People in group quarters in 2000:
1,099 people in college dormitories (includes college quarters off campus)
23 people in hospitals/wards and hospices for chronically ill
23 people in other hospitals or wards for chronically ill
9 people in religious group quarters
8 people in homes for the mentally retarded
Fatal accident statistics in 2014:
Fatal accident count: 2Vehicles involved in fatal accidents: 3Fatal accidents caused by drunken drivers: 1Fatalities: 2Persons involved in fatal accidents: 7Pedestrians involved in fatal accidents: 1
Fatal accident statistics in 2013:
Fatal accident count: 2Vehicles involved in fatal accidents: 2Fatal accidents caused by drunken drivers: 1Fatalities: 2Persons involved in fatal accidents: 7Pedestrians involved in fatal accidents: 0
Home Mortgage Disclosure Act Aggregated Statistics For Year 2009(Based on 2 full and 8 partial tracts) A) FHA, FSA/RHS & VA B) Conventional C) Refinancings D) Home Improvement Loans E) Loans on Dwellings For 5+ Families F) Non-occupant Loans on G) Loans On Manufactured Number Average Value Number Average Value Number Average Value Number Average Value Number Average Value Number Average Value Number Average Value
LOANS ORIGINATED 91 $208,776 119 $218,869 375 $196,383 33 $79,935 6 $663,077 46 $155,807 0 $0 APPLICATIONS APPROVED, NOT ACCEPTED 2 $250,445 4 $226,070 32 $171,927 2 $95,590 0 $0 1 $62,110 0 $0 APPLICATIONS DENIED 16 $211,118 32 $211,854 155 $168,902 62 $34,570 1 $29,780 25 $116,227 1 $13,010 APPLICATIONS WITHDRAWN 1 $22,120 11 $229,455 95 $201,418 12 $126,287 0 $0 3 $120,330 0 $0 FILES CLOSED FOR INCOMPLETENESS 0 $0 6 $245,108 21 $188,056 10 $94,780 0 $0 3 $140,683 0 $0
Aggregated Statistics For Year 2008(Based on 2 full and 8 partial tracts) A) FHA, FSA/RHS & VA B) Conventional C) Refinancings D) Home Improvement Loans E) Loans on Dwellings For 5+ Families F) Non-occupant Loans on Number Average Value Number Average Value Number Average Value Number Average Value Number Average Value Number Average Value
LOANS ORIGINATED 47 $189,797 201 $219,133 226 $138,213 93 $55,849 0 $0 63 $131,353 APPLICATIONS APPROVED, NOT ACCEPTED 2 $63,760 36 $223,072 62 $155,152 11 $32,890 0 $0 11 $135,263 APPLICATIONS DENIED 12 $156,725 36 $188,378 151 $102,447 125 $30,859 4 $920,055 39 $89,302 APPLICATIONS WITHDRAWN 3 $173,730 37 $230,482 65 $144,947 16 $26,489 0 $0 9 $73,058 FILES CLOSED FOR INCOMPLETENESS 3 $147,720 12 $188,472 9 $98,161 5 $25,192 0 $0 4 $156,715
Aggregated Statistics For Year 2007(Based on 2 full and 8 partial tracts) A) FHA, FSA/RHS & VA B) Conventional C) Refinancings D) Home Improvement Loans E) Loans on Dwellings For 5+ Families F) Non-occupant Loans on G) Loans On Manufactured Number Average Value Number Average Value Number Average Value Number Average Value Number Average Value Number Average Value Number Average Value
LOANS ORIGINATED 25 $191,488 387 $159,166 323 $125,531 137 $55,380 11 $2,252,687 136 $129,729 0 $0 APPLICATIONS APPROVED, NOT ACCEPTED 3 $145,570 44 $137,118 53 $124,305 31 $43,295 0 $0 15 $67,724 2 $46,160 APPLICATIONS DENIED 4 $166,725 75 $131,963 299 $101,904 155 $32,650 0 $0 65 $77,280 0 $0 APPLICATIONS WITHDRAWN 4 $211,652 48 $147,053 103 $116,897 19 $74,632 2 $611,775 24 $89,006 0 $0 FILES CLOSED FOR INCOMPLETENESS 0 $0 17 $110,135 24 $107,453 4 $125,972 2 $604,130 6 $123,420 0 $0
Aggregated Statistics For Year 2006(Based on 2 full and 8 partial tracts) A) FHA, FSA/RHS & VA B) Conventional C) Refinancings D) Home Improvement Loans E) Loans on Dwellings For 5+ Families F) Non-occupant Loans on G) Loans On Manufactured Number Average Value Number Average Value Number Average Value Number Average Value Number Average Value Number Average Value Number Average Value
LOANS ORIGINATED 10 $216,416 379 $142,410 349 $119,674 126 $44,095 5 $11,414,008 134 $113,865 0 $0 APPLICATIONS APPROVED, NOT ACCEPTED 0 $0 36 $160,114 66 $111,675 29 $42,081 0 $0 25 $96,098 0 $0 APPLICATIONS DENIED 1 $30,580 49 $132,287 284 $101,253 145 $30,677 0 $0 51 $76,573 2 $38,235 APPLICATIONS WITHDRAWN 2 $106,215 65 $146,593 136 $99,076 22 $53,156 0 $0 30 $121,253 0 $0 FILES CLOSED FOR INCOMPLETENESS 0 $0 14 $133,423 30 $123,386 0 $0 0 $0 5 $112,122 2 $245,665
Aggregated Statistics For Year 2005(Based on 2 full and 8 partial tracts) A) FHA, FSA/RHS & VA B) Conventional C) Refinancings D) Home Improvement Loans E) Loans on Dwellings For 5+ Families F) Non-occupant Loans on G) Loans On Manufactured Number Average Value Number Average Value Number Average Value Number Average Value Number Average Value Number Average Value Number Average Value
LOANS ORIGINATED 6 $113,782 410 $146,318 433 $116,966 167 $39,107 3 $5,340,353 151 $104,112 0 $0 APPLICATIONS APPROVED, NOT ACCEPTED 2 $42,110 54 $150,276 84 $100,282 20 $30,562 0 $0 13 $69,704 0 $0 APPLICATIONS DENIED 0 $0 54 $87,759 341 $88,257 180 $28,580 0 $0 87 $62,279 4 $96,580 APPLICATIONS WITHDRAWN 2 $46,840 55 $171,902 152 $130,760 36 $134,839 2 $173,975 23 $128,825 0 $0 FILES CLOSED FOR INCOMPLETENESS 0 $0 13 $116,982 63 $138,716 2 $35,630 0 $0 6 $76,802 0 $0
Aggregated Statistics For Year 2004(Based on 2 full and 8 partial tracts) A) FHA, FSA/RHS & VA B) Conventional C) Refinancings D) Home Improvement Loans F) Non-occupant Loans on Number Average Value Number Average Value Number Average Value Number Average Value Number Average Value
LOANS ORIGINATED 23 $127,557 344 $128,614 493 $109,539 123 $43,599 172 $98,477 APPLICATIONS APPROVED, NOT ACCEPTED 7 $164,527 46 $121,503 89 $87,232 21 $46,465 19 $75,069 APPLICATIONS DENIED 6 $155,243 60 $116,525 335 $79,347 179 $25,263 82 $35,801 APPLICATIONS WITHDRAWN 1 $66,360 45 $112,975 105 $75,840 26 $38,266 17 $99,723 FILES CLOSED FOR INCOMPLETENESS 0 $0 12 $193,071 49 $130,693 4 $30,440 12 $73,331
Aggregated Statistics For Year 2003(Based on 2 full and 8 partial tracts) A) FHA, FSA/RHS & VA B) Conventional C) Refinancings D) Home Improvement Loans E) Loans on Dwellings For 5+ Families F) Non-occupant Loans on Number Average Value Number Average Value Number Average Value Number Average Value Number Average Value Number Average Value
LOANS ORIGINATED 13 $115,742 328 $111,699 874 $106,852 118 $45,951 5 $6,176,912 274 $90,578 APPLICATIONS APPROVED, NOT ACCEPTED 0 $0 37 $100,216 147 $101,364 35 $24,813 0 $0 20 $98,508 APPLICATIONS DENIED 11 $64,344 43 $93,934 348 $84,805 140 $24,248 0 $0 50 $58,104 APPLICATIONS WITHDRAWN 5 $77,464 33 $125,497 167 $88,867 32 $33,298 0 $0 26 $93,372 FILES CLOSED FOR INCOMPLETENESS 2 $95,590 9 $148,683 28 $112,434 6 $21,287 0 $0 3 $65,863
Aggregated Statistics For Year 2002(Based on 2 full and 8 partial tracts) A) FHA, FSA/RHS & VA B) Conventional C) Refinancings D) Home Improvement Loans E) Loans on Dwellings For 5+ Families F) Non-occupant Loans on Number Average Value Number Average Value Number Average Value Number Average Value Number Average Value Number Average Value
LOANS ORIGINATED 29 $75,959 255 $1,915,222 439 $495,901 86 $30,568 0 $0 171 $1,000,826 APPLICATIONS APPROVED, NOT ACCEPTED 2 $31,580 14 $135,961 83 $69,533 26 $39,338 0 $0 9 $98,538 APPLICATIONS DENIED 4 $67,158 37 $90,184 308 $62,019 68 $29,973 2 $565,250 55 $65,595 APPLICATIONS WITHDRAWN 3 $34,330 28 $7,659,964 111 $62,523 20 $37,530 0 $0 19 $94,074 FILES CLOSED FOR INCOMPLETENESS 2 $84,120 8 $110,708 39 $76,704 5 $50,328 0 $0 2 $117,575
Aggregated Statistics For Year 2001(Based on 2 full and 8 partial tracts) A) FHA, FSA/RHS & VA B) Conventional C) Refinancings D) Home Improvement Loans F) Non-occupant Loans on Number Average Value Number Average Value Number Average Value Number Average Value Number Average Value
LOANS ORIGINATED 56 $80,629 180 $84,792 316 $82,345 79 $24,310 126 $65,795 APPLICATIONS APPROVED, NOT ACCEPTED 4 $57,192 15 $75,051 93 $68,275 33 $26,961 18 $75,929 APPLICATIONS DENIED 0 $0 26 $59,448 277 $47,911 109 $16,470 31 $39,980 APPLICATIONS WITHDRAWN 4 $60,542 11 $86,715 101 $50,452 21 $14,615 13 $55,434 FILES CLOSED FOR INCOMPLETENESS 0 $0 7 $106,247 35 $72,412 3 $44,453 4 $74,225
Aggregated Statistics For Year 2000(Based on 2 full and 8 partial tracts) A) FHA, FSA/RHS & VA B) Conventional C) Refinancings D) Home Improvement Loans E) Loans on Dwellings For 5+ Families F) Non-occupant Loans on Number Average Value Number Average Value Number Average Value Number Average Value Number Average Value Number Average Value
LOANS ORIGINATED 49 $69,871 215 $91,096 182 $54,800 93 $19,706 2 $902,640 92 $58,454 APPLICATIONS APPROVED, NOT ACCEPTED 3 $42,857 20 $58,657 52 $41,450 28 $21,030 0 $0 19 $47,087 APPLICATIONS DENIED 0 $0 47 $56,832 224 $41,492 136 $15,763 0 $0 41 $44,691 APPLICATIONS WITHDRAWN 7 $66,207 21 $89,951 98 $45,369 21 $22,191 0 $0 12 $51,900 FILES CLOSED FOR INCOMPLETENESS 3 $86,217 10 $33,840 36 $57,845 4 $36,912 0 $0 7 $42,586
Aggregated Statistics For Year 1999(Based on 5 partial tracts) A) FHA, FSA/RHS & VA B) Conventional C) Refinancings D) Home Improvement Loans E) Loans on Dwellings For 5+ Families F) Non-occupant Loans on Number Average Value Number Average Value Number Average Value Number Average Value Number Average Value Number Average Value
LOANS ORIGINATED 24 $69,811 94 $79,161 143 $61,469 51 $23,978 1 $186,820 39 $70,334 APPLICATIONS APPROVED, NOT ACCEPTED 1 $64,420 10 $71,296 63 $40,915 20 $14,221 0 $0 10 $39,393 APPLICATIONS DENIED 1 $54,820 24 $78,179 139 $52,195 72 $16,837 0 $0 20 $41,922 APPLICATIONS WITHDRAWN 1 $51,540 9 $89,593 74 $42,116 14 $32,944 0 $0 8 $40,460 FILES CLOSED FOR INCOMPLETENESS 2 $67,055 10 $70,276 27 $52,109 0 $0 0 $0 10 $47,584
Private Mortgage Insurance Companies Aggregated Statistics For Year 2009(Based on 2 full and 4 partial tracts) A) Conventional B) Refinancings C) Non-occupant Loans on Number Average Value Number Average Value Number Average Value
LOANS ORIGINATED 42 $236,289 17 $253,032 0 $0 APPLICATIONS APPROVED, NOT ACCEPTED 7 $327,860 2 $216,990 0 $0 APPLICATIONS DENIED 0 $0 0 $0 0 $0 APPLICATIONS WITHDRAWN 0 $0 2 $148,165 0 $0 FILES CLOSED FOR INCOMPLETENESS 1 $94,340 0 $0 1 $35,780
Aggregated Statistics For Year 2008(Based on 2 full and 8 partial tracts) A) Conventional B) Refinancings C) Non-occupant Loans on Number Average Value Number Average Value Number Average Value
LOANS ORIGINATED 91 $234,875 17 $223,892 9 $111,043 APPLICATIONS APPROVED, NOT ACCEPTED 37 $195,455 5 $197,412 6 $153,297 APPLICATIONS DENIED 3 $150,520 0 $0 3 $150,520 APPLICATIONS WITHDRAWN 2 $135,235 4 $212,210 0 $0 FILES CLOSED FOR INCOMPLETENESS 0 $0 2 $234,195 0 $0
Aggregated Statistics For Year 2007(Based on 2 full and 6 partial tracts) A) Conventional B) Refinancings C) Non-occupant Loans on Number Average Value Number Average Value Number Average Value
LOANS ORIGINATED 117 $165,949 5 $60,594 12 $103,800 APPLICATIONS APPROVED, NOT ACCEPTED 11 $144,719 2 $374,715 1 $59,860 APPLICATIONS DENIED 4 $188,440 2 $374,715 2 $301,110 APPLICATIONS WITHDRAWN 1 $81,330 0 $0 0 $0 FILES CLOSED FOR INCOMPLETENESS 1 $48,500 0 $0 0 $0
Aggregated Statistics For Year 2006(Based on 2 full and 8 partial tracts) A) Conventional B) Refinancings C) Non-occupant Loans on Number Average Value Number Average Value Number Average Value
LOANS ORIGINATED 47 $124,007 16 $164,621 16 $96,624 APPLICATIONS APPROVED, NOT ACCEPTED 11 $145,923 8 $185,065 1 $45,090 APPLICATIONS DENIED 2 $42,920 0 $0 2 $42,920 APPLICATIONS WITHDRAWN 1 $55,300 1 $31,880 1 $31,880 FILES CLOSED FOR INCOMPLETENESS 0 $0 0 $0 0 $0
Aggregated Statistics For Year 2005(Based on 2 full and 8 partial tracts) A) Conventional B) Refinancings C) Non-occupant Loans on Number Average Value Number Average Value Number Average Value
LOANS ORIGINATED 78 $143,234 10 $207,915 14 $93,441 APPLICATIONS APPROVED, NOT ACCEPTED 16 $123,722 3 $114,107 7 $136,337 APPLICATIONS DENIED 4 $44,362 0 $0 4 $44,362 APPLICATIONS WITHDRAWN 4 $166,328 1 $182,920 2 $137,650 FILES CLOSED FOR INCOMPLETENESS 0 $0 0 $0 0 $0
Aggregated Statistics For Year 2004(Based on 2 full and 8 partial tracts) A) Conventional B) Refinancings C) Non-occupant Loans on Number Average Value Number Average Value Number Average Value
LOANS ORIGINATED 100 $128,984 13 $104,255 21 $91,672 APPLICATIONS APPROVED, NOT ACCEPTED 16 $111,666 5 $73,040 0 $0 APPLICATIONS DENIED 0 $0 0 $0 0 $0 APPLICATIONS WITHDRAWN 4 $93,620 2 $125,225 0 $0 FILES CLOSED FOR INCOMPLETENESS 2 $108,975 0 $0 0 $0
Aggregated Statistics For Year 2003(Based on 2 full and 8 partial tracts) A) Conventional B) Refinancings C) Non-occupant Loans on Number Average Value Number Average Value Number Average Value
LOANS ORIGINATED 119 $116,328 47 $132,102 25 $98,896 APPLICATIONS APPROVED, NOT ACCEPTED 20 $114,676 15 $118,189 8 $75,278 APPLICATIONS DENIED 0 $0 2 $108,975 0 $0 APPLICATIONS WITHDRAWN 11 $156,974 4 $131,240 0 $0 FILES CLOSED FOR INCOMPLETENESS 2 $86,030 0 $0 2 $86,030
Aggregated Statistics For Year 2002(Based on 2 full and 8 partial tracts) A) Conventional B) Refinancings C) Non-occupant Loans on Number Average Value Number Average Value Number Average Value
LOANS ORIGINATED 109 $102,233 29 $91,107 40 $80,302 APPLICATIONS APPROVED, NOT ACCEPTED 10 $134,360 6 $79,847 4 $47,318 APPLICATIONS DENIED 1 $22,120 4 $75,995 4 $75,995 APPLICATIONS WITHDRAWN 4 $119,010 2 $267,650 2 $133,825 FILES CLOSED FOR INCOMPLETENESS 2 $81,250 0 $0 0 $0
Aggregated Statistics For Year 2001(Based on 2 full and 8 partial tracts) A) Conventional B) Refinancings C) Non-occupant Loans on Number Average Value Number Average Value Number Average Value
LOANS ORIGINATED 106 $86,030 30 $87,334 21 $54,881 APPLICATIONS APPROVED, NOT ACCEPTED 19 $85,923 4 $88,778 7 $61,791 APPLICATIONS DENIED 0 $0 2 $137,650 0 $0 APPLICATIONS WITHDRAWN 0 $0 0 $0 0 $0 FILES CLOSED FOR INCOMPLETENESS 0 $0 0 $0 0 $0
Aggregated Statistics For Year 2000(Based on 2 full and 8 partial tracts) A) Conventional B) Refinancings C) Non-occupant Loans on Number Average Value Number Average Value Number Average Value
LOANS ORIGINATED 84 $101,281 5 $47,358 21 $76,524 APPLICATIONS APPROVED, NOT ACCEPTED 14 $76,163 2 $21,520 0 $0 APPLICATIONS DENIED 6 $60,222 0 $0 2 $24,855 APPLICATIONS WITHDRAWN 2 $63,845 0 $0 0 $0 FILES CLOSED FOR INCOMPLETENESS 0 $0 0 $0 0 $0
Aggregated Statistics For Year 1999(Based on 5 partial tracts) A) Conventional B) Refinancings C) Non-occupant Loans on Number Average Value Number Average Value Number Average Value
LOANS ORIGINATED 41 $74,373 13 $73,779 7 $55,744 APPLICATIONS APPROVED, NOT ACCEPTED 5 $85,956 5 $69,022 0 $0 APPLICATIONS DENIED 2 $70,405 1 $90,190 1 $49,700 APPLICATIONS WITHDRAWN 3 $62,887 0 $0 0 $0 FILES CLOSED FOR INCOMPLETENESS 1 $34,970 0 $0 1 $34,970
2010 - 2018 National Fire Incident Reporting System (NFIRS) incidents See full 2006 National Fire Incident Reporting System statistics for zip code 19129, Pennsylvania
Most common first names in zip code 19129 among deceased individuals Name Count Lived (average)
John 158 71.9 years Mary 150 79.9 years William 118 71.7 years James 109 71.4 years Joseph 88 71.5 years Margaret 80 78.4 years Helen 75 78.8 years Charles 65 71.9 years Anna 63 81.8 years Thomas 61 71.8 years
Most common last names in zip code 19129 among deceased individuals Last name Count Lived (average)
Brown 28 76.6 years Johnson 26 65.5 years Kelly 25 76.0 years Jones 25 72.9 years Williams 24 73.7 years Smith 23 69.6 years Lewis 17 69.8 years Taylor 16 68.2 years Walker 16 74.9 years Gallagher 16 73.9 years
Businesses in zip code 19129
Name Count Name Count
Dunkin Donuts 2 Rite Aid 1 FedEx 1 U-Haul 1 GNC 1 UPS 2

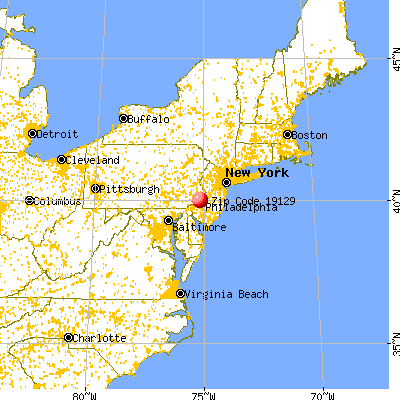


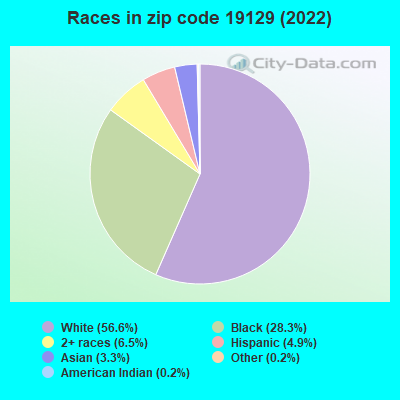


 Nearest zip codes: 19132, 19144, 19121, 19131, 19140, 19119.
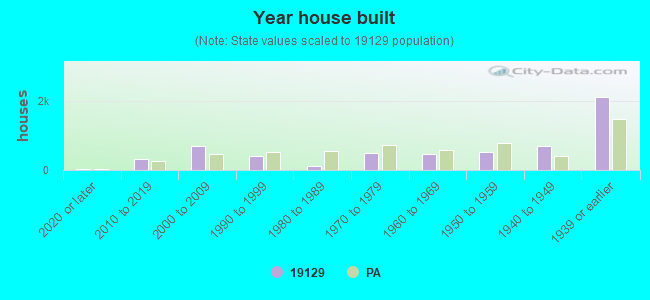

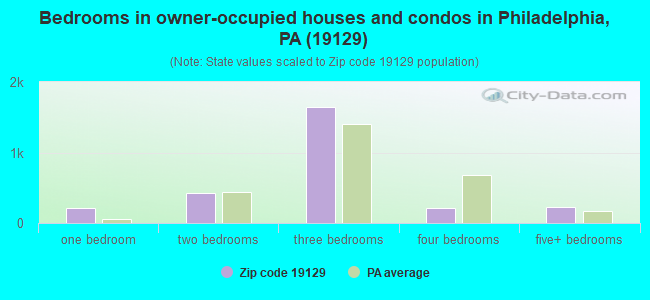
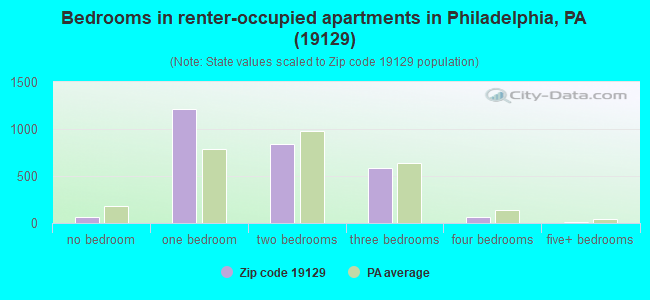
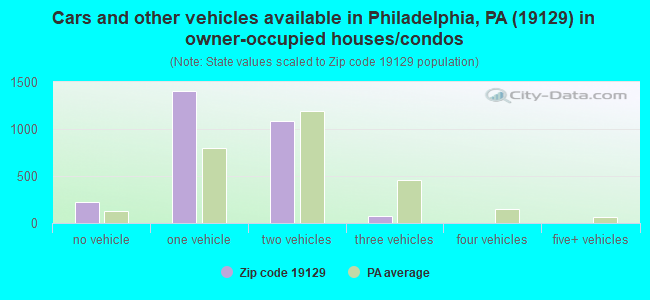
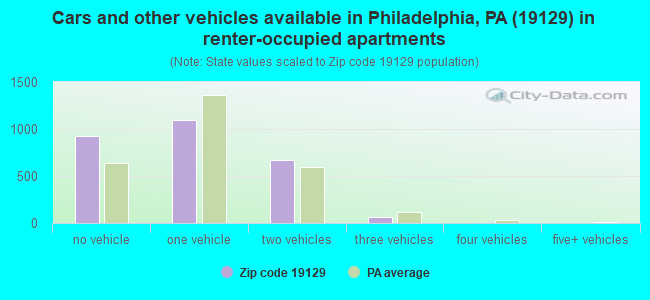


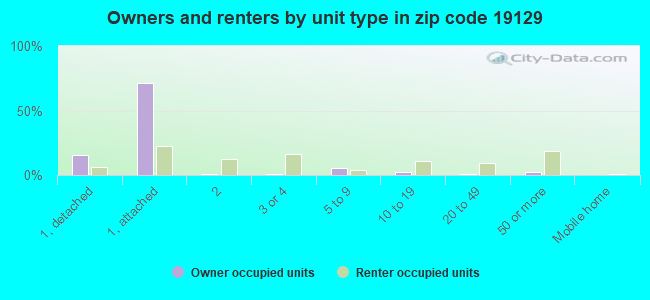
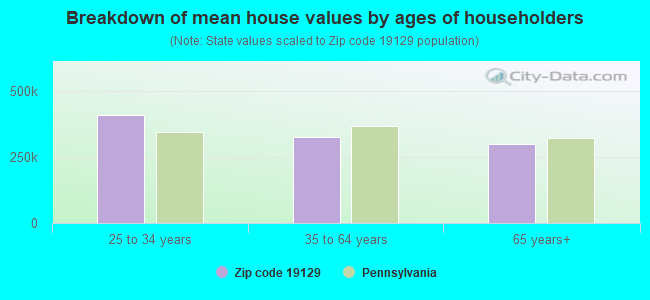


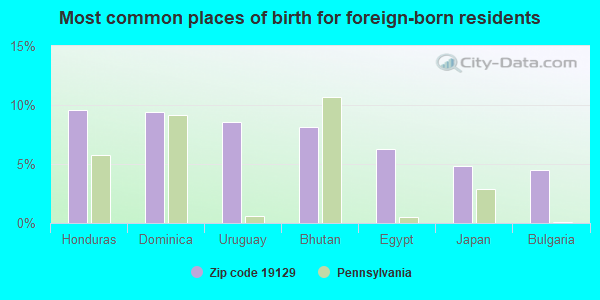
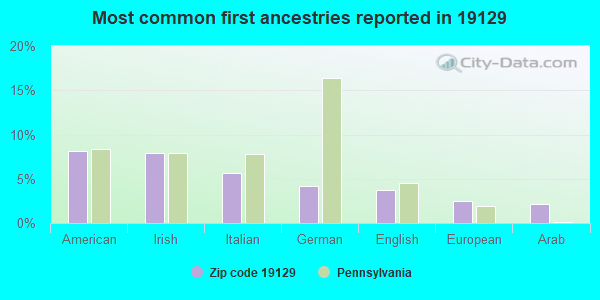
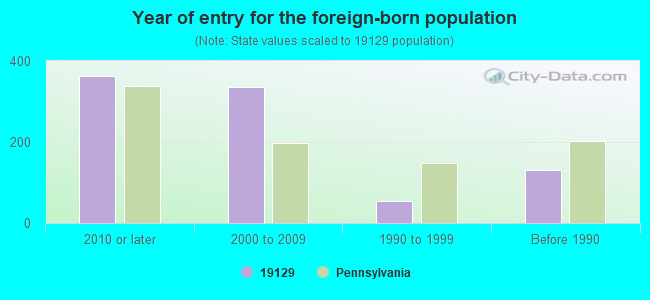


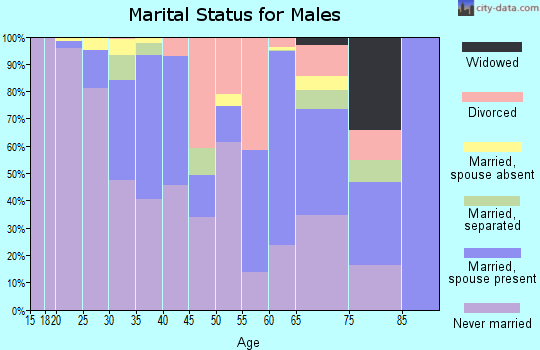
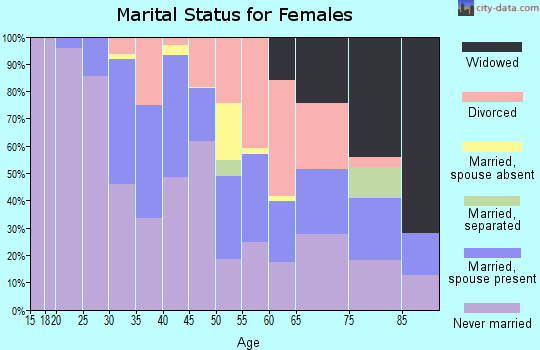
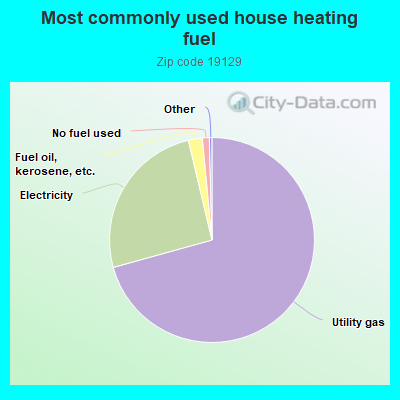
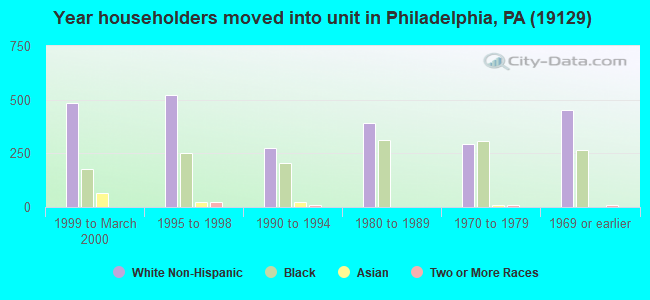
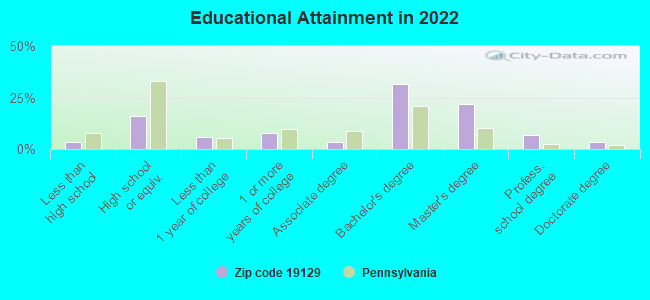
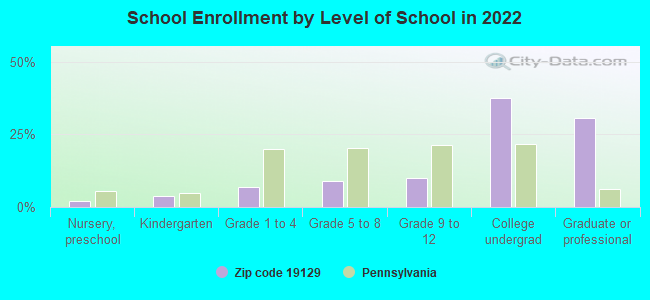
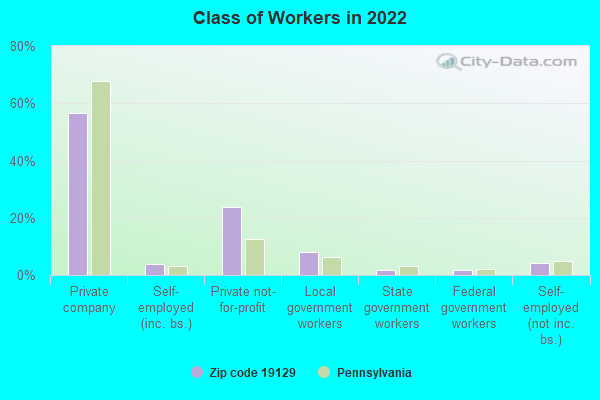
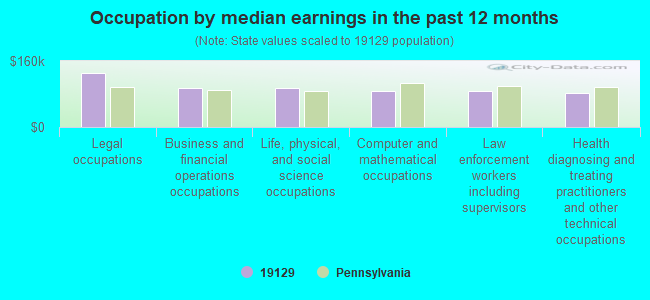
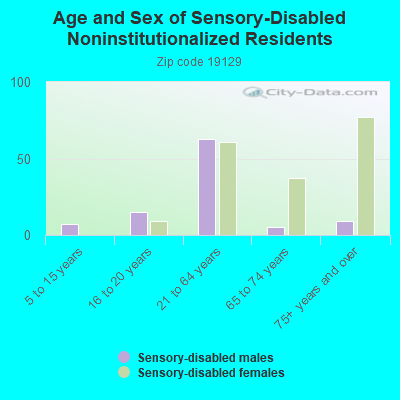
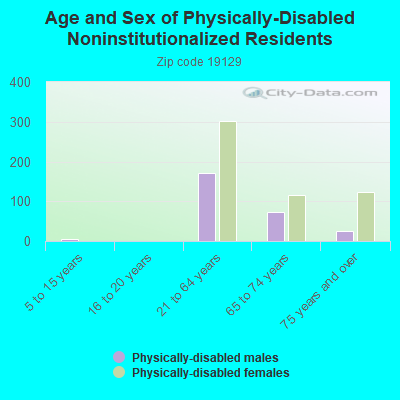
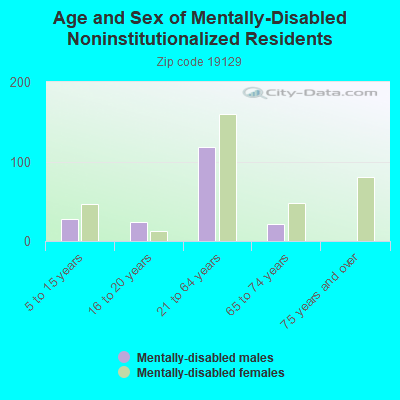
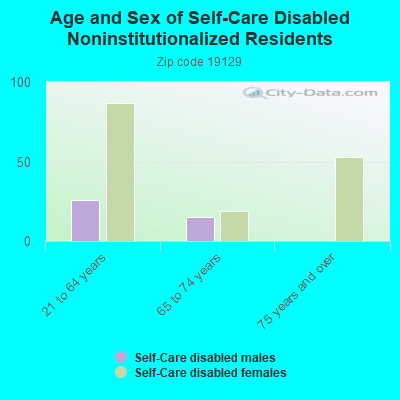
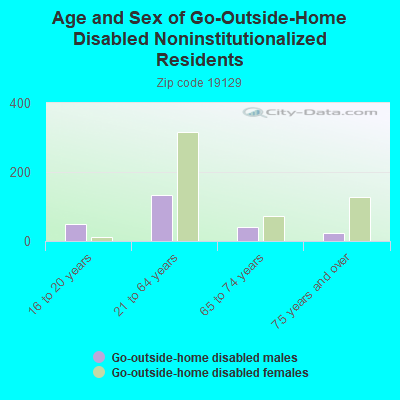
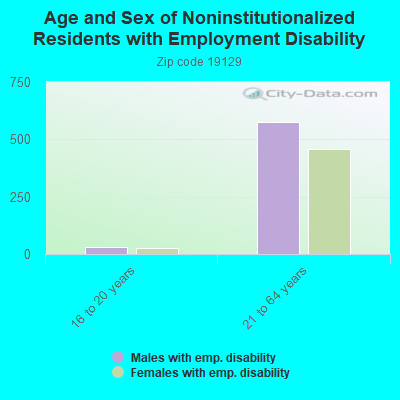
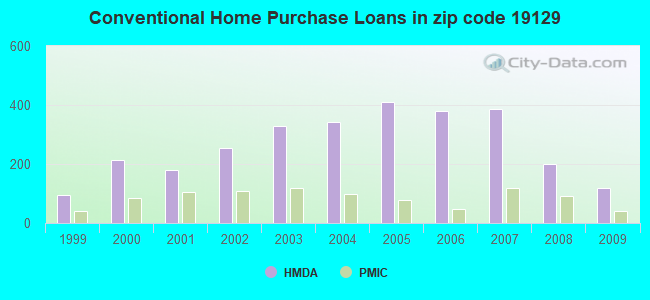
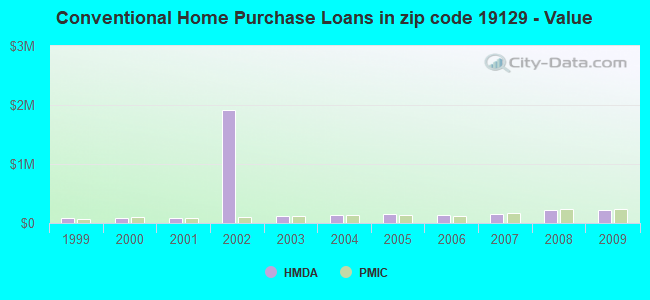
 According to the data from the years 2010 - 2018 the average number of fire incidents per year is 43. The highest number of reported fires - 73 took place in 2018, and the least - 0 in 2016. The data has a rising trend.
 When looking into fire subcategories, the most incidents belonged to: Structure Fires (34.3%), and Outside Fires (32.2%).