Estimated zip code population in 2022: 37,690
Zip code population in 2010: 36,572
Zip code population in 2000: 34,935
Houses and condos: 19,235
Renter-occupied apartments: 10,682
% of renters here:
67%State:
31%
March 2022 cost of living index in zip code 19121: 106.8
(more than average, U.S. average is 100)
Land area: 2.2
sq. mi.
Water area: 0.1
sq. mi.
Population density: 17,046 people per square mile (very high).
OSM Map
General Map
Google Map
MSN Map
OSM Map
General Map
Google Map
MSN Map
OSM Map
General Map
Google Map
MSN Map
OSM Map
General Map
Google Map
MSN Map
Please wait while loading the map...
Real estate property taxes paid for housing units in 2022:
This zip code:
0.5% ($1,102)Pennsylvania:
1.3% ($3,094)
Median real estate property taxes paid for housing units with mortgages in 2022: $1,470 (0.5%)
Median real estate property taxes paid for housing units with no mortgage in 2022: $706 (0.5%)
Profiles of local businesses
Business Search - 14 Million verified businesses
Males: 17,196 Females: 20,494
For population 25 years and over in 19121:
High school or higher: 82.7%Bachelor's degree or higher: 26.1%Graduate or professional degree: 12.4%Unemployed: 12.2%Mean travel time to work (commute): 31.2 minutes
For population 15 years and over in 19121:
Never married: 70.1%Now married: 14.7%Separated: 1.6%Widowed: 4.6%Divorced: 9.0%
Zip code 19121 compared to state average:
Median household income below state average. Unemployed percentage above state average. Black race population percentage significantly above state average. Median age significantly below state average. Renting percentage above state average. Length of stay since moving in above state average. Number of college students above state average. Percentage of population with a bachelor's degree or higher below state average. 25,008 66.4% Black 6,467 17.2% White 2,954 7.8% Hispanic or Latino 1,977 5.2% Asian 1,108 2.9% Two or more races 148 0.4% Some other race 24 0.06% American Indian
Data:
Median household income ($)
Median household income (% change since 2000)
Household income diversity
Ratio of average income to average house value (%)
Ratio of average income to average rent
Median household income ($) - White
Median household income ($) - Black or African American
Median household income ($) - Asian
Median household income ($) - Hispanic or Latino
Median household income ($) - American Indian and Alaska Native
Median household income ($) - Multirace
Median household income ($) - Other Race
Median household income for houses/condos with a mortgage ($)
Median household income for apartments without a mortgage ($)
Races - White alone (%)
Races - White alone (% change since 2000)
Races - Black alone (%)
Races - Black alone (% change since 2000)
Races - American Indian alone (%)
Races - American Indian alone (% change since 2000)
Races - Asian alone (%)
Races - Asian alone (% change since 2000)
Races - Hispanic (%)
Races - Hispanic (% change since 2000)
Races - Native Hawaiian and Other Pacific Islander alone (%)
Races - Native Hawaiian and Other Pacific Islander alone (% change since 2000)
Races - Two or more races (%)
Races - Two or more races (% change since 2000)
Races - Other race alone (%)
Races - Other race alone (% change since 2000)
Racial diversity
Unemployment (%)
Unemployment (% change since 2000)
Unemployment (%) - White
Unemployment (%) - Black or African American
Unemployment (%) - Asian
Unemployment (%) - Hispanic or Latino
Unemployment (%) - American Indian and Alaska Native
Unemployment (%) - Multirace
Unemployment (%) - Other Race
Population density (people per square mile)
Population - Males (%)
Population - Females (%)
Population - Males (%) - White
Population - Males (%) - Black or African American
Population - Males (%) - Asian
Population - Males (%) - Hispanic or Latino
Population - Males (%) - American Indian and Alaska Native
Population - Males (%) - Multirace
Population - Males (%) - Other Race
Population - Females (%) - White
Population - Females (%) - Black or African American
Population - Females (%) - Asian
Population - Females (%) - Hispanic or Latino
Population - Females (%) - American Indian and Alaska Native
Population - Females (%) - Multirace
Population - Females (%) - Other Race
Coronavirus confirmed cases (Apr 27, 2024)
Deaths caused by coronavirus (Apr 27, 2024)
Coronavirus confirmed cases (per 100k population) (Apr 27, 2024)
Deaths caused by coronavirus (per 100k population) (Apr 27, 2024)
Daily increase in number of cases (Apr 27, 2024)
Weekly increase in number of cases (Apr 27, 2024)
Cases doubled (in days) (Apr 27, 2024)
Hospitalized patients (Apr 18, 2022)
Negative test results (Apr 18, 2022)
Total test results (Apr 18, 2022)
COVID Vaccine doses distributed (per 100k population) (Sep 19, 2023)
COVID Vaccine doses administered (per 100k population) (Sep 19, 2023)
COVID Vaccine doses distributed (Sep 19, 2023)
COVID Vaccine doses administered (Sep 19, 2023)
Likely homosexual households (%)
Likely homosexual households (% change since 2000)
Likely homosexual households - Lesbian couples (%)
Likely homosexual households - Lesbian couples (% change since 2000)
Likely homosexual households - Gay men (%)
Likely homosexual households - Gay men (% change since 2000)
Cost of living index
Median gross rent ($)
Median contract rent ($)
Median monthly housing costs ($)
Median house or condo value ($)
Median house or condo value ($ change since 2000)
Mean house or condo value by units in structure - 1, detached ($)
Mean house or condo value by units in structure - 1, attached ($)
Mean house or condo value by units in structure - 2 ($)
Mean house or condo value by units in structure by units in structure - 3 or 4 ($)
Mean house or condo value by units in structure - 5 or more ($)
Mean house or condo value by units in structure - Boat, RV, van, etc. ($)
Mean house or condo value by units in structure - Mobile home ($)
Median house or condo value ($) - White
Median house or condo value ($) - Black or African American
Median house or condo value ($) - Asian
Median house or condo value ($) - Hispanic or Latino
Median house or condo value ($) - American Indian and Alaska Native
Median house or condo value ($) - Multirace
Median house or condo value ($) - Other Race
Median resident age
Resident age diversity
Median resident age - Males
Median resident age - Females
Median resident age - White
Median resident age - Black or African American
Median resident age - Asian
Median resident age - Hispanic or Latino
Median resident age - American Indian and Alaska Native
Median resident age - Multirace
Median resident age - Other Race
Median resident age - Males - White
Median resident age - Males - Black or African American
Median resident age - Males - Asian
Median resident age - Males - Hispanic or Latino
Median resident age - Males - American Indian and Alaska Native
Median resident age - Males - Multirace
Median resident age - Males - Other Race
Median resident age - Females - White
Median resident age - Females - Black or African American
Median resident age - Females - Asian
Median resident age - Females - Hispanic or Latino
Median resident age - Females - American Indian and Alaska Native
Median resident age - Females - Multirace
Median resident age - Females - Other Race
Commute - mean travel time to work (minutes)
Travel time to work - Less than 5 minutes (%)
Travel time to work - Less than 5 minutes (% change since 2000)
Travel time to work - 5 to 9 minutes (%)
Travel time to work - 5 to 9 minutes (% change since 2000)
Travel time to work - 10 to 19 minutes (%)
Travel time to work - 10 to 19 minutes (% change since 2000)
Travel time to work - 20 to 29 minutes (%)
Travel time to work - 20 to 29 minutes (% change since 2000)
Travel time to work - 30 to 39 minutes (%)
Travel time to work - 30 to 39 minutes (% change since 2000)
Travel time to work - 40 to 59 minutes (%)
Travel time to work - 40 to 59 minutes (% change since 2000)
Travel time to work - 60 to 89 minutes (%)
Travel time to work - 60 to 89 minutes (% change since 2000)
Travel time to work - 90 or more minutes (%)
Travel time to work - 90 or more minutes (% change since 2000)
Marital status - Never married (%)
Marital status - Now married (%)
Marital status - Separated (%)
Marital status - Widowed (%)
Marital status - Divorced (%)
Median family income ($)
Median family income (% change since 2000)
Median non-family income ($)
Median non-family income (% change since 2000)
Median per capita income ($)
Median per capita income (% change since 2000)
Median family income ($) - White
Median family income ($) - Black or African American
Median family income ($) - Asian
Median family income ($) - Hispanic or Latino
Median family income ($) - American Indian and Alaska Native
Median family income ($) - Multirace
Median family income ($) - Other Race
Median year house/condo built
Median year apartment built
Year house built - Built 2005 or later (%)
Year house built - Built 2000 to 2004 (%)
Year house built - Built 1990 to 1999 (%)
Year house built - Built 1980 to 1989 (%)
Year house built - Built 1970 to 1979 (%)
Year house built - Built 1960 to 1969 (%)
Year house built - Built 1950 to 1959 (%)
Year house built - Built 1940 to 1949 (%)
Year house built - Built 1939 or earlier (%)
Average household size
Household density (households per square mile)
Average household size - White
Average household size - Black or African American
Average household size - Asian
Average household size - Hispanic or Latino
Average household size - American Indian and Alaska Native
Average household size - Multirace
Average household size - Other Race
Occupied housing units (%)
Vacant housing units (%)
Owner occupied housing units (%)
Renter occupied housing units (%)
Vacancy status - For rent (%)
Vacancy status - For sale only (%)
Vacancy status - Rented or sold, not occupied (%)
Vacancy status - For seasonal, recreational, or occasional use (%)
Vacancy status - For migrant workers (%)
Vacancy status - Other vacant (%)
Residents with income below the poverty level (%)
Residents with income below 50% of the poverty level (%)
Children below poverty level (%)
Poor families by family type - Married-couple family (%)
Poor families by family type - Male, no wife present (%)
Poor families by family type - Female, no husband present (%)
Poverty status for native-born residents (%)
Poverty status for foreign-born residents (%)
Poverty among high school graduates not in families (%)
Poverty among people who did not graduate high school not in families (%)
Residents with income below the poverty level (%) - White
Residents with income below the poverty level (%) - Black or African American
Residents with income below the poverty level (%) - Asian
Residents with income below the poverty level (%) - Hispanic or Latino
Residents with income below the poverty level (%) - American Indian and Alaska Native
Residents with income below the poverty level (%) - Multirace
Residents with income below the poverty level (%) - Other Race
Air pollution - Air Quality Index (AQI)
Air pollution - CO
Air pollution - NO2
Air pollution - SO2
Air pollution - Ozone
Air pollution - PM10
Air pollution - PM25
Air pollution - Pb
Crime - Murders per 100,000 population
Crime - Rapes per 100,000 population
Crime - Robberies per 100,000 population
Crime - Assaults per 100,000 population
Crime - Burglaries per 100,000 population
Crime - Thefts per 100,000 population
Crime - Auto thefts per 100,000 population
Crime - Arson per 100,000 population
Crime - City-data.com crime index
Crime - Violent crime index
Crime - Property crime index
Crime - Murders per 100,000 population (5 year average)
Crime - Rapes per 100,000 population (5 year average)
Crime - Robberies per 100,000 population (5 year average)
Crime - Assaults per 100,000 population (5 year average)
Crime - Burglaries per 100,000 population (5 year average)
Crime - Thefts per 100,000 population (5 year average)
Crime - Auto thefts per 100,000 population (5 year average)
Crime - Arson per 100,000 population (5 year average)
Crime - City-data.com crime index (5 year average)
Crime - Violent crime index (5 year average)
Crime - Property crime index (5 year average)
1996 Presidential Elections Results (%) - Democratic Party (Clinton)
1996 Presidential Elections Results (%) - Republican Party (Dole)
1996 Presidential Elections Results (%) - Other
2000 Presidential Elections Results (%) - Democratic Party (Gore)
2000 Presidential Elections Results (%) - Republican Party (Bush)
2000 Presidential Elections Results (%) - Other
2004 Presidential Elections Results (%) - Democratic Party (Kerry)
2004 Presidential Elections Results (%) - Republican Party (Bush)
2004 Presidential Elections Results (%) - Other
2008 Presidential Elections Results (%) - Democratic Party (Obama)
2008 Presidential Elections Results (%) - Republican Party (McCain)
2008 Presidential Elections Results (%) - Other
2012 Presidential Elections Results (%) - Democratic Party (Obama)
2012 Presidential Elections Results (%) - Republican Party (Romney)
2012 Presidential Elections Results (%) - Other
2016 Presidential Elections Results (%) - Democratic Party (Clinton)
2016 Presidential Elections Results (%) - Republican Party (Trump)
2016 Presidential Elections Results (%) - Other
2020 Presidential Elections Results (%) - Democratic Party (Biden)
2020 Presidential Elections Results (%) - Republican Party (Trump)
2020 Presidential Elections Results (%) - Other
Ancestries Reported - Arab (%)
Ancestries Reported - Czech (%)
Ancestries Reported - Danish (%)
Ancestries Reported - Dutch (%)
Ancestries Reported - English (%)
Ancestries Reported - French (%)
Ancestries Reported - French Canadian (%)
Ancestries Reported - German (%)
Ancestries Reported - Greek (%)
Ancestries Reported - Hungarian (%)
Ancestries Reported - Irish (%)
Ancestries Reported - Italian (%)
Ancestries Reported - Lithuanian (%)
Ancestries Reported - Norwegian (%)
Ancestries Reported - Polish (%)
Ancestries Reported - Portuguese (%)
Ancestries Reported - Russian (%)
Ancestries Reported - Scotch-Irish (%)
Ancestries Reported - Scottish (%)
Ancestries Reported - Slovak (%)
Ancestries Reported - Subsaharan African (%)
Ancestries Reported - Swedish (%)
Ancestries Reported - Swiss (%)
Ancestries Reported - Ukrainian (%)
Ancestries Reported - United States (%)
Ancestries Reported - Welsh (%)
Ancestries Reported - West Indian (%)
Ancestries Reported - Other (%)
Educational Attainment - No schooling completed (%)
Educational Attainment - Less than high school (%)
Educational Attainment - High school or equivalent (%)
Educational Attainment - Less than 1 year of college (%)
Educational Attainment - 1 or more years of college (%)
Educational Attainment - Associate degree (%)
Educational Attainment - Bachelor's degree (%)
Educational Attainment - Master's degree (%)
Educational Attainment - Professional school degree (%)
Educational Attainment - Doctorate degree (%)
School Enrollment - Nursery, preschool (%)
School Enrollment - Kindergarten (%)
School Enrollment - Grade 1 to 4 (%)
School Enrollment - Grade 5 to 8 (%)
School Enrollment - Grade 9 to 12 (%)
School Enrollment - College undergrad (%)
School Enrollment - Graduate or professional (%)
School Enrollment - Not enrolled in school (%)
School enrollment - Public schools (%)
School enrollment - Private schools (%)
School enrollment - Not enrolled (%)
Median number of rooms in houses and condos
Median number of rooms in apartments
Housing units lacking complete plumbing facilities (%)
Housing units lacking complete kitchen facilities (%)
Density of houses
Urban houses (%)
Rural houses (%)
Households with people 60 years and over (%)
Households with people 65 years and over (%)
Households with people 75 years and over (%)
Households with one or more nonrelatives (%)
Households with no nonrelatives (%)
Population in households (%)
Family households (%)
Nonfamily households (%)
Population in families (%)
Family households with own children (%)
Median number of bedrooms in owner occupied houses
Mean number of bedrooms in owner occupied houses
Median number of bedrooms in renter occupied houses
Mean number of bedrooms in renter occupied houses
Median number of vehichles in owner occupied houses
Mean number of vehichles in owner occupied houses
Median number of vehichles in renter occupied houses
Mean number of vehichles in renter occupied houses
Mortgage status - with mortgage (%)
Mortgage status - with second mortgage (%)
Mortgage status - with home equity loan (%)
Mortgage status - with both second mortgage and home equity loan (%)
Mortgage status - without a mortgage (%)
Average family size
Average family size - White
Average family size - Black or African American
Average family size - Asian
Average family size - Hispanic or Latino
Average family size - American Indian and Alaska Native
Average family size - Multirace
Average family size - Other Race
Geographical mobility - Same house 1 year ago (%)
Geographical mobility - Moved within same county (%)
Geographical mobility - Moved from different county within same state (%)
Geographical mobility - Moved from different state (%)
Geographical mobility - Moved from abroad (%)
Place of birth - Born in state of residence (%)
Place of birth - Born in other state (%)
Place of birth - Native, outside of US (%)
Place of birth - Foreign born (%)
Housing units in structures - 1, detached (%)
Housing units in structures - 1, attached (%)
Housing units in structures - 2 (%)
Housing units in structures - 3 or 4 (%)
Housing units in structures - 5 to 9 (%)
Housing units in structures - 10 to 19 (%)
Housing units in structures - 20 to 49 (%)
Housing units in structures - 50 or more (%)
Housing units in structures - Mobile home (%)
Housing units in structures - Boat, RV, van, etc. (%)
House/condo owner moved in on average (years ago)
Renter moved in on average (years ago)
Year householder moved into unit - Moved in 1999 to March 2000 (%)
Year householder moved into unit - Moved in 1995 to 1998 (%)
Year householder moved into unit - Moved in 1990 to 1994 (%)
Year householder moved into unit - Moved in 1980 to 1989 (%)
Year householder moved into unit - Moved in 1970 to 1979 (%)
Year householder moved into unit - Moved in 1969 or earlier (%)
Means of transportation to work - Drove car alone (%)
Means of transportation to work - Carpooled (%)
Means of transportation to work - Public transportation (%)
Means of transportation to work - Bus or trolley bus (%)
Means of transportation to work - Streetcar or trolley car (%)
Means of transportation to work - Subway or elevated (%)
Means of transportation to work - Railroad (%)
Means of transportation to work - Ferryboat (%)
Means of transportation to work - Taxicab (%)
Means of transportation to work - Motorcycle (%)
Means of transportation to work - Bicycle (%)
Means of transportation to work - Walked (%)
Means of transportation to work - Other means (%)
Working at home (%)
Industry diversity
Most Common Industries - Agriculture, forestry, fishing and hunting, and mining (%)
Most Common Industries - Agriculture, forestry, fishing and hunting (%)
Most Common Industries - Mining, quarrying, and oil and gas extraction (%)
Most Common Industries - Construction (%)
Most Common Industries - Manufacturing (%)
Most Common Industries - Wholesale trade (%)
Most Common Industries - Retail trade (%)
Most Common Industries - Transportation and warehousing, and utilities (%)
Most Common Industries - Transportation and warehousing (%)
Most Common Industries - Utilities (%)
Most Common Industries - Information (%)
Most Common Industries - Finance and insurance, and real estate and rental and leasing (%)
Most Common Industries - Finance and insurance (%)
Most Common Industries - Real estate and rental and leasing (%)
Most Common Industries - Professional, scientific, and management, and administrative and waste management services (%)
Most Common Industries - Professional, scientific, and technical services (%)
Most Common Industries - Management of companies and enterprises (%)
Most Common Industries - Administrative and support and waste management services (%)
Most Common Industries - Educational services, and health care and social assistance (%)
Most Common Industries - Educational services (%)
Most Common Industries - Health care and social assistance (%)
Most Common Industries - Arts, entertainment, and recreation, and accommodation and food services (%)
Most Common Industries - Arts, entertainment, and recreation (%)
Most Common Industries - Accommodation and food services (%)
Most Common Industries - Other services, except public administration (%)
Most Common Industries - Public administration (%)
Occupation diversity
Most Common Occupations - Management, business, science, and arts occupations (%)
Most Common Occupations - Management, business, and financial occupations (%)
Most Common Occupations - Management occupations (%)
Most Common Occupations - Business and financial operations occupations (%)
Most Common Occupations - Computer, engineering, and science occupations (%)
Most Common Occupations - Computer and mathematical occupations (%)
Most Common Occupations - Architecture and engineering occupations (%)
Most Common Occupations - Life, physical, and social science occupations (%)
Most Common Occupations - Education, legal, community service, arts, and media occupations (%)
Most Common Occupations - Community and social service occupations (%)
Most Common Occupations - Legal occupations (%)
Most Common Occupations - Education, training, and library occupations (%)
Most Common Occupations - Arts, design, entertainment, sports, and media occupations (%)
Most Common Occupations - Healthcare practitioners and technical occupations (%)
Most Common Occupations - Health diagnosing and treating practitioners and other technical occupations (%)
Most Common Occupations - Health technologists and technicians (%)
Most Common Occupations - Service occupations (%)
Most Common Occupations - Healthcare support occupations (%)
Most Common Occupations - Protective service occupations (%)
Most Common Occupations - Fire fighting and prevention, and other protective service workers including supervisors (%)
Most Common Occupations - Law enforcement workers including supervisors (%)
Most Common Occupations - Food preparation and serving related occupations (%)
Most Common Occupations - Building and grounds cleaning and maintenance occupations (%)
Most Common Occupations - Personal care and service occupations (%)
Most Common Occupations - Sales and office occupations (%)
Most Common Occupations - Sales and related occupations (%)
Most Common Occupations - Office and administrative support occupations (%)
Most Common Occupations - Natural resources, construction, and maintenance occupations (%)
Most Common Occupations - Farming, fishing, and forestry occupations (%)
Most Common Occupations - Construction and extraction occupations (%)
Most Common Occupations - Installation, maintenance, and repair occupations (%)
Most Common Occupations - Production, transportation, and material moving occupations (%)
Most Common Occupations - Production occupations (%)
Most Common Occupations - Transportation occupations (%)
Most Common Occupations - Material moving occupations (%)
People in Group quarters - Institutionalized population (%)
People in Group quarters - Correctional institutions (%)
People in Group quarters - Federal prisons and detention centers (%)
People in Group quarters - Halfway houses (%)
People in Group quarters - Local jails and other confinement facilities (including police lockups) (%)
People in Group quarters - Military disciplinary barracks (%)
People in Group quarters - State prisons (%)
People in Group quarters - Other types of correctional institutions (%)
People in Group quarters - Nursing homes (%)
People in Group quarters - Hospitals/wards, hospices, and schools for the handicapped (%)
People in Group quarters - Hospitals/wards and hospices for chronically ill (%)
People in Group quarters - Hospices or homes for chronically ill (%)
People in Group quarters - Military hospitals or wards for chronically ill (%)
People in Group quarters - Other hospitals or wards for chronically ill (%)
People in Group quarters - Hospitals or wards for drug/alcohol abuse (%)
People in Group quarters - Mental (Psychiatric) hospitals or wards (%)
People in Group quarters - Schools, hospitals, or wards for the mentally retarded (%)
People in Group quarters - Schools, hospitals, or wards for the physically handicapped (%)
People in Group quarters - Institutions for the deaf (%)
People in Group quarters - Institutions for the blind (%)
People in Group quarters - Orthopedic wards and institutions for the physically handicapped (%)
People in Group quarters - Wards in general hospitals for patients who have no usual home elsewhere (%)
People in Group quarters - Wards in military hospitals for patients who have no usual home elsewhere (%)
People in Group quarters - Juvenile institutions (%)
People in Group quarters - Long-term care (%)
People in Group quarters - Homes for abused, dependent, and neglected children (%)
People in Group quarters - Residential treatment centers for emotionally disturbed children (%)
People in Group quarters - Training schools for juvenile delinquents (%)
People in Group quarters - Short-term care, detention or diagnostic centers for delinquent children (%)
People in Group quarters - Type of juvenile institution unknown (%)
People in Group quarters - Noninstitutionalized population (%)
People in Group quarters - College dormitories (includes college quarters off campus) (%)
People in Group quarters - Military quarters (%)
People in Group quarters - On base (%)
People in Group quarters - Barracks, unaccompanied personnel housing (UPH), (Enlisted/Officer), ;and similar group living quarters for military personnel (%)
People in Group quarters - Transient quarters for temporary residents (%)
People in Group quarters - Military ships (%)
People in Group quarters - Group homes (%)
People in Group quarters - Homes or halfway houses for drug/alcohol abuse (%)
People in Group quarters - Homes for the mentally ill (%)
People in Group quarters - Homes for the mentally retarded (%)
People in Group quarters - Homes for the physically handicapped (%)
People in Group quarters - Other group homes (%)
People in Group quarters - Religious group quarters (%)
People in Group quarters - Dormitories (%)
People in Group quarters - Agriculture workers' dormitories on farms (%)
People in Group quarters - Job Corps and vocational training facilities (%)
People in Group quarters - Other workers' dormitories (%)
People in Group quarters - Crews of maritime vessels (%)
People in Group quarters - Other nonhousehold living situations (%)
People in Group quarters - Other noninstitutional group quarters (%)
Residents speaking English at home (%)
Residents speaking English at home - Born in the United States (%)
Residents speaking English at home - Native, born elsewhere (%)
Residents speaking English at home - Foreign born (%)
Residents speaking Spanish at home (%)
Residents speaking Spanish at home - Born in the United States (%)
Residents speaking Spanish at home - Native, born elsewhere (%)
Residents speaking Spanish at home - Foreign born (%)
Residents speaking other language at home (%)
Residents speaking other language at home - Born in the United States (%)
Residents speaking other language at home - Native, born elsewhere (%)
Residents speaking other language at home - Foreign born (%)
Class of Workers - Employee of private company (%)
Class of Workers - Self-employed in own incorporated business (%)
Class of Workers - Private not-for-profit wage and salary workers (%)
Class of Workers - Local government workers (%)
Class of Workers - State government workers (%)
Class of Workers - Federal government workers (%)
Class of Workers - Self-employed workers in own not incorporated business and Unpaid family workers (%)
House heating fuel used in houses and condos - Utility gas (%)
House heating fuel used in houses and condos - Bottled, tank, or LP gas (%)
House heating fuel used in houses and condos - Electricity (%)
House heating fuel used in houses and condos - Fuel oil, kerosene, etc. (%)
House heating fuel used in houses and condos - Coal or coke (%)
House heating fuel used in houses and condos - Wood (%)
House heating fuel used in houses and condos - Solar energy (%)
House heating fuel used in houses and condos - Other fuel (%)
House heating fuel used in houses and condos - No fuel used (%)
House heating fuel used in apartments - Utility gas (%)
House heating fuel used in apartments - Bottled, tank, or LP gas (%)
House heating fuel used in apartments - Electricity (%)
House heating fuel used in apartments - Fuel oil, kerosene, etc. (%)
House heating fuel used in apartments - Coal or coke (%)
House heating fuel used in apartments - Wood (%)
House heating fuel used in apartments - Solar energy (%)
House heating fuel used in apartments - Other fuel (%)
House heating fuel used in apartments - No fuel used (%)
Armed forces status - In Armed Forces (%)
Armed forces status - Civilian (%)
Armed forces status - Civilian - Veteran (%)
Armed forces status - Civilian - Nonveteran (%)
Fatal accidents locations in years 2005-2021
Fatal accidents locations in 2005
Fatal accidents locations in 2006
Fatal accidents locations in 2007
Fatal accidents locations in 2008
Fatal accidents locations in 2009
Fatal accidents locations in 2010
Fatal accidents locations in 2011
Fatal accidents locations in 2012
Fatal accidents locations in 2013
Fatal accidents locations in 2014
Fatal accidents locations in 2015
Fatal accidents locations in 2016
Fatal accidents locations in 2017
Fatal accidents locations in 2018
Fatal accidents locations in 2019
Fatal accidents locations in 2020
Fatal accidents locations in 2021
Alcohol use - People drinking some alcohol every month (%)
Alcohol use - People not drinking at all (%)
Alcohol use - Average days/month drinking alcohol
Alcohol use - Average drinks/week
Alcohol use - Average days/year people drink much
Audiometry - Average condition of hearing (%)
Audiometry - People that can hear a whisper from across a quiet room (%)
Audiometry - People that can hear normal voice from across a quiet room (%)
Audiometry - Ears ringing, roaring, buzzing (%)
Audiometry - Had a job exposure to loud noise (%)
Audiometry - Had off-work exposure to loud noise (%)
Blood Pressure & Cholesterol - Has high blood pressure (%)
Blood Pressure & Cholesterol - Checking blood pressure at home (%)
Blood Pressure & Cholesterol - Frequently checking blood cholesterol (%)
Blood Pressure & Cholesterol - Has high cholesterol level (%)
Consumer Behavior - Money monthly spent on food at supermarket/grocery store
Consumer Behavior - Money monthly spent on food at other stores
Consumer Behavior - Money monthly spent on eating out
Consumer Behavior - Money monthly spent on carryout/delivered foods
Consumer Behavior - Income spent on food at supermarket/grocery store (%)
Consumer Behavior - Income spent on food at other stores (%)
Consumer Behavior - Income spent on eating out (%)
Consumer Behavior - Income spent on carryout/delivered foods (%)
Current Health Status - General health condition (%)
Current Health Status - Blood donors (%)
Current Health Status - Has blood ever tested for HIV virus (%)
Current Health Status - Left-handed people (%)
Dermatology - People using sunscreen (%)
Diabetes - Diabetics (%)
Diabetes - Had a blood test for high blood sugar (%)
Diabetes - People taking insulin (%)
Diet Behavior & Nutrition - Diet health (%)
Diet Behavior & Nutrition - Milk product consumption (# of products/month)
Diet Behavior & Nutrition - Meals not home prepared (#/week)
Diet Behavior & Nutrition - Meals from fast food or pizza place (#/week)
Diet Behavior & Nutrition - Ready-to-eat foods (#/month)
Diet Behavior & Nutrition - Frozen meals/pizza (#/month)
Drug Use - People that ever used marijuana or hashish (%)
Drug Use - Ever used hard drugs (%)
Drug Use - Ever used any form of cocaine (%)
Drug Use - Ever used heroin (%)
Drug Use - Ever used methamphetamine (%)
Health Insurance - People covered by health insurance (%)
Kidney Conditions-Urology - Avg. # of times urinating at night
Medical Conditions - People with asthma (%)
Medical Conditions - People with anemia (%)
Medical Conditions - People with psoriasis (%)
Medical Conditions - People with overweight (%)
Medical Conditions - Elderly people having difficulties in thinking or remembering (%)
Medical Conditions - People who ever received blood transfusion (%)
Medical Conditions - People having trouble seeing even with glass/contacts (%)
Medical Conditions - People with arthritis (%)
Medical Conditions - People with gout (%)
Medical Conditions - People with congestive heart failure (%)
Medical Conditions - People with coronary heart disease (%)
Medical Conditions - People with angina pectoris (%)
Medical Conditions - People who ever had heart attack (%)
Medical Conditions - People who ever had stroke (%)
Medical Conditions - People with emphysema (%)
Medical Conditions - People with thyroid problem (%)
Medical Conditions - People with chronic bronchitis (%)
Medical Conditions - People with any liver condition (%)
Medical Conditions - People who ever had cancer or malignancy (%)
Mental Health - People who have little interest in doing things (%)
Mental Health - People feeling down, depressed, or hopeless (%)
Mental Health - People who have trouble sleeping or sleeping too much (%)
Mental Health - People feeling tired or having little energy (%)
Mental Health - People with poor appetite or overeating (%)
Mental Health - People feeling bad about themself (%)
Mental Health - People who have trouble concentrating on things (%)
Mental Health - People moving or speaking slowly or too fast (%)
Mental Health - People having thoughts they would be better off dead (%)
Oral Health - Average years since last visit a dentist
Oral Health - People embarrassed because of mouth (%)
Oral Health - People with gum disease (%)
Oral Health - General health of teeth and gums (%)
Oral Health - Average days a week using dental floss/device
Oral Health - Average days a week using mouthwash for dental problem
Oral Health - Average number of teeth
Pesticide Use - Households using pesticides to control insects (%)
Pesticide Use - Households using pesticides to kill weeds (%)
Physical Activity - People doing vigorous-intensity work activities (%)
Physical Activity - People doing moderate-intensity work activities (%)
Physical Activity - People walking or bicycling (%)
Physical Activity - People doing vigorous-intensity recreational activities (%)
Physical Activity - People doing moderate-intensity recreational activities (%)
Physical Activity - Average hours a day doing sedentary activities
Physical Activity - Average hours a day watching TV or videos
Physical Activity - Average hours a day using computer
Physical Functioning - People having limitations keeping them from working (%)
Physical Functioning - People limited in amount of work they can do (%)
Physical Functioning - People that need special equipment to walk (%)
Physical Functioning - People experiencing confusion/memory problems (%)
Physical Functioning - People requiring special healthcare equipment (%)
Prescription Medications - Average number of prescription medicines taking
Preventive Aspirin Use - Adults 40+ taking low-dose aspirin (%)
Reproductive Health - Vaginal deliveries (%)
Reproductive Health - Cesarean deliveries (%)
Reproductive Health - Deliveries resulted in a live birth (%)
Reproductive Health - Pregnancies resulted in a delivery (%)
Reproductive Health - Women breastfeeding newborns (%)
Reproductive Health - Women that had a hysterectomy (%)
Reproductive Health - Women that had both ovaries removed (%)
Reproductive Health - Women that have ever taken birth control pills (%)
Reproductive Health - Women taking birth control pills (%)
Reproductive Health - Women that have ever used Depo-Provera or injectables (%)
Reproductive Health - Women that have ever used female hormones (%)
Sexual Behavior - People 18+ that ever had sex (vaginal, anal, or oral) (%)
Sexual Behavior - Males 18+ that ever had vaginal sex with a woman (%)
Sexual Behavior - Males 18+ that ever performed oral sex on a woman (%)
Sexual Behavior - Males 18+ that ever had anal sex with a woman (%)
Sexual Behavior - Males 18+ that ever had any sex with a man (%)
Sexual Behavior - Females 18+ that ever had vaginal sex with a man (%)
Sexual Behavior - Females 18+ that ever performed oral sex on a man (%)
Sexual Behavior - Females 18+ that ever had anal sex with a man (%)
Sexual Behavior - Females 18+ that ever had any kind of sex with a woman (%)
Sexual Behavior - Average age people first had sex
Sexual Behavior - Average number of female sex partners in lifetime (males 18+)
Sexual Behavior - Average number of female vaginal sex partners in lifetime (males 18+)
Sexual Behavior - Average age people first performed oral sex on a woman (18+)
Sexual Behavior - Average number of woman performed oral sex on in lifetime (18+)
Sexual Behavior - Average number of male sex partners in lifetime (males 18+)
Sexual Behavior - Average number of male anal sex partners in lifetime (males 18+)
Sexual Behavior - Average age people first performed oral sex on a man (18+)
Sexual Behavior - Average number of male oral sex partners in lifetime (18+)
Sexual Behavior - People using protection when performing oral sex (%)
Sexual Behavior - Average number of times people have vaginal or anal sex a year
Sexual Behavior - People having sex without condom (%)
Sexual Behavior - Average number of male sex partners in lifetime (females 18+)
Sexual Behavior - Average number of male vaginal sex partners in lifetime (females 18+)
Sexual Behavior - Average number of female sex partners in lifetime (females 18+)
Sexual Behavior - Circumcised males 18+ (%)
Sleep Disorders - Average hours sleeping at night
Sleep Disorders - People that has trouble sleeping (%)
Smoking-Cigarette Use - People smoking cigarettes (%)
Taste & Smell - People 40+ having problems with smell (%)
Taste & Smell - People 40+ having problems with taste (%)
Taste & Smell - People 40+ that ever had wisdom teeth removed (%)
Taste & Smell - People 40+ that ever had tonsils teeth removed (%)
Taste & Smell - People 40+ that ever had a loss of consciousness because of a head injury (%)
Taste & Smell - People 40+ that ever had a broken nose or other serious injury to face or skull (%)
Taste & Smell - People 40+ that ever had two or more sinus infections (%)
Weight - Average height (inches)
Weight - Average weight (pounds)
Weight - Average BMI
Weight - People that are obese (%)
Weight - People that ever were obese (%)
Weight - People trying to lose weight (%)
100%
urban population.
Estimated median house/condo value in 2022: $236,275
19121:
$236,275Pennsylvania:
$245,500
Median resident age: This zip code:
27.3 yearsPennsylvania median age:
40.9 years
Average household size: This zip code:
2.3 peoplePennsylvania:
2.4 people
Averages for the 2020 tax year for zip code 19121, filed in 2021:
Average Adjusted Gross Income (AGI) in 2020: $37,156 (Individual Income Tax Returns) Here:
$37,156State:
$75,707
Salary/wage: $34,867 (reported on 86.9% of returns )Here:
$34,867State:
$62,806
(% of AGI for various income ranges: 957.5% for AGIs below $25k , 3297.3% for AGIs $25k-50k , 6692.4% for AGIs $50k-75k , 10313.1% for AGIs $75k-100k , 18324.6% for AGIs $100k-200k , 79837.5% for AGIs over 200k ) Taxable interest for individuals: $296 (reported on 9.6% of returns )This zip code:
$296Pennsylvania:
$1,633
(% of AGI for various income ranges: 1.3% for AGIs below $25k , 1.5% for AGIs $25k-50k , 4.9% for AGIs $50k-75k , 10.2% for AGIs $75k-100k , 36.5% for AGIs $100k-200k , 50.0% for AGIs over 200k ) Ordinary dividends: $1,041 (reported on 5.6% of returns )(% of AGI for various income ranges: 1.5% for AGIs below $25k , 3.0% for AGIs $25k-50k , 14.2% for AGIs $50k-75k , 17.3% for AGIs $75k-100k , 57.6% for AGIs $100k-200k , 330.0% for AGIs over 200k ) Net capital gain/loss in AGI: +$5,606 (reported on 5.9% of returns )Here:
+$5,606State:
+$23,522
(% of AGI for various income ranges: 3.4% for AGIs below $25k , 3.8% for AGIs $25k-50k , 37.9% for AGIs $50k-75k , 71.4% for AGIs $75k-100k , 306.2% for AGIs $100k-200k , 6020.0% for AGIs over 200k ) Profit/loss from business: +$4,907 (reported on 12.2% of returns )Here:
+$4,907State:
+$16,274
(% of AGI for various income ranges: 53.1% for AGIs below $25k , 35.5% for AGIs $25k-50k , 56.1% for AGIs $50k-75k , 206.7% for AGIs $75k-100k , 258.9% for AGIs $100k-200k , 3507.5% for AGIs over 200k ) Taxable individual retirement arrangement distribution: $10,195 (reported on 1.4% of returns )19121:
$10,195Pennsylvania:
$18,583
(% of AGI for various income ranges: 6.0% for AGIs below $25k , 13.7% for AGIs $25k-50k , 45.6% for AGIs $50k-75k , 54.5% for AGIs $75k-100k , 73.0% for AGIs $100k-200k ) Total itemized deductions: $23,404 (reported on 4.9% of returns )Here:
$23,404State:
$34,850
(% of AGI for various income ranges: 5.0% for AGIs below $25k , 75.4% for AGIs $25k-50k , 293.5% for AGIs $50k-75k , 609.2% for AGIs $75k-100k , 1135.1% for AGIs $100k-200k , 3900.0% for AGIs over 200k ) Charity contributions: $6,782 (reported on 3.8% of returns )(% of AGI for various income ranges: 21.9% for AGIs $25k-50k , 73.6% for AGIs $50k-75k , 139.0% for AGIs $75k-100k , 225.9% for AGIs $100k-200k , 472.5% for AGIs over 200k ) Taxes paid: $7,179 (reported on 4.9% of returns )(% of AGI for various income ranges: 1.2% for AGIs below $25k , 17.3% for AGIs $25k-50k , 81.0% for AGIs $50k-75k , 202.0% for AGIs $75k-100k , 433.8% for AGIs $100k-200k , 1217.5% for AGIs over 200k ) Earned income credit: $2,370 (reported on 30.1% of returns )(% of AGI for various income ranges: 116.5% for AGIs below $25k , 91.2% for AGIs $25k-50k ) Percentage of individuals using paid preparers for their 2020 taxes: 93.8%(% for various income ranges: 94.7% for AGIs below $25k , 93.1% for AGIs $25k-50k , 92.1% for AGIs $50k-75k , 92.5% for AGIs $75k-100k , 94.9% for AGIs $100k-200k , 100.0% for AGIs over 200k )
Averages for the 2012 tax year for zip code 19121, filed in 2013:
Average Adjusted Gross Income (AGI) in 2012: $23,716 (Individual Income Tax Returns) Here:
$23,716State:
$61,346
Salary/wage: $22,660 (reported on 88.5% of returns )Here:
$22,660State:
$51,902
(% of AGI for various income ranges: 79.5% for AGIs below $25k , 89.6% for AGIs $25k-50k , 89.7% for AGIs $50k-75k , 84.5% for AGIs $75k-100k , 68.0% for AGIs $100k-200k ) Taxable interest for individuals: $313 (reported on 6.2% of returns )This zip code:
$313Pennsylvania:
$1,588
(% of AGI for various income ranges: 0.1% for AGIs $75k-100k ) Ordinary dividends: $1,050 (reported on 2.1% of returns )(% of AGI for various income ranges: 0.2% for AGIs below $25k , 0.1% for AGIs $100k-200k ) Net capital gain/loss in AGI: +$353 (reported on 1.3% of returns )(% of AGI for various income ranges: ) Profit/loss from business: +$7,718 (reported on 9.9% of returns )Here:
+$7,718State:
+$16,268
(% of AGI for various income ranges: 7.7% for AGIs below $25k , 0.5% for AGIs $25k-50k , 0.4% for AGIs $50k-75k , 5.4% for AGIs $75k-100k ) Taxable individual retirement arrangement distribution: $7,456 (reported on 1.6% of returns )19121:
$7,456Pennsylvania:
$14,550
(% of AGI for various income ranges: 0.4% for AGIs below $25k , 0.4% for AGIs $25k-50k , 1.4% for AGIs $50k-75k ) Total itemized deductions: $15,215 (28% of AGI, reported on 10.4% of returns )Here:
$15,215State:
$23,538
Here:
28.1% of AGIState:
18.4% of AGI
(% of AGI for various income ranges: 2.0% for AGIs below $25k , 6.6% for AGIs $25k-50k , 11.4% for AGIs $50k-75k , 14.0% for AGIs $75k-100k , 13.3% for AGIs $100k-200k ) Charity contributions: $4,015 (reported on 8.4% of returns )(% of AGI for various income ranges: 0.4% for AGIs below $25k , 1.4% for AGIs $25k-50k , 2.6% for AGIs $50k-75k , 3.1% for AGIs $75k-100k , 2.6% for AGIs $100k-200k ) Taxes paid: $4,598 (reported on 10.3% of returns )(% of AGI for various income ranges: 0.4% for AGIs below $25k , 1.7% for AGIs $25k-50k , 3.6% for AGIs $50k-75k , 5.2% for AGIs $75k-100k , 5.0% for AGIs $100k-200k ) Earned income credit: $2,608 (reported on 48.6% of returns )(% of AGI for various income ranges: 13.4% for AGIs below $25k , 2.0% for AGIs $25k-50k ) Percentage of individuals using paid preparers for their 2012 taxes: 41.2%(% for various income ranges: 41.6% for AGIs below $25k , 39.7% for AGIs $25k-50k , 40.8% for AGIs $50k-75k , 45.0% for AGIs $75k-100k , 50.0% for AGIs $100k-200k )
Averages for the 2004 tax year for zip code 19121, filed in 2005:
Average Adjusted Gross Income (AGI) in 2004: $20,086 (Individual Income Tax Returns) Here:
$20,086State:
$48,049
Salary/wage: $19,610 (reported on 91.9% of returns )Here:
$19,610State:
$42,646
(% of AGI for various income ranges: 85.3% for AGIs below $10k , 88.2% for AGIs $10k-25k , 93.1% for AGIs $25k-50k , 91.4% for AGIs $50k-75k , 84.9% for AGIs $75k-100k , 66.9% for AGIs over 100k ) Taxable interest for individuals: $529 (reported on 8.5% of returns )This zip code:
$529Pennsylvania:
$1,657
(% of AGI for various income ranges: 0.3% for AGIs below $10k , 0.2% for AGIs $10k-25k , 0.3% for AGIs $25k-50k , 0.2% for AGIs $50k-75k , 0.3% for AGIs $75k-100k , 0.1% for AGIs over 100k ) Taxable dividends: $462 (reported on 2.1% of returns )(% of AGI for various income ranges: 0.1% for AGIs below $10k , 0.0% for AGIs $10k-25k , 0.1% for AGIs $25k-50k , 0.1% for AGIs $50k-75k , 0.1% for AGIs $75k-100k ) Net capital gain/loss: +$161 (reported on 1.1% of returns )(% of AGI for various income ranges: -0.1% for AGIs below $10k , 0.0% for AGIs $10k-25k , -0.0% for AGIs $25k-50k , -0.0% for AGIs $50k-75k , 0.3% for AGIs $75k-100k ) Profit/loss from business: +$4,820 (reported on 4.9% of returns )Here:
+$4,820State:
+$14,267
(% of AGI for various income ranges: 5.1% for AGIs below $10k , 2.0% for AGIs $10k-25k , 0.3% for AGIs $25k-50k , -0.3% for AGIs $50k-75k ) IRA payment deduction: $1,473 (reported on 0.9% of returns )19121:
$1,473Pennsylvania:
$2,903
Total itemized deductions: $13,192 (30% of AGI, reported on 10.9% of returns )Here:
$13,192State:
$18,804
Here:
30.2% of AGIState:
19.5% of AGI
(% of AGI for various income ranges: 0.8% for AGIs below $10k , 3.6% for AGIs $10k-25k , 8.1% for AGIs $25k-50k , 14.0% for AGIs $50k-75k , 13.2% for AGIs $75k-100k , 19.4% for AGIs over 100k ) Charity contributions deductions: $4,121 (9% of AGI, reported on 9.9% of returns )Here:
9.2% of AGIState:
3.3% of AGI
(% of AGI for various income ranges: 0.1% for AGIs below $10k , 0.7% for AGIs $10k-25k , 2.3% for AGIs $25k-50k , 4.2% for AGIs $50k-75k , 4.3% for AGIs $75k-100k , 7.9% for AGIs over 100k ) Total tax: $2,239 (reported on 44.0% of returns )(% of AGI for various income ranges: 1.2% for AGIs below $10k , 2.2% for AGIs $10k-25k , 5.3% for AGIs $25k-50k , 9.6% for AGIs $50k-75k , 12.0% for AGIs $75k-100k , 15.9% for AGIs over 100k ) Earned income credit: $2,016 (reported on 53.7% of returns )Percentage of individuals using paid preparers for their 2004 taxes: 59.8%(% for various income ranges: 60.0% for AGIs below $10k , 64.8% for AGIs $10k-25k , 53.0% for AGIs $25k-50k , 51.4% for AGIs $50k-75k , 52.7% for AGIs $75k-100k , 66.7% for AGIs over 100k )
Estimated median household income in 2022: This zip code:
$35,002Pennsylvania:
$71,798
Nearest zip codes: 19130 ,
19132 ,
19103 ,
19104 ,
19129 ,
19102 .
Philadelphia Zip Code Map
Percentage of family households: This zip code:
37.7%Pennsylvania:
42.6%
Percentage of households with unmarried partners: This zip code:
3.8%Pennsylvania:
46.5%
Likely homosexual households (counted as self-reported same-sex unmarried-partner households)
Lesbian couples: 0.5% of all households Gay men: 0.1% of all households
Household received Food Stamps/SNAP in the past 12 months: 6,180Household did not receive Food Stamps/SNAP in the past 12 months: 10,021
Women who had a birth in the past 12 months: 457 (152 now married , 269 unmarried) Women who did not have a birth in the past 12 months: 12,775 (1,267 now married , 11,641 unmarried)
Housing units in zip code 19121 with a mortgage: 2,786 (307
second mortgage , 34
home equity loan , 254
both second mortgage and home equity loan )
Houses without a mortgage: 125
Median monthly owner costs for units with a mortgage: $1,405
Median monthly owner costs for units without a mortgage: $483
Residents with income below the poverty level in 2022:
This zip code:
40.0%Whole state:
11.8%
Residents with income below 50% of the poverty level in 2022:
This zip code:
18.8%Whole state:
6.1%
Median number of rooms in houses and condos: Median number of rooms in apartments:
Year house built (houses)
296 2020 or later2,659 2010 to 20191,669 2000 to 2009945 1990 to 1999935 1980 to 19891,134 1970 to 19791,197 1960 to 19691,276 1950 to 19591,701 1940 to 19497,585 1939 or earlier
Zip code 19121 household income distribution in 2022 3,102 Less than $10,0001,347 $10,000 to $14,9991,412 $15,000 to $19,999873 $20,000 to $24,999838 $25,000 to $29,999605 $30,000 to $34,999460 $35,000 to $39,999799 $40,000 to $44,999384 $45,000 to $49,9991,072 $50,000 to $59,9991,432 $60,000 to $74,9991,273 $75,000 to $99,999679 $100,000 to $124,999703 $125,000 to $149,999622 $150,000 to $199,999639 $200,000 or moreEstimate of home value of owner-occupied houses/condos in 2022 in zip code 19121 69 Less than $10,00040 $15,000 to $19,999103 $20,000 to $24,9998 $30,000 to $34,99967 $35,000 to $39,999144 $40,000 to $49,99997 $50,000 to $59,99982 $60,000 to $69,99971 $70,000 to $79,999164 $80,000 to $89,99974 $90,000 to $99,999221 $100,000 to $124,999558 $125,000 to $149,999123 $150,000 to $174,999236 $175,000 to $199,999672 $200,000 to $249,999938 $250,000 to $299,999661 $300,000 to $399,999408 $400,000 to $499,999338 $500,000 to $749,99921 $1,000,000 to $1,499,99914 $2,000,000 or moreRent paid by renters in 2022 in zip code 19121 308 Less than $100192 $100 to $149158 $150 to $199432 $200 to $249208 $250 to $299270 $300 to $34938 $350 to $39977 $400 to $449177 $450 to $49953 $500 to $549220 $550 to $599906 $600 to $649600 $650 to $699316 $700 to $749263 $750 to $799648 $800 to $899691 $900 to $9991,881 $1,000 to $1,2491,249 $1,250 to $1,4991,106 $1,500 to $1,999240 $2,000 to $2,499250 $2,500 to $2,99921 $3,000 to $3,49932 $3,500 or more455 No cash rent
Median gross rent in 2022: $1,122.
Median price asked for vacant for-sale houses and condos in 2022: $268,179.
Estimated median house (or condo) value in 2022 for: White Non-Hispanic householders: $805,482Black or African American householders: $231,978American Indian or Alaska Native householders: $698,084Asian householders: $402,741Some other race householders: $237,348Two or more races householders: $402,741Hispanic or Latino householders: $295,343Estimated median house or condo value in 2022: $236,275
19121:
$236,275Pennsylvania:
$245,500
Lower value quartile - upper value quartile: $140,536 - $317,739
Mean price in 2022: Detached houses: $382,521Here:
$382,521State:
$317,202
Townhouses or other attached units: $260,733Here:
$260,733State:
$254,369
In 2-unit structures: $270,436Here:
$270,436State:
$249,182
In 3-to-4-unit structures: $324,453Here:
$324,453State:
$297,446
In 5-or-more-unit structures: $444,254Here:
$444,254State:
$320,068
Mobile homes: $57,703Here:
$57,703State:
$92,414
Occupied boats, RVs, vans, etc.: $424,146Here:
$424,146State:
$563,750
Housing units in structures:
One, detached: 1,208One, attached: 10,377Two: 1,9233 or 4: 2,7275 to 9: 48310 to 19: 42720 to 49: 78850 or more: 1,240Mobile homes: 72Unemployment : 12.2%
Means of transportation to work in zip code 19121 31.5% 5,052 Drove a car alone5.9% 953 Carpooled20.0% 3,213 Bus or trolley bus6.4% 1,025 Streetcar or trolley car0.8% 123 Subway or elevated0.1% 17 Railroad0.2% 35 Taxi0.2% 36 Motorcycle2.4% 390 Bicycle10.2% 1,637 Walked0.1% 10 Other means17.1% 2,738 Worked at homeTravel time to work (commute) in zip code 19121 466 Less than 5 minutes764 5 to 9 minutes1,257 10 to 14 minutes1,777 15 to 19 minutes1,921 20 to 24 minutes377 25 to 29 minutes2,376 30 to 34 minutes249 35 to 39 minutes574 40 to 44 minutes1,428 45 to 59 minutes1,699 60 to 89 minutes488 90 or more minutes
Neighborhoods in zip code 19121: Percentage of zip code residents living and working in this county: 89.9%
Household type by relationship:
Households: 37,690
Male householders: 5,677 (2,930 living alone ), Female householders: 10,333 (3,494 living alone )1,711 spouses (1,658 opposite-sex spouses ), 1,237 unmarried partners , (999 opposite-sex unmarried partners ), 9,949 children (9,538 natural , 203 adopted , 209 stepchildren ), 1,795 grandchildren , 301 brothers or sisters , 248 parents , 0 foster children , 1,261 other relatives , 3,508 non-relatives In group quarters: 1,319 (-1 institutionalized population )
Size of family households: 3,183 2-persons , 2,090 3-persons , 1,168 4-persons , 507 5-persons , 54 6-persons , 372 7-or-more-persons
Size of nonfamily households: 6,424 1-person , 1,178 2-persons , 463 3-persons , 383 4-persons , 190 5-persons
1,254 married couples with children. single-parent households (462 men , 4,809 women ).
87.5% of residents of 19121 zip code speak English at home. of residents speak Spanish at home (71% very well, 17% well, 7% not well, 6% not at all ).of residents speak other Indo-European language at home (76% very well, 22% well, 2% not well ).of residents speak Asian or Pacific Island language at home (46% very well, 38% well, 14% not well, 1% not at all ).of residents speak other language at home (68% very well, 32% well ).
Foreign born population: 3,138 (8.3%)
(41.3%
of them are naturalized citizens )
This zip code:
8.3%Whole state:
7.5%
16% Haiti 10% Dominica 9% Honduras 5% Japan 4% Malaysia 3% Cabo Verde 3% Bhutan 6% American 2% Jamaican 2% African 2% Italian 2% Irish 2% German 1% French
Year of entry for the foreign-born population
1,548 2010 or later 1,007 2000 to 2009 827 1990 to 1999 219 Before 1990
There are
38 Medical Specialists in Zip Code 19121 .
Facilities with environmental interests located in this zip code:
ATLANTIC 0364 1404 (1600-08 N BROAD ST in PHILADELPHIA, PA)
STATE MASTER (Pennsylvania database) - RCRIS-PAD987324480, HAZARDOUS WASTE PROGRAM Conditionally Exempt Small Quantity Generators, less than 100 kg/month of hazardous waste (Resource Conservation and Recovery Act (tracking hazardous waste)) - notification Organizations: OPERNAME (CONTACT/OPERATOR)
, ATLANTIC REFINING & MKTNG CO (CONTACT/OWNER)
, ATLANTIC REFINING & MARKETING CORPORATION (CONTACT/OWNER)
Alternative names: ATLANTIC SERVICE STATION
ACA AMOCO 505 (1840 RIDGE AVE in PHILADELPHIA, PA)
STATE MASTER (Pennsylvania database) - RCRIS-PAD987342797, HAZARDOUS WASTE PROGRAM Small Quantity Generators, between 100 kg and 1000 kg of hazardous waste/month (Resource Conservation and Recovery Act (tracking hazardous waste)) - notification Organizations: OPERNAME (CONTACT/OPERATOR)
, ACA MANAGEMENT SERVICES (CONTACT/OWNER)
Alternative names: ACA AMOCO #505
ALLIANCE FOR PROGRESS CS ( in PHILADELPHIA, PA)
(National Center for Education Statistics) - STATE ID-7543
BLAINE JAMES G SCHOOL (3001 W BERKS ST in PHILADELPHIA, PA)
(National Center for Education Statistics) - STATE ID-3662 Organizations: PHILADELPHIA CITY SD (SCHOOL DISTRICT)
ARDEX LABORATORIES INC (3060 W JEFFERSON ST in PHILADELPHIA, PA)
(Integrated Compliance Information System) - ICIS-03-1997-0365, FORMAL ENFORCEMENT ACTION Business SIC classification: SOAP AND OTHER DETERGENTS, EXCEPT SPECIALTY CLEANERS; SPECIALTY CLEANING, POLISHING, AND SANITATION PREPARATIONS
ACME MARKETS INCORPORATED (NORTH 31ST STREET AT WEST MASTER STREET in PHILADELPHIA, PA)
(Resource Conservation and Recovery Act (tracking hazardous waste)) Organizations: OPERNAME (CONTACT/OPERATOR)
, CALAN (CONTACT/OWNER)
BELL TELE OF PA POPULAR 1 XBAR REMOVAL (1601 JEFFERSON ST in PHILADELPHIA, PA)
(Resource Conservation and Recovery Act (tracking hazardous waste)) Organizations: OPERNAME (CONTACT/OPERATOR)
, BELL OF PA (CONTACT/OWNER)
AMOCO 5180 TANKS (1840 RIDGE AVE TANKS in PHILADELPHIA, PA)
Small Quantity Generators, between 100 kg and 1000 kg of hazardous waste/month (Resource Conservation and Recovery Act (tracking hazardous waste)) - notification Organizations: AMOCO OIL COMPANY (CONTACT/OWNER)
2129 N. 21ST. ST. (2129 N. 21ST. ST. in PHILADELPHIA, PA)
COMPLIANCE ACTIVITY (Tracking inspections of insecticide, fungicide, and rodenticide, and toxic substances)
3145 W. CLIFFORD ST. (3145 W. CLIFFORD ST. in PHILADELPHIA, PA)
COMPLIANCE ACTIVITY (Tracking inspections of insecticide, fungicide, and rodenticide, and toxic substances)
Housing units lacking complete plumbing facilities: 7.3%
Housing units lacking complete kitchen facilities: 7.3%
61.2% Utility gas 34.6% Electricity 1.7% No fuel used 1.5% Bottled, tank, or LP gas 0.9% Fuel oil, kerosene, etc.
Population in 1990: 46,705.
Place of birth for U.S.-born residents:
This state: 27,262Northeast: 2,828Midwest: 490South: 3,162West: 370
67% of the 19121 zip code residents lived in the same house 5 years ago.
Out of people who lived in different houses, 86% lived in this county.
Out of people who lived in different counties, 50% lived in Pennsylvania.
82% of the 19121 zip code residents lived in the same house 1 year ago.
Out of people who lived in different houses, 69% moved from this county.
Out of people who lived in different houses, 10% moved from different county within same state.
Out of people who lived in different houses, 13% moved from different state.
Out of people who lived in different houses, 4% moved from abroad.
Private vs. public school enrollment:
Students in private schools in grades 1 to 8 (elementary and middle school): 1,260
Here:
33.4%Pennsylvania:
15.7%
Students in private schools in grades 9 to 12 (high school): 312
Here:
16.5%Pennsylvania:
13.4%
Students in private undergraduate colleges: 1,297
Here:
24.4%Pennsylvania:
39.8%
Occupation by median earnings in the past 12 months ($)
101,409 Legal occupations 91,690 Health diagnosing and treating practitioners and other technical occupations 91,338 Computer and mathematical occupations 60,024 Architecture and engineering occupations 59,743 Management occupations 59,137 Community and social service occupations
Companies with federal contracts located in this zip code:
S & G ENTERPRISES, INC (3045 W JEFFERSON ST in PHILADELPHIA, PA; small business)
$26,228 with Defense Logistics Agency for Bushings, Rings, Shims, and Spacers. Signed on 2002-05-17. Completion date: 2002-07-16.
Top industries in this zip code by the number of employees in 2005:
Health Care and Social Assistance: Child and Youth Services (100-249 employees: 1 establishment, 50-99 employees: 1 establishment, 5-9 employees: 2 establishments, 1-4 employees: 1 establishment)Health Care and Social Assistance: Child Day Care Services (50-99: 1, 10-19: 2, 5-9: 1, 1-4: 5)Other Services (except Public Administration): Religious Organizations (10-19: 3, 5-9: 7, 1-4: 11)Accommodation and Food Services: Limited-Service Restaurants (20-49: 2, 10-19: 1, 5-9: 1, 1-4: 11)Educational Services: Elementary and Secondary Schools (50-99: 1, 20-49: 1)Accommodation and Food Services: Full-Service Restaurants (20-49: 2, 1-4: 3)Management of Companies and Enterprises: Corporate, Subsidiary, and Regional Managing Offices (50-99: 1)Wholesale Trade: Electrical Apparatus and Equipment, Wiring Supplies, and Related Equipment Merchant Wholesalers (50-99: 1)Health Care and Social Assistance: Residential Mental Health and Substance Abuse Facilities (20-49: 2)
People in group quarters in 2010:
2,049 people in college/university student housing
279 people in emergency and transitional shelters (with sleeping facilities) for people experiencing homelessness
66 people in residential treatment centers for adults
50 people in workers' group living quarters and job corps centers
49 people in group homes intended for adults
28 people in other noninstitutional facilities
17 people in residential treatment centers for juveniles (non-correctional)
People in group quarters in 2000:
292 people in homes or halfway houses for drug/alcohol abuse
208 people in other noninstitutional group quarters
185 people in nursing homes
101 people in college dormitories (includes college quarters off campus)
62 people in homes for the mentally ill
37 people in other types of correctional institutions
35 people in halfway houses
9 people in religious group quarters
7 people in other group homes
Fatal accident statistics in 2012:
Fatal accident count: 2Vehicles involved in fatal accidents: 4Fatal accidents caused by drunken drivers: 0Fatalities: 3Persons involved in fatal accidents: 6Pedestrians involved in fatal accidents: 0
Fatal accident statistics in 2010:
Fatal accident count: 1Vehicles involved in fatal accidents: 1Fatal accidents caused by drunken drivers: 0Fatalities: 1Persons involved in fatal accidents: 1Pedestrians involved in fatal accidents: 1
Home Mortgage Disclosure Act Aggregated Statistics For Year 2009(Based on 9 full and 12 partial tracts) A) FHA, FSA/RHS & VA B) Conventional C) Refinancings D) Home Improvement Loans E) Loans on Dwellings For 5+ Families F) Non-occupant Loans on G) Loans On Manufactured Number Average Value Number Average Value Number Average Value Number Average Value Number Average Value Number Average Value Number Average Value
LOANS ORIGINATED 76 $147,470 123 $227,323 200 $198,410 67 $79,692 9 $1,074,660 212 $232,782 0 $0 APPLICATIONS APPROVED, NOT ACCEPTED 2 $46,180 7 $63,759 17 $133,218 8 $33,632 2 $1,077,670 10 $104,198 0 $0 APPLICATIONS DENIED 35 $131,371 43 $154,544 240 $141,356 236 $33,969 2 $1,583,600 123 $167,914 1 $3,950 APPLICATIONS WITHDRAWN 2 $107,000 35 $180,560 86 $154,709 12 $68,847 3 $11,572,603 41 $179,509 0 $0 FILES CLOSED FOR INCOMPLETENESS 7 $156,044 3 $138,310 27 $138,914 6 $77,738 0 $0 6 $119,657 0 $0
Aggregated Statistics For Year 2008(Based on 9 full and 12 partial tracts) A) FHA, FSA/RHS & VA B) Conventional C) Refinancings D) Home Improvement Loans E) Loans on Dwellings For 5+ Families F) Non-occupant Loans on G) Loans On Manufactured Number Average Value Number Average Value Number Average Value Number Average Value Number Average Value Number Average Value Number Average Value
LOANS ORIGINATED 49 $157,969 217 $184,143 253 $159,209 101 $72,692 25 $699,739 257 $200,744 11 $204,505 APPLICATIONS APPROVED, NOT ACCEPTED 5 $141,292 44 $135,197 70 $111,717 24 $25,164 0 $0 42 $140,868 2 $208,675 APPLICATIONS DENIED 12 $153,422 141 $151,862 352 $100,572 328 $33,372 6 $628,240 185 $118,158 2 $22,000 APPLICATIONS WITHDRAWN 9 $204,117 22 $206,028 93 $114,047 18 $54,302 0 $0 37 $156,835 0 $0 FILES CLOSED FOR INCOMPLETENESS 5 $136,172 16 $146,543 27 $124,536 11 $53,208 3 $196,370 20 $131,218 0 $0
Aggregated Statistics For Year 2007(Based on 9 full and 12 partial tracts) A) FHA, FSA/RHS & VA B) Conventional C) Refinancings D) Home Improvement Loans E) Loans on Dwellings For 5+ Families F) Non-occupant Loans on G) Loans On Manufactured Number Average Value Number Average Value Number Average Value Number Average Value Number Average Value Number Average Value Number Average Value
LOANS ORIGINATED 20 $116,728 345 $143,771 375 $101,368 157 $79,936 27 $2,047,103 320 $121,202 0 $0 APPLICATIONS APPROVED, NOT ACCEPTED 1 $109,000 66 $122,428 111 $106,544 52 $88,105 2 $198,400 86 $129,888 0 $0 APPLICATIONS DENIED 4 $140,232 198 $116,662 608 $102,633 438 $45,481 3 $382,817 308 $103,468 4 $27,162 APPLICATIONS WITHDRAWN 2 $115,010 93 $130,669 218 $102,626 36 $69,247 1 $658,600 95 $113,457 2 $20,925 FILES CLOSED FOR INCOMPLETENESS 0 $0 19 $97,231 51 $116,810 0 $0 0 $0 20 $134,699 0 $0
Aggregated Statistics For Year 2006(Based on 9 full and 12 partial tracts) A) FHA, FSA/RHS & VA B) Conventional C) Refinancings D) Home Improvement Loans E) Loans on Dwellings For 5+ Families F) Non-occupant Loans on G) Loans On Manufactured Number Average Value Number Average Value Number Average Value Number Average Value Number Average Value Number Average Value Number Average Value
LOANS ORIGINATED 35 $103,097 450 $125,732 460 $100,737 128 $41,195 14 $9,202,071 401 $111,135 0 $0 APPLICATIONS APPROVED, NOT ACCEPTED 1 $222,610 81 $113,657 121 $87,675 43 $42,592 2 $253,740 79 $105,706 0 $0 APPLICATIONS DENIED 7 $161,723 277 $98,966 605 $83,241 414 $27,693 1 $52,690 325 $90,037 2 $58,470 APPLICATIONS WITHDRAWN 2 $269,420 86 $118,485 255 $89,304 29 $64,671 9 $3,013,924 92 $105,104 1 $48,000 FILES CLOSED FOR INCOMPLETENESS 1 $52,000 31 $113,361 67 $98,892 7 $98,840 2 $218,240 32 $96,184 0 $0
Aggregated Statistics For Year 2005(Based on 9 full and 12 partial tracts) A) FHA, FSA/RHS & VA B) Conventional C) Refinancings D) Home Improvement Loans E) Loans on Dwellings For 5+ Families F) Non-occupant Loans on G) Loans On Manufactured Number Average Value Number Average Value Number Average Value Number Average Value Number Average Value Number Average Value Number Average Value
LOANS ORIGINATED 19 $76,242 304 $105,536 373 $84,847 138 $25,031 16 $419,237 292 $84,684 0 $0 APPLICATIONS APPROVED, NOT ACCEPTED 1 $25,000 51 $98,695 106 $68,902 37 $38,277 0 $0 57 $75,894 0 $0 APPLICATIONS DENIED 9 $74,791 183 $75,868 607 $70,531 465 $19,510 0 $0 320 $49,229 6 $10,982 APPLICATIONS WITHDRAWN 0 $0 73 $119,378 251 $88,230 45 $88,645 1 $1,185,480 86 $109,300 0 $0 FILES CLOSED FOR INCOMPLETENESS 1 $217,510 20 $126,848 36 $99,802 3 $44,943 0 $0 16 $127,573 2 $215,660
Aggregated Statistics For Year 2004(Based on 9 full and 12 partial tracts) A) FHA, FSA/RHS & VA B) Conventional C) Refinancings D) Home Improvement Loans E) Loans on Dwellings For 5+ Families F) Non-occupant Loans on G) Loans On Manufactured Number Average Value Number Average Value Number Average Value Number Average Value Number Average Value Number Average Value Number Average Value
LOANS ORIGINATED 7 $56,281 188 $89,979 223 $71,622 112 $25,392 10 $518,681 156 $72,764 0 $0 APPLICATIONS APPROVED, NOT ACCEPTED 4 $63,002 66 $85,106 107 $60,664 46 $35,227 1 $825,000 68 $76,908 0 $0 APPLICATIONS DENIED 1 $52,050 98 $61,201 627 $57,679 538 $13,675 1 $250,870 258 $30,948 14 $15,956 APPLICATIONS WITHDRAWN 6 $35,980 37 $84,378 156 $65,895 21 $39,719 1 $65,000 39 $72,763 0 $0 FILES CLOSED FOR INCOMPLETENESS 3 $47,733 19 $68,159 55 $78,301 5 $23,950 2 $72,305 25 $79,011 0 $0
Aggregated Statistics For Year 2003(Based on 9 full and 12 partial tracts) A) FHA, FSA/RHS & VA B) Conventional C) Refinancings D) Home Improvement Loans E) Loans on Dwellings For 5+ Families F) Non-occupant Loans on Number Average Value Number Average Value Number Average Value Number Average Value Number Average Value Number Average Value
LOANS ORIGINATED 14 $48,525 109 $87,632 260 $82,944 80 $21,827 7 $375,506 113 $80,861 APPLICATIONS APPROVED, NOT ACCEPTED 3 $78,190 34 $47,923 127 $57,081 38 $25,380 2 $40,170 29 $52,725 APPLICATIONS DENIED 3 $44,110 88 $62,057 454 $55,943 271 $17,509 3 $81,217 105 $44,869 APPLICATIONS WITHDRAWN 5 $68,792 12 $61,434 121 $63,293 12 $32,791 0 $0 27 $58,219 FILES CLOSED FOR INCOMPLETENESS 0 $0 10 $31,828 25 $49,151 2 $9,820 0 $0 7 $39,297
Aggregated Statistics For Year 2002(Based on 9 full and 10 partial tracts) A) FHA, FSA/RHS & VA B) Conventional C) Refinancings D) Home Improvement Loans E) Loans on Dwellings For 5+ Families F) Non-occupant Loans on Number Average Value Number Average Value Number Average Value Number Average Value Number Average Value Number Average Value
LOANS ORIGINATED 14 $52,126 125 $63,977 153 $71,530 51 $14,501 7 $228,393 67 $68,217 APPLICATIONS APPROVED, NOT ACCEPTED 0 $0 34 $71,075 143 $49,368 23 $22,497 2 $111,185 19 $33,345 APPLICATIONS DENIED 5 $86,142 53 $56,489 486 $45,010 188 $25,418 2 $49,000 54 $53,634 APPLICATIONS WITHDRAWN 1 $129,090 27 $63,831 153 $48,656 8 $34,758 0 $0 16 $64,481 FILES CLOSED FOR INCOMPLETENESS 2 $93,540 17 $48,208 55 $51,640 0 $0 0 $0 5 $41,242
Aggregated Statistics For Year 2001(Based on 9 full and 10 partial tracts) A) FHA, FSA/RHS & VA B) Conventional C) Refinancings D) Home Improvement Loans E) Loans on Dwellings For 5+ Families F) Non-occupant Loans on Number Average Value Number Average Value Number Average Value Number Average Value Number Average Value Number Average Value
LOANS ORIGINATED 20 $42,036 99 $43,000 156 $45,271 74 $20,881 5 $201,228 66 $39,712 APPLICATIONS APPROVED, NOT ACCEPTED 4 $42,000 28 $40,695 122 $38,543 39 $23,398 0 $0 21 $66,902 APPLICATIONS DENIED 4 $45,075 65 $52,989 450 $37,470 212 $17,873 3 $155,263 81 $47,664 APPLICATIONS WITHDRAWN 4 $26,052 13 $38,597 150 $38,771 25 $25,064 1 $131,000 18 $35,869 FILES CLOSED FOR INCOMPLETENESS 1 $10,000 11 $40,658 41 $41,376 2 $28,755 0 $0 4 $31,018
Aggregated Statistics For Year 2000(Based on 9 full and 10 partial tracts) A) FHA, FSA/RHS & VA B) Conventional C) Refinancings D) Home Improvement Loans F) Non-occupant Loans on Number Average Value Number Average Value Number Average Value Number Average Value Number Average Value
LOANS ORIGINATED 22 $34,342 103 $39,433 226 $30,326 126 $14,596 54 $36,432 APPLICATIONS APPROVED, NOT ACCEPTED 5 $21,458 27 $34,296 108 $35,764 69 $15,291 20 $45,511 APPLICATIONS DENIED 1 $64,000 103 $36,092 443 $33,491 325 $13,022 77 $38,954 APPLICATIONS WITHDRAWN 1 $35,000 39 $49,712 235 $38,748 27 $21,973 38 $29,306 FILES CLOSED FOR INCOMPLETENESS 0 $0 6 $99,432 70 $47,895 4 $34,948 5 $27,498
Aggregated Statistics For Year 1999(Based on 5 full and 7 partial tracts) A) FHA, FSA/RHS & VA B) Conventional C) Refinancings D) Home Improvement Loans E) Loans on Dwellings For 5+ Families F) Non-occupant Loans on Number Average Value Number Average Value Number Average Value Number Average Value Number Average Value Number Average Value
LOANS ORIGINATED 12 $46,023 79 $36,485 227 $32,719 88 $12,646 0 $0 51 $43,777 APPLICATIONS APPROVED, NOT ACCEPTED 3 $30,113 31 $40,815 158 $29,993 64 $14,155 0 $0 18 $35,652 APPLICATIONS DENIED 3 $40,883 56 $46,848 364 $31,221 239 $13,106 1 $9,660 44 $27,811 APPLICATIONS WITHDRAWN 2 $74,420 21 $43,286 161 $30,227 34 $20,553 0 $0 13 $35,774 FILES CLOSED FOR INCOMPLETENESS 0 $0 2 $26,325 74 $37,680 1 $28,580 0 $0 9 $65,818
Private Mortgage Insurance Companies Aggregated Statistics For Year 2009(Based on 8 full and 8 partial tracts) A) Conventional B) Refinancings C) Non-occupant Loans on Number Average Value Number Average Value Number Average Value
LOANS ORIGINATED 11 $215,487 5 $266,346 0 $0 APPLICATIONS APPROVED, NOT ACCEPTED 15 $150,324 1 $336,270 4 $140,225 APPLICATIONS DENIED 4 $181,960 0 $0 0 $0 APPLICATIONS WITHDRAWN 0 $0 0 $0 0 $0 FILES CLOSED FOR INCOMPLETENESS 0 $0 0 $0 0 $0
Aggregated Statistics For Year 2008(Based on 9 full and 10 partial tracts) A) Conventional B) Refinancings C) Non-occupant Loans on Number Average Value Number Average Value Number Average Value
LOANS ORIGINATED 76 $193,717 16 $183,836 24 $147,452 APPLICATIONS APPROVED, NOT ACCEPTED 53 $115,161 6 $130,685 15 $92,280 APPLICATIONS DENIED 17 $155,559 0 $0 6 $143,828 APPLICATIONS WITHDRAWN 8 $147,711 3 $536,797 2 $199,860 FILES CLOSED FOR INCOMPLETENESS 3 $166,600 2 $110,085 2 $199,860
Aggregated Statistics For Year 2007(Based on 9 full and 12 partial tracts) A) Conventional B) Refinancings C) Non-occupant Loans on Number Average Value Number Average Value Number Average Value
LOANS ORIGINATED 136 $138,504 24 $162,645 47 $111,052 APPLICATIONS APPROVED, NOT ACCEPTED 23 $152,500 6 $204,418 6 $141,578 APPLICATIONS DENIED 8 $151,044 0 $0 6 $177,737 APPLICATIONS WITHDRAWN 15 $124,404 0 $0 4 $80,098 FILES CLOSED FOR INCOMPLETENESS 2 $77,335 0 $0 0 $0
Aggregated Statistics For Year 2006(Based on 9 full and 10 partial tracts) A) Conventional B) Refinancings C) Non-occupant Loans on Number Average Value Number Average Value Number Average Value
LOANS ORIGINATED 95 $134,369 10 $191,323 26 $101,326 APPLICATIONS APPROVED, NOT ACCEPTED 23 $113,247 5 $78,482 13 $108,612 APPLICATIONS DENIED 3 $56,527 2 $297,330 3 $56,527 APPLICATIONS WITHDRAWN 6 $72,373 0 $0 3 $78,027 FILES CLOSED FOR INCOMPLETENESS 0 $0 0 $0 0 $0
Aggregated Statistics For Year 2005(Based on 8 full and 10 partial tracts) A) Conventional B) Refinancings C) Non-occupant Loans on Number Average Value Number Average Value Number Average Value
LOANS ORIGINATED 76 $100,711 9 $145,044 27 $72,648 APPLICATIONS APPROVED, NOT ACCEPTED 20 $87,207 5 $50,808 15 $47,634 APPLICATIONS DENIED 2 $38,390 1 $66,720 2 $38,390 APPLICATIONS WITHDRAWN 13 $111,638 3 $46,503 4 $47,250 FILES CLOSED FOR INCOMPLETENESS 1 $13,000 2 $76,385 0 $0
Aggregated Statistics For Year 2004(Based on 9 full and 12 partial tracts) A) Conventional B) Refinancings C) Non-occupant Loans on Number Average Value Number Average Value Number Average Value
LOANS ORIGINATED 91 $80,516 10 $46,978 24 $74,706 APPLICATIONS APPROVED, NOT ACCEPTED 16 $60,959 1 $36,730 7 $60,187 APPLICATIONS DENIED 4 $40,808 0 $0 4 $39,518 APPLICATIONS WITHDRAWN 9 $46,612 0 $0 4 $49,428 FILES CLOSED FOR INCOMPLETENESS 0 $0 1 $38,000 1 $38,000
Aggregated Statistics For Year 2003(Based on 8 full and 8 partial tracts) A) Conventional B) Refinancings C) Non-occupant Loans on Number Average Value Number Average Value Number Average Value
LOANS ORIGINATED 49 $104,207 11 $91,100 8 $46,492 APPLICATIONS APPROVED, NOT ACCEPTED 18 $65,615 0 $0 3 $104,973 APPLICATIONS DENIED 4 $163,130 0 $0 3 $206,387 APPLICATIONS WITHDRAWN 9 $74,577 1 $281,560 0 $0 FILES CLOSED FOR INCOMPLETENESS 0 $0 0 $0 0 $0
Aggregated Statistics For Year 2002(Based on 8 full and 10 partial tracts) A) Conventional B) Refinancings C) Non-occupant Loans on Number Average Value Number Average Value Number Average Value
LOANS ORIGINATED 59 $77,841 5 $67,140 9 $101,548 APPLICATIONS APPROVED, NOT ACCEPTED 12 $60,287 9 $84,297 5 $88,216 APPLICATIONS DENIED 3 $207,217 0 $0 2 $274,130 APPLICATIONS WITHDRAWN 2 $40,090 0 $0 0 $0 FILES CLOSED FOR INCOMPLETENESS 0 $0 0 $0 0 $0
Aggregated Statistics For Year 2001(Based on 9 full and 8 partial tracts) A) Conventional B) Refinancings C) Non-occupant Loans on Number Average Value Number Average Value Number Average Value
LOANS ORIGINATED 54 $57,181 8 $74,398 13 $58,538 APPLICATIONS APPROVED, NOT ACCEPTED 2 $34,505 3 $81,287 2 $99,930 APPLICATIONS DENIED 0 $0 1 $36,000 0 $0 APPLICATIONS WITHDRAWN 0 $0 0 $0 0 $0 FILES CLOSED FOR INCOMPLETENESS 0 $0 0 $0 0 $0
Aggregated Statistics For Year 2000(Based on 7 full and 6 partial tracts) A) Conventional B) Refinancings C) Non-occupant Loans on Number Average Value Number Average Value Number Average Value
LOANS ORIGINATED 34 $52,597 12 $30,285 9 $31,649 APPLICATIONS APPROVED, NOT ACCEPTED 5 $44,592 1 $32,030 0 $0 APPLICATIONS DENIED 0 $0 1 $35,000 1 $35,000 APPLICATIONS WITHDRAWN 1 $44,000 1 $108,090 1 $108,090 FILES CLOSED FOR INCOMPLETENESS 0 $0 0 $0 0 $0
Aggregated Statistics For Year 1999(Based on 5 full and 6 partial tracts) A) Conventional B) Refinancings C) Non-occupant Loans on Number Average Value Number Average Value Number Average Value
LOANS ORIGINATED 27 $46,303 22 $34,746 3 $29,980 APPLICATIONS APPROVED, NOT ACCEPTED 4 $44,235 0 $0 0 $0 APPLICATIONS DENIED 2 $27,670 0 $0 1 $31,340 APPLICATIONS WITHDRAWN 1 $36,730 0 $0 0 $0 FILES CLOSED FOR INCOMPLETENESS 0 $0 0 $0 0 $0
2010 - 2018 National Fire Incident Reporting System (NFIRS) incidents See full 2006 National Fire Incident Reporting System statistics for zip code 19121, Pennsylvania
Most common first names in zip code 19121 among deceased individuals Name Count Lived (average)
James 690 68.5 years William 590 70.9 years John 576 71.2 years Mary 459 76.0 years Robert 313 68.7 years George 310 71.3 years Willie 279 69.9 years Charles 270 69.2 years Joseph 239 69.7 years Thomas 188 70.6 years
Most common last names in zip code 19121 among deceased individuals Last name Count Lived (average)
Williams 478 69.7 years Johnson 421 71.6 years Smith 355 70.9 years Brown 342 70.4 years Jones 320 69.8 years Jackson 234 71.4 years Davis 197 70.3 years Thomas 153 71.3 years Robinson 153 70.8 years Harris 140 71.3 years
Businesses in zip code 19121
Name Count Name Count
Cricket Wireless 2 Rite Aid 1 Dunkin Donuts 1 Subway 1 Foot Locker 1 True Value 1 H&R Block 1 U-Haul 1 KFC 1 Wendy's 1 Nike 4 YMCA 1 Qdoba Mexican Grill 1

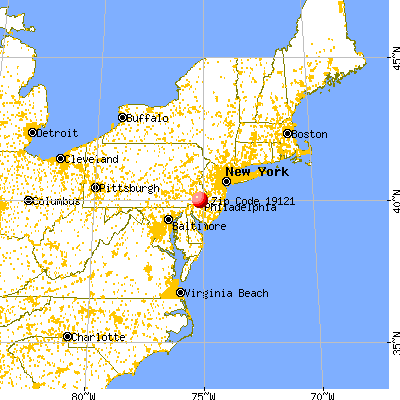


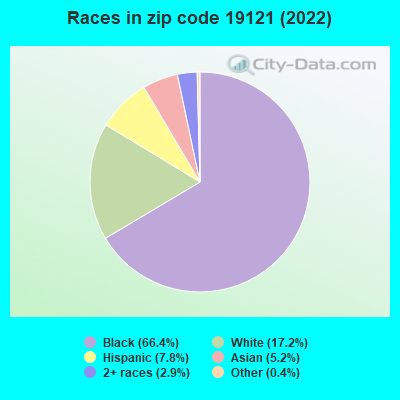


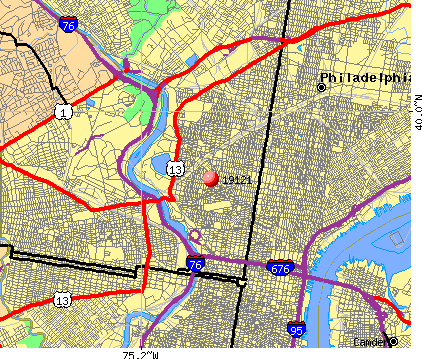 Nearest zip codes: 19130, 19132, 19103, 19104, 19129, 19102.
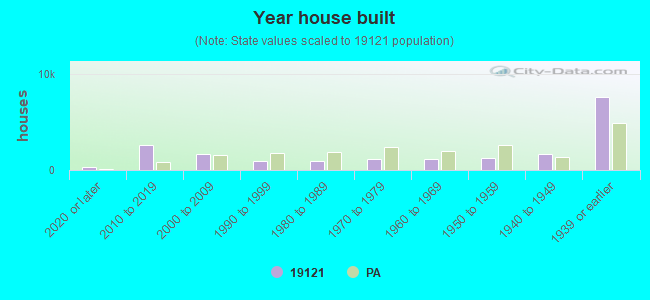

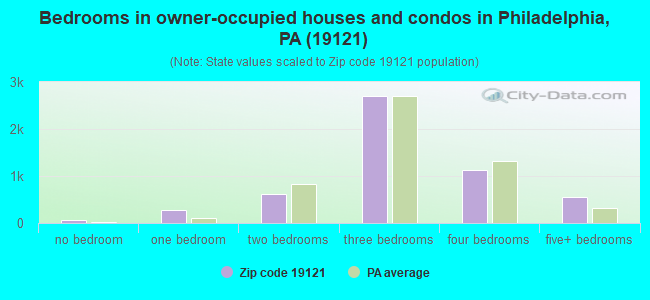
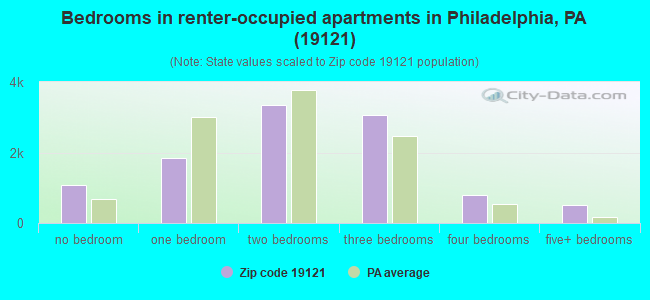
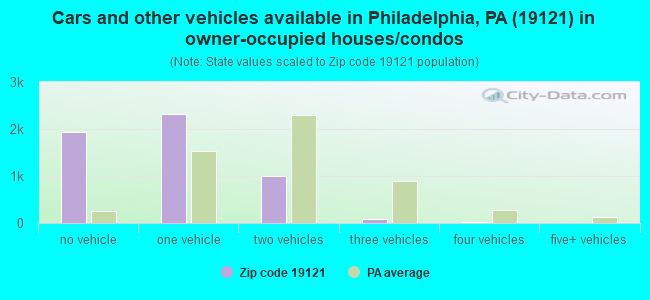
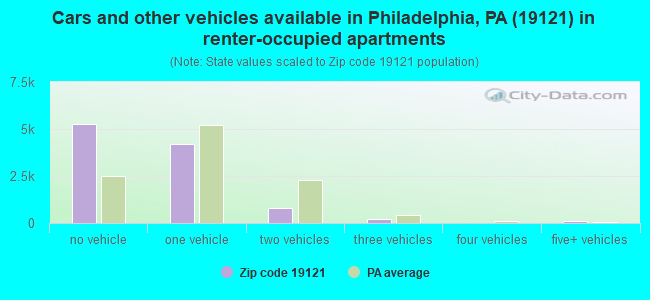


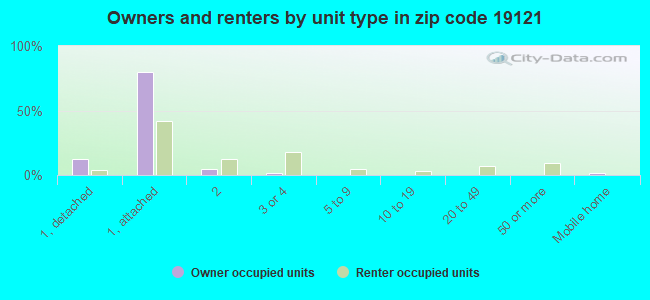
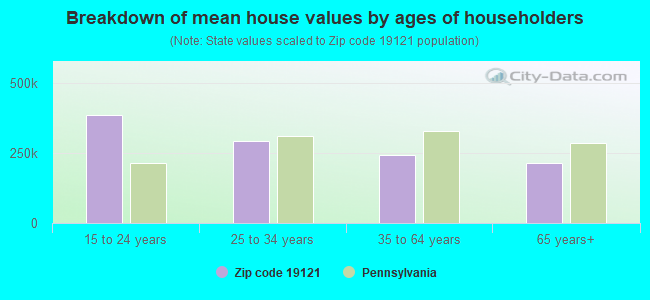


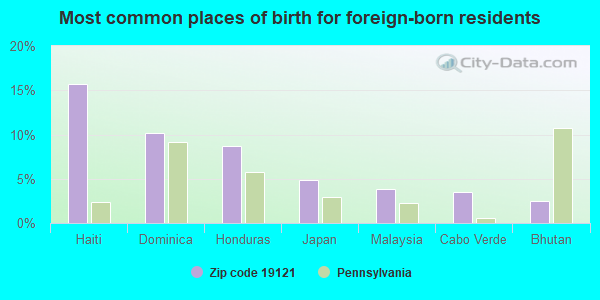
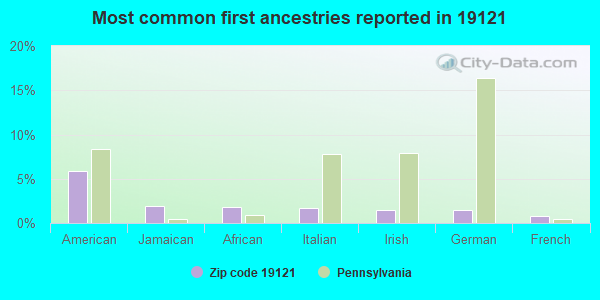
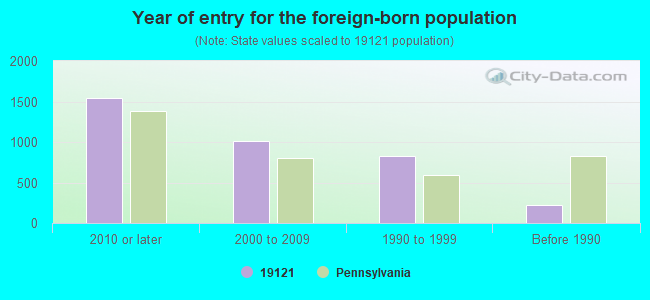


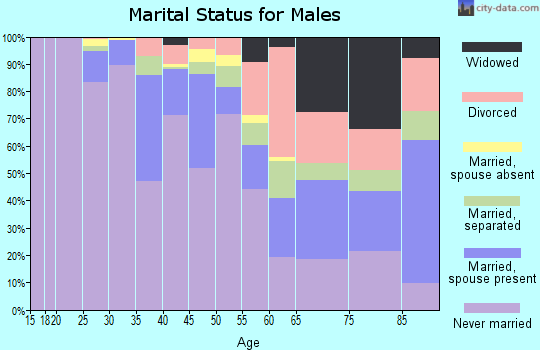
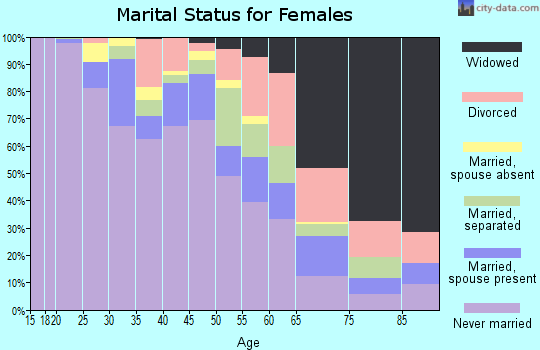
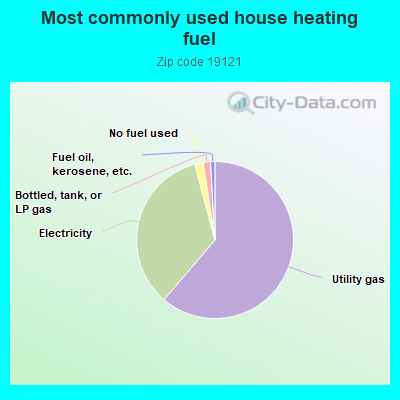
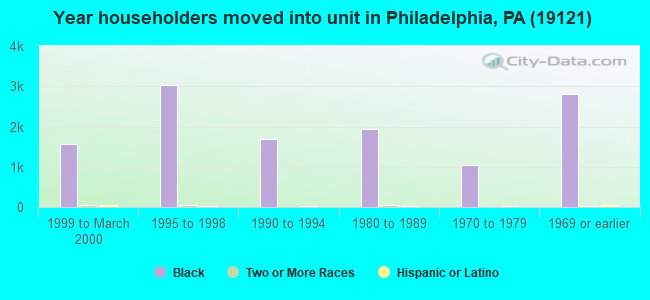
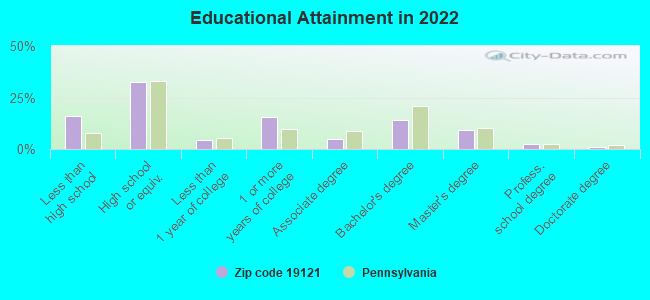
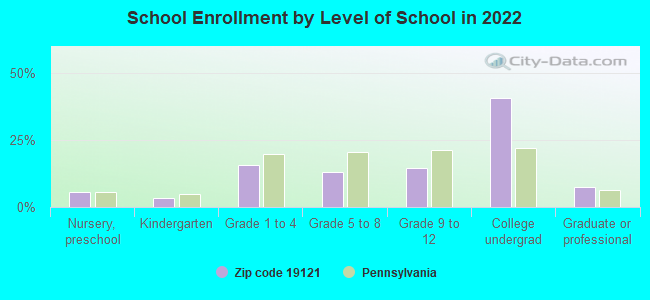
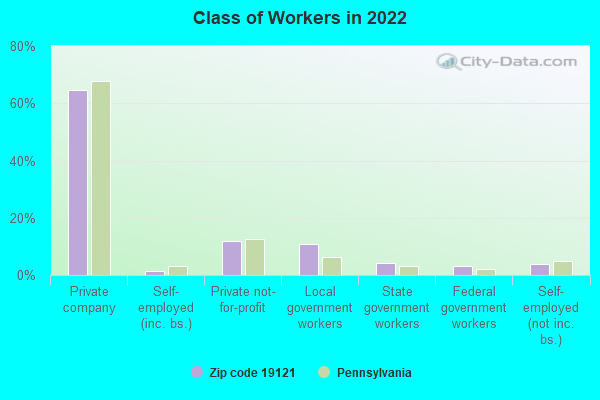
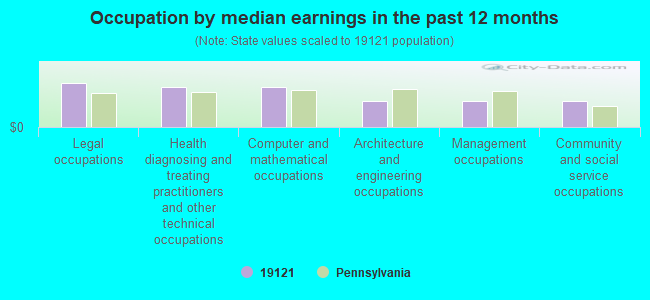
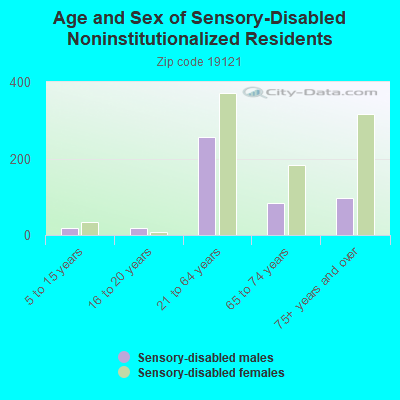
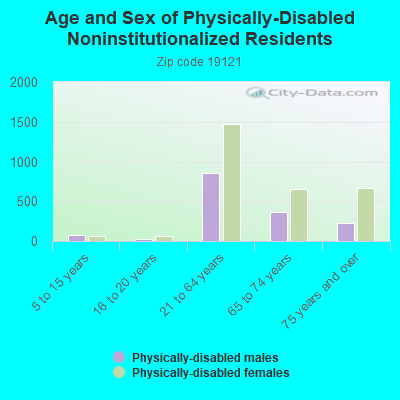
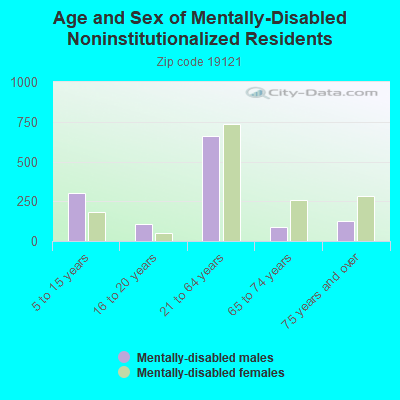
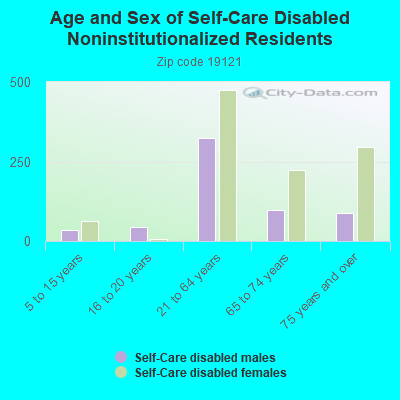
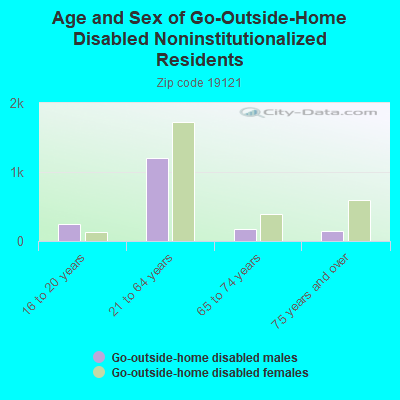
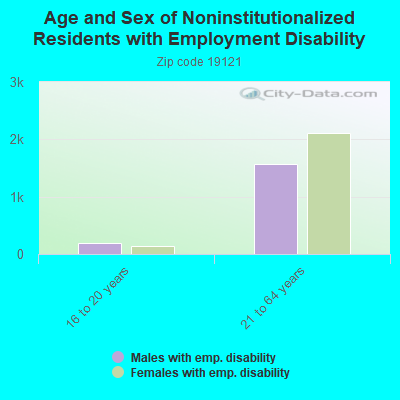
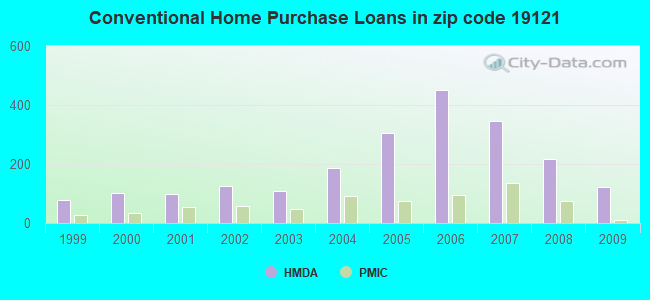
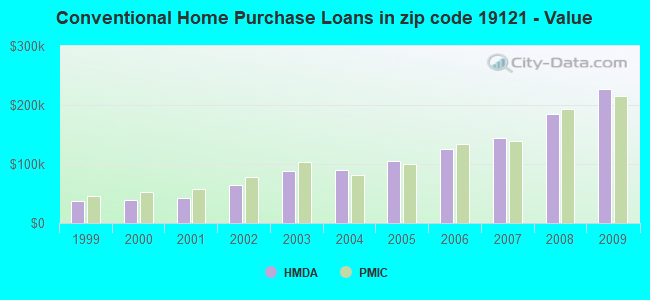
 According to the data from the years 2010 - 2018 the average number of fire incidents per year is 176. The highest number of reported fires - 281 took place in 2018, and the least - 0 in 2016. The data has a growing trend.
 When looking into fire subcategories, the most reports belonged to: Structure Fires (53.6%), and Outside Fires (32.2%).