Estimated zip code population in 2022: 5,627 Zip code population in 2010: 4,705 Zip code population in 2000: 4,396
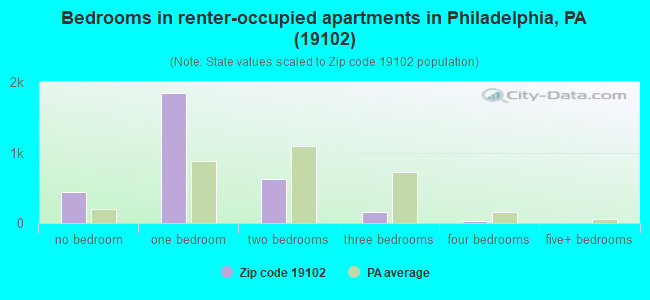
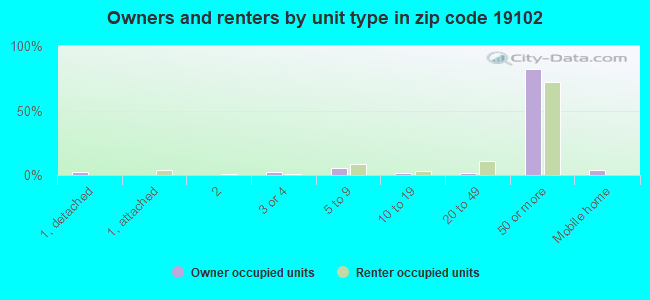
Houses and condos: 4,497 Renter-occupied apartments: 3,024
% of renters here:
77%
State:
31%
March 2022 cost of living index in zip code 19102: 108.3 (more than average, U.S. average is 100)
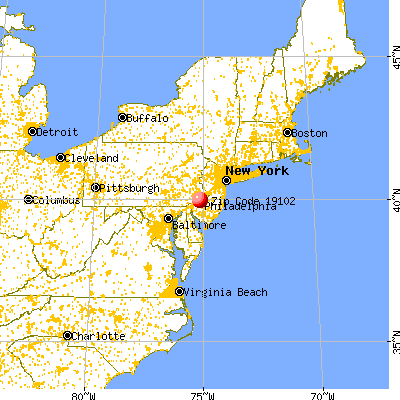
Land area: 0.2 sq. mi. Water area: 0.0 sq. mi.
Population density: 29,796 people per square mile
(very high).
OSM Map
General Map
Google Map
MSN Map
OSM Map
General Map
Google Map
MSN Map
OSM Map
General Map
Google Map
MSN Map
OSM Map
General Map
Google Map
MSN Map
Please wait while loading the map...
Real estate property taxes paid for housing units in 2022:
This zip code:
1.0% ($4,454)
Pennsylvania:
1.3% ($3,094)
Median real estate property taxes paid for housing units with mortgages in 2022: $4,456 (0.9%) Median real estate property taxes paid for housing units with no mortgage in 2022: $4,449 (1.1%)
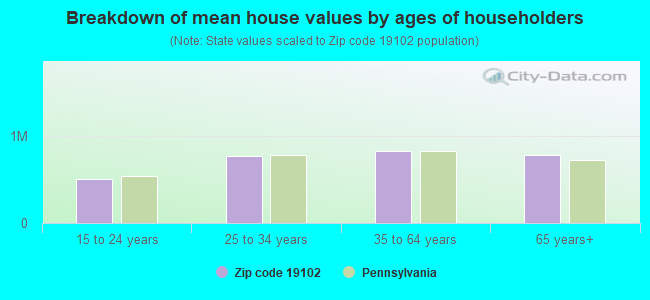
Estimated median house/condo value in 2022: $454,750
19102:
$454,750
Pennsylvania:
$245,500
According to our research of Pennsylvania and other state lists, there were 10 registered sex offenders living in 19102 zip code as of April 27, 2024. The ratio of all residents to sex offenders in zip code 19102 is 494 to 1. The ratio of registered sex offenders to all residents in this zip code is near the state average.
Median resident age:
This zip code:
30.8 years
Pennsylvania median age:
40.9 years
Average household size:
This zip code:
1.4 people
Pennsylvania:
2.4 people
Averages for the 2020 tax year for zip code 19102, filed in 2021:
Average Adjusted Gross Income (AGI) in 2020: $164,425 (Individual Income Tax Returns)
Here:
$164,425
State:
$75,707
Salary/wage: $125,694 (reported on 83.7% of returns)
Here:
$125,694
State:
$62,806
(% of AGI for various income ranges: 1082.1% for AGIs below $25k, 3934.5% for AGIs $25k-50k, 7159.8% for AGIs $50k-75k, 10310.3% for AGIs $75k-100k, 21155.0% for AGIs $100k-200k, 138557.1% for AGIs over 200k)
Taxable interest for individuals: $3,366 (reported on 44.2% of returns)
This zip code:
$3,366
Pennsylvania:
$1,633
(% of AGI for various income ranges: 27.9% for AGIs below $25k, 43.7% for AGIs $25k-50k, 54.1% for AGIs $50k-75k, 37.3% for AGIs $75k-100k, 177.6% for AGIs $100k-200k, 2711.4% for AGIs over 200k)
Ordinary dividends: $14,140 (reported on 43.3% of returns)
Here:
$14,140
State:
$7,382
(% of AGI for various income ranges: 118.8% for AGIs below $25k, 121.1% for AGIs $25k-50k, 176.3% for AGIs $50k-75k, 317.6% for AGIs $75k-100k, 828.2% for AGIs $100k-200k, 10826.4% for AGIs over 200k)
Net capital gain/loss in AGI: +$44,541 (reported on 41.0% of returns)
Here:
+$44,541
State:
+$23,522
(% of AGI for various income ranges: 63.0% for AGIs below $25k, 56.1% for AGIs $25k-50k, 123.5% for AGIs $50k-75k, 256.1% for AGIs $75k-100k, 915.0% for AGIs $100k-200k, 41039.3% for AGIs over 200k)
Profit/loss from business: +$31,840 (reported on 14.0% of returns)
Here:
+$31,840
State:
+$16,274
(% of AGI for various income ranges: 103.3% for AGIs below $25k, 240.5% for AGIs $25k-50k, 215.5% for AGIs $50k-75k, 183.3% for AGIs $75k-100k, 783.4% for AGIs $100k-200k, 6707.1% for AGIs over 200k)
Taxable individual retirement arrangement distribution: $36,910 (reported on 8.4% of returns)
19102:
$36,910
Pennsylvania:
$18,583
(% of AGI for various income ranges: 56.7% for AGIs below $25k, 104.5% for AGIs $25k-50k, 116.7% for AGIs $50k-75k, 270.3% for AGIs $75k-100k, 592.4% for AGIs $100k-200k, 4575.0% for AGIs over 200k)
Self-employed (Keogh) retirement plans: $32,320 (reported on 1.5% of returns)
19102:
$32,320
Pennsylvania:
$25,407
(% of AGI for various income ranges: 1154.3% for AGIs over 200k)
Total itemized deductions: $42,638 (reported on 14.0% of returns)
Here:
$42,638
State:
$34,850
(% of AGI for various income ranges: 237.4% for AGIs $25k-50k, 218.2% for AGIs $50k-75k, 320.6% for AGIs $75k-100k, 1016.8% for AGIs $100k-200k, 9695.0% for AGIs over 200k)
Charity contributions: $15,620 (reported on 11.6% of returns)
Here:
$15,620
State:
$12,392
(% of AGI for various income ranges: 32.4% for AGIs below $25k, 24.3% for AGIs $50k-75k, 57.6% for AGIs $75k-100k, 179.7% for AGIs $100k-200k, 3677.9% for AGIs over 200k)
Taxes paid: $9,277 (reported on 13.7% of returns)
19102:
$9,277
State:
$8,200
(% of AGI for various income ranges: 49.7% for AGIs $25k-50k, 54.7% for AGIs $50k-75k, 102.7% for AGIs $75k-100k, 321.3% for AGIs $100k-200k, 1673.6% for AGIs over 200k)
Earned income credit: $627 (reported on 3.2% of returns)
Here:
$627
State:
$2,100
(% of AGI for various income ranges: 20.9% for AGIs below $25k)
Percentage of individuals using paid preparers for their 2020 taxes: 93.9%
Here:
94%
State:
92%
(% for various income ranges: 88.0% for AGIs below $25k, 94.3% for AGIs $25k-50k, 95.5% for AGIs $50k-75k, 93.8% for AGIs $75k-100k, 94.6% for AGIs $100k-200k, 96.2% for AGIs over 200k)
Averages for the 2012 tax year for zip code 19102, filed in 2013:
Average Adjusted Gross Income (AGI) in 2012: $140,476 (Individual Income Tax Returns)
Here:
$140,476
State:
$61,346
Salary/wage: $125,965 (reported on 81.3% of returns)
Here:
$125,965
State:
$51,902
(% of AGI for various income ranges: 65.1% for AGIs below $25k, 79.8% for AGIs $25k-50k, 79.9% for AGIs $50k-75k, 82.4% for AGIs $75k-100k, 78.6% for AGIs $100k-200k, 68.9% for AGIs over 200k)
Taxable interest for individuals: $2,776 (reported on 50.9% of returns)
This zip code:
$2,776
Pennsylvania:
$1,588
(% of AGI for various income ranges: 4.0% for AGIs below $25k, 1.2% for AGIs $25k-50k, 1.0% for AGIs $50k-75k, 1.2% for AGIs $75k-100k, 0.8% for AGIs $100k-200k, 0.9% for AGIs over 200k)
Ordinary dividends: $10,413 (reported on 41.4% of returns)
Here:
$10,413
State:
$5,827
(% of AGI for various income ranges: 5.1% for AGIs below $25k, 3.4% for AGIs $25k-50k, 3.1% for AGIs $50k-75k, 3.0% for AGIs $75k-100k, 3.5% for AGIs $100k-200k, 2.9% for AGIs over 200k)
Net capital gain/loss in AGI: +$18,637 (reported on 34.8% of returns)
Here:
+$18,637
State:
+$14,495
(% of AGI for various income ranges: 0.8% for AGIs $25k-50k, 0.9% for AGIs $50k-75k, 1.0% for AGIs $75k-100k, 1.8% for AGIs $100k-200k, 6.8% for AGIs over 200k)
Profit/loss from business: +$31,520 (reported on 14.7% of returns)
Here:
+$31,520
State:
+$16,268
(% of AGI for various income ranges: 7.2% for AGIs below $25k, 4.8% for AGIs $25k-50k, 4.9% for AGIs $50k-75k, 2.5% for AGIs $75k-100k, 2.5% for AGIs $100k-200k, 3.2% for AGIs over 200k)
Taxable individual retirement arrangement distribution: $26,896 (reported on 10.3% of returns)
19102:
$26,896
Pennsylvania:
$14,550
(% of AGI for various income ranges: 4.2% for AGIs below $25k, 1.1% for AGIs $25k-50k, 2.0% for AGIs $50k-75k, 2.1% for AGIs $75k-100k, 3.2% for AGIs $100k-200k, 1.6% for AGIs over 200k)
Self-employment retirement plans: $23,020 (reported on 1.8% of returns)
19102:
$23,020
Pennsylvania:
$20,922
Total itemized deductions: $42,828 (17% of AGI, reported on 47.6% of returns)
Here:
$42,828
State:
$23,538
Here:
17.5% of AGI
State:
18.4% of AGI
(% of AGI for various income ranges: 30.4% for AGIs below $25k, 9.3% for AGIs $25k-50k, 9.7% for AGIs $50k-75k, 13.6% for AGIs $75k-100k, 13.8% for AGIs $100k-200k, 15.5% for AGIs over 200k)
Charity contributions: $7,353 (reported on 36.3% of returns)
Here:
$7,353
State:
$4,025
(% of AGI for various income ranges: 0.7% for AGIs below $25k, 0.7% for AGIs $25k-50k, 1.2% for AGIs $50k-75k, 1.6% for AGIs $75k-100k, 1.3% for AGIs $100k-200k, 2.3% for AGIs over 200k)
Taxes paid: $19,283 (reported on 46.9% of returns)
19102:
$19,283
State:
$9,982
(% of AGI for various income ranges: 2.9% for AGIs below $25k, 2.3% for AGIs $25k-50k, 2.9% for AGIs $50k-75k, 6.0% for AGIs $75k-100k, 7.1% for AGIs $100k-200k, 7.2% for AGIs over 200k)
Earned income credit: $782 (reported on 4.0% of returns)
Here:
$782
State:
$2,106
(% of AGI for various income ranges: 1.3% for AGIs below $25k)
Percentage of individuals using paid preparers for their 2012 taxes: 53.8%
Here:
54%
State:
53%
(% for various income ranges: 49.1% for AGIs below $25k, 44.6% for AGIs $25k-50k, 49.0% for AGIs $50k-75k, 53.1% for AGIs $75k-100k, 58.3% for AGIs $100k-200k, 77.1% for AGIs over 200k)
Averages for the 2004 tax year for zip code 19102, filed in 2005:
Average Adjusted Gross Income (AGI) in 2004: $72,894 (Individual Income Tax Returns)
Here:
$72,894
State:
$48,049
Salary/wage: $71,157 (reported on 81.2% of returns)
Here:
$71,157
State:
$42,646
(% of AGI for various income ranges: 77.1% for AGIs $10k-25k, 83.1% for AGIs $25k-50k, 81.0% for AGIs $50k-75k, 81.0% for AGIs $75k-100k, 72.5% for AGIs over 100k)
Taxable interest for individuals: $2,868 (reported on 53.3% of returns)
This zip code:
$2,868
Pennsylvania:
$1,657
(% of AGI for various income ranges: 3.1% for AGIs $10k-25k, 2.7% for AGIs $25k-50k, 1.2% for AGIs $50k-75k, 1.4% for AGIs $75k-100k, 2.0% for AGIs over 100k)
Taxable dividends: $6,267 (reported on 40.6% of returns)
Here:
$6,267
State:
$3,566
(% of AGI for various income ranges: 5.4% for AGIs $10k-25k, 2.9% for AGIs $25k-50k, 2.8% for AGIs $50k-75k, 2.5% for AGIs $75k-100k, 3.4% for AGIs over 100k)
Net capital gain/loss: +$12,466 (reported on 33.4% of returns)
Here:
+$12,466
State:
+$9,716
(% of AGI for various income ranges: -0.6% for AGIs $10k-25k, 0.3% for AGIs $25k-50k, 2.1% for AGIs $50k-75k, 1.7% for AGIs $75k-100k, 8.3% for AGIs over 100k)
Profit/loss from business: +$19,003 (reported on 13.8% of returns)
Here:
+$19,003
State:
+$14,267
(% of AGI for various income ranges: 4.3% for AGIs $10k-25k, 2.4% for AGIs $25k-50k, 4.2% for AGIs $50k-75k, 4.7% for AGIs $75k-100k, 3.3% for AGIs over 100k)
IRA payment deduction: $2,788 (reported on 2.8% of returns)
19102:
$2,788
Pennsylvania:
$2,903
Self-employed pension: $14,680 (reported on 2.1% of returns)
Here:
$14,680
Pennsylvania:
$14,674
Total itemized deductions: $23,154 (17% of AGI, reported on 41.8% of returns)
Here:
$23,154
State:
$18,804
Here:
17.0% of AGI
State:
19.5% of AGI
(% of AGI for various income ranges: 14.6% for AGIs $10k-25k, 8.6% for AGIs $25k-50k, 12.7% for AGIs $50k-75k, 13.7% for AGIs $75k-100k, 13.2% for AGIs over 100k)
Charity contributions deductions: $4,645 (3% of AGI, reported on 32.9% of returns)
Here:
$4,645
State:
$3,337
Here:
3.3% of AGI
State:
3.3% of AGI
(% of AGI for various income ranges: 1.4% for AGIs $10k-25k, 1.2% for AGIs $25k-50k, 1.4% for AGIs $50k-75k, 1.8% for AGIs $75k-100k, 2.4% for AGIs over 100k)
Total tax: $17,258 (reported on 83.2% of returns)
19102:
$17,258
State:
$8,008
(% of AGI for various income ranges: 5.0% for AGIs $10k-25k, 9.7% for AGIs $25k-50k, 13.9% for AGIs $50k-75k, 15.5% for AGIs $75k-100k, 23.5% for AGIs over 100k)
Earned income credit: $1,000 (reported on 4.7% of returns)
Here:
$1,000
State:
$1,643
Percentage of individuals using paid preparers for their 2004 taxes: 53.6%
Here:
54%
State:
56%
(% for various income ranges: 50.1% for AGIs below $10k, 50.0% for AGIs $10k-25k, 44.0% for AGIs $25k-50k, 54.5% for AGIs $50k-75k, 60.8% for AGIs $75k-100k, 70.6% for AGIs over 100k)
Likely homosexual households (counted as self-reported same-sex unmarried-partner households)
Lesbian couples: 0.0% of all households
Gay men: 0.7% of all households
Household received Food Stamps/SNAP in the past 12 months: 18 Household did not receive Food Stamps/SNAP in the past 12 months: 3,868
Women who did not have a birth in the past 12 months: 2,297 (445 now married, 1,868 unmarried)
Housing units in zip code 19102 with a mortgage: 497 (63 second mortgage, 63 both second mortgage and home equity loan) Median monthly owner costs for units with a mortgage: $2,823 Median monthly owner costs for units without a mortgage: $1,393
Residents with income below the poverty level in 2022:
This zip code:
18.5%
Whole state:
11.8%
Residents with income below 50% of the poverty level in 2022:
This zip code:
3.9%
Whole state:
6.1%
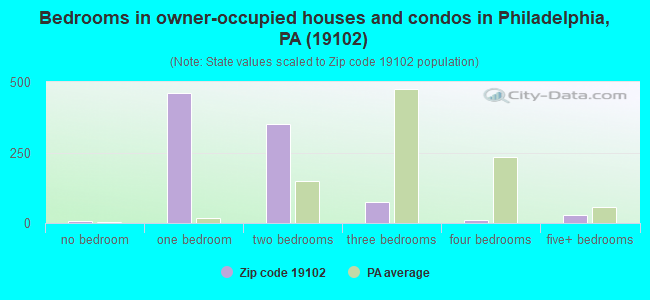
Median number of rooms in houses and condos:
Here:
3.7
State:
6.8
Median number of rooms in apartments:
Here:
2.8
State:
4.3
Notable locations in this zip code not listed on our city pages
Tourist attractions (not listed on the city page) : Fireman's Hall Museum (Cultural Attractions- Events- & Facilities; 2 Saint), Franklin Institute Discovery Camp (Cultural Attractions- Events- & Facilities; 20 Parkway).
In group quarters: 343 (-1 institutionalized population)
Size of family households: 767 2-persons, 15 3-persons, 13 5-persons
Size of nonfamily households: 2,597 1-person, 561 2-persons, 50 3-persons
46 married couples with children.
41 single-parent households (41 women).
85.2% of residents of 19102 zip code speak English at home.
3.2% of residents speak Spanish at home (78% very well, 13% well, 9% not well).
6.4% of residents speak other Indo-European language at home (90% very well, 7% well, 4% not well).
3.6% of residents speak Asian or Pacific Island language at home (90% very well, 10% well).
0.7% of residents speak other language at home (100% very well).
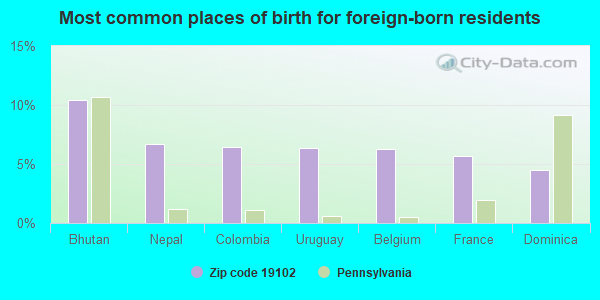
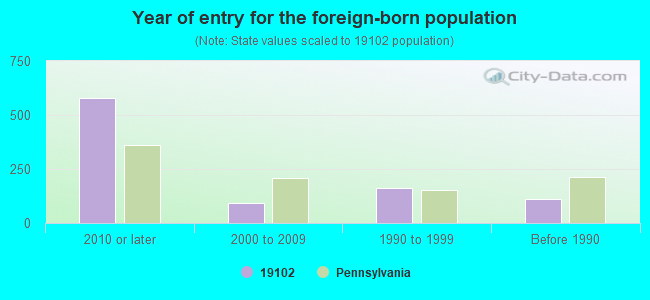
Foreign born population: 862 (15.3%) (45.2% of them are naturalized citizens)
Facilities with environmental interests located in this zip code:
BERWIND DEVELOPMENT SERVICES (MEELON BANK CNTR,15TH CHESTNUT in PHILADELPHIA, PA)
(Integrated Compliance Information System) - ICIS-03-1989-0784, FORMAL ENFORCEMENT ACTION
BELLEVUE ASSOC (200 S BROAD ST in PHILADELPHIA, PA)
AIR MINOR (AIRS/AFS) COMPLIANCE ACTIVITY (Tracking inspections of insecticide, fungicide, and rodenticide, and toxic substances) CRITERIA AND HAZARDOUS AIR POLLUTANT INVENTORY (Inventory of air pollution sources) STATE MASTER (Pennsylvania database) Business SIC classification: OPERATORS OF NONRESIDENTIAL BUILDINGS; HOTELS AND MOTELS; BUSINESS SERVICES Alternative names: BELLEVUE STRATFORD (RICHARD I. RUBIN)
ALICE STEPHENSON BROTHERS INC (225 S 15TH ST in PHILADELPHIA, PA)
BENTELL PROCELAIN STUDIOS (315 S 16TH ST in PHILADELPHIA, PA)
(Resource Conservation and Recovery Act (tracking hazardous waste)) Business NAICS classification: DENTAL LABORATORIES. Organizations: OPERNAME (CONTACT/OPERATOR)
, OWNERNAME (CONTACT/OWNER)
BELL OF PENNSYLVANIA (ONE PARKWAY in PHILADELPHIA, PA)
COMPLIANCE ACTIVITY (Tracking inspections of insecticide, fungicide, and rodenticide, and toxic substances) Conditionally Exempt Small Quantity Generators, less than 100 kg/month of hazardous waste (Resource Conservation and Recovery Act (tracking hazardous waste)) - notification Organizations: OPERNAME (CONTACT/OPERATOR)
ATLANTIC RICHFIELD (260 BROAD STREET in PHILADELPHIA, PA)
AIR MINOR (AIRS/AFS) Business SIC classification: NONCLASSIFIABLE ESTABLISHMENTS
BILLS U DO IT LAUNDRY INC (1513 SPRUCE ST in PHILADELPHIA, PA)
Small Quantity Generators, between 100 kg and 1000 kg of hazardous waste/month (Resource Conservation and Recovery Act (tracking hazardous waste)) - notification Organizations: OPERNAME (CONTACT/OPERATOR)
, 1510 LATIMER ST INC (CONTACT/OWNER)
BLUE CROSS TOWERS (1901 MARKET ST. in PHILADELPHIA, PA)
AIR MINOR (AIRS/AFS)
A.G.A. GROUP (1401 ARCH STREET in PHILADELPHIA, PA)
COMPLIANCE ACTIVITY (Tracking inspections of insecticide, fungicide, and rodenticide, and toxic substances) Business SIC classification: OPERATORS OF NONRESIDENTIAL BUILDINGS
ASSOCIATED PRESS (1 FRANKLIN PLZ STE 250 in PHILADELPHIA, PA)
Conditionally Exempt Small Quantity Generators, less than 100 kg/month of hazardous waste (Resource Conservation and Recovery Act (tracking hazardous waste)) - notification
ABBOTTS SQUARE DEVELOPMENT CORPORATION (1500 LOCUST STREET in PHILADELPHIA, PA)
COMPLIANCE ACTIVITY (Tracking inspections of insecticide, fungicide, and rodenticide, and toxic substances)
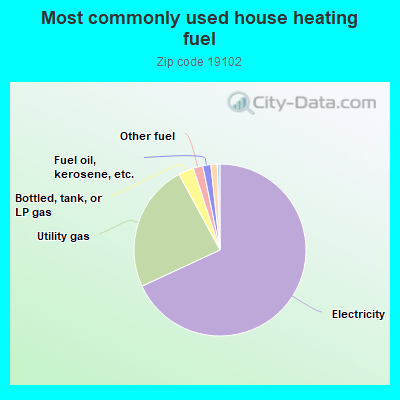
68.1%Electricity
24.0%Utility gas
2.9%Bottled, tank, or LP gas
1.8%Other fuel
1.5%Fuel oil, kerosene, etc.
1.2%No fuel used
Population in 1990: 3,623. Population change in the 1990s: +773 (+21.3%).
Place of birth for U.S.-born residents:
This state: 2,068
Northeast: 1,562
Midwest: 286
South: 656
West: 247
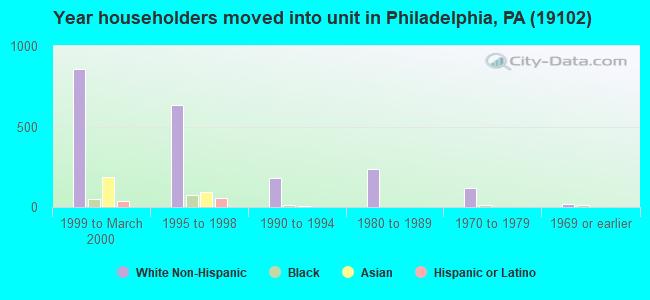
22% of the 19102 zip code residents lived in the same house 5 years ago. Out of people who lived in different houses, 27% lived in this county. Out of people who lived in different counties, 50% lived in Pennsylvania.
71% of the 19102 zip code residents lived in the same house 1 year ago. Out of people who lived in different houses, 37% moved from this county. Out of people who lived in different houses, 29% moved from different county within same state. Out of people who lived in different houses, 30% moved from different state. Out of people who lived in different houses, 2% moved from abroad.
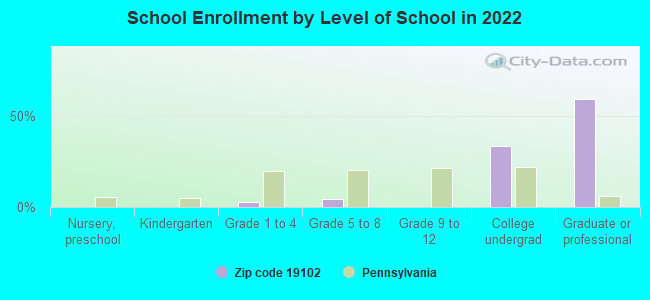
Private vs. public school enrollment:
Students in private schools in grades 1 to 8 (elementary and middle school):
Here:
0.0%
Pennsylvania:
15.7%
Students in private undergraduate colleges: 348
Here:
80.8%
Pennsylvania:
39.8%
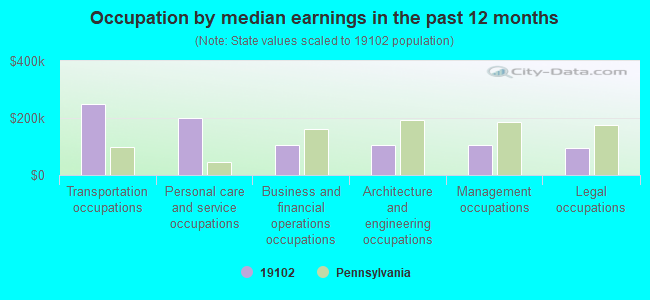
Occupation by median earnings in the past 12 months ($)
250,035Transportation occupations
198,852Personal care and service occupations
106,877Business and financial operations occupations
104,909Architecture and engineering occupations
104,498Management occupations
93,773Legal occupations
Companies with federal contracts located in this zip code (PHILADELPHIA, PA):
PHILADELPHIA HEALTH AND EDUCAT (BROAD & VINE STS) : $3,143,241 in 36 contractsfrom 1999 to 2006
Contracts for Tuition, Registration, and Membership Fees, Educational Services by Navy Signed by year:2000: $1,213,723; 2001: $0; 2002: $0; 2003: $0; 2004: $104,018; 2005: $760,272; 2006: $367,700.
Biggest contracts:
$720,200 with Navy for Tuition, Registration, and Membership Fees. Signed on 2000-10-01. Completion date: 2000-09-21.
$532,000, same as above.Signed on 2005-04-26. Completion date: 2006-06-30.
$367,700, same as above.Signed on 2006-04-05. Completion date: 2007-06-01.
$177,853 with Navy for Educational Services. Signed on 2000-11-02. Completion date: 2001-01-25.
FIVE STAR PARKING (1500 LOCUST STREET, STE 14; small business) : $1,398,820 in 51 contractsfrom 1999 to 2006
Contracts for Lease or Rental of Facilities -- Parking Facilities Conservation, Miscellaneous Items, Lease or Rental of Facilities -- Other Non-Building Facilities, Other Housekeeping Services, and moreby Army, U.S. Army Corps of Engineers - civil program financing only, Bureau of Alcohol, Tobacco, Firearms and Explosives, Alcohol and Tobacco Tax and Trade Bureau, and others Signed by year:2000: $174,500; 2001: $242,920; 2002: $281,275; 2003: $188,315; 2004: $248,520; 2005: $175,670; 2006: -$2,880.
Biggest contracts:
$100,440 with Army for Lease or Rental of Facilities -- Parking Facilities Conservation. Signed on 2005-10-21. Completion date: 2004-09-30.
$95,600 with U.S. Army Corps of Engineers - civil program financing only for Lease or Rental of Facilities -- Parking Facilities Conservation. Signed on 2004-10-27. Completion date: 2004-09-30.
$95,600 with Army for Lease or Rental of Facilities -- Parking Facilities Conservation. Signed on 2004-10-27. Completion date: 2004-09-30.
$87,000 with U.S. Army Corps of Engineers - civil program financing only for Lease or Rental of Facilities -- Parking Facilities Conservation. Signed on 2003-11-05. Completion date: 2004-09-30.
PARKWAY CORPORATION (150 N BROAD ST FL 10) : $255,105 in 18 contractsfrom 1999 to 2005
Contracts for Security Vehicle Services, Lease or Rental of Facilities -- Miscellaneous Buildings, Lease or Rental of Facilities -- Parking Facilities Conservation, Facilities Operations Support Services, and moreby Navy, Army, EPA, Bureau of the Census, and others Signed by year:2000: $25,920; 2001: $16,500; 2002: $51,125; 2003: $37,800; 2004: $38,600; 2005: $27,560; 2006: $0.
Biggest contracts:
$57,600 with Navy for Security Vehicle Services. Signed on 1999-12-28. Completion date: 2004-12-31.
$55,800 with Navy for Lease or Rental of Facilities -- Miscellaneous Buildings. Signed on 2002-12-20. Completion date: 2003-12-31.
$33,480, same as above.Signed on 2003-12-11. Completion date: 2004-12-31.
$29,640 with Navy for Lease or Rental of Facilities -- Parking Facilities Conservation. Signed on 2005-12-22. Completion date: 2006-12-31.
SMITHKLINE BEECHAM INTL CO (1 FRANKLIN PLZ) : $136,586 in 3 contractsin 1999
$56,292 with Department of Defense for Food Items For Resale. Signed on 1999-10-31. Completion date: 1999-10-31.
$48,649, same as above.Signed on 1999-11-30. Completion date: 1999-11-30.
$31,645 with Defense Logistics Agency for Medical and Surgical Instruments, Equipment, and Supplies. Taking place in IL. Signed on 1999-10-31. Completion date: 1999-11-16.
CORNELL, J S & SON, INC (1528-30 CHERRY ST; small business) : $40,294 in 2 contractsin 2003
$27,994 with Navy for Construction of Structures and Facilities -- Maintenance Buildings. Signed on 2003-08-14. Completion date: 2003-10-13.
$12,300 with Navy for Construction of Structures and Facilities -- Miscellaneous Buildings. Signed on 2003-10-01. Completion date: 2003-09-30.
PX DIRECT INC (1530 LOCUST STREET, SUITE; small business)
$12,980 with Army for Miscellaneous Prefabricated Structures. Taking place in KS. Signed on 2002-09-26. Completion date: 2003-02-18.
ALLEGHENY UNIVERSITY OF HEALTH (BROAD AND VINE ST)
$0 with National Institutes of Health for Biomedical -- Applied Research and Exploratory Development (R&D). Signed on 2005-06-22. Completion date: 1999-09-29.
Top industries in this zip code by the number of employees in 2005:
2010 - 2018 National Fire Incident Reporting System (NFIRS) incidents
According to the data from the years 2010 - 2018 the average number of fire incidents per year is 22. The highest number of reported fire incidents - 32 took place in 2013, and the least - 0 in 2016. The data has an increasing trend.
When looking into fire subcategories, the most incidents belonged to: Outside Fires (49.0%), and Structure Fires (35.0%).
Fire incident types reported to NFIRS in Zip Code 19102


 Nearest zip codes: 19109, 19107, 19103, 19130, 19147, 19146.


 According to the data from the years 2010 - 2018 the average number of fire incidents per year is 22. The highest number of reported fire incidents - 32 took place in 2013, and the least - 0 in 2016. The data has an increasing trend.
 When looking into fire subcategories, the most incidents belonged to: Outside Fires (49.0%), and Structure Fires (35.0%).