Estimated zip code population in 2022: 15,211 Zip code population in 2010: 14,875 Zip code population in 2000: 12,340
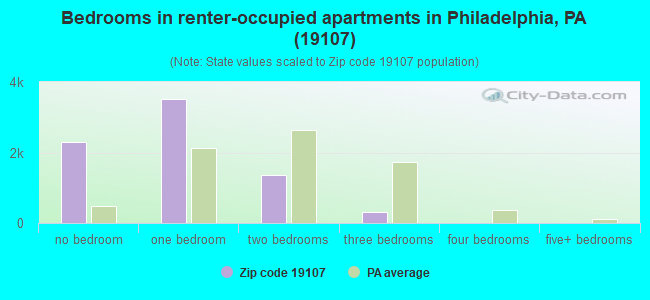
Houses and condos: 9,839 Renter-occupied apartments: 7,175
% of renters here:
82%
State:
31%
March 2022 cost of living index in zip code 19107: 109.3 (more than average, U.S. average is 100)
Land area: 0.5 sq. mi. Water area: 0.0 sq. mi.
Population density: 27,697 people per square mile
(very high).
OSM Map
General Map
Google Map
MSN Map
OSM Map
General Map
Google Map
MSN Map
OSM Map
General Map
Google Map
MSN Map
OSM Map
General Map
Google Map
MSN Map
Please wait while loading the map...
Real estate property taxes paid for housing units in 2022:
This zip code:
0.9% ($4,577)
Pennsylvania:
1.3% ($3,094)
Median real estate property taxes paid for housing units with mortgages in 2022: $4,729 (1.0%) Median real estate property taxes paid for housing units with no mortgage in 2022: $3,904 (0.8%)
Averages for the 2020 tax year for zip code 19107, filed in 2021:
Average Adjusted Gross Income (AGI) in 2020: $86,991 (Individual Income Tax Returns)
Here:
$86,991
State:
$75,707
Salary/wage: $73,595 (reported on 87.4% of returns)
Here:
$73,595
State:
$62,806
(% of AGI for various income ranges: 1032.2% for AGIs below $25k, 4036.5% for AGIs $25k-50k, 7446.8% for AGIs $50k-75k, 11385.9% for AGIs $75k-100k, 21754.1% for AGIs $100k-200k, 103086.0% for AGIs over 200k)
Taxable interest for individuals: $1,528 (reported on 30.4% of returns)
This zip code:
$1,528
Pennsylvania:
$1,633
(% of AGI for various income ranges: 16.1% for AGIs below $25k, 18.9% for AGIs $25k-50k, 23.0% for AGIs $50k-75k, 80.9% for AGIs $75k-100k, 129.4% for AGIs $100k-200k, 1070.7% for AGIs over 200k)
Ordinary dividends: $7,345 (reported on 26.9% of returns)
Here:
$7,345
State:
$7,382
(% of AGI for various income ranges: 17.5% for AGIs below $25k, 37.2% for AGIs $25k-50k, 74.5% for AGIs $50k-75k, 194.6% for AGIs $75k-100k, 642.4% for AGIs $100k-200k, 5700.7% for AGIs over 200k)
Net capital gain/loss in AGI: +$17,685 (reported on 25.4% of returns)
Here:
+$17,685
State:
+$23,522
(% of AGI for various income ranges: 32.9% for AGIs below $25k, 57.9% for AGIs $25k-50k, 108.0% for AGIs $50k-75k, 210.0% for AGIs $75k-100k, 693.5% for AGIs $100k-200k, 16871.3% for AGIs over 200k)
Profit/loss from business: +$15,696 (reported on 13.5% of returns)
Here:
+$15,696
State:
+$16,274
(% of AGI for various income ranges: 110.9% for AGIs below $25k, 189.1% for AGIs $25k-50k, 142.5% for AGIs $50k-75k, 402.8% for AGIs $75k-100k, 655.1% for AGIs $100k-200k, 3087.3% for AGIs over 200k)
Taxable individual retirement arrangement distribution: $25,221 (reported on 3.9% of returns)
19107:
$25,221
Pennsylvania:
$18,583
(% of AGI for various income ranges: 15.9% for AGIs below $25k, 29.0% for AGIs $25k-50k, 39.2% for AGIs $50k-75k, 134.3% for AGIs $75k-100k, 392.9% for AGIs $100k-200k, 2346.0% for AGIs over 200k)
Self-employed (Keogh) retirement plans: $21,667 (reported on 0.8% of returns)
19107:
$21,667
Pennsylvania:
$25,407
(% of AGI for various income ranges: 31.2% for AGIs $25k-50k, 614.7% for AGIs over 200k)
Total itemized deductions: $47,572 (reported on 7.6% of returns)
Here:
$47,572
State:
$34,850
(% of AGI for various income ranges: 73.5% for AGIs below $25k, 74.8% for AGIs $25k-50k, 135.2% for AGIs $50k-75k, 332.8% for AGIs $75k-100k, 738.4% for AGIs $100k-200k, 11427.3% for AGIs over 200k)
Charity contributions: $13,310 (reported on 5.8% of returns)
Here:
$13,310
State:
$12,392
(% of AGI for various income ranges: 6.5% for AGIs $25k-50k, 12.2% for AGIs $50k-75k, 63.9% for AGIs $75k-100k, 157.1% for AGIs $100k-200k, 2786.7% for AGIs over 200k)
Taxes paid: $8,633 (reported on 7.6% of returns)
19107:
$8,633
State:
$8,200
(% of AGI for various income ranges: 10.1% for AGIs below $25k, 16.7% for AGIs $25k-50k, 37.4% for AGIs $50k-75k, 121.5% for AGIs $75k-100k, 286.9% for AGIs $100k-200k, 1296.7% for AGIs over 200k)
Earned income credit: $1,335 (reported on 10.8% of returns)
Here:
$1,335
State:
$2,100
(% of AGI for various income ranges: 53.2% for AGIs below $25k, 24.7% for AGIs $25k-50k)
Percentage of individuals using paid preparers for their 2020 taxes: 94.0%
Here:
94%
State:
92%
(% for various income ranges: 92.6% for AGIs below $25k, 94.5% for AGIs $25k-50k, 95.9% for AGIs $50k-75k, 92.9% for AGIs $75k-100k, 94.6% for AGIs $100k-200k, 92.2% for AGIs over 200k)
Averages for the 2012 tax year for zip code 19107, filed in 2013:
Average Adjusted Gross Income (AGI) in 2012: $69,813 (Individual Income Tax Returns)
Here:
$69,813
State:
$61,346
Salary/wage: $62,404 (reported on 89.8% of returns)
Here:
$62,404
State:
$51,902
(% of AGI for various income ranges: 82.3% for AGIs below $25k, 91.9% for AGIs $25k-50k, 89.7% for AGIs $50k-75k, 88.7% for AGIs $75k-100k, 83.2% for AGIs $100k-200k, 67.9% for AGIs over 200k)
Taxable interest for individuals: $1,659 (reported on 32.7% of returns)
This zip code:
$1,659
Pennsylvania:
$1,588
(% of AGI for various income ranges: 0.9% for AGIs below $25k, 0.4% for AGIs $25k-50k, 0.6% for AGIs $50k-75k, 0.3% for AGIs $75k-100k, 0.7% for AGIs $100k-200k, 1.1% for AGIs over 200k)
Ordinary dividends: $5,773 (reported on 23.0% of returns)
Here:
$5,773
State:
$5,827
(% of AGI for various income ranges: 1.8% for AGIs below $25k, 0.8% for AGIs $25k-50k, 1.1% for AGIs $50k-75k, 1.3% for AGIs $75k-100k, 2.5% for AGIs $100k-200k, 2.5% for AGIs over 200k)
Net capital gain/loss in AGI: +$9,376 (reported on 18.8% of returns)
Here:
+$9,376
State:
+$14,495
(% of AGI for various income ranges: 0.2% for AGIs $25k-50k, 0.5% for AGIs $50k-75k, 0.3% for AGIs $75k-100k, 2.4% for AGIs $100k-200k, 5.3% for AGIs over 200k)
Profit/loss from business: +$16,833 (reported on 13.6% of returns)
Here:
+$16,833
State:
+$16,268
(% of AGI for various income ranges: 8.2% for AGIs below $25k, 2.9% for AGIs $25k-50k, 2.1% for AGIs $50k-75k, 2.9% for AGIs $75k-100k, 3.1% for AGIs $100k-200k, 3.2% for AGIs over 200k)
Taxable individual retirement arrangement distribution: $26,170 (reported on 4.5% of returns)
19107:
$26,170
Pennsylvania:
$14,550
(% of AGI for various income ranges: 1.4% for AGIs below $25k, 0.4% for AGIs $25k-50k, 0.8% for AGIs $50k-75k, 1.2% for AGIs $75k-100k, 1.6% for AGIs $100k-200k, 2.7% for AGIs over 200k)
Self-employment retirement plans: $22,288 (reported on 1.3% of returns)
19107:
$22,288
Pennsylvania:
$20,922
Total itemized deductions: $26,595 (16% of AGI, reported on 27.3% of returns)
Here:
$26,595
State:
$23,538
Here:
16.0% of AGI
State:
18.4% of AGI
(% of AGI for various income ranges: 4.5% for AGIs below $25k, 5.1% for AGIs $25k-50k, 7.0% for AGIs $50k-75k, 11.3% for AGIs $75k-100k, 13.4% for AGIs $100k-200k, 12.8% for AGIs over 200k)
Charity contributions: $3,494 (reported on 20.5% of returns)
Here:
$3,494
State:
$4,025
(% of AGI for various income ranges: 0.3% for AGIs below $25k, 0.5% for AGIs $25k-50k, 0.8% for AGIs $50k-75k, 1.1% for AGIs $75k-100k, 1.1% for AGIs $100k-200k, 1.4% for AGIs over 200k)
Taxes paid: $13,322 (reported on 27.3% of returns)
19107:
$13,322
State:
$9,982
(% of AGI for various income ranges: 1.0% for AGIs below $25k, 1.4% for AGIs $25k-50k, 2.7% for AGIs $50k-75k, 5.7% for AGIs $75k-100k, 7.0% for AGIs $100k-200k, 7.2% for AGIs over 200k)
Earned income credit: $1,639 (reported on 13.9% of returns)
Here:
$1,639
State:
$2,106
(% of AGI for various income ranges: 4.6% for AGIs below $25k, 0.3% for AGIs $25k-50k)
Percentage of individuals using paid preparers for their 2012 taxes: 44.6%
Here:
45%
State:
53%
(% for various income ranges: 47.4% for AGIs below $25k, 35.3% for AGIs $25k-50k, 38.8% for AGIs $50k-75k, 43.5% for AGIs $75k-100k, 53.2% for AGIs $100k-200k, 78.6% for AGIs over 200k)
Averages for the 2004 tax year for zip code 19107, filed in 2005:
Average Adjusted Gross Income (AGI) in 2004: $46,673 (Individual Income Tax Returns)
Here:
$46,673
State:
$48,049
Salary/wage: $42,972 (reported on 87.7% of returns)
Here:
$42,972
State:
$42,646
(% of AGI for various income ranges: 113.2% for AGIs below $10k, 87.3% for AGIs $10k-25k, 93.1% for AGIs $25k-50k, 89.2% for AGIs $50k-75k, 85.1% for AGIs $75k-100k, 67.2% for AGIs over 100k)
Taxable interest for individuals: $1,160 (reported on 40.7% of returns)
This zip code:
$1,160
Pennsylvania:
$1,657
(% of AGI for various income ranges: 5.0% for AGIs below $10k, 1.6% for AGIs $10k-25k, 0.7% for AGIs $25k-50k, 1.0% for AGIs $50k-75k, 0.7% for AGIs $75k-100k, 1.0% for AGIs over 100k)
Taxable dividends: $3,659 (reported on 23.3% of returns)
Here:
$3,659
State:
$3,566
(% of AGI for various income ranges: 4.0% for AGIs below $10k, 1.1% for AGIs $10k-25k, 0.6% for AGIs $25k-50k, 1.1% for AGIs $50k-75k, 1.9% for AGIs $75k-100k, 2.8% for AGIs over 100k)
Net capital gain/loss: +$7,605 (reported on 19.5% of returns)
Here:
+$7,605
State:
+$9,716
(% of AGI for various income ranges: -1.7% for AGIs below $10k, -0.0% for AGIs $10k-25k, 0.3% for AGIs $25k-50k, 0.7% for AGIs $50k-75k, 1.8% for AGIs $75k-100k, 6.9% for AGIs over 100k)
Profit/loss from business: +$15,425 (reported on 12.2% of returns)
Here:
+$15,425
State:
+$14,267
(% of AGI for various income ranges: 9.1% for AGIs below $10k, 4.9% for AGIs $10k-25k, 2.2% for AGIs $25k-50k, 3.4% for AGIs $50k-75k, 3.8% for AGIs $75k-100k, 4.9% for AGIs over 100k)
IRA payment deduction: $2,860 (reported on 2.4% of returns)
19107:
$2,860
Pennsylvania:
$2,903
(% of AGI for various income ranges: 0.3% for AGIs $10k-25k, 0.2% for AGIs $25k-50k, 0.1% for AGIs $50k-75k, 0.2% for AGIs $75k-100k, 0.1% for AGIs over 100k)
Self-employed pension: $16,433 (reported on 1.3% of returns)
Here:
$16,433
Pennsylvania:
$14,674
Total itemized deductions: $18,892 (18% of AGI, reported on 26.6% of returns)
Here:
$18,892
State:
$18,804
Here:
17.9% of AGI
State:
19.5% of AGI
(% of AGI for various income ranges: 9.9% for AGIs below $10k, 5.2% for AGIs $10k-25k, 6.4% for AGIs $25k-50k, 9.9% for AGIs $50k-75k, 14.7% for AGIs $75k-100k, 13.8% for AGIs over 100k)
Charity contributions deductions: $3,536 (3% of AGI, reported on 20.9% of returns)
Here:
$3,536
State:
$3,337
Here:
3.0% of AGI
State:
3.3% of AGI
(% of AGI for various income ranges: 0.4% for AGIs below $10k, 0.5% for AGIs $10k-25k, 0.8% for AGIs $25k-50k, 1.2% for AGIs $50k-75k, 1.8% for AGIs $75k-100k, 2.4% for AGIs over 100k)
Total tax: $9,379 (reported on 77.6% of returns)
19107:
$9,379
State:
$8,008
(% of AGI for various income ranges: 3.0% for AGIs below $10k, 4.9% for AGIs $10k-25k, 10.2% for AGIs $25k-50k, 14.3% for AGIs $50k-75k, 14.8% for AGIs $75k-100k, 22.0% for AGIs over 100k)
Earned income credit: $1,234 (reported on 12.3% of returns)
Here:
$1,234
State:
$1,643
Percentage of individuals using paid preparers for their 2004 taxes: 47.5%
Here:
48%
State:
56%
(% for various income ranges: 49.3% for AGIs below $10k, 47.9% for AGIs $10k-25k, 41.1% for AGIs $25k-50k, 40.4% for AGIs $50k-75k, 51.8% for AGIs $75k-100k, 70.4% for AGIs over 100k)
Likely homosexual households (counted as self-reported same-sex unmarried-partner households)
Lesbian couples: 0.2% of all households
Gay men: 1.0% of all households
Household received Food Stamps/SNAP in the past 12 months: 1,104 Household did not receive Food Stamps/SNAP in the past 12 months: 7,663
Women who had a birth in the past 12 months: 15 (0 now married, 13 unmarried) Women who did not have a birth in the past 12 months: 5,974 (1,138 now married, 4,879 unmarried)
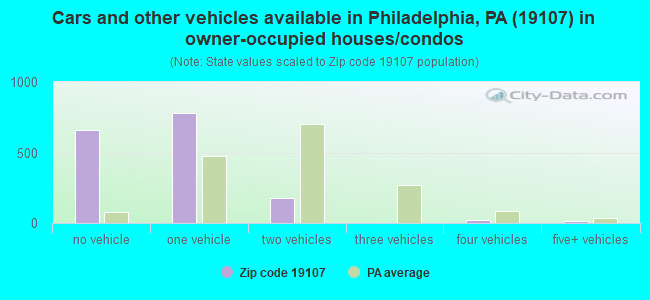
Housing units in zip code 19107 with a mortgage: 975 (89 second mortgage, 86 both second mortgage and home equity loan) Houses without a mortgage: 24
Median monthly owner costs for units with a mortgage: $2,621 Median monthly owner costs for units without a mortgage: $1,081
Residents with income below the poverty level in 2022:
This zip code:
22.0%
Whole state:
11.8%
Residents with income below 50% of the poverty level in 2022:
This zip code:
8.5%
Whole state:
6.1%
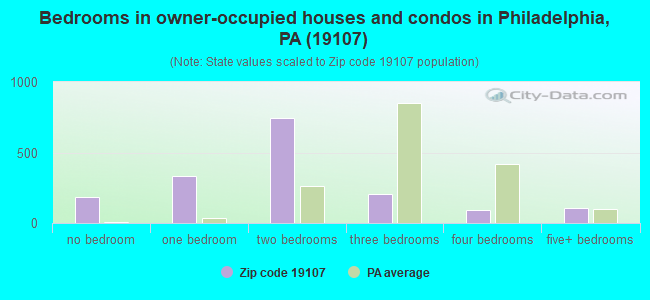
Median number of rooms in houses and condos:
Here:
4.2
State:
6.8
Median number of rooms in apartments:
Here:
2.3
State:
4.3
Notable locations in this zip code not listed on our city pages
Notable locations in zip code 19107: Reading Station (A), Philadelphia City Hall (B), Philadelphia Fire Department Engine 20 (C), Philadelphia Justice Center (D), Historical Society of Pennsylvaina (E), Hill-Physick-Keith House (F). Display/hide their locations on the map
Tourist attractions (not listed on the city page) : Arch Street Visitors Center (320 Arch St), Centipede Tours Inc (Tours & Charters; 1315 Walnut Street).
434 married couples with children.
279 single-parent households (52 men, 227 women).
69.8% of residents of 19107 zip code speak English at home.
3.9% of residents speak Spanish at home (75% very well, 15% well, 3% not well, 7% not at all).
7.3% of residents speak other Indo-European language at home (80% very well, 20% well).
17.2% of residents speak Asian or Pacific Island language at home (53% very well, 14% well, 17% not well, 17% not at all).
1.7% of residents speak other language at home (40% very well, 60% well).
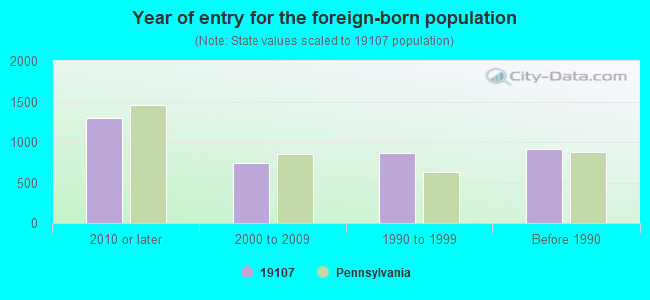
Foreign born population: 3,702 (24.3%) (57.1% of them are naturalized citizens)
Major facilities with environmental interests located in this zip code:
841 CHESTNUT BLDG (841 CHESTNUT ST in PHILADELPHIA, PA)
COMPLIANCE ACTIVITY (Tracking inspections of insecticide, fungicide, and rodenticide, and toxic substances) STATE MASTER (Pennsylvania database) - RCRIS-PAD987276276, HAZARDOUS WASTE PROGRAM (Resource Conservation and Recovery Act (tracking hazardous waste)) Business SIC classification: OPERATORS OF NONRESIDENTIAL BUILDINGS Organizations: OPERNAME (CONTACT/OPERATOR)
, 841 ASSOCIATED L P (CONTACT/OWNER)
Alternative names: 841 CHESTNUT BUILDING (AMERIMAR)
ARA TOWER (1101 MARKET STREET in PHILADELPHIA, PA)
STATE MASTER (Pennsylvania database) - RCRIS-PAD987328994, HAZARDOUS WASTE PROGRAM (Resource Conservation and Recovery Act (tracking hazardous waste)) Organizations: OPERNAME (CONTACT/OPERATOR)
ADT 85 (841 CHESTNUT STREET in PHILADELPHIA, PA)
(Integrated Compliance Information System) - ICIS-HQ-2002-6000, FORMAL ENFORCEMENT ACTION
ADVANCED ENVIRONMENTAL TECHNOLOGY CORP (DEVEREAUX AVE in PHILADELPHIA, PA)
(Resource Conservation and Recovery Act (tracking hazardous waste)) Organizations: OPERNAME (CONTACT/OPERATOR)
, LEUZARDER, JOHN B JR (CONTACT/OWNER)
BELL OF PA (9TH & RACE ST in PHILADELPHIA, PA)
COMPLIANCE ACTIVITY (Tracking inspections of insecticide, fungicide, and rodenticide, and toxic substances) Conditionally Exempt Small Quantity Generators, less than 100 kg/month of hazardous waste (Resource Conservation and Recovery Act (tracking hazardous waste)) - notification Business SIC classification: OPERATORS OF NONRESIDENTIAL BUILDINGS Organizations: OPERNAME (CONTACT/OPERATOR)
, BELL OF PENNSYLVANIA (CONTACT/OWNER)
BEN FRANKLIN HOTEL ASSOCIATION (9TH AND CHESTNUT STREETS in PHILADELPHIA, PA)
COMPLIANCE ACTIVITY (Tracking inspections of insecticide, fungicide, and rodenticide, and toxic substances) Business SIC classification: OPERATORS OF NONRESIDENTIAL BUILDINGS
BLACK TIE FORMAL WEAR (1120 WALNUT ST in PHILADELPHIA, PA)
Conditionally Exempt Small Quantity Generators, less than 100 kg/month of hazardous waste (Resource Conservation and Recovery Act (tracking hazardous waste)) - notification Organizations: BLACK TIE FORMAL WEAR INC (CONTACT/OWNER)
A.K. ASSEMBLIES (NO INSPECITON in PHILADELPHIA, PA)
COMPLIANCE ACTIVITY (Tracking inspections of insecticide, fungicide, and rodenticide, and toxic substances)
ALLCON (NO INSPECTION in PHILADELPHIA, PA)
COMPLIANCE ACTIVITY (Tracking inspections of insecticide, fungicide, and rodenticide, and toxic substances)
ALLIED BLOCK (NO INSPECTION in PHILADELPHIA, PA)
COMPLIANCE ACTIVITY (Tracking inspections of insecticide, fungicide, and rodenticide, and toxic substances)
AMERIMAR REALTY MANAGEMENT -841 CHESTNUT (841 CHESTNUT STREET SUITE 1210 in PHILADELPHIA, PA)
COMPLIANCE ACTIVITY (Tracking inspections of insecticide, fungicide, and rodenticide, and toxic substances)
AMPHOS LTD (NO INSPECTION in PHILADELPHIA, PA)
COMPLIANCE ACTIVITY (Tracking inspections of insecticide, fungicide, and rodenticide, and toxic substances)
ATLANTIC AQUATICS (NO INSPECTION in PHILADELPHIA, PA)
COMPLIANCE ACTIVITY (Tracking inspections of insecticide, fungicide, and rodenticide, and toxic substances)
Housing units lacking complete plumbing facilities: 0.2% Housing units lacking complete kitchen facilities: 1.0%
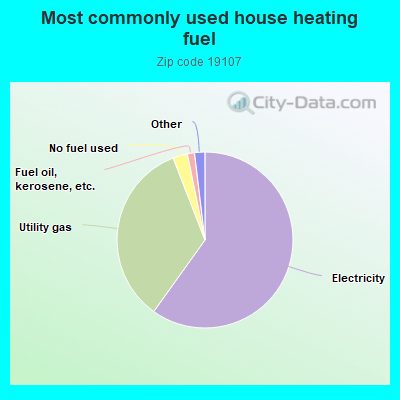
59.9%Electricity
34.2%Utility gas
2.7%No fuel used
1.3%Fuel oil, kerosene, etc.
0.8%Other fuel
0.8%Bottled, tank, or LP gas
Population in 1990: 9,634. Population change in the 1990s: +2,706 (+28.1%).
Place of birth for U.S.-born residents:
This state: 4,729
Northeast: 3,170
Midwest: 916
South: 1,667
West: 1,135
25% of the 19107 zip code residents lived in the same house 5 years ago. Out of people who lived in different houses, 28% lived in this county. Out of people who lived in different counties, 50% lived in Pennsylvania.
74% of the 19107 zip code residents lived in the same house 1 year ago. Out of people who lived in different houses, 48% moved from this county. Out of people who lived in different houses, 14% moved from different county within same state. Out of people who lived in different houses, 33% moved from different state. Out of people who lived in different houses, 4% moved from abroad.
Private vs. public school enrollment:
Students in private schools in grades 1 to 8 (elementary and middle school): 102
Here:
19.9%
Pennsylvania:
15.7%
Students in private schools in grades 9 to 12 (high school): 87
Here:
46.9%
Pennsylvania:
13.4%
Students in private undergraduate colleges: 929
Here:
73.9%
Pennsylvania:
39.8%
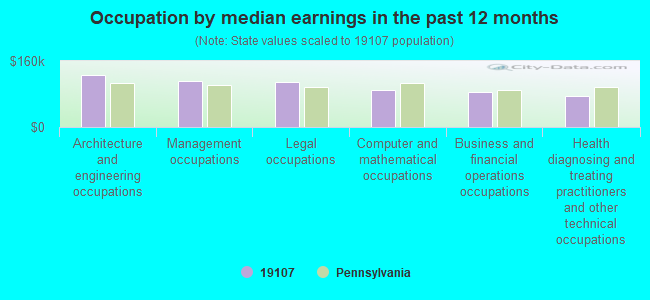
Occupation by median earnings in the past 12 months ($)
127,260Architecture and engineering occupations
110,509Management occupations
109,473Legal occupations
90,597Computer and mathematical occupations
85,506Business and financial operations occupations
74,179Health diagnosing and treating practitioners and other technical occupations
Companies with federal contracts located in this zip code:
HAY GROUP INC (100 PENN SQUARE EAST THE in PHILADELPHIA, PA) : $24,244,385 in 344 contractsfrom 1999 to 2006
Contracts for Other Professional Services, Other Management Support Services, Miscellaneous Items, Other Administrative Support Services, and moreby Internal Revenue Service, Centers for Medicare & Medicaid Services, United States Mint, Millennium Challenge Corporation, and others Signed by year:2000: $4,913,000; 2001: $2,469,229; 2002: $1,744,781; 2003: $1,608,827; 2004: $3,605,313; 2005: $4,396,608; 2006: $5,412,627.
Biggest contracts:
$3,432,000 with Internal Revenue Service for Other Professional Services. Taking place in DC. Signed on 2000-02-15. Completion date: 2001-02-15.
$1,010,000 with Centers for Medicare & Medicaid Services for Other Professional Services. Taking place in DC. Signed on 2006-05-16. Effective on 2006-05-19. Completion date: 2006-11-19.
$853,000, same as above.Signed on 2005-09-23. Completion date: 2006-09-22.
$809,684, same as above.Signed on 2006-09-14. Completion date: 2007-09-29.
PHILADELPHIA CENTER REALTY ASS (100 PENN SQUARE EAST 9TH F in PHILADELPHIA, PA) : $8,614,304 in 117 contractsfrom 2001 to 2006
Contracts for Lease or Rental of Facilities -- Office Buildings, Maintenance, Repair or Alteration of Real Property -- Office Buildings, Facilities Operations Support Services by Public Buildings Service, Army Signed by year:2000: $0; 2001: $1,320,000; 2002: $3,156,714; 2003: $3,281,803; 2004: $98,547; 2005: $428,165; 2006: $329,075.
Biggest contracts:
$468,374 with Public Buildings Service for Lease or Rental of Facilities -- Office Buildings. Signed on 2003-06-15. Completion date: 2003-06-15.
$468,374, same as above.Signed on 2003-09-15. Completion date: 2003-09-15.
$465,173, same as above.Signed on 2002-12-15. Completion date: 2002-12-15.
$465,173, same as above.Signed on 2002-12-15. Completion date: 2002-12-15.
WANAMAKER OFFICE LEASE, LP (100 PENN SQUARE EAST in PHILADELPHIA, PA) : $7,165,057 in 117 contractsfrom 2003 to 2006
Contracts for Lease or Rental of Facilities -- Office Buildings, Facilities Operations Support Services, Maintenance, Repair or Alteration of Real Property -- Office Buildings, Lease or Rental of Facilities -- Dining Facilities, and moreby Public Buildings Service, Army, U.S. Army Corps of Engineers - civil program financing only, EPA, and others Signed by year:2000: $0; 2001: $0; 2002: $0; 2003: $1,849,093; 2004: $1,031,980; 2005: $2,430,961; 2006: $1,853,023.
Biggest contracts:
$182,153 with Public Buildings Service for Lease or Rental of Facilities -- Office Buildings. Signed on 2006-01-01. Completion date: 2006-09-30.
$182,153, same as above.Signed on 2006-04-01. Completion date: 2006-09-30.
$182,153, same as above.Signed on 2006-07-01. Completion date: 2006-09-30.
$182,153, same as above.Signed on 2005-10-01. Completion date: 2006-09-30.
M CRAMER & ASSOCIATES, INC (231 N 12TH ST in PHILADELPHIA, PA; small business) : $269,039 in 3 contractsfrom 2005 to 2006
$268,594 with Army for Maintenance, Repair and Rebuilding of Equipment -- Miscellaneous. Signed on 2005-09-30. Completion date: 2005-12-30.
$445, same as above.Signed on 2006-02-28. Completion date: 2005-12-30.
$0, same as above.Signed on 2006-02-28. Completion date: 2005-12-30.
DoubleTree Hotels Guest Suites (Broad Street at Locust Street in Philadelphia, PA) : $76,635 in 4 contractsfrom 2001 to 2006
$69,000 with Office of Justice Programs for Program Management/Support Services. Signed on 2001-06-15. Completion date: 2001-06-15.
$6,000 with Office of Justice Programs for Lodging - Hotel/Motel. Signed on 2004-10-31. Effective on 2004-10-13. Completion date: 2005-07-09.
$1,635, same as above.Signed on 2005-10-05. Completion date: 2005-10-05.
$0, same as above.Signed on 2006-02-27. Completion date: 2006-02-27.
BRINKER INTERNATIONAL INC (1201 FILBERT STREET in PHILADELPHIA, TX) : $11,324 in 2 contractsfrom 2003 to 2004
$7,511 with Army for Food Services. Taking place in TX. Signed on 2003-04-10. Completion date: 2003-04-12.
$3,813, same as above.Signed on 2004-03-08. Completion date: 2003-12-12.
ELECTRO-MECHANICAL SYSTEMS INT (1315 WALNUT ST; STE 1732 in PHILADELPHIA, PA; small business) : $2,597 in 2 contractsin 2004
$1,712 with Army for Miscellaneous Electrical and Electronic Components. Signed on 2004-03-14. Completion date: 2004-04-23.
$885 with Army for Electrical Hardware and Supplies. Signed on 2004-08-03. Completion date: 2004-10-15.
Top industries in this zip code by the number of employees in 2005:
Health Care and Social Assistance: Offices of Physicians (except Mental Health Specialists) (over 1000 employees: 1 establishment, 100-249 employees: 1 establishment, 50-99 employees: 4 establishments, 20-49 employees: 9 establishments, 10-19 employees: 20 establishments, 5-9 employees: 20 establishments, 1-4 employees: 39 establishments)
2010 - 2018 National Fire Incident Reporting System (NFIRS) incidents
According to the data from the years 2010 - 2018 the average number of fire incidents per year is 73. The highest number of reported fires - 144 took place in 2018, and the least - 0 in 2016. The data has a growing trend.
When looking into fire subcategories, the most reports belonged to: Outside Fires (46.7%), and Structure Fires (42.6%).
Fire incident types reported to NFIRS in Zip Code 19107
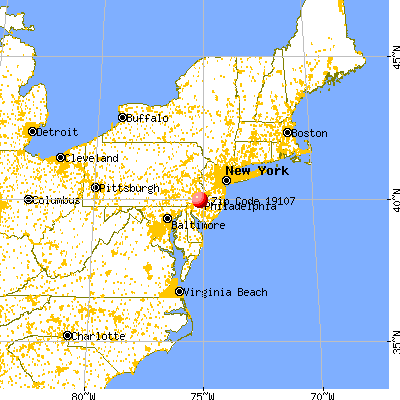


 Nearest zip codes: 19109, 19102, 19103, 19106, 19147, 19123.


 According to the data from the years 2010 - 2018 the average number of fire incidents per year is 73. The highest number of reported fires - 144 took place in 2018, and the least - 0 in 2016. The data has a growing trend.
 When looking into fire subcategories, the most reports belonged to: Outside Fires (46.7%), and Structure Fires (42.6%).