Estimated zip code population in 2022: 40,249 Zip code population in 2010: 35,113 Zip code population in 2000: 35,783
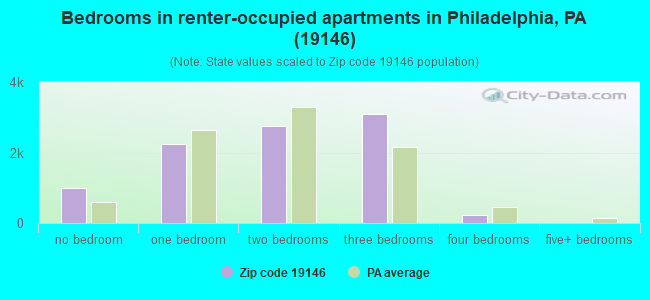
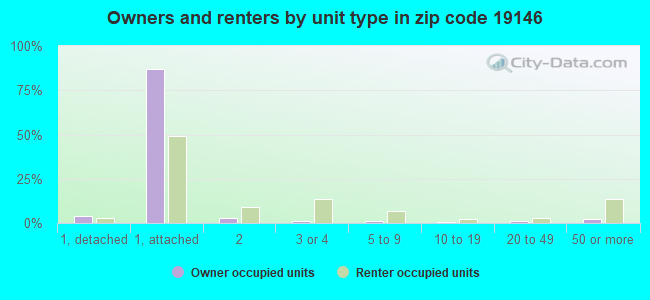
Houses and condos: 21,694 Renter-occupied apartments: 9,315
% of renters here:
49%
State:
31%
March 2022 cost of living index in zip code 19146: 106.9 (more than average, U.S. average is 100)
Land area: 1.7 sq. mi. Water area: 0.1 sq. mi.
Population density: 23,822 people per square mile
(very high).
OSM Map
General Map
Google Map
MSN Map
OSM Map
General Map
Google Map
MSN Map
OSM Map
General Map
Google Map
MSN Map
OSM Map
General Map
Google Map
MSN Map
Please wait while loading the map...
Real estate property taxes paid for housing units in 2022:
This zip code:
0.5% ($2,425)
Pennsylvania:
1.3% ($3,094)
Median real estate property taxes paid for housing units with mortgages in 2022: $3,019 (0.6%) Median real estate property taxes paid for housing units with no mortgage in 2022: $1,672 (0.6%)
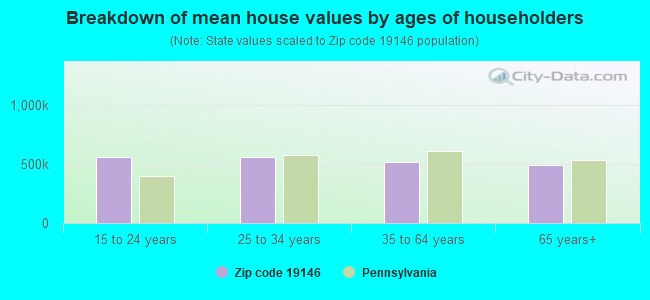
Estimated median house/condo value in 2022: $476,999
19146:
$476,999
Pennsylvania:
$245,500
According to our research of Pennsylvania and other state lists, there were 58 registered sex offenders living in 19146 zip code as of April 27, 2024. The ratio of all residents to sex offenders in zip code 19146 is 651 to 1. The ratio of registered sex offenders to all residents in this zip code is near the state average.
Median resident age:
This zip code:
33.4 years
Pennsylvania median age:
40.9 years
Average household size:
This zip code:
2.1 people
Pennsylvania:
2.4 people
Averages for the 2020 tax year for zip code 19146, filed in 2021:
Average Adjusted Gross Income (AGI) in 2020: $94,108 (Individual Income Tax Returns)
Here:
$94,108
State:
$75,707
Salary/wage: $85,653 (reported on 88.3% of returns)
Here:
$85,653
State:
$62,806
(% of AGI for various income ranges: 1049.0% for AGIs below $25k, 3656.2% for AGIs $25k-50k, 7234.6% for AGIs $50k-75k, 10822.9% for AGIs $75k-100k, 20342.0% for AGIs $100k-200k, 89056.5% for AGIs over 200k)
Taxable interest for individuals: $1,136 (reported on 31.6% of returns)
This zip code:
$1,136
Pennsylvania:
$1,633
(% of AGI for various income ranges: 8.1% for AGIs below $25k, 9.8% for AGIs $25k-50k, 18.5% for AGIs $50k-75k, 28.6% for AGIs $75k-100k, 87.6% for AGIs $100k-200k, 579.5% for AGIs over 200k)
Ordinary dividends: $5,350 (reported on 27.8% of returns)
Here:
$5,350
State:
$7,382
(% of AGI for various income ranges: 18.1% for AGIs below $25k, 29.1% for AGIs $25k-50k, 47.9% for AGIs $50k-75k, 132.6% for AGIs $75k-100k, 371.8% for AGIs $100k-200k, 2591.7% for AGIs over 200k)
Net capital gain/loss in AGI: +$17,627 (reported on 24.8% of returns)
Here:
+$17,627
State:
+$23,522
(% of AGI for various income ranges: 13.3% for AGIs below $25k, 32.8% for AGIs $25k-50k, 67.4% for AGIs $50k-75k, 180.9% for AGIs $75k-100k, 492.5% for AGIs $100k-200k, 10422.4% for AGIs over 200k)
Profit/loss from business: +$18,173 (reported on 15.1% of returns)
Here:
+$18,173
State:
+$16,274
(% of AGI for various income ranges: 94.3% for AGIs below $25k, 136.3% for AGIs $25k-50k, 191.8% for AGIs $50k-75k, 312.4% for AGIs $75k-100k, 535.2% for AGIs $100k-200k, 3891.3% for AGIs over 200k)
Taxable individual retirement arrangement distribution: $23,156 (reported on 4.2% of returns)
19146:
$23,156
Pennsylvania:
$18,583
(% of AGI for various income ranges: 14.2% for AGIs below $25k, 35.2% for AGIs $25k-50k, 66.9% for AGIs $50k-75k, 96.0% for AGIs $75k-100k, 267.0% for AGIs $100k-200k, 1359.5% for AGIs over 200k)
Self-employed (Keogh) retirement plans: $26,828 (reported on 1.2% of returns)
19146:
$26,828
Pennsylvania:
$25,407
(% of AGI for various income ranges: 32.5% for AGIs $75k-100k, 43.3% for AGIs $100k-200k, 711.7% for AGIs over 200k)
Total itemized deductions: $27,819 (reported on 15.4% of returns)
Here:
$27,819
State:
$34,850
(% of AGI for various income ranges: 45.1% for AGIs below $25k, 80.0% for AGIs $25k-50k, 262.0% for AGIs $50k-75k, 610.3% for AGIs $75k-100k, 1405.4% for AGIs $100k-200k, 5716.9% for AGIs over 200k)
Charity contributions: $6,397 (reported on 11.7% of returns)
Here:
$6,397
State:
$12,392
(% of AGI for various income ranges: 2.4% for AGIs below $25k, 17.6% for AGIs $25k-50k, 34.5% for AGIs $50k-75k, 65.7% for AGIs $75k-100k, 170.6% for AGIs $100k-200k, 1333.7% for AGIs over 200k)
Taxes paid: $8,907 (reported on 15.4% of returns)
19146:
$8,907
State:
$8,200
(% of AGI for various income ranges: 7.7% for AGIs below $25k, 20.9% for AGIs $25k-50k, 88.1% for AGIs $50k-75k, 237.4% for AGIs $75k-100k, 540.0% for AGIs $100k-200k, 1549.3% for AGIs over 200k)
Earned income credit: $1,856 (reported on 12.0% of returns)
Here:
$1,856
State:
$2,100
(% of AGI for various income ranges: 76.2% for AGIs below $25k, 45.6% for AGIs $25k-50k)
Percentage of individuals using paid preparers for their 2020 taxes: 93.7%
Here:
94%
State:
92%
(% for various income ranges: 91.5% for AGIs below $25k, 93.3% for AGIs $25k-50k, 93.9% for AGIs $50k-75k, 94.2% for AGIs $75k-100k, 95.2% for AGIs $100k-200k, 96.0% for AGIs over 200k)
Averages for the 2012 tax year for zip code 19146, filed in 2013:
Average Adjusted Gross Income (AGI) in 2012: $61,263 (Individual Income Tax Returns)
Here:
$61,263
State:
$61,346
Salary/wage: $56,525 (reported on 89.0% of returns)
Here:
$56,525
State:
$51,902
(% of AGI for various income ranges: 77.8% for AGIs below $25k, 89.6% for AGIs $25k-50k, 88.4% for AGIs $50k-75k, 87.3% for AGIs $75k-100k, 86.3% for AGIs $100k-200k, 72.3% for AGIs over 200k)
Taxable interest for individuals: $1,062 (reported on 27.2% of returns)
This zip code:
$1,062
Pennsylvania:
$1,588
(% of AGI for various income ranges: 0.4% for AGIs below $25k, 0.3% for AGIs $25k-50k, 0.3% for AGIs $50k-75k, 0.5% for AGIs $75k-100k, 0.5% for AGIs $100k-200k, 0.7% for AGIs over 200k)
Ordinary dividends: $5,203 (reported on 18.7% of returns)
Here:
$5,203
State:
$5,827
(% of AGI for various income ranges: 0.9% for AGIs below $25k, 0.5% for AGIs $25k-50k, 0.7% for AGIs $50k-75k, 0.9% for AGIs $75k-100k, 1.5% for AGIs $100k-200k, 3.0% for AGIs over 200k)
Net capital gain/loss in AGI: +$11,818 (reported on 14.5% of returns)
Here:
+$11,818
State:
+$14,495
(% of AGI for various income ranges: 0.1% for AGIs below $25k, 0.2% for AGIs $25k-50k, 0.5% for AGIs $50k-75k, 0.4% for AGIs $75k-100k, 1.5% for AGIs $100k-200k, 7.3% for AGIs over 200k)
Profit/loss from business: +$16,871 (reported on 13.2% of returns)
Here:
+$16,871
State:
+$16,268
(% of AGI for various income ranges: 7.6% for AGIs below $25k, 2.3% for AGIs $25k-50k, 2.2% for AGIs $50k-75k, 2.7% for AGIs $75k-100k, 3.2% for AGIs $100k-200k, 4.5% for AGIs over 200k)
Taxable individual retirement arrangement distribution: $17,308 (reported on 4.0% of returns)
19146:
$17,308
Pennsylvania:
$14,550
(% of AGI for various income ranges: 0.9% for AGIs below $25k, 0.6% for AGIs $25k-50k, 1.0% for AGIs $50k-75k, 0.9% for AGIs $75k-100k, 1.4% for AGIs $100k-200k, 1.4% for AGIs over 200k)
Self-employment retirement plans: $20,611 (reported on 1.0% of returns)
19146:
$20,611
Pennsylvania:
$20,922
(% of AGI for various income ranges: 0.2% for AGIs $50k-75k, 0.3% for AGIs $100k-200k, 0.8% for AGIs over 200k)
Total itemized deductions: $23,466 (18% of AGI, reported on 30.7% of returns)
Here:
$23,466
State:
$23,538
Here:
17.6% of AGI
State:
18.4% of AGI
(% of AGI for various income ranges: 4.9% for AGIs below $25k, 7.2% for AGIs $25k-50k, 11.0% for AGIs $50k-75k, 14.2% for AGIs $75k-100k, 15.4% for AGIs $100k-200k, 13.0% for AGIs over 200k)
Charity contributions: $3,173 (reported on 24.2% of returns)
Here:
$3,173
State:
$4,025
(% of AGI for various income ranges: 0.4% for AGIs below $25k, 1.1% for AGIs $25k-50k, 1.4% for AGIs $50k-75k, 1.3% for AGIs $75k-100k, 1.3% for AGIs $100k-200k, 1.4% for AGIs over 200k)
Taxes paid: $10,848 (reported on 30.6% of returns)
19146:
$10,848
State:
$9,982
(% of AGI for various income ranges: 1.2% for AGIs below $25k, 2.1% for AGIs $25k-50k, 3.8% for AGIs $50k-75k, 6.0% for AGIs $75k-100k, 7.4% for AGIs $100k-200k, 7.4% for AGIs over 200k)
Earned income credit: $2,132 (reported on 22.4% of returns)
Here:
$2,132
State:
$2,106
(% of AGI for various income ranges: 8.0% for AGIs below $25k, 0.9% for AGIs $25k-50k)
Percentage of individuals using paid preparers for their 2012 taxes: 42.0%
Here:
42%
State:
53%
(% for various income ranges: 41.2% for AGIs below $25k, 36.5% for AGIs $25k-50k, 38.6% for AGIs $50k-75k, 42.7% for AGIs $75k-100k, 51.2% for AGIs $100k-200k, 69.0% for AGIs over 200k)
Averages for the 2004 tax year for zip code 19146, filed in 2005:
Average Adjusted Gross Income (AGI) in 2004: $34,873 (Individual Income Tax Returns)
Here:
$34,873
State:
$48,049
Salary/wage: $33,336 (reported on 89.2% of returns)
Here:
$33,336
State:
$42,646
(% of AGI for various income ranges: 93.6% for AGIs below $10k, 84.1% for AGIs $10k-25k, 91.6% for AGIs $25k-50k, 88.0% for AGIs $50k-75k, 87.8% for AGIs $75k-100k, 76.5% for AGIs over 100k)
Taxable interest for individuals: $803 (reported on 25.4% of returns)
This zip code:
$803
Pennsylvania:
$1,657
(% of AGI for various income ranges: 1.6% for AGIs below $10k, 0.6% for AGIs $10k-25k, 0.4% for AGIs $25k-50k, 0.6% for AGIs $50k-75k, 0.6% for AGIs $75k-100k, 0.7% for AGIs over 100k)
Taxable dividends: $2,643 (reported on 13.2% of returns)
Here:
$2,643
State:
$3,566
(% of AGI for various income ranges: 1.3% for AGIs below $10k, 0.5% for AGIs $10k-25k, 0.4% for AGIs $25k-50k, 0.7% for AGIs $50k-75k, 0.9% for AGIs $75k-100k, 2.0% for AGIs over 100k)
Net capital gain/loss: +$7,852 (reported on 10.1% of returns)
Here:
+$7,852
State:
+$9,716
(% of AGI for various income ranges: -0.5% for AGIs below $10k, 0.3% for AGIs $10k-25k, 0.2% for AGIs $25k-50k, 1.0% for AGIs $50k-75k, 1.6% for AGIs $75k-100k, 6.6% for AGIs over 100k)
Profit/loss from business: +$11,115 (reported on 9.0% of returns)
Here:
+$11,115
State:
+$14,267
(% of AGI for various income ranges: 5.0% for AGIs below $10k, 2.8% for AGIs $10k-25k, 1.3% for AGIs $25k-50k, 2.7% for AGIs $50k-75k, 2.3% for AGIs $75k-100k, 4.5% for AGIs over 100k)
IRA payment deduction: $2,261 (reported on 1.7% of returns)
19146:
$2,261
Pennsylvania:
$2,903
(% of AGI for various income ranges: 0.2% for AGIs $10k-25k, 0.1% for AGIs $25k-50k, 0.1% for AGIs $50k-75k, 0.1% for AGIs $75k-100k, 0.1% for AGIs over 100k)
Self-employed pension: $12,960 (reported on 0.7% of returns)
Here:
$12,960
Pennsylvania:
$14,674
(% of AGI for various income ranges: 0.1% for AGIs $10k-25k, 0.2% for AGIs $50k-75k, 0.2% for AGIs $75k-100k, 0.7% for AGIs over 100k)
Total itemized deductions: $16,952 (22% of AGI, reported on 24.9% of returns)
Here:
$16,952
State:
$18,804
Here:
21.8% of AGI
State:
19.5% of AGI
(% of AGI for various income ranges: 5.1% for AGIs below $10k, 4.6% for AGIs $10k-25k, 10.4% for AGIs $25k-50k, 15.8% for AGIs $50k-75k, 17.8% for AGIs $75k-100k, 14.8% for AGIs over 100k)
Charity contributions deductions: $3,084 (4% of AGI, reported on 21.7% of returns)
Here:
$3,084
State:
$3,337
Here:
3.8% of AGI
State:
3.3% of AGI
(% of AGI for various income ranges: 0.3% for AGIs below $10k, 0.8% for AGIs $10k-25k, 2.1% for AGIs $25k-50k, 2.9% for AGIs $50k-75k, 2.4% for AGIs $75k-100k, 1.9% for AGIs over 100k)
Total tax: $6,207 (reported on 63.1% of returns)
19146:
$6,207
State:
$8,008
(% of AGI for various income ranges: 1.9% for AGIs below $10k, 3.2% for AGIs $10k-25k, 7.0% for AGIs $25k-50k, 11.4% for AGIs $50k-75k, 12.9% for AGIs $75k-100k, 20.1% for AGIs over 100k)
Earned income credit: $1,828 (reported on 31.5% of returns)
Here:
$1,828
State:
$1,643
Percentage of individuals using paid preparers for their 2004 taxes: 51.9%
Here:
52%
State:
56%
(% for various income ranges: 51.5% for AGIs below $10k, 56.4% for AGIs $10k-25k, 47.2% for AGIs $25k-50k, 47.9% for AGIs $50k-75k, 46.5% for AGIs $75k-100k, 62.4% for AGIs over 100k)
Likely homosexual households (counted as self-reported same-sex unmarried-partner households)
Lesbian couples: 0.5% of all households
Gay men: 0.8% of all households
Household received Food Stamps/SNAP in the past 12 months: 3,010 Household did not receive Food Stamps/SNAP in the past 12 months: 16,006
Women who had a birth in the past 12 months: 609 (557 now married, 75 unmarried) Women who did not have a birth in the past 12 months: 11,997 (3,391 now married, 8,653 unmarried)
Housing units in zip code 19146 with a mortgage: 6,207 (511 second mortgage, 464 both second mortgage and home equity loan) Houses without a mortgage: 280
Median monthly owner costs for units with a mortgage: $2,131 Median monthly owner costs for units without a mortgage: $525
Residents with income below the poverty level in 2022:
This zip code:
15.4%
Whole state:
11.8%
Residents with income below 50% of the poverty level in 2022:
This zip code:
8.3%
Whole state:
6.1%
Median number of rooms in houses and condos:
Here:
5.8
State:
6.8
Median number of rooms in apartments:
Here:
4.2
State:
4.3
Notable locations in this zip code not listed on our city pages
Notable locations in zip code 19146: United States Naval Home (A), Marion Anderson Community Center (B), Philadelphia Fire Department Engine 24 (C), Philadelphia Fire Department Engine 47 (D), Good Shepherd Penn Partners Hospital (E). Display/hide their locations on the map
3,629 married couples with children.
2,700 single-parent households (647 men, 2,053 women).
84.4% of residents of 19146 zip code speak English at home.
5.3% of residents speak Spanish at home (62% very well, 15% well, 15% not well, 8% not at all).
3.5% of residents speak other Indo-European language at home (85% very well, 11% well, 3% not well).
4.4% of residents speak Asian or Pacific Island language at home (56% very well, 27% well, 14% not well, 3% not at all).
1.8% of residents speak other language at home (99% very well, 1% not well).
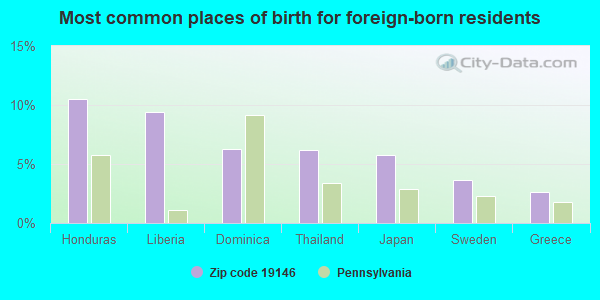
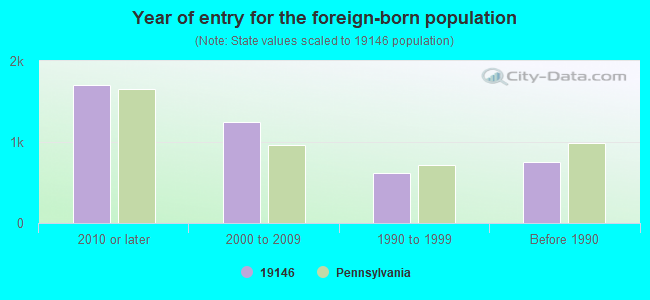
Foreign born population: 3,553 (8.8%) (45.1% of them are naturalized citizens)
Facilities with environmental interests located in this zip code:
AMOCO SVC STA S BROAD (740 S BROAD ST in PHILADELPHIA, PA)
STATE MASTER (Pennsylvania database) - RCRIS-PAD987283181, HAZARDOUS WASTE PROGRAM (Resource Conservation and Recovery Act (tracking hazardous waste)) Small Quantity Generators, between 100 kg and 1000 kg of hazardous waste/month (Resource Conservation and Recovery Act (tracking hazardous waste)) - notification Organizations: OPERNAME (CONTACT/OPERATOR)
, AMOCO OIL COMPANY (CONTACT/OWNER)
Alternative names: AMOCO 77 TANKS, SOUTH PHILLY AMOCO
AT&T PHILA SCHUYLKILL (500 S 27TH STREET in PHILADELPHIA, PA)
STATE MASTER (Pennsylvania database) - RCRIS-PAD980715098, HAZARDOUS WASTE PROGRAM Small Quantity Generators, between 100 kg and 1000 kg of hazardous waste/month (Resource Conservation and Recovery Act (tracking hazardous waste)) - notification Organizations: OPERNAME (CONTACT/OPERATOR)
, AT & T LONG LINES (CONTACT/OWNER)
Alternative names: AT & T LONG LINES EQ ENG ATTN M COFFMAN
ALCORN ELEMENTARY SCHOOL (3200 DICKENSON ST. in PHILADELPHIA, PA)
(Geographic Names Information System) (National Center for Education Statistics) - STATE ID-3617 Organizations: PHILADELPHIA CITY SD (SCHOOL DISTRICT)
Alternative names: ALCORN JAMES SCH
BARRATT NORRIS S MS (1599 WHARTON ST in PHILADELPHIA, PA)
ENFORCEMENT/COMPLIANCE ACTIVITY (Integrated Compliance Information System) (National Center for Education Statistics) - STATE ID-7237 Organizations: PHILADELPHIA CITY SD (SCHOOL DISTRICT)
Alternative names: BARRATT MIDDLE SCHOOL
ARTHUR CHESTER A SCH (2000 CATHARINE ST in PHILADELPHIA, PA)
(National Center for Education Statistics) - STATE ID-3805 Organizations: PHILADELPHIA CITY SD (SCHOOL DISTRICT)
AMERICAN HYPERFORM, INC. (3201 REED STREET in PHILADELPHIA, PA)
COMPLIANCE ACTIVITY (Tracking inspections of insecticide, fungicide, and rodenticide, and toxic substances)
ATLANTIC TRANSMISSIONS INCORPORATED (1172 SOUTH BROAD STREET in PHILADELPHIA, PA)
Small Quantity Generators, between 100 kg and 1000 kg of hazardous waste/month (Resource Conservation and Recovery Act (tracking hazardous waste)) - notification Business NAICS classification: AUTOMOTIVE TRANSMISSION REPAIR. Organizations: OPERNAME (CONTACT/OPERATOR)
, VERNACCHIO, JAMES (CONTACT/OWNER)
Alternative names: ATLANTIC TRANMISSION SERVICE
BASILS AUTO BODY (1043-45 S 17TH ST in PHILADELPHIA, PA)
Small Quantity Generators, between 100 kg and 1000 kg of hazardous waste/month (Resource Conservation and Recovery Act (tracking hazardous waste)) - notification Organizations: OPERNAME (CONTACT/OPERATOR)
, SILVESTRI, BASIL (CONTACT/OWNER)
BOB AMOCO (3349 GRAYSFERRY AVE in PHILADELPHIA, PA)
Small Quantity Generators, between 100 kg and 1000 kg of hazardous waste/month (Resource Conservation and Recovery Act (tracking hazardous waste)) - notification Organizations: OPERNAME (CONTACT/OPERATOR)
, RE PLEASANT SR (CONTACT/OWNER)
A P S SERVICES INC (2305 GRAYS FERRY AVE in PHILADELPHIA, PA)
TRANSPORTER (Resource Conservation and Recovery Act (tracking hazardous waste)) Organizations: ANTHONY SHULER (CONTACT/OWNER)
AADCO AUTO COLLISION (2000 WASHINGTON AVENUE in PHILADELPHIA, PA)
Small Quantity Generators, between 100 kg and 1000 kg of hazardous waste/month (Resource Conservation and Recovery Act (tracking hazardous waste)) - notification Organizations: ANSALDO CHARLES (CONTACT/OWNER)
ALEXS AUTO BODY (1120 SOUTH BROAD STREET in PHILADELPHIA, PA)
Conditionally Exempt Small Quantity Generators, less than 100 kg/month of hazardous waste (Resource Conservation and Recovery Act (tracking hazardous waste)) - notification Organizations: BARABUSCIO ALEX (CONTACT/OWNER)
1536 S. 31ST ST. (1536 S. 31ST ST. in PHILADELPHIA, PA)
COMPLIANCE ACTIVITY (Tracking inspections of insecticide, fungicide, and rodenticide, and toxic substances)
Housing units lacking complete plumbing facilities: 2.0% Housing units lacking complete kitchen facilities: 1.9%
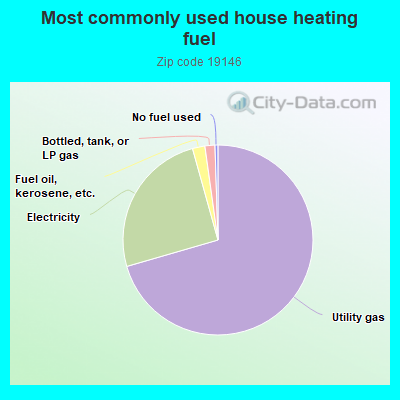
70.3%Utility gas
25.1%Electricity
2.1%Fuel oil, kerosene, etc.
1.7%Bottled, tank, or LP gas
0.5%No fuel used
Population in 1990: 38,870.
Place of birth for U.S.-born residents:
This state: 21,601
Northeast: 6,441
Midwest: 1,777
South: 4,899
West: 1,522
64% of the 19146 zip code residents lived in the same house 5 years ago. Out of people who lived in different houses, 74% lived in this county. Out of people who lived in different counties, 50% lived in Pennsylvania.
80% of the 19146 zip code residents lived in the same house 1 year ago. Out of people who lived in different houses, 59% moved from this county. Out of people who lived in different houses, 12% moved from different county within same state. Out of people who lived in different houses, 24% moved from different state. Out of people who lived in different houses, 3% moved from abroad.
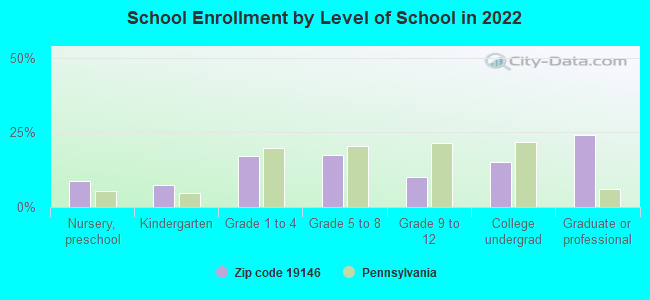
Private vs. public school enrollment:
Students in private schools in grades 1 to 8 (elementary and middle school): 805
Here:
29.1%
Pennsylvania:
15.7%
Students in private schools in grades 9 to 12 (high school): 89
Here:
11.5%
Pennsylvania:
13.4%
Students in private undergraduate colleges: 472
Here:
39.9%
Pennsylvania:
39.8%
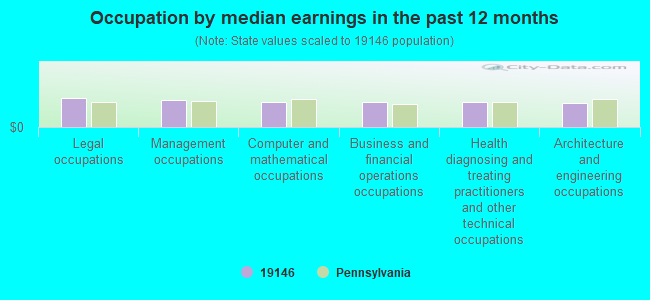
Occupation by median earnings in the past 12 months ($)
104,986Legal occupations
95,725Management occupations
90,949Computer and mathematical occupations
89,320Business and financial operations occupations
88,178Health diagnosing and treating practitioners and other technical occupations
87,586Architecture and engineering occupations
Companies with federal contracts located in this zip code:
HERBERT W. WALLACE, M.D. (1 GRADUATE PLZ in PHILADELPHIA, PA; small business) : $458,091 in 13 contractsfrom 2002 to 2006
Contracts for Medical/Psychiatric Consultation Services, Other Medical Services by SOCIAL SECURITY ADMINISTRATION Signed by year:2000: $0; 2001: $0; 2002: $109,000; 2003: $118,278; 2004: $84,309; 2005: $111,800; 2006: $34,704.
Biggest contracts:
$76,558 with SOCIAL SECURITY ADMINISTRATION for Medical/Psychiatric Consultation Services. Signed on 2003-08-15. Completion date: 2007-04-15.
$69,000, same as above.Signed on 2002-03-15. Completion date: 2007-04-15.
$65,503 with SOCIAL SECURITY ADMINISTRATION for Other Medical Services. Signed on 2005-08-19. Completion date: 2006-04-30.
$43,608, same as above.Signed on 2004-04-06. Completion date: 2007-04-30.
QLC TECHNOLOGIES (2320 GRAYS FERRY AVE in PHILADELPHIA, PA; small business) : $72,285 in 5 contractsfrom 2002 to 2004
Contracts for ADP Support Equipment, Other Professional Services, ADP Components by Army, Public Buildings Service Signed by year:2000: $0; 2001: $0; 2002: $15,922; 2003: $49,043; 2004: $7,320; 2005: $0; 2006: $0.
Biggest contracts:
$33,120 with Army for ADP Support Equipment. Signed on 2003-09-10. Completion date: 2003-09-19.
$15,922 with Public Buildings Service for Other Professional Services. Signed on 2003-10-01. Completion date: 2003-10-01.
$15,922 with Public Buildings Service for ADP Components. Signed on 2002-12-15. Completion date: 2003-12-15.
$7,320 with Army for ADP Support Equipment. Signed on 2004-01-05. Completion date: 2004-01-14.
RYDER TRUCK RENTAL INC (1450 S WARFIELD ST in PHILADELPHIA, PA; small business)
$12,150 with Army for Lease or Rental of Equipment -- Ground Effect Vehicles, Motor Vehicles, Trailers, and Cycles. Signed on 2004-10-25. Completion date: 2005-04-26.
Top industries in this zip code by the number of employees in 2005:
Health Care and Social Assistance: General Medical and Surgical Hospitals (500-999 employees: 1 establishment, 100-249 employees: 1 establishment)
Health Care and Social Assistance: Child and Youth Services (250-499: 2, 20-49: 1, 10-19: 1)
Professional, Scientific, and Technical Services: Research and Development in the Physical, Engineering, and Life Sciences (250-499: 1)
Health Care and Social Assistance: Offices of Physicians (except Mental Health Specialists) (20-49: 4, 10-19: 4, 5-9: 4, 1-4: 11)
2010 - 2018 National Fire Incident Reporting System (NFIRS) incidents
Based on the data from the years 2010 - 2018 the average number of fire incidents per year is 123. The highest number of fire incidents - 189 took place in 2018, and the least - 0 in 2016. The data has a rising trend.
When looking into fire subcategories, the most reports belonged to: Structure Fires (56.3%), and Outside Fires (28.0%).
Fire incident types reported to NFIRS in Zip Code 19146


 Nearest zip codes: 19103, 19102, 19109, 19104, 19107, 19130.


 Based on the data from the years 2010 - 2018 the average number of fire incidents per year is 123. The highest number of fire incidents - 189 took place in 2018, and the least - 0 in 2016. The data has a rising trend.
 When looking into fire subcategories, the most reports belonged to: Structure Fires (56.3%), and Outside Fires (28.0%).