Estimated zip code population in 2022: 53,607 Zip code population in 2010: 51,808 Zip code population in 2000: 50,125
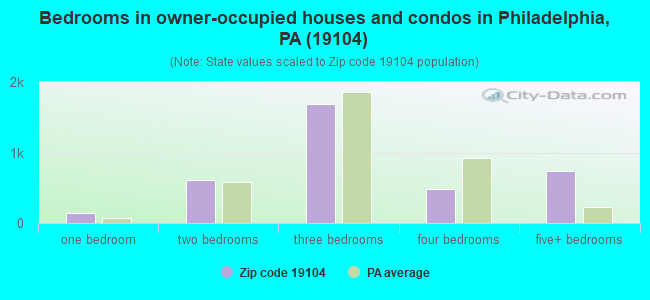
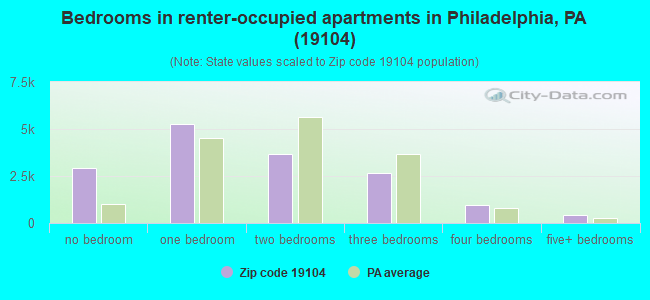
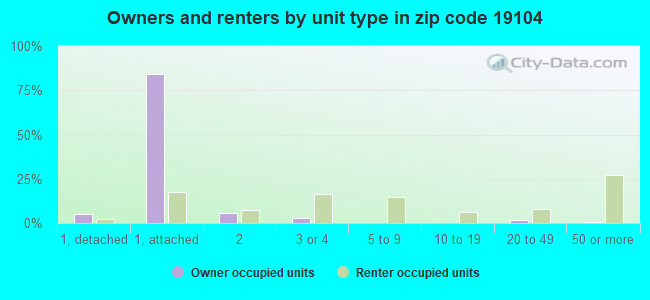
Houses and condos: 23,065 Renter-occupied apartments: 15,640
% of renters here:
81%
State:
31%
March 2022 cost of living index in zip code 19104: 109.0 (more than average, U.S. average is 100)
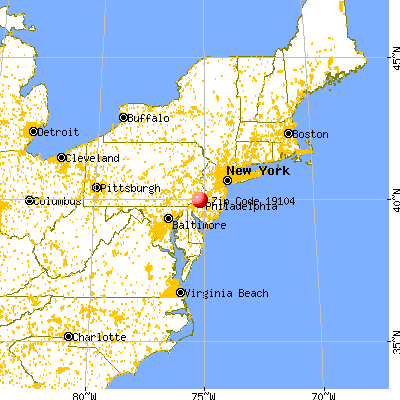
Land area: 3.0 sq. mi. Water area: 0.1 sq. mi.
Population density: 17,830 people per square mile
(very high).
OSM Map
General Map
Google Map
MSN Map
OSM Map
General Map
Google Map
MSN Map
OSM Map
General Map
Google Map
MSN Map
OSM Map
General Map
Google Map
MSN Map
Please wait while loading the map...
Real estate property taxes paid for housing units in 2022:
This zip code:
0.5% ($1,363)
Pennsylvania:
1.3% ($3,094)
Median real estate property taxes paid for housing units with mortgages in 2022: $2,125 (0.6%) Median real estate property taxes paid for housing units with no mortgage in 2022: $866 (0.5%)
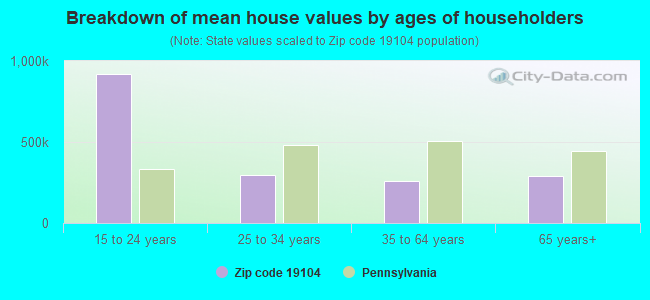
Estimated median house/condo value in 2022: $274,587
19104:
$274,587
Pennsylvania:
$245,500
According to our research of Pennsylvania and other state lists, there were 77 registered sex offenders living in 19104 zip code as of April 27, 2024. The ratio of all residents to sex offenders in zip code 19104 is 723 to 1. The ratio of registered sex offenders to all residents in this zip code is lower than the state average.
Median resident age:
This zip code:
23.0 years
Pennsylvania median age:
40.9 years
Average household size:
This zip code:
2.0 people
Pennsylvania:
2.4 people
Averages for the 2020 tax year for zip code 19104, filed in 2021:
Average Adjusted Gross Income (AGI) in 2020: $45,083 (Individual Income Tax Returns)
Here:
$45,083
State:
$75,707
Salary/wage: $39,692 (reported on 87.6% of returns)
Here:
$39,692
State:
$62,806
(% of AGI for various income ranges: 1038.7% for AGIs below $25k, 3510.3% for AGIs $25k-50k, 6901.8% for AGIs $50k-75k, 11000.4% for AGIs $75k-100k, 19826.1% for AGIs $100k-200k, 106678.9% for AGIs over 200k)
Taxable interest for individuals: $964 (reported on 16.3% of returns)
This zip code:
$964
Pennsylvania:
$1,633
(% of AGI for various income ranges: 5.0% for AGIs below $25k, 5.0% for AGIs $25k-50k, 13.4% for AGIs $50k-75k, 52.0% for AGIs $75k-100k, 109.3% for AGIs $100k-200k, 1193.3% for AGIs over 200k)
Ordinary dividends: $4,952 (reported on 12.5% of returns)
Here:
$4,952
State:
$7,382
(% of AGI for various income ranges: 7.4% for AGIs below $25k, 10.7% for AGIs $25k-50k, 43.6% for AGIs $50k-75k, 133.6% for AGIs $75k-100k, 267.6% for AGIs $100k-200k, 7240.0% for AGIs over 200k)
Net capital gain/loss in AGI: +$11,653 (reported on 12.7% of returns)
Here:
+$11,653
State:
+$23,522
(% of AGI for various income ranges: 9.3% for AGIs below $25k, 22.9% for AGIs $25k-50k, 67.9% for AGIs $50k-75k, 372.8% for AGIs $75k-100k, 828.8% for AGIs $100k-200k, 17295.6% for AGIs over 200k)
Profit/loss from business: +$9,973 (reported on 13.5% of returns)
Here:
+$9,973
State:
+$16,274
(% of AGI for various income ranges: 78.9% for AGIs below $25k, 82.0% for AGIs $25k-50k, 117.3% for AGIs $50k-75k, 242.4% for AGIs $75k-100k, 557.8% for AGIs $100k-200k, 8860.0% for AGIs over 200k)
Taxable individual retirement arrangement distribution: $14,544 (reported on 1.7% of returns)
19104:
$14,544
Pennsylvania:
$18,583
(% of AGI for various income ranges: 5.6% for AGIs below $25k, 9.8% for AGIs $25k-50k, 26.5% for AGIs $50k-75k, 95.4% for AGIs $75k-100k, 301.5% for AGIs $100k-200k, 1170.0% for AGIs over 200k)
Self-employed (Keogh) retirement plans: $18,475 (reported on 0.3% of returns)
19104:
$18,475
Pennsylvania:
$25,407
(% of AGI for various income ranges: 821.1% for AGIs over 200k)
Total itemized deductions: $32,602 (reported on 3.7% of returns)
Here:
$32,602
State:
$34,850
(% of AGI for various income ranges: 7.1% for AGIs below $25k, 51.0% for AGIs $25k-50k, 179.9% for AGIs $50k-75k, 426.2% for AGIs $75k-100k, 962.0% for AGIs $100k-200k, 8556.7% for AGIs over 200k)
Charity contributions: $11,371 (reported on 3.0% of returns)
Here:
$11,371
State:
$12,392
(% of AGI for various income ranges: 15.0% for AGIs $25k-50k, 62.9% for AGIs $50k-75k, 100.6% for AGIs $75k-100k, 253.4% for AGIs $100k-200k, 2522.2% for AGIs over 200k)
Taxes paid: $7,783 (reported on 3.7% of returns)
19104:
$7,783
State:
$8,200
(% of AGI for various income ranges: 1.5% for AGIs below $25k, 13.1% for AGIs $25k-50k, 47.3% for AGIs $50k-75k, 131.4% for AGIs $75k-100k, 288.8% for AGIs $100k-200k, 1503.3% for AGIs over 200k)
Earned income credit: $2,077 (reported on 22.4% of returns)
Here:
$2,077
State:
$2,100
(% of AGI for various income ranges: 82.0% for AGIs below $25k, 63.5% for AGIs $25k-50k)
Percentage of individuals using paid preparers for their 2020 taxes: 93.1%
Here:
93%
State:
92%
(% for various income ranges: 93.4% for AGIs below $25k, 93.6% for AGIs $25k-50k, 92.8% for AGIs $50k-75k, 92.0% for AGIs $75k-100k, 90.5% for AGIs $100k-200k, 91.2% for AGIs over 200k)
Averages for the 2012 tax year for zip code 19104, filed in 2013:
Average Adjusted Gross Income (AGI) in 2012: $33,866 (Individual Income Tax Returns)
Here:
$33,866
State:
$61,346
Salary/wage: $30,279 (reported on 89.5% of returns)
Here:
$30,279
State:
$51,902
(% of AGI for various income ranges: 83.3% for AGIs below $25k, 91.5% for AGIs $25k-50k, 89.2% for AGIs $50k-75k, 83.1% for AGIs $75k-100k, 80.4% for AGIs $100k-200k, 47.3% for AGIs over 200k)
Taxable interest for individuals: $809 (reported on 15.9% of returns)
This zip code:
$809
Pennsylvania:
$1,588
(% of AGI for various income ranges: 0.2% for AGIs below $25k, 0.2% for AGIs $25k-50k, 0.2% for AGIs $50k-75k, 0.3% for AGIs $75k-100k, 0.8% for AGIs $100k-200k, 0.7% for AGIs over 200k)
Ordinary dividends: $7,770 (reported on 9.0% of returns)
Here:
$7,770
State:
$5,827
(% of AGI for various income ranges: 0.4% for AGIs below $25k, 0.5% for AGIs $25k-50k, 0.7% for AGIs $50k-75k, 1.1% for AGIs $75k-100k, 2.2% for AGIs $100k-200k, 8.3% for AGIs over 200k)
Net capital gain/loss in AGI: +$9,062 (reported on 6.9% of returns)
Here:
+$9,062
State:
+$14,495
(% of AGI for various income ranges: 0.1% for AGIs below $25k, 0.2% for AGIs $25k-50k, 0.3% for AGIs $50k-75k, 0.9% for AGIs $75k-100k, 1.6% for AGIs $100k-200k, 8.7% for AGIs over 200k)
Profit/loss from business: +$9,581 (reported on 11.7% of returns)
Here:
+$9,581
State:
+$16,268
(% of AGI for various income ranges: 7.7% for AGIs below $25k, 1.4% for AGIs $25k-50k, 2.4% for AGIs $50k-75k, 2.0% for AGIs $75k-100k, 2.8% for AGIs $100k-200k, 2.8% for AGIs over 200k)
Taxable individual retirement arrangement distribution: $13,043 (reported on 2.3% of returns)
19104:
$13,043
Pennsylvania:
$14,550
(% of AGI for various income ranges: 0.4% for AGIs below $25k, 0.5% for AGIs $25k-50k, 0.8% for AGIs $50k-75k, 2.4% for AGIs $75k-100k, 3.0% for AGIs $100k-200k)
Self-employment retirement plans: $15,700 (reported on 0.2% of returns)
19104:
$15,700
Pennsylvania:
$20,922
Total itemized deductions: $21,003 (21% of AGI, reported on 13.4% of returns)
Here:
$21,003
State:
$23,538
Here:
20.6% of AGI
State:
18.4% of AGI
(% of AGI for various income ranges: 2.5% for AGIs below $25k, 5.4% for AGIs $25k-50k, 9.2% for AGIs $50k-75k, 11.7% for AGIs $75k-100k, 14.6% for AGIs $100k-200k, 13.3% for AGIs over 200k)
Charity contributions: $4,019 (reported on 10.5% of returns)
Here:
$4,019
State:
$4,025
(% of AGI for various income ranges: 0.3% for AGIs below $25k, 1.0% for AGIs $25k-50k, 1.7% for AGIs $50k-75k, 1.9% for AGIs $75k-100k, 2.2% for AGIs $100k-200k, 1.4% for AGIs over 200k)
Taxes paid: $8,527 (reported on 13.2% of returns)
19104:
$8,527
State:
$9,982
(% of AGI for various income ranges: 0.5% for AGIs below $25k, 1.5% for AGIs $25k-50k, 3.0% for AGIs $50k-75k, 4.8% for AGIs $75k-100k, 7.0% for AGIs $100k-200k, 6.7% for AGIs over 200k)
Earned income credit: $2,284 (reported on 31.1% of returns)
Here:
$2,284
State:
$2,106
(% of AGI for various income ranges: 8.6% for AGIs below $25k, 1.1% for AGIs $25k-50k)
Percentage of individuals using paid preparers for their 2012 taxes: 35.3%
Here:
35%
State:
53%
(% for various income ranges: 35.2% for AGIs below $25k, 31.6% for AGIs $25k-50k, 36.5% for AGIs $50k-75k, 40.5% for AGIs $75k-100k, 50.0% for AGIs $100k-200k, 66.7% for AGIs over 200k)
Averages for the 2004 tax year for zip code 19104, filed in 2005:
Average Adjusted Gross Income (AGI) in 2004: $25,198 (Individual Income Tax Returns)
Here:
$25,198
State:
$48,049
Salary/wage: $24,018 (reported on 89.1% of returns)
Here:
$24,018
State:
$42,646
(% of AGI for various income ranges: 95.4% for AGIs below $10k, 90.2% for AGIs $10k-25k, 94.4% for AGIs $25k-50k, 91.2% for AGIs $50k-75k, 87.2% for AGIs $75k-100k, 57.1% for AGIs over 100k)
Taxable interest for individuals: $880 (reported on 18.8% of returns)
This zip code:
$880
Pennsylvania:
$1,657
(% of AGI for various income ranges: 0.9% for AGIs below $10k, 0.4% for AGIs $10k-25k, 0.5% for AGIs $25k-50k, 0.8% for AGIs $50k-75k, 1.5% for AGIs $75k-100k, 0.9% for AGIs over 100k)
Taxable dividends: $2,423 (reported on 9.1% of returns)
Here:
$2,423
State:
$3,566
(% of AGI for various income ranges: 1.1% for AGIs below $10k, 0.2% for AGIs $10k-25k, 0.4% for AGIs $25k-50k, 1.2% for AGIs $50k-75k, 0.8% for AGIs $75k-100k, 2.1% for AGIs over 100k)
Net capital gain/loss: +$5,783 (reported on 6.6% of returns)
Here:
+$5,783
State:
+$9,716
(% of AGI for various income ranges: -0.3% for AGIs below $10k, -0.0% for AGIs $10k-25k, 0.4% for AGIs $25k-50k, 0.2% for AGIs $50k-75k, 0.6% for AGIs $75k-100k, 6.5% for AGIs over 100k)
Profit/loss from business: +$6,085 (reported on 7.5% of returns)
Here:
+$6,085
State:
+$14,267
(% of AGI for various income ranges: 5.0% for AGIs below $10k, 2.8% for AGIs $10k-25k, 0.8% for AGIs $25k-50k, 0.7% for AGIs $50k-75k, 1.0% for AGIs $75k-100k, 2.3% for AGIs over 100k)
IRA payment deduction: $2,316 (reported on 1.1% of returns)
19104:
$2,316
Pennsylvania:
$2,903
(% of AGI for various income ranges: 0.1% for AGIs below $10k, 0.1% for AGIs $10k-25k, 0.1% for AGIs $25k-50k, 0.1% for AGIs $50k-75k, 0.1% for AGIs over 100k)
Self-employed pension: $8,900 (reported on 0.2% of returns)
Here:
$8,900
Pennsylvania:
$14,674
Total itemized deductions: $11,002 (21% of AGI, reported on 19.8% of returns)
Here:
$11,002
State:
$18,804
Here:
20.5% of AGI
State:
19.5% of AGI
(% of AGI for various income ranges: 6.9% for AGIs below $10k, 3.8% for AGIs $10k-25k, 7.9% for AGIs $25k-50k, 12.7% for AGIs $50k-75k, 14.0% for AGIs $75k-100k, 11.3% for AGIs over 100k)
Charity contributions deductions: $3,628 (5% of AGI, reported on 11.5% of returns)
Here:
$3,628
State:
$3,337
Here:
4.6% of AGI
State:
3.3% of AGI
(% of AGI for various income ranges: 0.2% for AGIs below $10k, 0.5% for AGIs $10k-25k, 1.9% for AGIs $25k-50k, 2.4% for AGIs $50k-75k, 2.8% for AGIs $75k-100k, 2.1% for AGIs over 100k)
Total tax: $3,655 (reported on 56.9% of returns)
19104:
$3,655
State:
$8,008
(% of AGI for various income ranges: 1.7% for AGIs below $10k, 3.8% for AGIs $10k-25k, 6.9% for AGIs $25k-50k, 10.9% for AGIs $50k-75k, 12.4% for AGIs $75k-100k, 14.2% for AGIs over 100k)
Earned income credit: $1,837 (reported on 30.2% of returns)
Here:
$1,837
State:
$1,643
Percentage of individuals using paid preparers for their 2004 taxes: 42.0%
Here:
42%
State:
56%
(% for various income ranges: 38.5% for AGIs below $10k, 45.3% for AGIs $10k-25k, 41.0% for AGIs $25k-50k, 39.6% for AGIs $50k-75k, 43.0% for AGIs $75k-100k, 58.2% for AGIs over 100k)
Likely homosexual households (counted as self-reported same-sex unmarried-partner households)
Lesbian couples: 0.2% of all households
Gay men: 0.1% of all households
Household received Food Stamps/SNAP in the past 12 months: 5,243 Household did not receive Food Stamps/SNAP in the past 12 months: 14,172
Women who had a birth in the past 12 months: 428 (177 now married, 224 unmarried) Women who did not have a birth in the past 12 months: 20,478 (1,882 now married, 18,813 unmarried)
Housing units in zip code 19104 with a mortgage: 1,724 (70 second mortgage, 67 both second mortgage and home equity loan) Houses without a mortgage: 22
Median monthly owner costs for units with a mortgage: $1,687 Median monthly owner costs for units without a mortgage: $467
Residents with income below the poverty level in 2022:
This zip code:
41.0%
Whole state:
11.8%
Residents with income below 50% of the poverty level in 2022:
This zip code:
12.7%
Whole state:
6.1%
Median number of rooms in houses and condos:
Here:
6.5
State:
6.8
Median number of rooms in apartments:
Here:
3.3
State:
4.3
Notable locations in this zip code not listed on our city pages
Notable locations in zip code 19104: One Drexel Plaza (A), 30th Street Station (B), 33rd Street Station (C), 34th Street Station (D), 36th Street Station (E), 37th Street Station (F), 40th Street Station (G), University City Station (H), Thirtieth Street Station (I), Alpha Chi Ro House (J), Alpha Epsilon Pi House (K), Alpha Pi Lambda House (L), Alpha Sigma Alpha House (M), Alumni Engineering Laboratory (N), Behrakis Grand Hall (O), Creese Student Union (P), Daskalakis Athletic Center (Q), Delta Sigma Phi House (R), Design Arts Annex (S), Disque Hall (T). Display/hide their locations on the map
Parks in zip code 19104 include: Bird Lake Picnic Area (1), Clark Park (2), Lee Park (3), Philadelphia Zoological Garden (4), Franklin Field (5). Display/hide their locations on the map
Tourist attraction (not listed on the city page) : A-1 Charter Bus Company Inc. (Tours & Charters; 1106 North 40th Street).
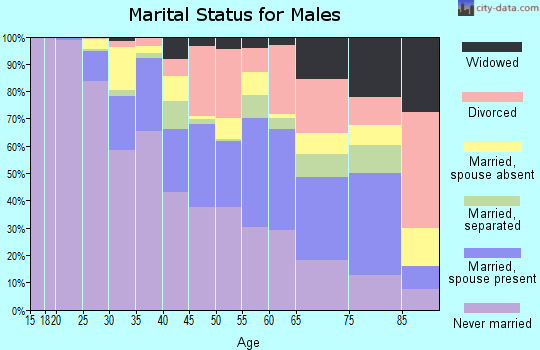
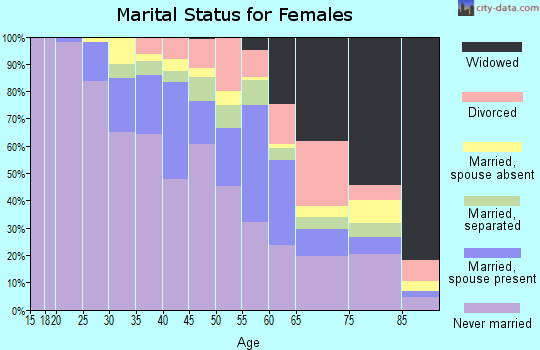
1,589 married couples with children.
3,786 single-parent households (168 men, 3,618 women).
76.9% of residents of 19104 zip code speak English at home.
3.7% of residents speak Spanish at home (79% very well, 19% well, 2% not well).
6.0% of residents speak other Indo-European language at home (80% very well, 15% well, 5% not well).
11.3% of residents speak Asian or Pacific Island language at home (68% very well, 23% well, 9% not well).
1.7% of residents speak other language at home (67% very well, 25% well, 7% not well, 1% not at all).
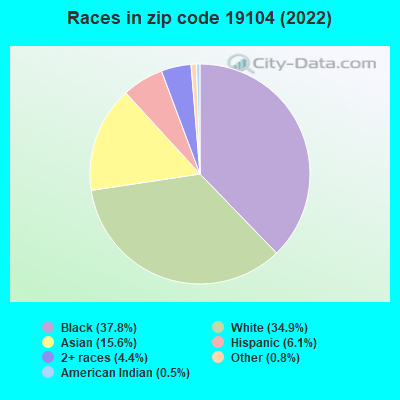
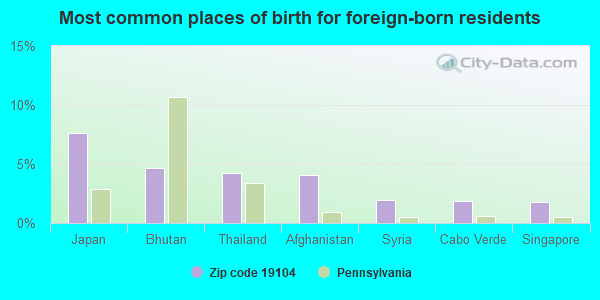
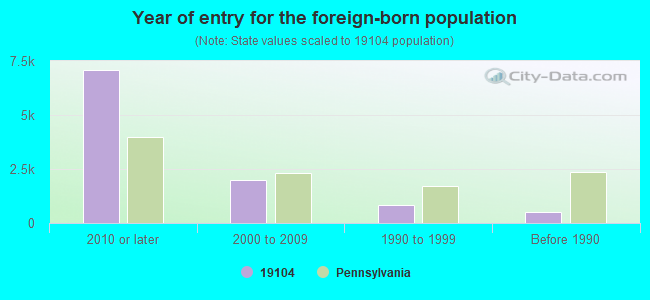
Foreign born population: 8,361 (15.6%) (28.7% of them are naturalized citizens)
Major facilities with environmental interests located in this zip code:
ATLANTIC 0363 1462 (1201 BELMONT AVE in PHILADELPHIA, PA)
STATE MASTER (Pennsylvania database) - RCRIS-PAD987281060, HAZARDOUS WASTE PROGRAM (Resource Conservation and Recovery Act (tracking hazardous waste)) Organizations: ATLANTIC REFINING & MARKETING CORPORATION (CONTACT/GENERAL)
, OPERNAME (CONTACT/OPERATOR)
Alternative names: ATLANTIC SVC STA
AMTRAK RAILROAD MW REPAIR (30TH & RACE STREETS PENN COACH YARD in PHILADELPHIA, PA)
COMPLIANCE ACTIVITY (Tracking inspections of insecticide, fungicide, and rodenticide, and toxic substances) (Resource Conservation and Recovery Act (tracking hazardous waste)) Organizations: OPERNAME (CONTACT/OPERATOR)
, AMTRAK RR (CONTACT/OWNER)
Alternative names: AMTRAK RAILROAD M/W REPAIR
ABP BRAN MEM INSTITUTE (3509 SPRING ARDEN ST in PHILADELPHIA, PA)
(Integrated Compliance Information System) - ICIS-03-1989-0856, FORMAL ENFORCEMENT ACTION COMPLIANCE ACTIVITY (Tracking inspections of insecticide, fungicide, and rodenticide, and toxic substances)
AMTRAK 30TH STREET (30TH & MARKET STREET STATION in PHILADELPHIA, PA)
SUPERFUND (Superfund database) (Integrated Compliance Information System) - ICIS-03-2000-0480, FORMAL ENFORCEMENT ACTION Business SIC classification: RAILROADS, LINE-HAUL OPERATING
BELMONT CS (4030 BROWN ST in PHILADELPHIA, PA)
(National Center for Education Statistics) - STATE ID-7750
BELMONT SCH ( in PHILADELPHIA, PA)
(National Center for Education Statistics) - STATE ID-3599 Organizations: PHILADELPHIA CITY SD (SCHOOL DISTRICT)
ALVINS FUEL SERVICE INC (4218 BROWN STREET in PHILADELPHIA, PA)
(Integrated Compliance Information System) - ICIS-03-1995-0114, FORMAL ENFORCEMENT ACTION Business SIC classification: FUEL OIL DEALERS
BACHEM BIOSCIENCE INC (3700 MARKET STREET in PHILADELPHIA, PA)
(Resource Conservation and Recovery Act (tracking hazardous waste)) Organizations: OPERNAME (CONTACT/OPERATOR)
, UNIVERSITY CITY SCIENCE CENTER (CONTACT/OWNER)
BELL TELEPHONE PA EVERGREEN 5 X BAR (3810 CHESTNUT ST in PHILADELPHIA, PA)
(Resource Conservation and Recovery Act (tracking hazardous waste)) Organizations: OPERNAME (CONTACT/OPERATOR)
, BELL OF PA (CONTACT/OWNER)
ALEXANDER WOODWORK (1529 PARRISH in PHILADELPHIA, PA)
AIR MINOR (AIRS/AFS) Business SIC classification: MILLWORK
AMTRAK/UNIV OF PENNA (MURPHY FIELD, EXT 41 in PHILADELPHIA, PA)
AIR MINOR (AIRS/AFS) AIR MAJOR ("Best Available" air pollution technologies tracking) Business SIC classification: ELECTRIC SERVICES Alternative names: AMTRAK UNIVersity OF PENNsylvaniA
ASHLAND CHEMICAL (DELA & BIGLER STS in PHILADELPHIA, PA)
AIR MINOR (AIRS/AFS) Business SIC classification: PLASTICS MATERIALS, SYNTHETIC RESINS, AND NONVULCANIZABLE ELASTOMERS
AMOCO SERVICE STATION (44 MARKET in PHILADELPHIA, PA)
Conditionally Exempt Small Quantity Generators, less than 100 kg/month of hazardous waste (Resource Conservation and Recovery Act (tracking hazardous waste)) - notification Organizations: OPERNAME (CONTACT/OPERATOR)
Housing units lacking complete plumbing facilities: 4.4% Housing units lacking complete kitchen facilities: 5.3%
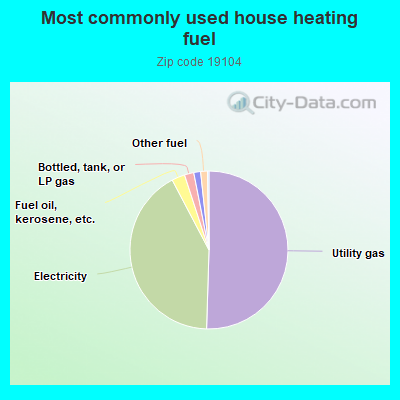
50.5%Utility gas
41.8%Electricity
2.7%Fuel oil, kerosene, etc.
1.9%Bottled, tank, or LP gas
1.4%No fuel used
1.4%Other fuel
Population in 1990: 51,295.
Place of birth for U.S.-born residents:
This state: 24,323
Northeast: 9,228
Midwest: 2,105
South: 6,317
West: 2,600
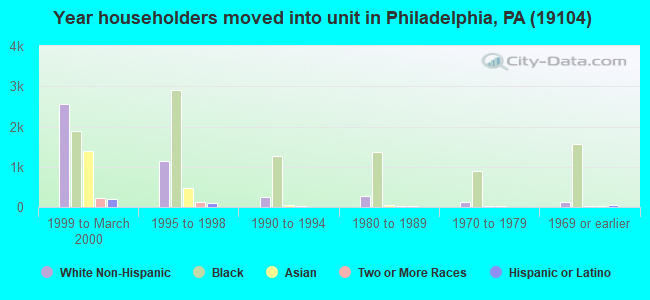
41% of the 19104 zip code residents lived in the same house 5 years ago. Out of people who lived in different houses, 36% lived in this county. Out of people who lived in different counties, 50% lived in Pennsylvania.
81% of the 19104 zip code residents lived in the same house 1 year ago. Out of people who lived in different houses, 50% moved from this county. Out of people who lived in different houses, 7% moved from different county within same state. Out of people who lived in different houses, 26% moved from different state. Out of people who lived in different houses, 16% moved from abroad.
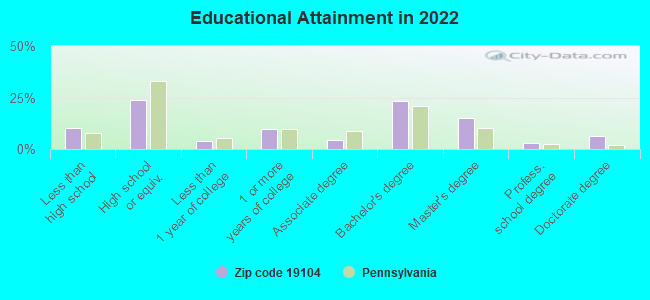
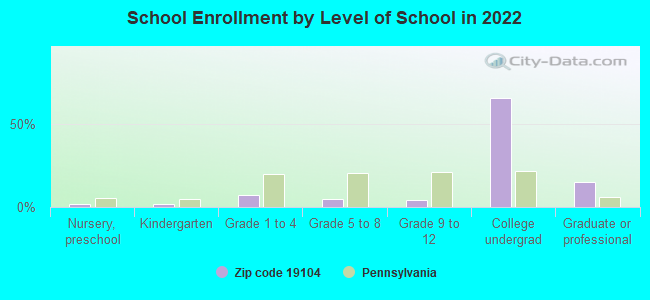
Private vs. public school enrollment:
Students in private schools in grades 1 to 8 (elementary and middle school): 461
Here:
13.2%
Pennsylvania:
15.7%
Students in private schools in grades 9 to 12 (high school): 194
Here:
16.5%
Pennsylvania:
13.4%
Students in private undergraduate colleges: 16,580
Here:
84.2%
Pennsylvania:
39.8%
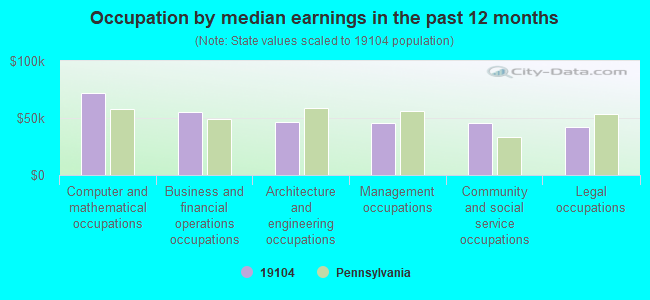
Occupation by median earnings in the past 12 months ($)
72,239Computer and mathematical occupations
55,366Business and financial operations occupations
46,378Architecture and engineering occupations
45,839Management occupations
45,555Community and social service occupations
42,247Legal occupations
Companies with biggest federal contracts located in this zip code:
UNIVERSITY OF PENNSYLVANIA (211 COLLEGE HL in PHILADELPHIA, PA) : $1,979,172 in 6 contractsfrom 2000 to 2006
Contracts for Biomedical -- Basic Research (R&D), Tuition, Registration, and Membership Fees by National Institutes of Health, Bureau of Prisoners/Federal Prison System Signed by year:2000: $865,000; 2001: $1,203,000; 2002: $0; 2003: -$88,928; 2004: $0; 2005: $0; 2006: $100.
Biggest contracts:
$751,000 with National Institutes of Health for Biomedical -- Basic Research (R&D). Signed on 2001-03-15. Completion date: 2003-12-15.
$646,000, same as above.Signed on 2000-06-27. Completion date: 2002-09-29.
$452,000, same as above.Signed on 2001-09-18. Completion date: 2002-09-29.
$219,000, same as above.Signed on 2000-09-21. Completion date: 2002-09-29.
University of Pennsylvania Health S (One Silverstein in Philadelphia, PA)
$1,914,570 with Department of Veterans Affairs for Services -- Management and Support (R&D). Signed on 2005-08-17. Completion date: 2007-06-30.
PENNONI ASSOCIATES INC (3001 MARKET STREET in PHILADELPHIA, PA) : $1,858,924 in 74 contractsfrom 2000 to 2006
Contracts for Architect - Engineer Services (including landscaping, interior layout, and designing), Other Non-Building Structures, Maintenance, Repair or Alteration of Real Property -- Other Administrative Facilities and Service Buildings, Other Architect and Engineering Services, and moreby Army, U.S. Army Corps of Engineers - civil program financing only, Navy, United States Coast Guard (disused code: now 7008), and others Signed by year:2000: $470,840; 2001: $85,957; 2002: $2,290; 2003: $150,892; 2004: $33,309; 2005: $712,032; 2006: $403,604.
Biggest contracts:
$154,500 with Army for Architect - Engineer Services (including landscaping, interior layout, and designing). Taking place in MD. Signed on 2006-05-31. Completion date: 2007-03-30.
$152,000, same as above.Signed on 2006-05-03. Completion date: 2006-11-03.
$148,000 with Army for Architect - Engineer Services (including landscaping, interior layout, and designing). Signed on 2005-05-26. Completion date: 2006-03-24.
$148,000 with U.S. Army Corps of Engineers - civil program financing only for Architect - Engineer Services (including landscaping, interior layout, and designing). Signed on 2005-05-26. Completion date: 2006-03-24.
PHOTONICS LABORATORIES, INC (3401 MARKET STREET in PHILADELPHIA, PA; small business) : $1,460,920 in 7 contractsfrom 2000 to 2002
Contracts for Services -- Basic Research (R&D), Textiles, Clothing and Equipage -- Basic Research (R&D), Defense Missile and Space Systems -- Advanced Development (R&D) by Army Signed by year:2000: $396,500; 2001: $739,080; 2002: $325,340; 2003: $0; 2004: $0; 2005: $0; 2006: $0.
Biggest contracts:
$331,500 with Army for Services -- Basic Research (R&D). Signed on 2000-11-09. Completion date: 2002-11-08.
$328,500, same as above.Signed on 2001-10-17. Completion date: 2002-11-08.
$230,960 with Army for Textiles, Clothing and Equipage -- Basic Research (R&D). Signed on 2001-08-21. Completion date: 2002-08-26.
$180,000 with Army for Defense Missile and Space Systems -- Advanced Development (R&D). Signed on 2002-10-04. Completion date: 2003-08-11.
INFRASCAN, INC (3508 MARKET ST STE 215 in PHILADELPHIA, PA; small business) : $420,190 in 2 contractsin 2005
$320,190 with Navy for Other Defense -- Operational Systems Development (R&D). Signed on 2005-09-30. Completion date: 2007-09-29.
$100,000 with Army for Other Medical -- Basic Research (R&D). Signed on 2005-01-10. Completion date: 2005-07-13.
MONELL CHEMICAL SENSES CENTER (3500MARKET ST in PHILADELPHIA, PA)
$250,000 with Department of Defense for Other Defense -- Advanced Development (R&D). Signed on 2001-11-20. Completion date: 2002-11-19.
PALINET & UNION LIBRARY CATALO (3000 MARKET ST STE 200 in PHILADELPHIA, PA) : $156,383 in 12 contractsfrom 1999 to 2006
Contracts for Information Retrieval, Newspapers and Periodicals, Automated News Services, Data Services, or Other Information Services. Buying data, the electronic equivalent of books, periodicals, newspapers, etc., Training Aids, and moreby Department of Defense, Navy, Uniformed Services University of the Health Sciences, Centers for Disease Control and Prevention, and others Signed by year:2000: $0; 2001: $70,938; 2002: $0; 2003: $0; 2004: $2,700; 2005: $33,183; 2006: $15,501.
Biggest contracts:
$37,035 with Department of Defense for Information Retrieval. Signed on 2001-01-01. Completion date: 2001-12-31.
$34,061 with Department of Defense for Newspapers and Periodicals. Signed on 1999-11-18. Completion date: 2000-12-31.
$33,903 with Navy for Automated News Services, Data Services, or Other Information Services. Buying data, the electronic equivalent of books, periodicals, newspapers, etc.. Taking place in MD. Signed on 2001-11-29. Completion date: 2001-11-29.
$22,016, same as above.Signed on 2005-06-20. Completion date: 2005-07-28.
CHAMELEON OPTICS INC (3401 MARKET ST in PHILADELPHIA, PA; small business) : $140,000 in 2 contractsfrom 2002 to 2004
$70,000 with Army for Other Defense -- Management and Support (R&D). Signed on 2004-12-10. Completion date: 2005-06-13.
$70,000 with Army for Defense Missile and Space Systems -- Advanced Development (R&D). Signed on 2002-05-15. Completion date: 2002-11-15.
NATIONAL BD OF MED EXAMINERS (3750 MARKET ST in PHILADELPHIA, PA; small business) : $138,251 in 3 contractsfrom 1999 to 2002
$64,480 with Department of Defense for Other Education and Training Services. Signed on 2002-05-21. Completion date: 2002-10-31.
$44,000 with Department of Defense for Certifications and Accreditations for Educational Institutions. Signed on 1999-10-01. Completion date: 2000-09-30.
$29,771 with Department of Defense for Other Education and Training Services. Signed on 2002-01-31. Completion date: 2002-11-15.
NIM INC (3508 MARKET ST, STE 215 in PHILADELPHIA, PA; small business)
$99,992 with Navy for Other Defense -- Operational Systems Development (R&D). Signed on 2004-05-20. Completion date: 2004-11-23.
Top industries in this zip code by the number of employees in 2005:
Health Care and Social Assistance: General Medical and Surgical Hospitals (over 1000 employees: 4 establishments)
Educational Services: Colleges, Universities, and Professional Schools (over 1000: 3, 1-4: 1)
Administrative and Support and Waste Management and Remediation Services: Janitorial Services (250-499: 1, 100-249: 2, 50-99: 1, 10-19: 1, 5-9: 1, 1-4: 3)
Professional, Scientific, and Technical Services: Offices of Lawyers (500-999: 1, 5-9: 1, 1-4: 3)
Professional, Scientific, and Technical Services: Research and Development in the Physical, Engineering, and Life Sciences (250-499: 1, 100-249: 1, 50-99: 1, 20-49: 2, 10-19: 1, 5-9: 3, 1-4: 18)
Information: Directory and Mailing List Publishers (500-999: 1)
People in group quarters in 2010:
12,466 people in college/university student housing
630 people in nursing facilities/skilled-nursing facilities
286 people in emergency and transitional shelters (with sleeping facilities) for people experiencing homelessness
221 people in group homes intended for adults
187 people in other noninstitutional facilities
129 people in correctional facilities intended for juveniles
92 people in residential treatment centers for adults
57 people in residential schools for people with disabilities
51 people in workers' group living quarters and job corps centers
18 people in group homes for juveniles (non-correctional)
People in group quarters in 2000:
10,816 people in college dormitories (includes college quarters off campus)
472 people in nursing homes
392 people in other noninstitutional group quarters
266 people in other group homes
200 people in homes or halfway houses for drug/alcohol abuse
146 people in local jails and other confinement facilities (including police lockups)
102 people in homes for the mentally ill
76 people in homes for the mentally retarded
49 people in religious group quarters
26 people in job corps and vocational training facilities
26 people in other nonhousehold living situations
8 people in mental (psychiatric) hospitals or wards
Fatal accident statistics in 2014:
Fatal accident count: 2
Vehicles involved in fatal accidents: 3
Fatal accidents caused by drunken drivers: 0
Fatalities: 3
Persons involved in fatal accidents: 3
Pedestrians involved in fatal accidents: 1
Fatal accident statistics in 2013:
Fatal accident count: 5
Vehicles involved in fatal accidents: 9
Fatal accidents caused by drunken drivers: 1
Fatalities: 5
Persons involved in fatal accidents: 9
Pedestrians involved in fatal accidents: 1
Home Mortgage Disclosure Act Aggregated Statistics For Year 2009 (Based on 12 full and 8 partial tracts)
A) FHA, FSA/RHS & VA Home Purchase Loans
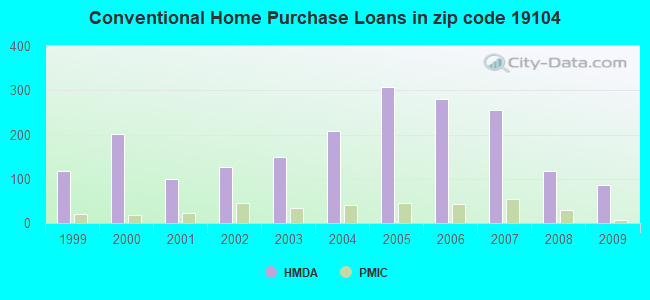
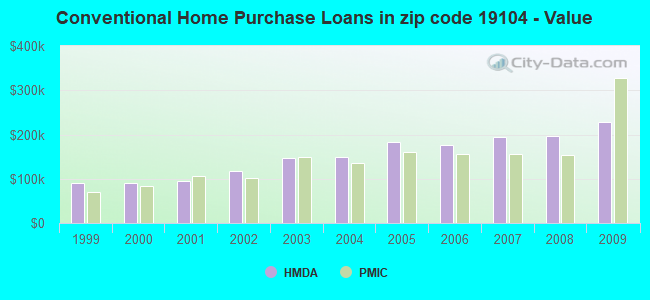
B) Conventional Home Purchase Loans
C) Refinancings
D) Home Improvement Loans
E) Loans on Dwellings For 5+ Families
F) Non-occupant Loans on < 5 Family Dwellings (A B C & D)
G) Loans On Manufactured Home Dwelling (A B C & D)
Number
Average Value
Number
Average Value
Number
Average Value
Number
Average Value
Number
Average Value
Number
Average Value
Number
Average Value
LOANS ORIGINATED
19
$156,996
87
$228,074
233
$215,394
41
$115,171
12
$688,191
106
$219,649
0
$0
APPLICATIONS APPROVED, NOT ACCEPTED
4
$98,250
7
$256,201
23
$162,870
7
$29,547
0
$0
8
$193,526
0
$0
APPLICATIONS DENIED
15
$134,673
34
$110,696
173
$174,723
94
$39,027
1
$1,150,000
60
$149,812
2
$93,535
APPLICATIONS WITHDRAWN
5
$99,514
12
$236,893
84
$226,351
14
$46,861
1
$1,000,000
9
$132,333
0
$0
FILES CLOSED FOR INCOMPLETENESS
0
$0
6
$176,900
24
$199,442
0
$0
0
$0
5
$78,502
0
$0
Aggregated Statistics For Year 2008 (Based on 12 full and 8 partial tracts)
A) FHA, FSA/RHS & VA Home Purchase Loans
B) Conventional Home Purchase Loans
C) Refinancings
D) Home Improvement Loans
E) Loans on Dwellings For 5+ Families
F) Non-occupant Loans on < 5 Family Dwellings (A B C & D)
G) Loans On Manufactured Home Dwelling (A B C & D)
Number
Average Value
Number
Average Value
Number
Average Value
Number
Average Value
Number
Average Value
Number
Average Value
Number
Average Value
LOANS ORIGINATED
34
$143,661
117
$197,062
196
$170,499
89
$41,369
16
$1,395,398
139
$156,965
0
$0
APPLICATIONS APPROVED, NOT ACCEPTED
11
$94,878
26
$205,737
54
$139,917
20
$60,546
2
$353,435
36
$184,807
0
$0
APPLICATIONS DENIED
4
$164,500
57
$163,954
217
$127,551
171
$39,743
12
$803,085
107
$119,534
2
$67,000
APPLICATIONS WITHDRAWN
7
$78,137
23
$217,735
88
$167,902
10
$60,178
1
$1,600,000
41
$176,813
0
$0
FILES CLOSED FOR INCOMPLETENESS
2
$105,990
12
$154,628
24
$109,757
1
$30,000
0
$0
3
$78,637
0
$0
Aggregated Statistics For Year 2007 (Based on 12 full and 8 partial tracts)
A) FHA, FSA/RHS & VA Home Purchase Loans
B) Conventional Home Purchase Loans
C) Refinancings
D) Home Improvement Loans
E) Loans on Dwellings For 5+ Families
F) Non-occupant Loans on < 5 Family Dwellings (A B C & D)
G) Loans On Manufactured Home Dwelling (A B C & D)
Number
Average Value
Number
Average Value
Number
Average Value
Number
Average Value
Number
Average Value
Number
Average Value
Number
Average Value
LOANS ORIGINATED
8
$92,514
256
$195,197
301
$128,718
96
$48,713
38
$719,242
231
$138,601
0
$0
APPLICATIONS APPROVED, NOT ACCEPTED
0
$0
57
$226,031
100
$113,564
38
$49,134
0
$0
64
$163,072
0
$0
APPLICATIONS DENIED
6
$94,855
122
$133,209
467
$107,342
253
$41,208
8
$299,896
219
$109,985
1
$5,230
APPLICATIONS WITHDRAWN
4
$130,762
54
$185,911
180
$122,873
19
$99,596
4
$535,750
62
$156,611
0
$0
FILES CLOSED FOR INCOMPLETENESS
0
$0
18
$158,290
28
$137,672
2
$49,500
0
$0
16
$202,284
0
$0
Aggregated Statistics For Year 2006 (Based on 12 full and 10 partial tracts)
A) FHA, FSA/RHS & VA Home Purchase Loans
B) Conventional Home Purchase Loans
C) Refinancings
D) Home Improvement Loans
E) Loans on Dwellings For 5+ Families
F) Non-occupant Loans on < 5 Family Dwellings (A B C & D)
G) Loans On Manufactured Home Dwelling (A B C & D)
Number
Average Value
Number
Average Value
Number
Average Value
Number
Average Value
Number
Average Value
Number
Average Value
Number
Average Value
LOANS ORIGINATED
13
$124,422
280
$177,292
338
$124,770
121
$58,789
51
$936,179
260
$139,839
1
$55,000
APPLICATIONS APPROVED, NOT ACCEPTED
1
$64,850
70
$135,731
92
$89,349
28
$58,881
3
$91,657
60
$134,849
1
$26,000
APPLICATIONS DENIED
2
$87,745
128
$119,545
450
$94,903
220
$41,199
10
$253,924
172
$98,057
3
$88,140
APPLICATIONS WITHDRAWN
2
$95,145
81
$159,430
174
$104,682
14
$56,799
4
$170,728
47
$135,047
0
$0
FILES CLOSED FOR INCOMPLETENESS
0
$0
16
$127,038
40
$146,727
0
$0
0
$0
20
$160,994
0
$0
Aggregated Statistics For Year 2005 (Based on 12 full and 8 partial tracts)
A) FHA, FSA/RHS & VA Home Purchase Loans
B) Conventional Home Purchase Loans
C) Refinancings
D) Home Improvement Loans
E) Loans on Dwellings For 5+ Families
F) Non-occupant Loans on < 5 Family Dwellings (A B C & D)
G) Loans On Manufactured Home Dwelling (A B C & D)
Number
Average Value
Number
Average Value
Number
Average Value
Number
Average Value
Number
Average Value
Number
Average Value
Number
Average Value
LOANS ORIGINATED
17
$86,911
307
$183,184
355
$139,581
173
$43,886
32
$748,373
240
$160,349
5
$110,846
APPLICATIONS APPROVED, NOT ACCEPTED
2
$83,275
64
$130,485
115
$109,748
29
$65,998
3
$1,028,353
52
$157,293
0
$0
APPLICATIONS DENIED
3
$82,810
145
$116,654
427
$87,850
289
$18,690
6
$218,918
185
$72,492
4
$37,880
APPLICATIONS WITHDRAWN
2
$87,655
99
$147,050
212
$103,313
29
$55,839
2
$502,500
68
$133,374
1
$75,000
FILES CLOSED FOR INCOMPLETENESS
0
$0
16
$113,093
64
$131,272
9
$34,327
3
$465,077
13
$170,234
0
$0
Aggregated Statistics For Year 2004 (Based on 12 full and 10 partial tracts)
A) FHA, FSA/RHS & VA Home Purchase Loans
B) Conventional Home Purchase Loans
C) Refinancings
D) Home Improvement Loans
E) Loans on Dwellings For 5+ Families
F) Non-occupant Loans on < 5 Family Dwellings (A B C & D)
G) Loans On Manufactured Home Dwelling (A B C & D)
Number
Average Value
Number
Average Value
Number
Average Value
Number
Average Value
Number
Average Value
Number
Average Value
Number
Average Value
LOANS ORIGINATED
5
$105,408
208
$149,892
305
$135,273
86
$47,022
41
$831,211
208
$136,845
1
$15,000
APPLICATIONS APPROVED, NOT ACCEPTED
7
$88,369
47
$149,773
118
$95,044
33
$51,175
2
$99,990
57
$135,472
0
$0
APPLICATIONS DENIED
0
$0
83
$108,127
404
$85,895
219
$23,408
5
$488,538
140
$74,393
3
$34,997
APPLICATIONS WITHDRAWN
3
$105,247
44
$163,833
166
$97,935
20
$45,249
10
$1,320,008
37
$83,063
3
$132,490
FILES CLOSED FOR INCOMPLETENESS
1
$37,000
17
$100,573
55
$100,711
8
$45,124
0
$0
15
$118,219
0
$0
Aggregated Statistics For Year 2003 (Based on 12 full and 10 partial tracts)
A) FHA, FSA/RHS & VA Home Purchase Loans
B) Conventional Home Purchase Loans
C) Refinancings
D) Home Improvement Loans
E) Loans on Dwellings For 5+ Families
F) Non-occupant Loans on < 5 Family Dwellings (A B C & D)
Number
Average Value
Number
Average Value
Number
Average Value
Number
Average Value
Number
Average Value
Number
Average Value
LOANS ORIGINATED
10
$94,192
149
$147,714
435
$122,355
79
$38,700
18
$4,535,543
179
$128,816
APPLICATIONS APPROVED, NOT ACCEPTED
3
$113,507
34
$131,342
118
$79,899
35
$41,955
3
$220,563
36
$93,444
APPLICATIONS DENIED
2
$53,000
64
$103,537
367
$72,387
185
$18,190
3
$843,657
104
$77,229
APPLICATIONS WITHDRAWN
3
$43,997
35
$122,530
109
$88,308
9
$21,666
2
$299,520
30
$92,623
FILES CLOSED FOR INCOMPLETENESS
3
$148,160
18
$121,886
47
$85,830
9
$55,573
0
$0
16
$106,343
Aggregated Statistics For Year 2002 (Based on 12 full and 8 partial tracts)
A) FHA, FSA/RHS & VA Home Purchase Loans
B) Conventional Home Purchase Loans
C) Refinancings
D) Home Improvement Loans
E) Loans on Dwellings For 5+ Families
F) Non-occupant Loans on < 5 Family Dwellings (A B C & D)
Number
Average Value
Number
Average Value
Number
Average Value
Number
Average Value
Number
Average Value
Number
Average Value
LOANS ORIGINATED
17
$74,524
127
$117,485
255
$203,853
32
$32,307
24
$391,860
117
$128,480
APPLICATIONS APPROVED, NOT ACCEPTED
2
$174,720
16
$94,216
113
$61,603
16
$22,667
9
$345,934
28
$77,060
APPLICATIONS DENIED
2
$48,130
31
$83,387
345
$166,298
101
$22,398
5
$564,400
52
$68,859
APPLICATIONS WITHDRAWN
1
$32,430
13
$113,271
114
$73,047
2
$30,000
0
$0
16
$100,132
FILES CLOSED FOR INCOMPLETENESS
0
$0
1
$244,870
37
$65,781
5
$30,574
0
$0
8
$70,784
Aggregated Statistics For Year 2001 (Based on 12 full and 10 partial tracts)
A) FHA, FSA/RHS & VA Home Purchase Loans
B) Conventional Home Purchase Loans
C) Refinancings
D) Home Improvement Loans
E) Loans on Dwellings For 5+ Families
F) Non-occupant Loans on < 5 Family Dwellings (A B C & D)
Number
Average Value
Number
Average Value
Number
Average Value
Number
Average Value
Number
Average Value
Number
Average Value
LOANS ORIGINATED
13
$74,588
100
$95,793
223
$75,637
70
$32,480
16
$1,143,874
83
$83,371
APPLICATIONS APPROVED, NOT ACCEPTED
5
$64,124
31
$49,448
127
$47,271
19
$25,962
2
$135,245
31
$60,729
APPLICATIONS DENIED
4
$59,250
45
$61,244
319
$45,827
183
$21,566
7
$527,783
76
$48,939
APPLICATIONS WITHDRAWN
0
$0
19
$100,157
120
$60,449
22
$21,244
1
$225,000
21
$63,739
FILES CLOSED FOR INCOMPLETENESS
2
$34,000
7
$68,427
27
$81,124
0
$0
1
$200,000
6
$102,677
Aggregated Statistics For Year 2000 (Based on 12 full and 8 partial tracts)
A) FHA, FSA/RHS & VA Home Purchase Loans
B) Conventional Home Purchase Loans
C) Refinancings
D) Home Improvement Loans
E) Loans on Dwellings For 5+ Families
F) Non-occupant Loans on < 5 Family Dwellings (A B C & D)
Number
Average Value
Number
Average Value
Number
Average Value
Number
Average Value
Number
Average Value
Number
Average Value
LOANS ORIGINATED
24
$44,481
202
$90,587
163
$45,751
78
$16,724
24
$263,519
124
$80,948
APPLICATIONS APPROVED, NOT ACCEPTED
4
$69,685
28
$56,549
73
$52,224
40
$16,168
0
$0
15
$40,438
APPLICATIONS DENIED
0
$0
78
$57,071
282
$40,243
203
$15,312
6
$209,997
56
$56,003
APPLICATIONS WITHDRAWN
7
$69,421
48
$69,418
176
$37,064
28
$18,372
1
$92,000
33
$41,561
FILES CLOSED FOR INCOMPLETENESS
2
$39,995
20
$75,672
36
$41,940
1
$10,000
0
$0
5
$43,800
Aggregated Statistics For Year 1999 (Based on 11 full and 4 partial tracts)
A) FHA, FSA/RHS & VA Home Purchase Loans
B) Conventional Home Purchase Loans
C) Refinancings
D) Home Improvement Loans
E) Loans on Dwellings For 5+ Families
F) Non-occupant Loans on < 5 Family Dwellings (A B C & D)
2010 - 2018 National Fire Incident Reporting System (NFIRS) incidents
According to the data from the years 2010 - 2018 the average number of fire incidents per year is 219. The highest number of reported fire incidents - 377 took place in 2018, and the least - 0 in 2016. The data has an increasing trend.
When looking into fire subcategories, the most incidents belonged to: Structure Fires (54.0%), and Outside Fires (30.0%).
Fire incident types reported to NFIRS in Zip Code 19104


 Nearest zip codes: 19146, 19130, 19103, 19139, 19121, 19143.


 According to the data from the years 2010 - 2018 the average number of fire incidents per year is 219. The highest number of reported fire incidents - 377 took place in 2018, and the least - 0 in 2016. The data has an increasing trend.
 When looking into fire subcategories, the most incidents belonged to: Structure Fires (54.0%), and Outside Fires (30.0%).