Estimated zip code population in 2022: 30,239
Zip code population in 2010: 24,870
Zip code population in 2000: 22,874
Houses and condos: 17,914
Renter-occupied apartments: 10,129
% of renters here:
62%State:
31%
March 2022 cost of living index in zip code 19130: 107.5
(more than average, U.S. average is 100)
Land area: 1.3
sq. mi.
Water area: 0.1
sq. mi.
Population density: 23,361 people per square mile (very high).
OSM Map
General Map
Google Map
MSN Map
OSM Map
General Map
Google Map
MSN Map
OSM Map
General Map
Google Map
MSN Map
OSM Map
General Map
Google Map
MSN Map
Please wait while loading the map...
Real estate property taxes paid for housing units in 2022:
This zip code:
0.9% ($4,418)Pennsylvania:
1.3% ($3,094)
Median real estate property taxes paid for housing units with mortgages in 2022: $4,280 (0.8%)
Median real estate property taxes paid for housing units with no mortgage in 2022: $4,761 (0.8%)
Profiles of local businesses
Business Search - 14 Million verified businesses
Males: 14,377 Females: 15,862
For population 25 years and over in 19130:
High school or higher: 100.8%Bachelor's degree or higher: 80.5%Graduate or professional degree: 40.9%Unemployed: 3.1%Mean travel time to work (commute): 29.3 minutes
For population 15 years and over in 19130:
Never married: 51.3%Now married: 38.1%Separated: 0.8%Widowed: 3.4%Divorced: 6.4%
Zip code 19130 compared to state average:
Median house value above state average. Median age below state average. Foreign-born population percentage above state average. Renting percentage above state average. Number of rooms per house significantly below state average. Percentage of population with a bachelor's degree or higher significantly above state average. 20,465 67.7% White 4,326 14.3% Black 2,151 7.1% Hispanic or Latino 1,966 6.5% Asian 1,103 3.6% Two or more races 212 0.7% Some other race 13 0.04% American Indian
Data:
Median household income ($)
Median household income (% change since 2000)
Household income diversity
Ratio of average income to average house value (%)
Ratio of average income to average rent
Median household income ($) - White
Median household income ($) - Black or African American
Median household income ($) - Asian
Median household income ($) - Hispanic or Latino
Median household income ($) - American Indian and Alaska Native
Median household income ($) - Multirace
Median household income ($) - Other Race
Median household income for houses/condos with a mortgage ($)
Median household income for apartments without a mortgage ($)
Races - White alone (%)
Races - White alone (% change since 2000)
Races - Black alone (%)
Races - Black alone (% change since 2000)
Races - American Indian alone (%)
Races - American Indian alone (% change since 2000)
Races - Asian alone (%)
Races - Asian alone (% change since 2000)
Races - Hispanic (%)
Races - Hispanic (% change since 2000)
Races - Native Hawaiian and Other Pacific Islander alone (%)
Races - Native Hawaiian and Other Pacific Islander alone (% change since 2000)
Races - Two or more races (%)
Races - Two or more races (% change since 2000)
Races - Other race alone (%)
Races - Other race alone (% change since 2000)
Racial diversity
Unemployment (%)
Unemployment (% change since 2000)
Unemployment (%) - White
Unemployment (%) - Black or African American
Unemployment (%) - Asian
Unemployment (%) - Hispanic or Latino
Unemployment (%) - American Indian and Alaska Native
Unemployment (%) - Multirace
Unemployment (%) - Other Race
Population density (people per square mile)
Population - Males (%)
Population - Females (%)
Population - Males (%) - White
Population - Males (%) - Black or African American
Population - Males (%) - Asian
Population - Males (%) - Hispanic or Latino
Population - Males (%) - American Indian and Alaska Native
Population - Males (%) - Multirace
Population - Males (%) - Other Race
Population - Females (%) - White
Population - Females (%) - Black or African American
Population - Females (%) - Asian
Population - Females (%) - Hispanic or Latino
Population - Females (%) - American Indian and Alaska Native
Population - Females (%) - Multirace
Population - Females (%) - Other Race
Coronavirus confirmed cases (Apr 27, 2024)
Deaths caused by coronavirus (Apr 27, 2024)
Coronavirus confirmed cases (per 100k population) (Apr 27, 2024)
Deaths caused by coronavirus (per 100k population) (Apr 27, 2024)
Daily increase in number of cases (Apr 27, 2024)
Weekly increase in number of cases (Apr 27, 2024)
Cases doubled (in days) (Apr 27, 2024)
Hospitalized patients (Apr 18, 2022)
Negative test results (Apr 18, 2022)
Total test results (Apr 18, 2022)
COVID Vaccine doses distributed (per 100k population) (Sep 19, 2023)
COVID Vaccine doses administered (per 100k population) (Sep 19, 2023)
COVID Vaccine doses distributed (Sep 19, 2023)
COVID Vaccine doses administered (Sep 19, 2023)
Likely homosexual households (%)
Likely homosexual households (% change since 2000)
Likely homosexual households - Lesbian couples (%)
Likely homosexual households - Lesbian couples (% change since 2000)
Likely homosexual households - Gay men (%)
Likely homosexual households - Gay men (% change since 2000)
Cost of living index
Median gross rent ($)
Median contract rent ($)
Median monthly housing costs ($)
Median house or condo value ($)
Median house or condo value ($ change since 2000)
Mean house or condo value by units in structure - 1, detached ($)
Mean house or condo value by units in structure - 1, attached ($)
Mean house or condo value by units in structure - 2 ($)
Mean house or condo value by units in structure by units in structure - 3 or 4 ($)
Mean house or condo value by units in structure - 5 or more ($)
Mean house or condo value by units in structure - Boat, RV, van, etc. ($)
Mean house or condo value by units in structure - Mobile home ($)
Median house or condo value ($) - White
Median house or condo value ($) - Black or African American
Median house or condo value ($) - Asian
Median house or condo value ($) - Hispanic or Latino
Median house or condo value ($) - American Indian and Alaska Native
Median house or condo value ($) - Multirace
Median house or condo value ($) - Other Race
Median resident age
Resident age diversity
Median resident age - Males
Median resident age - Females
Median resident age - White
Median resident age - Black or African American
Median resident age - Asian
Median resident age - Hispanic or Latino
Median resident age - American Indian and Alaska Native
Median resident age - Multirace
Median resident age - Other Race
Median resident age - Males - White
Median resident age - Males - Black or African American
Median resident age - Males - Asian
Median resident age - Males - Hispanic or Latino
Median resident age - Males - American Indian and Alaska Native
Median resident age - Males - Multirace
Median resident age - Males - Other Race
Median resident age - Females - White
Median resident age - Females - Black or African American
Median resident age - Females - Asian
Median resident age - Females - Hispanic or Latino
Median resident age - Females - American Indian and Alaska Native
Median resident age - Females - Multirace
Median resident age - Females - Other Race
Commute - mean travel time to work (minutes)
Travel time to work - Less than 5 minutes (%)
Travel time to work - Less than 5 minutes (% change since 2000)
Travel time to work - 5 to 9 minutes (%)
Travel time to work - 5 to 9 minutes (% change since 2000)
Travel time to work - 10 to 19 minutes (%)
Travel time to work - 10 to 19 minutes (% change since 2000)
Travel time to work - 20 to 29 minutes (%)
Travel time to work - 20 to 29 minutes (% change since 2000)
Travel time to work - 30 to 39 minutes (%)
Travel time to work - 30 to 39 minutes (% change since 2000)
Travel time to work - 40 to 59 minutes (%)
Travel time to work - 40 to 59 minutes (% change since 2000)
Travel time to work - 60 to 89 minutes (%)
Travel time to work - 60 to 89 minutes (% change since 2000)
Travel time to work - 90 or more minutes (%)
Travel time to work - 90 or more minutes (% change since 2000)
Marital status - Never married (%)
Marital status - Now married (%)
Marital status - Separated (%)
Marital status - Widowed (%)
Marital status - Divorced (%)
Median family income ($)
Median family income (% change since 2000)
Median non-family income ($)
Median non-family income (% change since 2000)
Median per capita income ($)
Median per capita income (% change since 2000)
Median family income ($) - White
Median family income ($) - Black or African American
Median family income ($) - Asian
Median family income ($) - Hispanic or Latino
Median family income ($) - American Indian and Alaska Native
Median family income ($) - Multirace
Median family income ($) - Other Race
Median year house/condo built
Median year apartment built
Year house built - Built 2005 or later (%)
Year house built - Built 2000 to 2004 (%)
Year house built - Built 1990 to 1999 (%)
Year house built - Built 1980 to 1989 (%)
Year house built - Built 1970 to 1979 (%)
Year house built - Built 1960 to 1969 (%)
Year house built - Built 1950 to 1959 (%)
Year house built - Built 1940 to 1949 (%)
Year house built - Built 1939 or earlier (%)
Average household size
Household density (households per square mile)
Average household size - White
Average household size - Black or African American
Average household size - Asian
Average household size - Hispanic or Latino
Average household size - American Indian and Alaska Native
Average household size - Multirace
Average household size - Other Race
Occupied housing units (%)
Vacant housing units (%)
Owner occupied housing units (%)
Renter occupied housing units (%)
Vacancy status - For rent (%)
Vacancy status - For sale only (%)
Vacancy status - Rented or sold, not occupied (%)
Vacancy status - For seasonal, recreational, or occasional use (%)
Vacancy status - For migrant workers (%)
Vacancy status - Other vacant (%)
Residents with income below the poverty level (%)
Residents with income below 50% of the poverty level (%)
Children below poverty level (%)
Poor families by family type - Married-couple family (%)
Poor families by family type - Male, no wife present (%)
Poor families by family type - Female, no husband present (%)
Poverty status for native-born residents (%)
Poverty status for foreign-born residents (%)
Poverty among high school graduates not in families (%)
Poverty among people who did not graduate high school not in families (%)
Residents with income below the poverty level (%) - White
Residents with income below the poverty level (%) - Black or African American
Residents with income below the poverty level (%) - Asian
Residents with income below the poverty level (%) - Hispanic or Latino
Residents with income below the poverty level (%) - American Indian and Alaska Native
Residents with income below the poverty level (%) - Multirace
Residents with income below the poverty level (%) - Other Race
Air pollution - Air Quality Index (AQI)
Air pollution - CO
Air pollution - NO2
Air pollution - SO2
Air pollution - Ozone
Air pollution - PM10
Air pollution - PM25
Air pollution - Pb
Crime - Murders per 100,000 population
Crime - Rapes per 100,000 population
Crime - Robberies per 100,000 population
Crime - Assaults per 100,000 population
Crime - Burglaries per 100,000 population
Crime - Thefts per 100,000 population
Crime - Auto thefts per 100,000 population
Crime - Arson per 100,000 population
Crime - City-data.com crime index
Crime - Violent crime index
Crime - Property crime index
Crime - Murders per 100,000 population (5 year average)
Crime - Rapes per 100,000 population (5 year average)
Crime - Robberies per 100,000 population (5 year average)
Crime - Assaults per 100,000 population (5 year average)
Crime - Burglaries per 100,000 population (5 year average)
Crime - Thefts per 100,000 population (5 year average)
Crime - Auto thefts per 100,000 population (5 year average)
Crime - Arson per 100,000 population (5 year average)
Crime - City-data.com crime index (5 year average)
Crime - Violent crime index (5 year average)
Crime - Property crime index (5 year average)
1996 Presidential Elections Results (%) - Democratic Party (Clinton)
1996 Presidential Elections Results (%) - Republican Party (Dole)
1996 Presidential Elections Results (%) - Other
2000 Presidential Elections Results (%) - Democratic Party (Gore)
2000 Presidential Elections Results (%) - Republican Party (Bush)
2000 Presidential Elections Results (%) - Other
2004 Presidential Elections Results (%) - Democratic Party (Kerry)
2004 Presidential Elections Results (%) - Republican Party (Bush)
2004 Presidential Elections Results (%) - Other
2008 Presidential Elections Results (%) - Democratic Party (Obama)
2008 Presidential Elections Results (%) - Republican Party (McCain)
2008 Presidential Elections Results (%) - Other
2012 Presidential Elections Results (%) - Democratic Party (Obama)
2012 Presidential Elections Results (%) - Republican Party (Romney)
2012 Presidential Elections Results (%) - Other
2016 Presidential Elections Results (%) - Democratic Party (Clinton)
2016 Presidential Elections Results (%) - Republican Party (Trump)
2016 Presidential Elections Results (%) - Other
2020 Presidential Elections Results (%) - Democratic Party (Biden)
2020 Presidential Elections Results (%) - Republican Party (Trump)
2020 Presidential Elections Results (%) - Other
Ancestries Reported - Arab (%)
Ancestries Reported - Czech (%)
Ancestries Reported - Danish (%)
Ancestries Reported - Dutch (%)
Ancestries Reported - English (%)
Ancestries Reported - French (%)
Ancestries Reported - French Canadian (%)
Ancestries Reported - German (%)
Ancestries Reported - Greek (%)
Ancestries Reported - Hungarian (%)
Ancestries Reported - Irish (%)
Ancestries Reported - Italian (%)
Ancestries Reported - Lithuanian (%)
Ancestries Reported - Norwegian (%)
Ancestries Reported - Polish (%)
Ancestries Reported - Portuguese (%)
Ancestries Reported - Russian (%)
Ancestries Reported - Scotch-Irish (%)
Ancestries Reported - Scottish (%)
Ancestries Reported - Slovak (%)
Ancestries Reported - Subsaharan African (%)
Ancestries Reported - Swedish (%)
Ancestries Reported - Swiss (%)
Ancestries Reported - Ukrainian (%)
Ancestries Reported - United States (%)
Ancestries Reported - Welsh (%)
Ancestries Reported - West Indian (%)
Ancestries Reported - Other (%)
Educational Attainment - No schooling completed (%)
Educational Attainment - Less than high school (%)
Educational Attainment - High school or equivalent (%)
Educational Attainment - Less than 1 year of college (%)
Educational Attainment - 1 or more years of college (%)
Educational Attainment - Associate degree (%)
Educational Attainment - Bachelor's degree (%)
Educational Attainment - Master's degree (%)
Educational Attainment - Professional school degree (%)
Educational Attainment - Doctorate degree (%)
School Enrollment - Nursery, preschool (%)
School Enrollment - Kindergarten (%)
School Enrollment - Grade 1 to 4 (%)
School Enrollment - Grade 5 to 8 (%)
School Enrollment - Grade 9 to 12 (%)
School Enrollment - College undergrad (%)
School Enrollment - Graduate or professional (%)
School Enrollment - Not enrolled in school (%)
School enrollment - Public schools (%)
School enrollment - Private schools (%)
School enrollment - Not enrolled (%)
Median number of rooms in houses and condos
Median number of rooms in apartments
Housing units lacking complete plumbing facilities (%)
Housing units lacking complete kitchen facilities (%)
Density of houses
Urban houses (%)
Rural houses (%)
Households with people 60 years and over (%)
Households with people 65 years and over (%)
Households with people 75 years and over (%)
Households with one or more nonrelatives (%)
Households with no nonrelatives (%)
Population in households (%)
Family households (%)
Nonfamily households (%)
Population in families (%)
Family households with own children (%)
Median number of bedrooms in owner occupied houses
Mean number of bedrooms in owner occupied houses
Median number of bedrooms in renter occupied houses
Mean number of bedrooms in renter occupied houses
Median number of vehichles in owner occupied houses
Mean number of vehichles in owner occupied houses
Median number of vehichles in renter occupied houses
Mean number of vehichles in renter occupied houses
Mortgage status - with mortgage (%)
Mortgage status - with second mortgage (%)
Mortgage status - with home equity loan (%)
Mortgage status - with both second mortgage and home equity loan (%)
Mortgage status - without a mortgage (%)
Average family size
Average family size - White
Average family size - Black or African American
Average family size - Asian
Average family size - Hispanic or Latino
Average family size - American Indian and Alaska Native
Average family size - Multirace
Average family size - Other Race
Geographical mobility - Same house 1 year ago (%)
Geographical mobility - Moved within same county (%)
Geographical mobility - Moved from different county within same state (%)
Geographical mobility - Moved from different state (%)
Geographical mobility - Moved from abroad (%)
Place of birth - Born in state of residence (%)
Place of birth - Born in other state (%)
Place of birth - Native, outside of US (%)
Place of birth - Foreign born (%)
Housing units in structures - 1, detached (%)
Housing units in structures - 1, attached (%)
Housing units in structures - 2 (%)
Housing units in structures - 3 or 4 (%)
Housing units in structures - 5 to 9 (%)
Housing units in structures - 10 to 19 (%)
Housing units in structures - 20 to 49 (%)
Housing units in structures - 50 or more (%)
Housing units in structures - Mobile home (%)
Housing units in structures - Boat, RV, van, etc. (%)
House/condo owner moved in on average (years ago)
Renter moved in on average (years ago)
Year householder moved into unit - Moved in 1999 to March 2000 (%)
Year householder moved into unit - Moved in 1995 to 1998 (%)
Year householder moved into unit - Moved in 1990 to 1994 (%)
Year householder moved into unit - Moved in 1980 to 1989 (%)
Year householder moved into unit - Moved in 1970 to 1979 (%)
Year householder moved into unit - Moved in 1969 or earlier (%)
Means of transportation to work - Drove car alone (%)
Means of transportation to work - Carpooled (%)
Means of transportation to work - Public transportation (%)
Means of transportation to work - Bus or trolley bus (%)
Means of transportation to work - Streetcar or trolley car (%)
Means of transportation to work - Subway or elevated (%)
Means of transportation to work - Railroad (%)
Means of transportation to work - Ferryboat (%)
Means of transportation to work - Taxicab (%)
Means of transportation to work - Motorcycle (%)
Means of transportation to work - Bicycle (%)
Means of transportation to work - Walked (%)
Means of transportation to work - Other means (%)
Working at home (%)
Industry diversity
Most Common Industries - Agriculture, forestry, fishing and hunting, and mining (%)
Most Common Industries - Agriculture, forestry, fishing and hunting (%)
Most Common Industries - Mining, quarrying, and oil and gas extraction (%)
Most Common Industries - Construction (%)
Most Common Industries - Manufacturing (%)
Most Common Industries - Wholesale trade (%)
Most Common Industries - Retail trade (%)
Most Common Industries - Transportation and warehousing, and utilities (%)
Most Common Industries - Transportation and warehousing (%)
Most Common Industries - Utilities (%)
Most Common Industries - Information (%)
Most Common Industries - Finance and insurance, and real estate and rental and leasing (%)
Most Common Industries - Finance and insurance (%)
Most Common Industries - Real estate and rental and leasing (%)
Most Common Industries - Professional, scientific, and management, and administrative and waste management services (%)
Most Common Industries - Professional, scientific, and technical services (%)
Most Common Industries - Management of companies and enterprises (%)
Most Common Industries - Administrative and support and waste management services (%)
Most Common Industries - Educational services, and health care and social assistance (%)
Most Common Industries - Educational services (%)
Most Common Industries - Health care and social assistance (%)
Most Common Industries - Arts, entertainment, and recreation, and accommodation and food services (%)
Most Common Industries - Arts, entertainment, and recreation (%)
Most Common Industries - Accommodation and food services (%)
Most Common Industries - Other services, except public administration (%)
Most Common Industries - Public administration (%)
Occupation diversity
Most Common Occupations - Management, business, science, and arts occupations (%)
Most Common Occupations - Management, business, and financial occupations (%)
Most Common Occupations - Management occupations (%)
Most Common Occupations - Business and financial operations occupations (%)
Most Common Occupations - Computer, engineering, and science occupations (%)
Most Common Occupations - Computer and mathematical occupations (%)
Most Common Occupations - Architecture and engineering occupations (%)
Most Common Occupations - Life, physical, and social science occupations (%)
Most Common Occupations - Education, legal, community service, arts, and media occupations (%)
Most Common Occupations - Community and social service occupations (%)
Most Common Occupations - Legal occupations (%)
Most Common Occupations - Education, training, and library occupations (%)
Most Common Occupations - Arts, design, entertainment, sports, and media occupations (%)
Most Common Occupations - Healthcare practitioners and technical occupations (%)
Most Common Occupations - Health diagnosing and treating practitioners and other technical occupations (%)
Most Common Occupations - Health technologists and technicians (%)
Most Common Occupations - Service occupations (%)
Most Common Occupations - Healthcare support occupations (%)
Most Common Occupations - Protective service occupations (%)
Most Common Occupations - Fire fighting and prevention, and other protective service workers including supervisors (%)
Most Common Occupations - Law enforcement workers including supervisors (%)
Most Common Occupations - Food preparation and serving related occupations (%)
Most Common Occupations - Building and grounds cleaning and maintenance occupations (%)
Most Common Occupations - Personal care and service occupations (%)
Most Common Occupations - Sales and office occupations (%)
Most Common Occupations - Sales and related occupations (%)
Most Common Occupations - Office and administrative support occupations (%)
Most Common Occupations - Natural resources, construction, and maintenance occupations (%)
Most Common Occupations - Farming, fishing, and forestry occupations (%)
Most Common Occupations - Construction and extraction occupations (%)
Most Common Occupations - Installation, maintenance, and repair occupations (%)
Most Common Occupations - Production, transportation, and material moving occupations (%)
Most Common Occupations - Production occupations (%)
Most Common Occupations - Transportation occupations (%)
Most Common Occupations - Material moving occupations (%)
People in Group quarters - Institutionalized population (%)
People in Group quarters - Correctional institutions (%)
People in Group quarters - Federal prisons and detention centers (%)
People in Group quarters - Halfway houses (%)
People in Group quarters - Local jails and other confinement facilities (including police lockups) (%)
People in Group quarters - Military disciplinary barracks (%)
People in Group quarters - State prisons (%)
People in Group quarters - Other types of correctional institutions (%)
People in Group quarters - Nursing homes (%)
People in Group quarters - Hospitals/wards, hospices, and schools for the handicapped (%)
People in Group quarters - Hospitals/wards and hospices for chronically ill (%)
People in Group quarters - Hospices or homes for chronically ill (%)
People in Group quarters - Military hospitals or wards for chronically ill (%)
People in Group quarters - Other hospitals or wards for chronically ill (%)
People in Group quarters - Hospitals or wards for drug/alcohol abuse (%)
People in Group quarters - Mental (Psychiatric) hospitals or wards (%)
People in Group quarters - Schools, hospitals, or wards for the mentally retarded (%)
People in Group quarters - Schools, hospitals, or wards for the physically handicapped (%)
People in Group quarters - Institutions for the deaf (%)
People in Group quarters - Institutions for the blind (%)
People in Group quarters - Orthopedic wards and institutions for the physically handicapped (%)
People in Group quarters - Wards in general hospitals for patients who have no usual home elsewhere (%)
People in Group quarters - Wards in military hospitals for patients who have no usual home elsewhere (%)
People in Group quarters - Juvenile institutions (%)
People in Group quarters - Long-term care (%)
People in Group quarters - Homes for abused, dependent, and neglected children (%)
People in Group quarters - Residential treatment centers for emotionally disturbed children (%)
People in Group quarters - Training schools for juvenile delinquents (%)
People in Group quarters - Short-term care, detention or diagnostic centers for delinquent children (%)
People in Group quarters - Type of juvenile institution unknown (%)
People in Group quarters - Noninstitutionalized population (%)
People in Group quarters - College dormitories (includes college quarters off campus) (%)
People in Group quarters - Military quarters (%)
People in Group quarters - On base (%)
People in Group quarters - Barracks, unaccompanied personnel housing (UPH), (Enlisted/Officer), ;and similar group living quarters for military personnel (%)
People in Group quarters - Transient quarters for temporary residents (%)
People in Group quarters - Military ships (%)
People in Group quarters - Group homes (%)
People in Group quarters - Homes or halfway houses for drug/alcohol abuse (%)
People in Group quarters - Homes for the mentally ill (%)
People in Group quarters - Homes for the mentally retarded (%)
People in Group quarters - Homes for the physically handicapped (%)
People in Group quarters - Other group homes (%)
People in Group quarters - Religious group quarters (%)
People in Group quarters - Dormitories (%)
People in Group quarters - Agriculture workers' dormitories on farms (%)
People in Group quarters - Job Corps and vocational training facilities (%)
People in Group quarters - Other workers' dormitories (%)
People in Group quarters - Crews of maritime vessels (%)
People in Group quarters - Other nonhousehold living situations (%)
People in Group quarters - Other noninstitutional group quarters (%)
Residents speaking English at home (%)
Residents speaking English at home - Born in the United States (%)
Residents speaking English at home - Native, born elsewhere (%)
Residents speaking English at home - Foreign born (%)
Residents speaking Spanish at home (%)
Residents speaking Spanish at home - Born in the United States (%)
Residents speaking Spanish at home - Native, born elsewhere (%)
Residents speaking Spanish at home - Foreign born (%)
Residents speaking other language at home (%)
Residents speaking other language at home - Born in the United States (%)
Residents speaking other language at home - Native, born elsewhere (%)
Residents speaking other language at home - Foreign born (%)
Class of Workers - Employee of private company (%)
Class of Workers - Self-employed in own incorporated business (%)
Class of Workers - Private not-for-profit wage and salary workers (%)
Class of Workers - Local government workers (%)
Class of Workers - State government workers (%)
Class of Workers - Federal government workers (%)
Class of Workers - Self-employed workers in own not incorporated business and Unpaid family workers (%)
House heating fuel used in houses and condos - Utility gas (%)
House heating fuel used in houses and condos - Bottled, tank, or LP gas (%)
House heating fuel used in houses and condos - Electricity (%)
House heating fuel used in houses and condos - Fuel oil, kerosene, etc. (%)
House heating fuel used in houses and condos - Coal or coke (%)
House heating fuel used in houses and condos - Wood (%)
House heating fuel used in houses and condos - Solar energy (%)
House heating fuel used in houses and condos - Other fuel (%)
House heating fuel used in houses and condos - No fuel used (%)
House heating fuel used in apartments - Utility gas (%)
House heating fuel used in apartments - Bottled, tank, or LP gas (%)
House heating fuel used in apartments - Electricity (%)
House heating fuel used in apartments - Fuel oil, kerosene, etc. (%)
House heating fuel used in apartments - Coal or coke (%)
House heating fuel used in apartments - Wood (%)
House heating fuel used in apartments - Solar energy (%)
House heating fuel used in apartments - Other fuel (%)
House heating fuel used in apartments - No fuel used (%)
Armed forces status - In Armed Forces (%)
Armed forces status - Civilian (%)
Armed forces status - Civilian - Veteran (%)
Armed forces status - Civilian - Nonveteran (%)
Fatal accidents locations in years 2005-2021
Fatal accidents locations in 2005
Fatal accidents locations in 2006
Fatal accidents locations in 2007
Fatal accidents locations in 2008
Fatal accidents locations in 2009
Fatal accidents locations in 2010
Fatal accidents locations in 2011
Fatal accidents locations in 2012
Fatal accidents locations in 2013
Fatal accidents locations in 2014
Fatal accidents locations in 2015
Fatal accidents locations in 2016
Fatal accidents locations in 2017
Fatal accidents locations in 2018
Fatal accidents locations in 2019
Fatal accidents locations in 2020
Fatal accidents locations in 2021
Alcohol use - People drinking some alcohol every month (%)
Alcohol use - People not drinking at all (%)
Alcohol use - Average days/month drinking alcohol
Alcohol use - Average drinks/week
Alcohol use - Average days/year people drink much
Audiometry - Average condition of hearing (%)
Audiometry - People that can hear a whisper from across a quiet room (%)
Audiometry - People that can hear normal voice from across a quiet room (%)
Audiometry - Ears ringing, roaring, buzzing (%)
Audiometry - Had a job exposure to loud noise (%)
Audiometry - Had off-work exposure to loud noise (%)
Blood Pressure & Cholesterol - Has high blood pressure (%)
Blood Pressure & Cholesterol - Checking blood pressure at home (%)
Blood Pressure & Cholesterol - Frequently checking blood cholesterol (%)
Blood Pressure & Cholesterol - Has high cholesterol level (%)
Consumer Behavior - Money monthly spent on food at supermarket/grocery store
Consumer Behavior - Money monthly spent on food at other stores
Consumer Behavior - Money monthly spent on eating out
Consumer Behavior - Money monthly spent on carryout/delivered foods
Consumer Behavior - Income spent on food at supermarket/grocery store (%)
Consumer Behavior - Income spent on food at other stores (%)
Consumer Behavior - Income spent on eating out (%)
Consumer Behavior - Income spent on carryout/delivered foods (%)
Current Health Status - General health condition (%)
Current Health Status - Blood donors (%)
Current Health Status - Has blood ever tested for HIV virus (%)
Current Health Status - Left-handed people (%)
Dermatology - People using sunscreen (%)
Diabetes - Diabetics (%)
Diabetes - Had a blood test for high blood sugar (%)
Diabetes - People taking insulin (%)
Diet Behavior & Nutrition - Diet health (%)
Diet Behavior & Nutrition - Milk product consumption (# of products/month)
Diet Behavior & Nutrition - Meals not home prepared (#/week)
Diet Behavior & Nutrition - Meals from fast food or pizza place (#/week)
Diet Behavior & Nutrition - Ready-to-eat foods (#/month)
Diet Behavior & Nutrition - Frozen meals/pizza (#/month)
Drug Use - People that ever used marijuana or hashish (%)
Drug Use - Ever used hard drugs (%)
Drug Use - Ever used any form of cocaine (%)
Drug Use - Ever used heroin (%)
Drug Use - Ever used methamphetamine (%)
Health Insurance - People covered by health insurance (%)
Kidney Conditions-Urology - Avg. # of times urinating at night
Medical Conditions - People with asthma (%)
Medical Conditions - People with anemia (%)
Medical Conditions - People with psoriasis (%)
Medical Conditions - People with overweight (%)
Medical Conditions - Elderly people having difficulties in thinking or remembering (%)
Medical Conditions - People who ever received blood transfusion (%)
Medical Conditions - People having trouble seeing even with glass/contacts (%)
Medical Conditions - People with arthritis (%)
Medical Conditions - People with gout (%)
Medical Conditions - People with congestive heart failure (%)
Medical Conditions - People with coronary heart disease (%)
Medical Conditions - People with angina pectoris (%)
Medical Conditions - People who ever had heart attack (%)
Medical Conditions - People who ever had stroke (%)
Medical Conditions - People with emphysema (%)
Medical Conditions - People with thyroid problem (%)
Medical Conditions - People with chronic bronchitis (%)
Medical Conditions - People with any liver condition (%)
Medical Conditions - People who ever had cancer or malignancy (%)
Mental Health - People who have little interest in doing things (%)
Mental Health - People feeling down, depressed, or hopeless (%)
Mental Health - People who have trouble sleeping or sleeping too much (%)
Mental Health - People feeling tired or having little energy (%)
Mental Health - People with poor appetite or overeating (%)
Mental Health - People feeling bad about themself (%)
Mental Health - People who have trouble concentrating on things (%)
Mental Health - People moving or speaking slowly or too fast (%)
Mental Health - People having thoughts they would be better off dead (%)
Oral Health - Average years since last visit a dentist
Oral Health - People embarrassed because of mouth (%)
Oral Health - People with gum disease (%)
Oral Health - General health of teeth and gums (%)
Oral Health - Average days a week using dental floss/device
Oral Health - Average days a week using mouthwash for dental problem
Oral Health - Average number of teeth
Pesticide Use - Households using pesticides to control insects (%)
Pesticide Use - Households using pesticides to kill weeds (%)
Physical Activity - People doing vigorous-intensity work activities (%)
Physical Activity - People doing moderate-intensity work activities (%)
Physical Activity - People walking or bicycling (%)
Physical Activity - People doing vigorous-intensity recreational activities (%)
Physical Activity - People doing moderate-intensity recreational activities (%)
Physical Activity - Average hours a day doing sedentary activities
Physical Activity - Average hours a day watching TV or videos
Physical Activity - Average hours a day using computer
Physical Functioning - People having limitations keeping them from working (%)
Physical Functioning - People limited in amount of work they can do (%)
Physical Functioning - People that need special equipment to walk (%)
Physical Functioning - People experiencing confusion/memory problems (%)
Physical Functioning - People requiring special healthcare equipment (%)
Prescription Medications - Average number of prescription medicines taking
Preventive Aspirin Use - Adults 40+ taking low-dose aspirin (%)
Reproductive Health - Vaginal deliveries (%)
Reproductive Health - Cesarean deliveries (%)
Reproductive Health - Deliveries resulted in a live birth (%)
Reproductive Health - Pregnancies resulted in a delivery (%)
Reproductive Health - Women breastfeeding newborns (%)
Reproductive Health - Women that had a hysterectomy (%)
Reproductive Health - Women that had both ovaries removed (%)
Reproductive Health - Women that have ever taken birth control pills (%)
Reproductive Health - Women taking birth control pills (%)
Reproductive Health - Women that have ever used Depo-Provera or injectables (%)
Reproductive Health - Women that have ever used female hormones (%)
Sexual Behavior - People 18+ that ever had sex (vaginal, anal, or oral) (%)
Sexual Behavior - Males 18+ that ever had vaginal sex with a woman (%)
Sexual Behavior - Males 18+ that ever performed oral sex on a woman (%)
Sexual Behavior - Males 18+ that ever had anal sex with a woman (%)
Sexual Behavior - Males 18+ that ever had any sex with a man (%)
Sexual Behavior - Females 18+ that ever had vaginal sex with a man (%)
Sexual Behavior - Females 18+ that ever performed oral sex on a man (%)
Sexual Behavior - Females 18+ that ever had anal sex with a man (%)
Sexual Behavior - Females 18+ that ever had any kind of sex with a woman (%)
Sexual Behavior - Average age people first had sex
Sexual Behavior - Average number of female sex partners in lifetime (males 18+)
Sexual Behavior - Average number of female vaginal sex partners in lifetime (males 18+)
Sexual Behavior - Average age people first performed oral sex on a woman (18+)
Sexual Behavior - Average number of woman performed oral sex on in lifetime (18+)
Sexual Behavior - Average number of male sex partners in lifetime (males 18+)
Sexual Behavior - Average number of male anal sex partners in lifetime (males 18+)
Sexual Behavior - Average age people first performed oral sex on a man (18+)
Sexual Behavior - Average number of male oral sex partners in lifetime (18+)
Sexual Behavior - People using protection when performing oral sex (%)
Sexual Behavior - Average number of times people have vaginal or anal sex a year
Sexual Behavior - People having sex without condom (%)
Sexual Behavior - Average number of male sex partners in lifetime (females 18+)
Sexual Behavior - Average number of male vaginal sex partners in lifetime (females 18+)
Sexual Behavior - Average number of female sex partners in lifetime (females 18+)
Sexual Behavior - Circumcised males 18+ (%)
Sleep Disorders - Average hours sleeping at night
Sleep Disorders - People that has trouble sleeping (%)
Smoking-Cigarette Use - People smoking cigarettes (%)
Taste & Smell - People 40+ having problems with smell (%)
Taste & Smell - People 40+ having problems with taste (%)
Taste & Smell - People 40+ that ever had wisdom teeth removed (%)
Taste & Smell - People 40+ that ever had tonsils teeth removed (%)
Taste & Smell - People 40+ that ever had a loss of consciousness because of a head injury (%)
Taste & Smell - People 40+ that ever had a broken nose or other serious injury to face or skull (%)
Taste & Smell - People 40+ that ever had two or more sinus infections (%)
Weight - Average height (inches)
Weight - Average weight (pounds)
Weight - Average BMI
Weight - People that are obese (%)
Weight - People that ever were obese (%)
Weight - People trying to lose weight (%)
100%
urban population.
Estimated median house/condo value in 2022: $515,094
19130:
$515,094Pennsylvania:
$245,500
According to our research of Pennsylvania and other state lists, there were 57 registered sex offenders living in 19130 zip code as of April 27, 2024 . The ratio of all residents to sex offenders in zip code 19130 is 476 to 1.The ratio of registered sex offenders to all residents in this zip code is near the state average.
Median resident age: This zip code:
33.9 yearsPennsylvania median age:
40.9 years
Average household size: This zip code:
1.8 peoplePennsylvania:
2.4 people
Averages for the 2020 tax year for zip code 19130, filed in 2021:
Average Adjusted Gross Income (AGI) in 2020: $104,902 (Individual Income Tax Returns) Here:
$104,902State:
$75,707
Salary/wage: $91,473 (reported on 86.1% of returns )Here:
$91,473State:
$62,806
(% of AGI for various income ranges: 1096.2% for AGIs below $25k , 3915.0% for AGIs $25k-50k , 7103.2% for AGIs $50k-75k , 10655.3% for AGIs $75k-100k , 20683.2% for AGIs $100k-200k , 94571.5% for AGIs over 200k ) Taxable interest for individuals: $1,303 (reported on 37.8% of returns )This zip code:
$1,303Pennsylvania:
$1,633
(% of AGI for various income ranges: 18.7% for AGIs below $25k , 22.8% for AGIs $25k-50k , 25.6% for AGIs $50k-75k , 47.8% for AGIs $75k-100k , 120.3% for AGIs $100k-200k , 711.5% for AGIs over 200k ) Ordinary dividends: $7,018 (reported on 34.8% of returns )(% of AGI for various income ranges: 49.4% for AGIs below $25k , 63.3% for AGIs $25k-50k , 89.9% for AGIs $50k-75k , 175.2% for AGIs $75k-100k , 555.1% for AGIs $100k-200k , 4388.1% for AGIs over 200k ) Net capital gain/loss in AGI: +$20,118 (reported on 31.6% of returns )Here:
+$20,118State:
+$23,522
(% of AGI for various income ranges: 27.3% for AGIs below $25k , 54.7% for AGIs $25k-50k , 82.0% for AGIs $50k-75k , 193.5% for AGIs $75k-100k , 751.4% for AGIs $100k-200k , 15741.3% for AGIs over 200k ) Profit/loss from business: +$19,651 (reported on 15.3% of returns )Here:
+$19,651State:
+$16,274
(% of AGI for various income ranges: 110.0% for AGIs below $25k , 215.5% for AGIs $25k-50k , 192.6% for AGIs $50k-75k , 285.8% for AGIs $75k-100k , 858.5% for AGIs $100k-200k , 3485.4% for AGIs over 200k ) Taxable individual retirement arrangement distribution: $25,486 (reported on 7.2% of returns )19130:
$25,486Pennsylvania:
$18,583
(% of AGI for various income ranges: 46.0% for AGIs below $25k , 66.5% for AGIs $25k-50k , 104.3% for AGIs $50k-75k , 208.9% for AGIs $75k-100k , 684.7% for AGIs $100k-200k , 1986.5% for AGIs over 200k ) Self-employed (Keogh) retirement plans: $25,481 (reported on 1.7% of returns )19130:
$25,481Pennsylvania:
$25,407
(% of AGI for various income ranges: 14.5% for AGIs $50k-75k , 65.7% for AGIs $100k-200k , 1058.7% for AGIs over 200k ) Total itemized deductions: $29,876 (reported on 15.5% of returns )Here:
$29,876State:
$34,850
(% of AGI for various income ranges: 73.7% for AGIs below $25k , 107.3% for AGIs $25k-50k , 274.3% for AGIs $50k-75k , 526.8% for AGIs $75k-100k , 1277.6% for AGIs $100k-200k , 6797.5% for AGIs over 200k ) Charity contributions: $9,304 (reported on 12.6% of returns )(% of AGI for various income ranges: 5.0% for AGIs below $25k , 18.2% for AGIs $25k-50k , 41.6% for AGIs $50k-75k , 74.4% for AGIs $75k-100k , 201.7% for AGIs $100k-200k , 2452.9% for AGIs over 200k ) Taxes paid: $8,920 (reported on 15.5% of returns )(% of AGI for various income ranges: 14.9% for AGIs below $25k , 27.5% for AGIs $25k-50k , 85.0% for AGIs $50k-75k , 197.9% for AGIs $75k-100k , 483.7% for AGIs $100k-200k , 1650.4% for AGIs over 200k ) Earned income credit: $1,415 (reported on 6.3% of returns )(% of AGI for various income ranges: 45.4% for AGIs below $25k , 21.0% for AGIs $25k-50k ) Percentage of individuals using paid preparers for their 2020 taxes: 93.5%(% for various income ranges: 91.9% for AGIs below $25k , 93.4% for AGIs $25k-50k , 94.0% for AGIs $50k-75k , 93.3% for AGIs $75k-100k , 93.9% for AGIs $100k-200k , 94.4% for AGIs over 200k )
Averages for the 2012 tax year for zip code 19130, filed in 2013:
Average Adjusted Gross Income (AGI) in 2012: $74,453 (Individual Income Tax Returns) Here:
$74,453State:
$61,346
Salary/wage: $67,578 (reported on 87.0% of returns )Here:
$67,578State:
$51,902
(% of AGI for various income ranges: 76.3% for AGIs below $25k , 87.0% for AGIs $25k-50k , 87.1% for AGIs $50k-75k , 85.1% for AGIs $75k-100k , 81.0% for AGIs $100k-200k , 67.6% for AGIs over 200k ) Taxable interest for individuals: $1,193 (reported on 39.0% of returns )This zip code:
$1,193Pennsylvania:
$1,588
(% of AGI for various income ranges: 1.1% for AGIs below $25k , 0.6% for AGIs $25k-50k , 0.4% for AGIs $50k-75k , 0.6% for AGIs $75k-100k , 0.6% for AGIs $100k-200k , 0.7% for AGIs over 200k ) Ordinary dividends: $4,883 (reported on 27.8% of returns )(% of AGI for various income ranges: 1.9% for AGIs below $25k , 1.3% for AGIs $25k-50k , 1.2% for AGIs $50k-75k , 1.4% for AGIs $75k-100k , 1.9% for AGIs $100k-200k , 2.4% for AGIs over 200k ) Net capital gain/loss in AGI: +$6,343 (reported on 22.0% of returns )Here:
+$6,343State:
+$14,495
(% of AGI for various income ranges: 0.3% for AGIs $25k-50k , 0.4% for AGIs $50k-75k , 0.4% for AGIs $75k-100k , 1.2% for AGIs $100k-200k , 4.9% for AGIs over 200k ) Profit/loss from business: +$18,170 (reported on 14.0% of returns )Here:
+$18,170State:
+$16,268
(% of AGI for various income ranges: 8.4% for AGIs below $25k , 3.4% for AGIs $25k-50k , 2.4% for AGIs $50k-75k , 2.2% for AGIs $75k-100k , 3.7% for AGIs $100k-200k , 3.4% for AGIs over 200k ) Taxable individual retirement arrangement distribution: $21,000 (reported on 7.7% of returns )19130:
$21,000Pennsylvania:
$14,550
(% of AGI for various income ranges: 2.7% for AGIs below $25k , 1.4% for AGIs $25k-50k , 1.4% for AGIs $50k-75k , 2.1% for AGIs $75k-100k , 2.5% for AGIs $100k-200k , 2.5% for AGIs over 200k ) Self-employment retirement plans: $20,930 (reported on 1.5% of returns )19130:
$20,930Pennsylvania:
$20,922
(% of AGI for various income ranges: 0.2% for AGIs $50k-75k , 0.4% for AGIs $100k-200k , 1.0% for AGIs over 200k ) Total itemized deductions: $23,632 (18% of AGI, reported on 39.6% of returns )Here:
$23,632State:
$23,538
Here:
17.8% of AGIState:
18.4% of AGI
(% of AGI for various income ranges: 7.9% for AGIs below $25k , 7.1% for AGIs $25k-50k , 10.0% for AGIs $50k-75k , 14.4% for AGIs $75k-100k , 15.1% for AGIs $100k-200k , 13.8% for AGIs over 200k ) Charity contributions: $3,158 (reported on 32.5% of returns )(% of AGI for various income ranges: 0.7% for AGIs below $25k , 0.8% for AGIs $25k-50k , 1.0% for AGIs $50k-75k , 1.3% for AGIs $75k-100k , 1.4% for AGIs $100k-200k , 1.9% for AGIs over 200k ) Taxes paid: $11,238 (reported on 39.5% of returns )19130:
$11,238State:
$9,982
(% of AGI for various income ranges: 1.9% for AGIs below $25k , 2.2% for AGIs $25k-50k , 3.8% for AGIs $50k-75k , 6.6% for AGIs $75k-100k , 7.7% for AGIs $100k-200k , 7.4% for AGIs over 200k ) Earned income credit: $1,623 (reported on 9.4% of returns )(% of AGI for various income ranges: 3.8% for AGIs below $25k , 0.3% for AGIs $25k-50k ) Percentage of individuals using paid preparers for their 2012 taxes: 44.1%(% for various income ranges: 40.1% for AGIs below $25k , 36.5% for AGIs $25k-50k , 40.3% for AGIs $50k-75k , 43.8% for AGIs $75k-100k , 56.9% for AGIs $100k-200k , 74.4% for AGIs over 200k )
Averages for the 2004 tax year for zip code 19130, filed in 2005:
Average Adjusted Gross Income (AGI) in 2004: $54,420 (Individual Income Tax Returns) Here:
$54,420State:
$48,049
Salary/wage: $50,426 (reported on 86.0% of returns )Here:
$50,426State:
$42,646
(% of AGI for various income ranges: 142.5% for AGIs below $10k , 79.5% for AGIs $10k-25k , 87.4% for AGIs $25k-50k , 86.4% for AGIs $50k-75k , 83.4% for AGIs $75k-100k , 71.6% for AGIs over 100k ) Taxable interest for individuals: $1,744 (reported on 46.9% of returns )This zip code:
$1,744Pennsylvania:
$1,657
(% of AGI for various income ranges: 10.5% for AGIs below $10k , 2.2% for AGIs $10k-25k , 1.4% for AGIs $25k-50k , 1.1% for AGIs $50k-75k , 1.5% for AGIs $75k-100k , 1.4% for AGIs over 100k ) Taxable dividends: $3,335 (reported on 29.1% of returns )(% of AGI for various income ranges: 9.0% for AGIs below $10k , 2.1% for AGIs $10k-25k , 1.1% for AGIs $25k-50k , 1.4% for AGIs $50k-75k , 1.7% for AGIs $75k-100k , 2.0% for AGIs over 100k ) Net capital gain/loss: +$7,205 (reported on 23.4% of returns )Here:
+$7,205State:
+$9,716
(% of AGI for various income ranges: -3.7% for AGIs below $10k , 0.3% for AGIs $10k-25k , 0.5% for AGIs $25k-50k , 0.7% for AGIs $50k-75k , 1.1% for AGIs $75k-100k , 6.2% for AGIs over 100k ) Profit/loss from business: +$16,350 (reported on 13.6% of returns )Here:
+$16,350State:
+$14,267
(% of AGI for various income ranges: 2.0% for AGIs below $10k , 5.7% for AGIs $10k-25k , 2.7% for AGIs $25k-50k , 2.7% for AGIs $50k-75k , 3.3% for AGIs $75k-100k , 5.2% for AGIs over 100k ) IRA payment deduction: $2,703 (reported on 2.8% of returns )19130:
$2,703Pennsylvania:
$2,903
(% of AGI for various income ranges: 0.3% for AGIs $10k-25k , 0.2% for AGIs $25k-50k , 0.2% for AGIs $50k-75k , 0.2% for AGIs $75k-100k , 0.1% for AGIs over 100k ) Self-employed pension: $16,360 (reported on 1.9% of returns )Here:
$16,360Pennsylvania:
$14,674
(% of AGI for various income ranges: 0.2% for AGIs $10k-25k , 0.1% for AGIs $25k-50k , 0.1% for AGIs $50k-75k , 0.3% for AGIs $75k-100k , 1.0% for AGIs over 100k ) Total itemized deductions: $18,999 (20% of AGI, reported on 41.3% of returns )Here:
$18,999State:
$18,804
Here:
20.2% of AGIState:
19.5% of AGI
(% of AGI for various income ranges: 20.1% for AGIs below $10k , 9.5% for AGIs $10k-25k , 10.8% for AGIs $25k-50k , 15.3% for AGIs $50k-75k , 17.0% for AGIs $75k-100k , 15.5% for AGIs over 100k ) Charity contributions deductions: $2,886 (3% of AGI, reported on 35.9% of returns )Here:
2.9% of AGIState:
3.3% of AGI
(% of AGI for various income ranges: 1.3% for AGIs below $10k , 1.1% for AGIs $10k-25k , 1.4% for AGIs $25k-50k , 1.8% for AGIs $50k-75k , 2.1% for AGIs $75k-100k , 2.2% for AGIs over 100k ) Total tax: $9,812 (reported on 80.9% of returns )(% of AGI for various income ranges: 4.3% for AGIs below $10k , 4.7% for AGIs $10k-25k , 9.3% for AGIs $25k-50k , 12.6% for AGIs $50k-75k , 13.7% for AGIs $75k-100k , 19.5% for AGIs over 100k ) Earned income credit: $1,514 (reported on 11.3% of returns )Percentage of individuals using paid preparers for their 2004 taxes: 48.2%(% for various income ranges: 45.6% for AGIs below $10k , 47.9% for AGIs $10k-25k , 43.3% for AGIs $25k-50k , 46.3% for AGIs $50k-75k , 50.9% for AGIs $75k-100k , 62.7% for AGIs over 100k )
Estimated median household income in 2022: This zip code:
$100,361Pennsylvania:
$71,798
Nearest zip codes: 19121 ,
19103 ,
19102 ,
19109 ,
19107 ,
19104 .
Philadelphia Zip Code Map
Percentage of family households: This zip code:
27.3%Pennsylvania:
42.6%
Percentage of households with unmarried partners: This zip code:
7.9%Pennsylvania:
46.5%
Likely homosexual households (counted as self-reported same-sex unmarried-partner households)
Lesbian couples: 0.1% of all households Gay men: 0.3% of all households
Household received Food Stamps/SNAP in the past 12 months: 1,032Household did not receive Food Stamps/SNAP in the past 12 months: 15,303
Women who had a birth in the past 12 months: 456 (488 now married , 0 unmarried) Women who did not have a birth in the past 12 months: 9,581 (2,697 now married , 6,922 unmarried)
Housing units in zip code 19130 with a mortgage: 4,354 (415
second mortgage , 365
both second mortgage and home equity loan )
Houses without a mortgage: 408
Median monthly owner costs for units with a mortgage: $2,221
Median monthly owner costs for units without a mortgage: $1,011
Residents with income below the poverty level in 2022:
This zip code:
9.8%Whole state:
11.8%
Residents with income below 50% of the poverty level in 2022:
This zip code:
3.7%Whole state:
6.1%
Median number of rooms in houses and condos: Median number of rooms in apartments: Notable locations in this zip code not listed on our city pages
Click to draw/clear zip code borders Notable locations in zip code 19130: (A) , United States Mint (B) , Philadelphia Fire Department Engine 13 (C) , Philadelphia District 9 Police Station (D) , Eastern Correctional Institution (E) , Museum of Art (F) , Please Touch Museum (G) , Rodin Museum (H) . Display/hide their locations on the map
Park in zip code 19130: (1) . Display/hide its location on the map
Tourist attraction (not listed on the city page) :
Year house built (houses)
121 2020 or later3,319 2010 to 2019597 2000 to 2009636 1990 to 1999824 1980 to 19891,486 1970 to 19791,798 1960 to 19691,525 1950 to 1959638 1940 to 19497,272 1939 or earlier
Zip code 19130 household income distribution in 2022 1,060 Less than $10,000457 $10,000 to $14,999258 $15,000 to $19,999311 $20,000 to $24,999252 $25,000 to $29,999416 $30,000 to $34,999120 $35,000 to $39,999366 $40,000 to $44,999268 $45,000 to $49,999990 $50,000 to $59,9991,465 $60,000 to $74,9992,221 $75,000 to $99,9992,130 $100,000 to $124,999998 $125,000 to $149,9991,901 $150,000 to $199,9993,257 $200,000 or moreEstimate of home value of owner-occupied houses/condos in 2022 in zip code 19130 12 Less than $10,00012 $35,000 to $39,99910 $40,000 to $49,99921 $50,000 to $59,99919 $90,000 to $99,99964 $100,000 to $124,99921 $125,000 to $149,99951 $150,000 to $174,999118 $175,000 to $199,999216 $200,000 to $249,999632 $250,000 to $299,9991,182 $300,000 to $399,9991,289 $400,000 to $499,9992,173 $500,000 to $749,999712 $750,000 to $999,999458 $1,000,000 to $1,499,999102 $2,000,000 or moreRent paid by renters in 2022 in zip code 19130 20 Less than $10035 $100 to $149131 $150 to $199216 $200 to $24915 $250 to $29914 $300 to $34917 $350 to $3997 $400 to $44923 $450 to $49942 $500 to $54955 $550 to $59972 $600 to $64913 $650 to $699133 $700 to $74997 $750 to $799251 $800 to $899252 $900 to $999807 $1,000 to $1,2491,712 $1,250 to $1,4993,477 $1,500 to $1,9991,870 $2,000 to $2,499405 $2,500 to $2,999307 $3,000 to $3,499293 $3,500 or more193 No cash rent
Median gross rent in 2022: $1,799.
Median price asked for vacant for-sale houses and condos in 2022: $606,998.
Estimated median house (or condo) value in 2022 for: White Non-Hispanic householders: $564,269Black or African American householders: $263,259Asian householders: $422,208Some other race householders: $484,297Two or more races householders: $353,661Hispanic or Latino householders: $506,649Estimated median house or condo value in 2022: $515,094
19130:
$515,094Pennsylvania:
$245,500
Lower value quartile - upper value quartile: $367,337 - $731,324
Mean price in 2022: Detached houses: $663,970Here:
$663,970State:
$317,202
Townhouses or other attached units: $653,676Here:
$653,676State:
$254,369
In 2-unit structures: $778,732Here:
$778,732State:
$249,182
In 3-to-4-unit structures: $528,766Here:
$528,766State:
$297,446
In 5-or-more-unit structures: $441,989Here:
$441,989State:
$320,068
Housing units in structures:
One, detached: 366One, attached: 4,899Two: 1,3973 or 4: 2,7895 to 9: 1,54510 to 19: 68320 to 49: 65350 or more: 5,967Mobile homes: 14Unemployment : 3.1%
Means of transportation to work in zip code 19130 33.2% 6,731 Drove a car alone3.3% 660 Carpooled7.5% 1,524 Bus or trolley bus2.0% 407 Streetcar or trolley car0.4% 84 Subway or elevated0.4% 77 Railroad0.7% 138 Taxi5.6% 1,146 Bicycle14.4% 2,933 Walked1.0% 210 Other means36.1% 7,333 Worked at homeTravel time to work (commute) in zip code 19130 124 Less than 5 minutes620 5 to 9 minutes985 10 to 14 minutes2,163 15 to 19 minutes2,711 20 to 24 minutes1,207 25 to 29 minutes2,602 30 to 34 minutes519 35 to 39 minutes725 40 to 44 minutes1,321 45 to 59 minutes591 60 to 89 minutes461 90 or more minutes
Neighborhoods in zip code 19130: Percentage of zip code residents living and working in this county: 81.6%
Household type by relationship:
Households: 30,239
Male householders: 7,245 (2,833 living alone ), Female householders: 9,195 (4,740 living alone )4,694 spouses (4,626 opposite-sex spouses ), 1,696 unmarried partners , (1,431 opposite-sex unmarried partners ), 3,994 children (3,852 natural , 95 adopted , 47 stepchildren ), 240 grandchildren , 177 brothers or sisters , 120 parents , 0 foster children , 265 other relatives , 2,061 non-relatives In group quarters: 674 (-1 institutionalized population )
Size of family households: 3,672 2-persons , 1,415 3-persons , 581 4-persons , 74 5-persons , 77 6-persons , 154 7-or-more-persons
Size of nonfamily households: 7,572 1-person , 2,698 2-persons , 318 3-persons , 15 4-persons , 86 5-persons , 56 6-persons
2,311 married couples with children. single-parent households (309 men , 333 women ).
84.0% of residents of 19130 zip code speak English at home. of residents speak Spanish at home (83% very well, 13% well, 3% not well, 1% not at all ).of residents speak other Indo-European language at home (78% very well, 21% well, 1% not at all ).of residents speak Asian or Pacific Island language at home (65% very well, 22% well, 13% not well ).of residents speak other language at home (99% very well, 1% well ).
Foreign born population: 3,923 (13.0%)
(57.6%
of them are naturalized citizens )
This zip code:
13.0%Whole state:
7.5%
11% Bhutan 11% Romania 6% Sweden 5% Japan 5% Serbia 4% United Kingdom, excluding England and Scotland 4% Thailand 9% Irish 5% Italian 5% Russian 5% German 4% American 3% English 2% European
Year of entry for the foreign-born population
1,636 2010 or later 633 2000 to 2009 775 1990 to 1999 1,162 Before 1990
There are
233 Medical Specialists in Zip Code 19130 .
Facilities with environmental interests located in this zip code:
BENJAMIN FRANKLIN HIGH SCHOOL (550 NORTH BROAD STREET in PHILADELPHIA, PA)
(Integrated Compliance Information System) - ICIS-03-1996-0381, FORMAL ENFORCEMENT ACTION COMPLIANCE ACTIVITY (Tracking inspections of insecticide, fungicide, and rodenticide, and toxic substances) Conditionally Exempt Small Quantity Generators, less than 100 kg/month of hazardous waste (Resource Conservation and Recovery Act (tracking hazardous waste)) - notification Organizations: OPERNAME (CONTACT/OPERATOR)
, SCHOOL DIST OF PHILA (CONTACT/OWNER)
Alternative names: BEN FRANKLIN HIGH SCHOOL, FRANKLIN, BENJAMIN HIGH SCHOOL
BACHE-MARTIN SCH (22 BROWN ST in PHILADELPHIA, PA)
(National Center for Education Statistics) - STATE ID-3618 Organizations: PHILADELPHIA CITY SD (SCHOOL DISTRICT)
ACK DISPLAY & ART SERVICE (1617 NORTH ST in PHILADELPHIA, PA)
(Resource Conservation and Recovery Act (tracking hazardous waste)) Organizations: OPERNAME (CONTACT/OPERATOR)
, OWNERNAME (CONTACT/OWNER)
2601 APARTMENTS (2601 PENNSYLVANIA AVENUE in PHILADELPHIA, PA)
AIR MINOR (AIRS/AFS) Business SIC classification: REAL ESTATE AGENTS AND MANAGERS
ADAM'S FABRICARE CLEANERS (2000 HAMILTON ST in PHILADELPHIA, PA)
AIR MINOR (AIRS/AFS) Business SIC classification: DRYCLEANING PLANTS, EXCEPT RUG CLEANING
ADAMS FABRICARE (401 N 21ST ST in PHILADELPHIA, PA)
Small Quantity Generators, between 100 kg and 1000 kg of hazardous waste/month (Resource Conservation and Recovery Act (tracking hazardous waste)) - notification Organizations: OPERNAME (CONTACT/OPERATOR)
, CHOI SOOMAN (CONTACT/OWNER)
ARCHON GROUP (440 NORTH BROAD STREET in PHILADELPHIA, PA)
Small Quantity Generators, between 100 kg and 1000 kg of hazardous waste/month (Resource Conservation and Recovery Act (tracking hazardous waste)) - notification Organizations: WXIII PHL REAL ESTATE LP (CONTACT/OWNER)
Alternative names: 440 N BROAD ST
ANDREA WEISS RESIDENCE (844 N 29TH STREET in PHILADELPHIA, PA)
ENFORCEMENT/COMPLIANCE ACTIVITY (Integrated Compliance Information System)
Housing units lacking complete plumbing facilities: 1.5%
Housing units lacking complete kitchen facilities: 1.9%
50.1% Utility gas 44.9% Electricity 2.6% Fuel oil, kerosene, etc. 1.5% Bottled, tank, or LP gas
Population in 1990: 21,544. Population change in the 1990s: +1,330 (+6.2%).
Place of birth for U.S.-born residents:
This state: 14,463Northeast: 6,171Midwest: 1,765South: 2,993West: 911
51% of the 19130 zip code residents lived in the same house 5 years ago.
Out of people who lived in different houses, 53% lived in this county.
Out of people who lived in different counties, 50% lived in Pennsylvania.
78% of the 19130 zip code residents lived in the same house 1 year ago.
Out of people who lived in different houses, 55% moved from this county.
Out of people who lived in different houses, 12% moved from different county within same state.
Out of people who lived in different houses, 26% moved from different state.
Out of people who lived in different houses, 4% moved from abroad.
Private vs. public school enrollment:
Students in private schools in grades 1 to 8 (elementary and middle school): 642
Here:
62.0%Pennsylvania:
15.7%
Students in private schools in grades 9 to 12 (high school): 258
Here:
42.9%Pennsylvania:
13.4%
Students in private undergraduate colleges: 374
Here:
31.6%Pennsylvania:
39.8%
Occupation by median earnings in the past 12 months ($)
114,551 Legal occupations 96,876 Management occupations 87,919 Architecture and engineering occupations 87,326 Business and financial operations occupations 86,934 Law enforcement workers including supervisors 83,762 Computer and mathematical occupations
Companies with federal contracts located in this zip code:
K & D CLOTHING MFG CO (640 N BROAD ST in PHILADELPHIA, PA; small business)
$98,980 with Defense Logistics Agency for Outerwear, Men's. Signed on 2000-01-14. Completion date: 2000-07-29.
STAGESTEP INC (2000 HAMILTON ST STE C200 in PHILADELPHIA, PA; small business)
$66,867 with Air Force for Floor Coverings. Signed on 1999-11-01. Completion date: 2000-01-10.
LEACH MANAGEMENT CONSULTING, C (1937 BRANDYWINE STREET, SU in PHILADELPHIA, PA; small business)
$25,884 with Navy for Organization/Administrative/PersonneI Studies. Signed on 2003-04-17. Completion date: 2003-06-27.
Top industries in this zip code by the number of employees in 2005:
Information: Newspaper Publishers (over 1000 employees: 1 establishment)Health Care and Social Assistance: Services for the Elderly and Persons with Disabilities (500-999: 1, 10-19: 1, 5-9: 1)Health Care and Social Assistance: General Medical and Surgical Hospitals (500-999: 1)Educational Services: Elementary and Secondary Schools (100-249: 1, 50-99: 3, 20-49: 2)Arts, Entertainment, and Recreation: Museums (250-499: 1, 50-99: 1, 1-4: 1)Health Care and Social Assistance: Nursing Care Facilities (250-499: 1, 20-49: 1, 5-9: 1)Other Services (except Public Administration): Labor Unions and Similar Labor Organizations (100-249: 1, 50-99: 1, 20-49: 1, 5-9: 1, 1-4: 5)Professional, Scientific, and Technical Services: Architectural Services (100-249: 1, 50-99: 1, 5-9: 1, 1-4: 4)Accommodation and Food Services: Full-Service Restaurants (20-49: 4, 10-19: 5, 5-9: 2, 1-4: 12)Health Care and Social Assistance: Other Individual and Family Services (100-249: 1, 50-99: 1)
People in group quarters in 2010:
446 people in nursing facilities/skilled-nursing facilities
306 people in emergency and transitional shelters (with sleeping facilities) for people experiencing homelessness
55 people in group homes intended for adults
53 people in other noninstitutional facilities
People in group quarters in 2000:
469 people in nursing homes
333 people in other noninstitutional group quarters
160 people in short-term care, detention or diagnostic centers for delinquent children
75 people in homes for the mentally ill
34 people in local jails and other confinement facilities (including police lockups)
26 people in religious group quarters
18 people in homes for the mentally retarded
16 people in hospitals/wards and hospices for chronically ill
16 people in hospices or homes for chronically ill
4 people in federal prisons and detention centers
Fatal accident statistics in 2014:
Fatal accident count: 1Vehicles involved in fatal accidents: 1Fatal accidents caused by drunken drivers: 0Fatalities: 1Persons involved in fatal accidents: 1Pedestrians involved in fatal accidents: 0
Fatal accident statistics in 2013:
Fatal accident count: 2Vehicles involved in fatal accidents: 3Fatal accidents caused by drunken drivers: 0Fatalities: 2Persons involved in fatal accidents: 4Pedestrians involved in fatal accidents: 2
Home Mortgage Disclosure Act Aggregated Statistics For Year 2009(Based on 5 full and 10 partial tracts) A) FHA, FSA/RHS & VA B) Conventional C) Refinancings D) Home Improvement Loans E) Loans on Dwellings For 5+ Families F) Non-occupant Loans on G) Loans On Manufactured Number Average Value Number Average Value Number Average Value Number Average Value Number Average Value Number Average Value Number Average Value
LOANS ORIGINATED 93 $254,251 298 $259,647 759 $246,833 34 $85,228 10 $577,761 95 $243,234 1 $387,000 APPLICATIONS APPROVED, NOT ACCEPTED 4 $155,650 21 $278,280 98 $238,522 8 $22,559 3 $17,167,267 16 $208,390 0 $0 APPLICATIONS DENIED 7 $209,156 35 $216,748 296 $260,115 59 $55,108 4 $779,648 63 $257,367 1 $2,020 APPLICATIONS WITHDRAWN 12 $203,842 55 $273,075 201 $229,765 12 $85,967 2 $8,915,565 28 $234,549 0 $0 FILES CLOSED FOR INCOMPLETENESS 2 $239,735 19 $253,837 37 $265,665 3 $148,863 0 $0 8 $292,064 0 $0
Aggregated Statistics For Year 2008(Based on 5 full and 10 partial tracts) A) FHA, FSA/RHS & VA B) Conventional C) Refinancings D) Home Improvement Loans E) Loans on Dwellings For 5+ Families F) Non-occupant Loans on G) Loans On Manufactured Number Average Value Number Average Value Number Average Value Number Average Value Number Average Value Number Average Value Number Average Value
LOANS ORIGINATED 31 $266,557 476 $262,743 413 $225,448 72 $84,435 17 $956,475 142 $227,574 2 $78,100 APPLICATIONS APPROVED, NOT ACCEPTED 3 $261,097 54 $213,740 89 $209,808 16 $100,659 0 $0 31 $197,061 0 $0 APPLICATIONS DENIED 5 $165,756 73 $232,209 248 $194,093 99 $68,732 2 $989,120 67 $165,936 1 $2,000 APPLICATIONS WITHDRAWN 6 $275,550 38 $269,097 94 $213,590 10 $87,473 0 $0 24 $182,326 0 $0 FILES CLOSED FOR INCOMPLETENESS 3 $343,713 13 $352,160 24 $224,357 2 $39,840 1 $192,810 7 $234,290 0 $0
Aggregated Statistics For Year 2007(Based on 5 full and 10 partial tracts) A) FHA, FSA/RHS & VA B) Conventional C) Refinancings D) Home Improvement Loans E) Loans on Dwellings For 5+ Families F) Non-occupant Loans on Number Average Value Number Average Value Number Average Value Number Average Value Number Average Value Number Average Value
LOANS ORIGINATED 5 $243,344 677 $226,236 394 $202,602 91 $71,362 25 $2,534,193 192 $209,097 APPLICATIONS APPROVED, NOT ACCEPTED 0 $0 89 $254,912 116 $178,854 28 $100,415 2 $297,500 39 $211,206 APPLICATIONS DENIED 5 $230,030 89 $243,133 269 $200,390 104 $62,815 4 $609,910 99 $209,017 APPLICATIONS WITHDRAWN 1 $203,000 80 $241,181 135 $216,817 17 $154,624 2 $355,450 41 $241,471 FILES CLOSED FOR INCOMPLETENESS 0 $0 22 $210,257 44 $252,029 4 $52,072 0 $0 22 $261,460
Aggregated Statistics For Year 2006(Based on 5 full and 10 partial tracts) A) FHA, FSA/RHS & VA B) Conventional C) Refinancings D) Home Improvement Loans E) Loans on Dwellings For 5+ Families F) Non-occupant Loans on G) Loans On Manufactured Number Average Value Number Average Value Number Average Value Number Average Value Number Average Value Number Average Value Number Average Value
LOANS ORIGINATED 6 $125,193 833 $225,840 551 $175,598 172 $75,830 18 $6,111,777 287 $202,396 0 $0 APPLICATIONS APPROVED, NOT ACCEPTED 1 $113,530 156 $228,747 115 $178,523 44 $68,606 3 $101,000 52 $160,992 1 $140,000 APPLICATIONS DENIED 3 $167,993 153 $254,651 332 $167,224 126 $61,897 4 $174,470 120 $201,664 2 $33,000 APPLICATIONS WITHDRAWN 1 $162,000 119 $237,747 138 $156,873 27 $94,623 3 $3,812,823 54 $210,599 0 $0 FILES CLOSED FOR INCOMPLETENESS 0 $0 25 $229,132 78 $221,489 5 $147,070 0 $0 15 $204,595 0 $0
Aggregated Statistics For Year 2005(Based on 5 full and 10 partial tracts) A) FHA, FSA/RHS & VA B) Conventional C) Refinancings D) Home Improvement Loans E) Loans on Dwellings For 5+ Families F) Non-occupant Loans on G) Loans On Manufactured Number Average Value Number Average Value Number Average Value Number Average Value Number Average Value Number Average Value Number Average Value
LOANS ORIGINATED 6 $139,385 1,118 $200,070 619 $181,243 142 $64,464 21 $712,479 372 $172,223 2 $107,025 APPLICATIONS APPROVED, NOT ACCEPTED 0 $0 109 $199,456 144 $186,207 27 $34,109 0 $0 51 $172,781 0 $0 APPLICATIONS DENIED 1 $139,650 180 $183,472 308 $147,576 135 $46,222 0 $0 125 $132,217 3 $6,183 APPLICATIONS WITHDRAWN 0 $0 119 $202,734 175 $162,543 27 $138,427 4 $367,825 61 $172,132 0 $0 FILES CLOSED FOR INCOMPLETENESS 2 $102,170 72 $261,838 63 $168,347 8 $62,804 0 $0 17 $200,361 0 $0
Aggregated Statistics For Year 2004(Based on 5 full and 10 partial tracts) A) FHA, FSA/RHS & VA B) Conventional C) Refinancings D) Home Improvement Loans E) Loans on Dwellings For 5+ Families F) Non-occupant Loans on G) Loans On Manufactured Number Average Value Number Average Value Number Average Value Number Average Value Number Average Value Number Average Value Number Average Value
LOANS ORIGINATED 6 $156,398 998 $198,377 550 $155,161 132 $61,499 26 $369,063 321 $176,452 0 $0 APPLICATIONS APPROVED, NOT ACCEPTED 5 $110,122 93 $181,799 104 $147,013 33 $40,030 2 $346,255 37 $124,776 0 $0 APPLICATIONS DENIED 2 $221,500 151 $177,766 338 $126,910 153 $40,323 2 $100,065 125 $117,493 3 $29,073 APPLICATIONS WITHDRAWN 0 $0 115 $192,237 149 $145,941 18 $67,361 1 $360,000 44 $163,296 0 $0 FILES CLOSED FOR INCOMPLETENESS 0 $0 36 $163,173 75 $144,131 13 $80,140 1 $67,180 6 $92,545 0 $0
Aggregated Statistics For Year 2003(Based on 5 full and 10 partial tracts) A) FHA, FSA/RHS & VA B) Conventional C) Refinancings D) Home Improvement Loans E) Loans on Dwellings For 5+ Families F) Non-occupant Loans on Number Average Value Number Average Value Number Average Value Number Average Value Number Average Value Number Average Value
LOANS ORIGINATED 5 $102,896 883 $165,527 1,106 $145,268 80 $79,455 15 $296,726 341 $135,713 APPLICATIONS APPROVED, NOT ACCEPTED 0 $0 87 $166,150 199 $134,243 43 $49,577 1 $320,000 37 $138,027 APPLICATIONS DENIED 2 $144,565 108 $152,080 309 $113,552 111 $46,706 0 $0 54 $94,498 APPLICATIONS WITHDRAWN 1 $64,000 91 $164,636 156 $121,172 7 $25,620 1 $107,000 37 $125,403 FILES CLOSED FOR INCOMPLETENESS 0 $0 14 $174,286 31 $129,323 10 $104,493 0 $0 7 $95,306
Aggregated Statistics For Year 2002(Based on 5 full and 10 partial tracts) A) FHA, FSA/RHS & VA B) Conventional C) Refinancings D) Home Improvement Loans E) Loans on Dwellings For 5+ Families F) Non-occupant Loans on Number Average Value Number Average Value Number Average Value Number Average Value Number Average Value Number Average Value
LOANS ORIGINATED 13 $113,692 367 $601,421 665 $587,004 54 $33,375 14 $304,473 149 $1,228,380 APPLICATIONS APPROVED, NOT ACCEPTED 0 $0 39 $133,321 121 $110,120 34 $58,508 2 $273,045 30 $107,781 APPLICATIONS DENIED 2 $179,205 40 $103,082 262 $95,274 69 $37,326 1 $115,000 42 $103,520 APPLICATIONS WITHDRAWN 2 $81,920 44 $119,609 133 $695,599 6 $51,133 0 $0 15 $144,760 FILES CLOSED FOR INCOMPLETENESS 0 $0 10 $68,815 54 $97,852 2 $29,000 0 $0 2 $70,740
Aggregated Statistics For Year 2001(Based on 5 full and 10 partial tracts) A) FHA, FSA/RHS & VA B) Conventional C) Refinancings D) Home Improvement Loans E) Loans on Dwellings For 5+ Families F) Non-occupant Loans on Number Average Value Number Average Value Number Average Value Number Average Value Number Average Value Number Average Value
LOANS ORIGINATED 27 $98,115 344 $123,929 427 $113,003 84 $33,873 9 $233,887 96 $104,319 APPLICATIONS APPROVED, NOT ACCEPTED 1 $50,000 41 $118,674 90 $92,267 27 $23,048 0 $0 15 $132,385 APPLICATIONS DENIED 2 $74,200 54 $106,625 213 $66,116 87 $20,788 1 $199,680 29 $90,902 APPLICATIONS WITHDRAWN 4 $106,365 28 $130,152 115 $77,694 19 $19,869 2 $159,740 13 $87,894 FILES CLOSED FOR INCOMPLETENESS 0 $0 9 $120,657 38 $78,772 4 $22,750 0 $0 2 $76,965
Aggregated Statistics For Year 2000(Based on 5 full and 10 partial tracts) A) FHA, FSA/RHS & VA B) Conventional C) Refinancings D) Home Improvement Loans E) Loans on Dwellings For 5+ Families F) Non-occupant Loans on Number Average Value Number Average Value Number Average Value Number Average Value Number Average Value Number Average Value
LOANS ORIGINATED 24 $98,797 325 $108,865 181 $79,730 102 $23,680 6 $584,413 70 $91,386 APPLICATIONS APPROVED, NOT ACCEPTED 1 $90,000 30 $120,507 45 $57,578 31 $24,685 0 $0 9 $65,661 APPLICATIONS DENIED 2 $141,500 57 $74,857 183 $56,716 99 $18,349 4 $277,912 32 $94,244 APPLICATIONS WITHDRAWN 3 $109,667 45 $96,435 109 $58,654 19 $33,764 0 $0 22 $83,400 FILES CLOSED FOR INCOMPLETENESS 2 $51,445 8 $157,780 56 $70,128 6 $50,310 0 $0 2 $45,575
Aggregated Statistics For Year 1999(Based on 4 full and 5 partial tracts) A) FHA, FSA/RHS & VA B) Conventional C) Refinancings D) Home Improvement Loans E) Loans on Dwellings For 5+ Families F) Non-occupant Loans on Number Average Value Number Average Value Number Average Value Number Average Value Number Average Value Number Average Value
LOANS ORIGINATED 49 $90,542 329 $101,758 263 $79,342 62 $18,402 5 $139,000 77 $90,329 APPLICATIONS APPROVED, NOT ACCEPTED 1 $117,120 28 $66,519 54 $46,063 32 $18,698 0 $0 6 $65,343 APPLICATIONS DENIED 6 $77,357 52 $83,220 176 $57,836 79 $13,361 0 $0 29 $76,660 APPLICATIONS WITHDRAWN 4 $71,235 35 $94,467 100 $59,975 20 $37,192 0 $0 18 $63,407 FILES CLOSED FOR INCOMPLETENESS 1 $55,000 12 $83,500 48 $61,638 1 $28,000 0 $0 11 $77,339
Private Mortgage Insurance Companies Aggregated Statistics For Year 2009(Based on 5 full and 6 partial tracts) A) Conventional B) Refinancings Number Average Value Number Average Value
LOANS ORIGINATED 74 $272,458 28 $307,231 APPLICATIONS APPROVED, NOT ACCEPTED 14 $240,361 11 $298,779 APPLICATIONS DENIED 5 $328,766 8 $375,375 APPLICATIONS WITHDRAWN 10 $279,607 5 $311,106 FILES CLOSED FOR INCOMPLETENESS 2 $240,400 2 $265,130
Aggregated Statistics For Year 2008(Based on 5 full and 8 partial tracts) A) Conventional B) Refinancings C) Non-occupant Loans on Number Average Value Number Average Value Number Average Value
LOANS ORIGINATED 127 $266,109 35 $259,011 13 $202,620 APPLICATIONS APPROVED, NOT ACCEPTED 29 $224,080 5 $301,122 4 $90,488 APPLICATIONS DENIED 13 $232,244 1 $157,000 7 $231,169 APPLICATIONS WITHDRAWN 4 $239,798 2 $418,120 0 $0 FILES CLOSED FOR INCOMPLETENESS 2 $203,070 0 $0 0 $0
Aggregated Statistics For Year 2007(Based on 5 full and 10 partial tracts) A) Conventional B) Refinancings C) Non-occupant Loans on Number Average Value Number Average Value Number Average Value
LOANS ORIGINATED 121 $251,121 18 $248,868 17 $217,998 APPLICATIONS APPROVED, NOT ACCEPTED 10 $207,535 7 $299,537 1 $439,000 APPLICATIONS DENIED 0 $0 0 $0 0 $0 APPLICATIONS WITHDRAWN 3 $327,667 1 $560,000 0 $0 FILES CLOSED FOR INCOMPLETENESS 0 $0 0 $0 0 $0
Aggregated Statistics For Year 2006(Based on 5 full and 8 partial tracts) A) Conventional B) Refinancings C) Non-occupant Loans on Number Average Value Number Average Value Number Average Value
LOANS ORIGINATED 83 $238,861 10 $292,923 8 $215,326 APPLICATIONS APPROVED, NOT ACCEPTED 11 $202,949 2 $127,125 5 $89,058 APPLICATIONS DENIED 1 $78,540 0 $0 1 $78,540 APPLICATIONS WITHDRAWN 8 $312,045 1 $203,000 4 $365,908 FILES CLOSED FOR INCOMPLETENESS 0 $0 0 $0 0 $0
Aggregated Statistics For Year 2005(Based on 5 full and 8 partial tracts) A) Conventional B) Refinancings C) Non-occupant Loans on Number Average Value Number Average Value Number Average Value
LOANS ORIGINATED 154 $221,599 17 $242,009 30 $190,283 APPLICATIONS APPROVED, NOT ACCEPTED 33 $233,810 5 $221,872 3 $92,977 APPLICATIONS DENIED 1 $237,000 1 $33,280 0 $0 APPLICATIONS WITHDRAWN 6 $221,200 0 $0 1 $221,000 FILES CLOSED FOR INCOMPLETENESS 0 $0 0 $0 0 $0
Aggregated Statistics For Year 2004(Based on 5 full and 10 partial tracts) A) Conventional B) Refinancings C) Non-occupant Loans on Number Average Value Number Average Value Number Average Value
LOANS ORIGINATED 151 $211,474 19 $206,489 17 $211,866 APPLICATIONS APPROVED, NOT ACCEPTED 24 $182,895 9 $145,777 8 $163,025 APPLICATIONS DENIED 3 $235,667 0 $0 1 $202,000 APPLICATIONS WITHDRAWN 10 $206,422 2 $87,060 1 $36,280 FILES CLOSED FOR INCOMPLETENESS 3 $193,667 0 $0 2 $200,000
Aggregated Statistics For Year 2003(Based on 5 full and 8 partial tracts) A) Conventional B) Refinancings C) Non-occupant Loans on Number Average Value Number Average Value Number Average Value
LOANS ORIGINATED 198 $175,681 44 $157,332 39 $161,047 APPLICATIONS APPROVED, NOT ACCEPTED 13 $143,854 10 $177,900 4 $140,770 APPLICATIONS DENIED 4 $155,870 0 $0 2 $188,420 APPLICATIONS WITHDRAWN 6 $187,842 7 $165,817 1 $140,000 FILES CLOSED FOR INCOMPLETENESS 0 $0 0 $0 0 $0
Aggregated Statistics For Year 2002(Based on 5 full and 10 partial tracts) A) Conventional B) Refinancings C) Non-occupant Loans on Number Average Value Number Average Value Number Average Value
LOANS ORIGINATED 150 $141,179 14 $148,316 27 $104,153 APPLICATIONS APPROVED, NOT ACCEPTED 34 $154,922 7 $114,346 2 $71,315 APPLICATIONS DENIED 1 $36,610 1 $270,000 0 $0 APPLICATIONS WITHDRAWN 2 $203,910 2 $129,500 1 $70,000 FILES CLOSED FOR INCOMPLETENESS 0 $0 0 $0 0 $0
Aggregated Statistics For Year 2001(Based on 5 full and 8 partial tracts) A) Conventional B) Refinancings C) Non-occupant Loans on Number Average Value Number Average Value Number Average Value
LOANS ORIGINATED 138 $132,112 18 $122,623 10 $83,415 APPLICATIONS APPROVED, NOT ACCEPTED 17 $155,294 7 $113,199 1 $131,000 APPLICATIONS DENIED 1 $126,000 0 $0 1 $126,000 APPLICATIONS WITHDRAWN 1 $82,000 0 $0 0 $0 FILES CLOSED FOR INCOMPLETENESS 0 $0 0 $0 0 $0
Aggregated Statistics For Year 2000(Based on 5 full and 8 partial tracts) A) Conventional B) Refinancings C) Non-occupant Loans on Number Average Value Number Average Value Number Average Value
LOANS ORIGINATED 105 $119,075 14 $87,457 9 $66,404 APPLICATIONS APPROVED, NOT ACCEPTED 16 $96,638 2 $69,985 0 $0 APPLICATIONS DENIED 0 $0 0 $0 0 $0 APPLICATIONS WITHDRAWN 3 $76,000 1 $53,910 2 $63,455 FILES CLOSED FOR INCOMPLETENESS 2 $171,500 0 $0 1 $245,000
Aggregated Statistics For Year 1999(Based on 4 full and 4 partial tracts) A) Conventional B) Refinancings C) Non-occupant Loans on Number Average Value Number Average Value Number Average Value
LOANS ORIGINATED 123 $116,305 22 $79,508 10 $67,238 APPLICATIONS APPROVED, NOT ACCEPTED 16 $104,158 6 $89,833 1 $54,000 APPLICATIONS DENIED 9 $80,708 1 $63,000 2 $37,185 APPLICATIONS WITHDRAWN 3 $147,090 1 $100,000 0 $0 FILES CLOSED FOR INCOMPLETENESS 0 $0 1 $143,000 0 $0
2010 - 2018 National Fire Incident Reporting System (NFIRS) incidents See full 2006 National Fire Incident Reporting System statistics for zip code 19130, Pennsylvania
Most common first names in zip code 19130 among deceased individuals Name Count Lived (average)
John 391 72.3 years Mary 363 79.6 years William 318 72.1 years James 293 69.1 years Joseph 291 72.4 years Anna 185 79.9 years Charles 176 71.8 years George 155 72.4 years Edward 147 72.1 years Robert 141 67.9 years
Most common last names in zip code 19130 among deceased individuals Last name Count Lived (average)
Smith 124 72.5 years Williams 93 70.4 years Brown 82 70.6 years Jones 77 69.4 years Johnson 76 71.9 years Miller 71 74.5 years Jackson 52 73.2 years Davis 45 71.7 years Moore 40 73.2 years Wilson 37 70.5 years
Businesses in zip code 19130
Name Count Name Count
Ace Hardware 1 GNC 1 Best Western 1 New Balance 1 CVS 2 Rite Aid 2 Cricket Wireless 2 Starbucks 1 Domino's Pizza 1 True Value 1 Dunkin Donuts 1 UPS 3 FedEx 5 Whole Foods Market 1

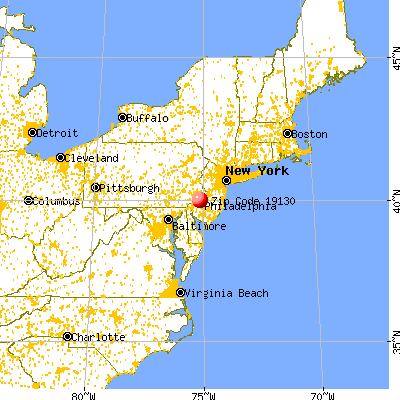


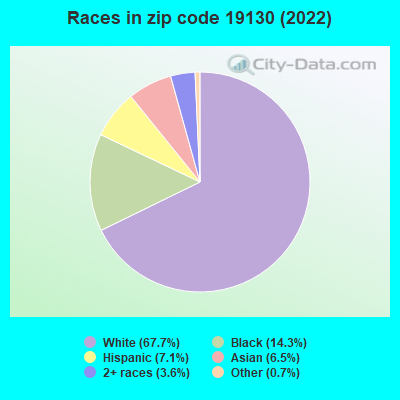


 Nearest zip codes: 19121, 19103, 19102, 19109, 19107, 19104.
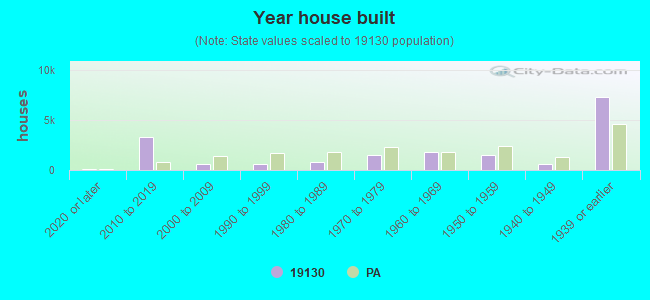

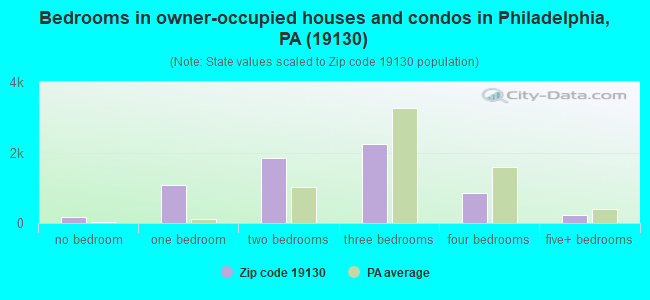
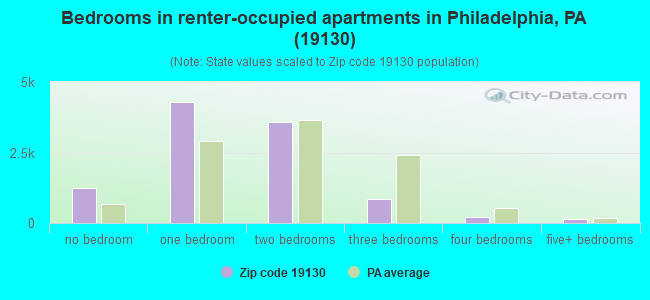
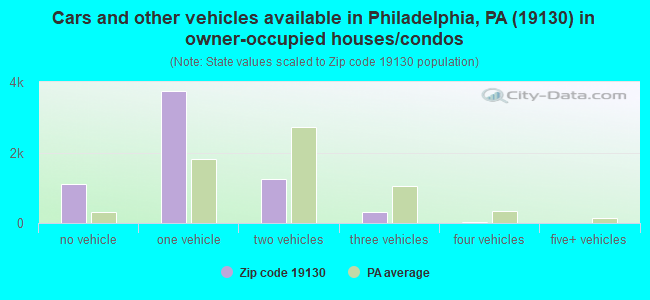
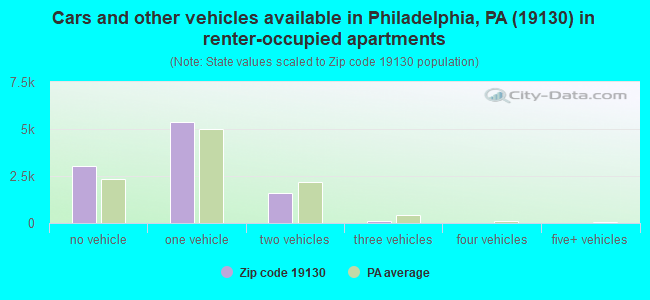


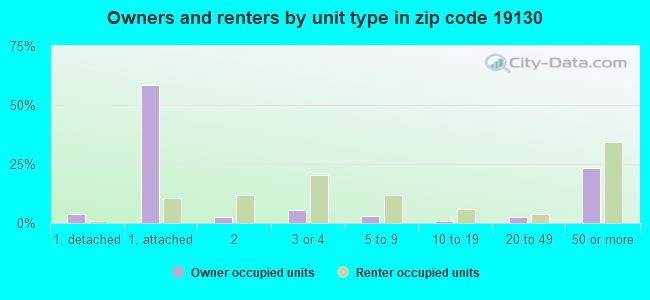
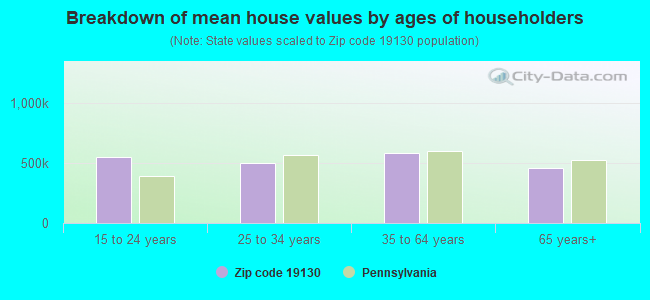
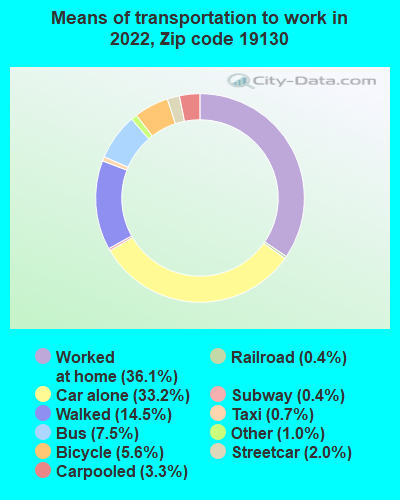

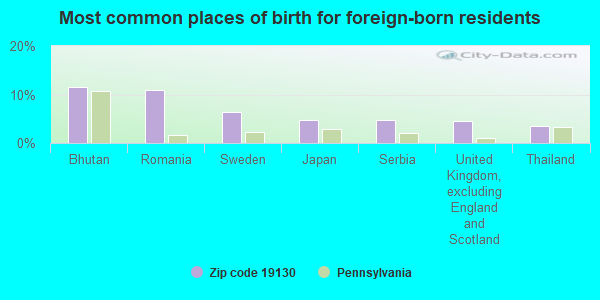
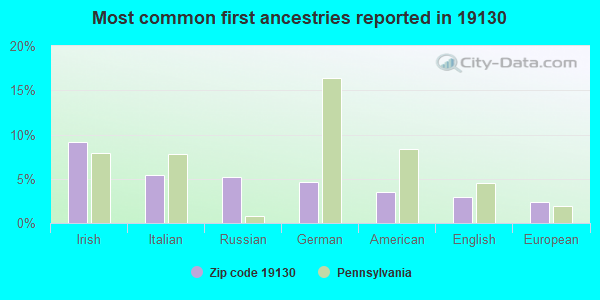
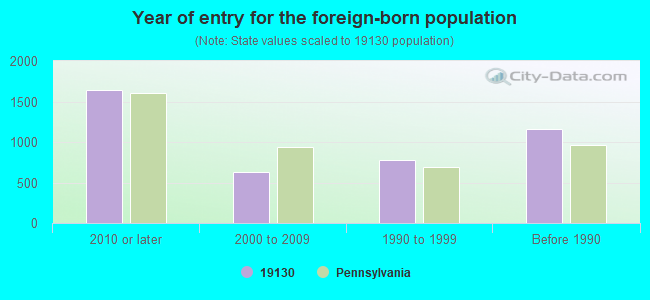
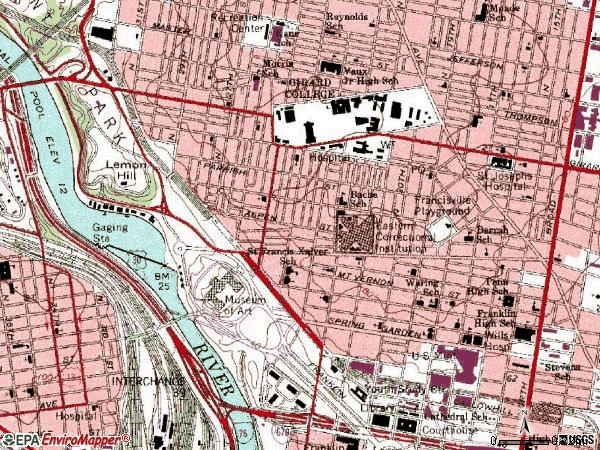

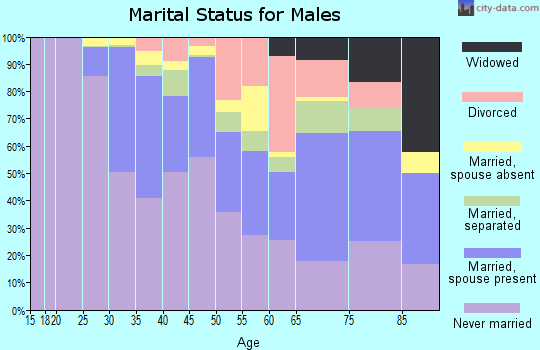
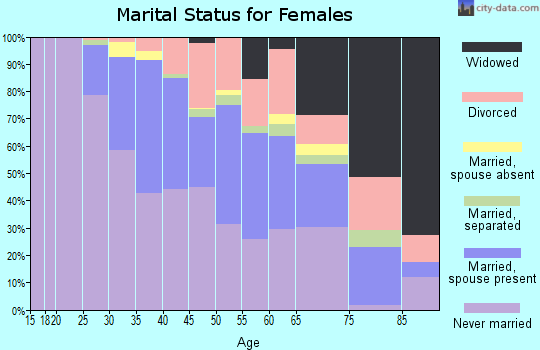
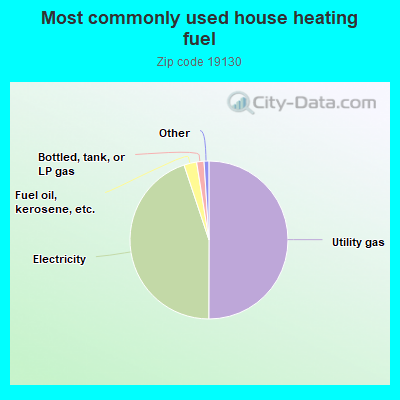
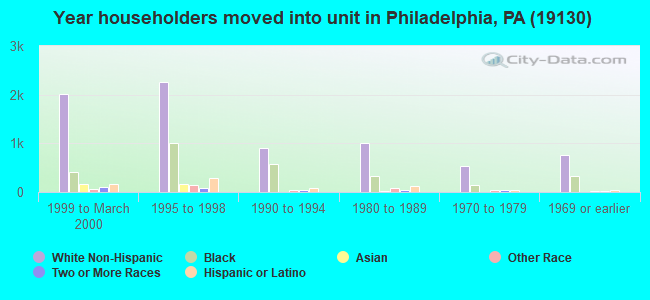
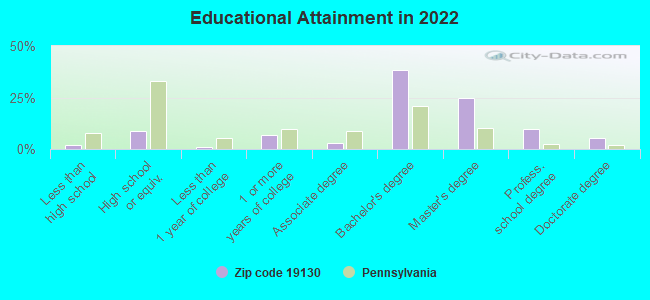
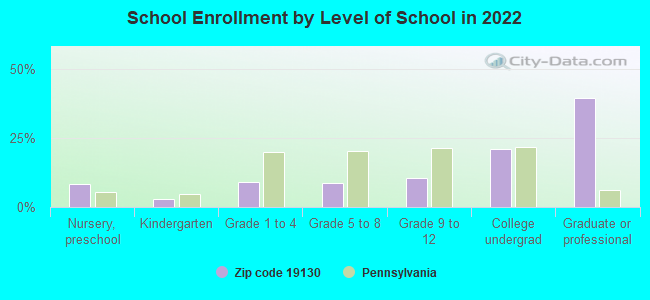
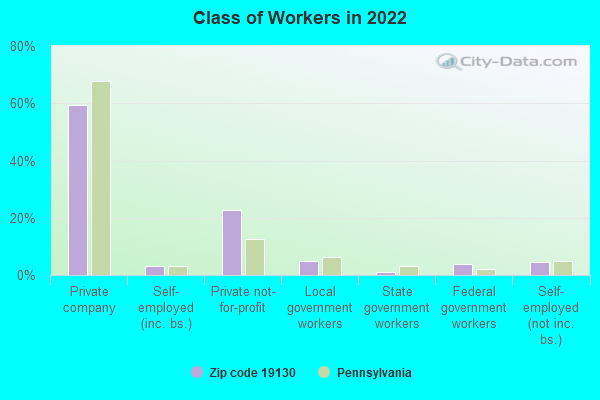
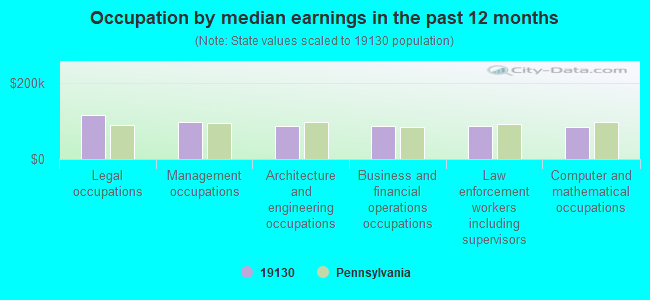
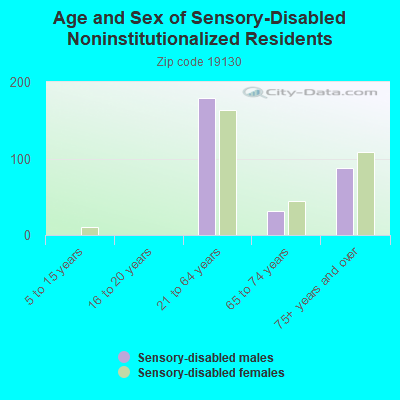
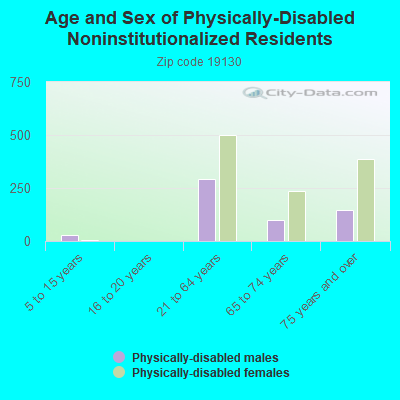
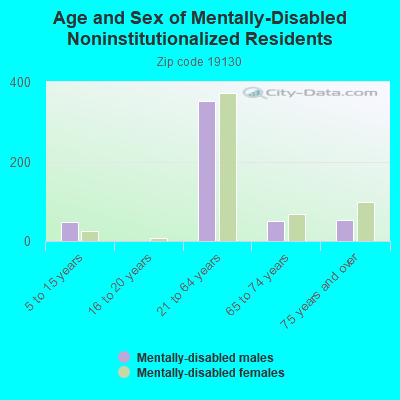
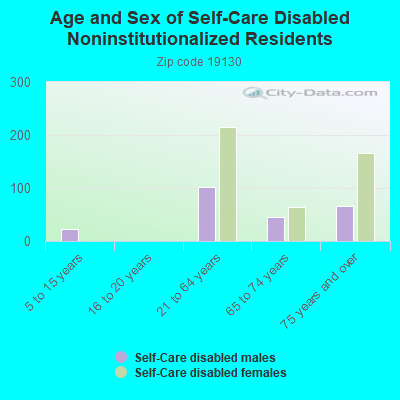
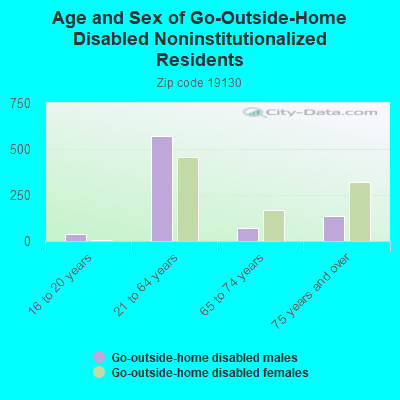
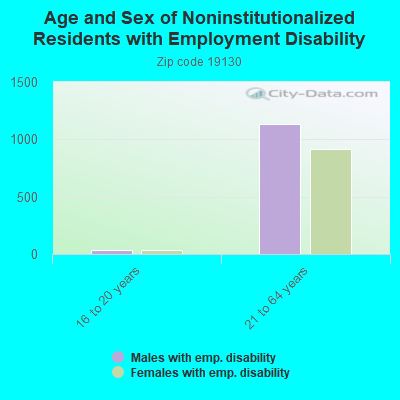
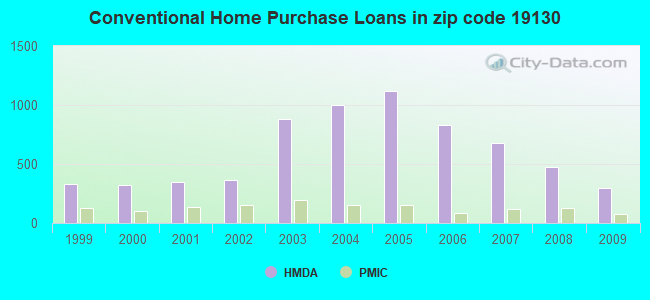
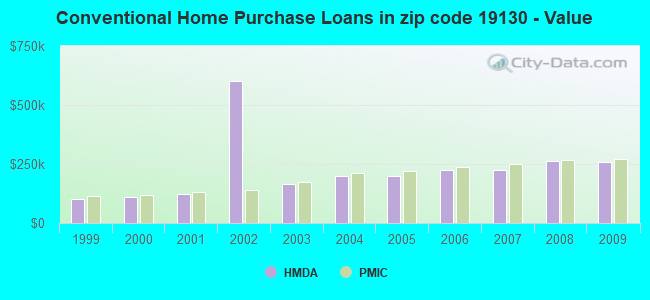
 According to the data from the years 2010 - 2018 the average number of fire incidents per year is 61. The highest number of reported fires - 105 took place in 2010, and the least - 0 in 2016. The data has a dropping trend.
 When looking into fire subcategories, the most reports belonged to: Structure Fires (48.2%), and Outside Fires (36.1%).