Estimated zip code population in 2022: 17,603
Zip code population in 2010: 15,758
Zip code population in 2000: 16,484
Houses and condos: 7,174
Renter-occupied apartments: 2,486
% of renters here:
38%State:
31%
March 2022 cost of living index in zip code 19126: 102.9
(near average, U.S. average is 100)
Land area: 1.1
sq. mi.
Water area: 0.0
sq. mi.
Population density: 15,403 people per square mile (very high).
OSM Map
General Map
Google Map
MSN Map
OSM Map
General Map
Google Map
MSN Map
OSM Map
General Map
Google Map
MSN Map
OSM Map
General Map
Google Map
MSN Map
Please wait while loading the map...
Real estate property taxes paid for housing units in 2022:
This zip code:
0.8% ($1,663)Pennsylvania:
1.3% ($3,094)
Median real estate property taxes paid for housing units with mortgages in 2022: $1,720 (0.8%)
Median real estate property taxes paid for housing units with no mortgage in 2022: $1,619 (0.9%)
Profiles of local businesses
Business Search - 14 Million verified businesses
Males: 8,271 Females: 9,332
For population 25 years and over in 19126:
High school or higher: 92.0%Bachelor's degree or higher: 24.8%Graduate or professional degree: 9.8%Unemployed: 7.7%Mean travel time to work (commute): 34.1 minutes
For population 15 years and over in 19126:
Never married: 52.2%Now married: 30.6%Separated: 2.3%Widowed: 6.2%Divorced: 8.7%
Zip code 19126 compared to state average:
Unemployed percentage above state average. Black race population percentage significantly above state average. Hispanic race population percentage below state average. Length of stay since moving in significantly above state average. 14,513 82.5% Black 1,278 7.3% White 718 4.1% Two or more races 652 3.7% Hispanic or Latino 363 2.1% Asian 57 0.3% American Indian 19 0.1% Some other race
Data:
Median household income ($)
Median household income (% change since 2000)
Household income diversity
Ratio of average income to average house value (%)
Ratio of average income to average rent
Median household income ($) - White
Median household income ($) - Black or African American
Median household income ($) - Asian
Median household income ($) - Hispanic or Latino
Median household income ($) - American Indian and Alaska Native
Median household income ($) - Multirace
Median household income ($) - Other Race
Median household income for houses/condos with a mortgage ($)
Median household income for apartments without a mortgage ($)
Races - White alone (%)
Races - White alone (% change since 2000)
Races - Black alone (%)
Races - Black alone (% change since 2000)
Races - American Indian alone (%)
Races - American Indian alone (% change since 2000)
Races - Asian alone (%)
Races - Asian alone (% change since 2000)
Races - Hispanic (%)
Races - Hispanic (% change since 2000)
Races - Native Hawaiian and Other Pacific Islander alone (%)
Races - Native Hawaiian and Other Pacific Islander alone (% change since 2000)
Races - Two or more races (%)
Races - Two or more races (% change since 2000)
Races - Other race alone (%)
Races - Other race alone (% change since 2000)
Racial diversity
Unemployment (%)
Unemployment (% change since 2000)
Unemployment (%) - White
Unemployment (%) - Black or African American
Unemployment (%) - Asian
Unemployment (%) - Hispanic or Latino
Unemployment (%) - American Indian and Alaska Native
Unemployment (%) - Multirace
Unemployment (%) - Other Race
Population density (people per square mile)
Population - Males (%)
Population - Females (%)
Population - Males (%) - White
Population - Males (%) - Black or African American
Population - Males (%) - Asian
Population - Males (%) - Hispanic or Latino
Population - Males (%) - American Indian and Alaska Native
Population - Males (%) - Multirace
Population - Males (%) - Other Race
Population - Females (%) - White
Population - Females (%) - Black or African American
Population - Females (%) - Asian
Population - Females (%) - Hispanic or Latino
Population - Females (%) - American Indian and Alaska Native
Population - Females (%) - Multirace
Population - Females (%) - Other Race
Coronavirus confirmed cases (Apr 27, 2024)
Deaths caused by coronavirus (Apr 27, 2024)
Coronavirus confirmed cases (per 100k population) (Apr 27, 2024)
Deaths caused by coronavirus (per 100k population) (Apr 27, 2024)
Daily increase in number of cases (Apr 27, 2024)
Weekly increase in number of cases (Apr 27, 2024)
Cases doubled (in days) (Apr 27, 2024)
Hospitalized patients (Apr 18, 2022)
Negative test results (Apr 18, 2022)
Total test results (Apr 18, 2022)
COVID Vaccine doses distributed (per 100k population) (Sep 19, 2023)
COVID Vaccine doses administered (per 100k population) (Sep 19, 2023)
COVID Vaccine doses distributed (Sep 19, 2023)
COVID Vaccine doses administered (Sep 19, 2023)
Likely homosexual households (%)
Likely homosexual households (% change since 2000)
Likely homosexual households - Lesbian couples (%)
Likely homosexual households - Lesbian couples (% change since 2000)
Likely homosexual households - Gay men (%)
Likely homosexual households - Gay men (% change since 2000)
Cost of living index
Median gross rent ($)
Median contract rent ($)
Median monthly housing costs ($)
Median house or condo value ($)
Median house or condo value ($ change since 2000)
Mean house or condo value by units in structure - 1, detached ($)
Mean house or condo value by units in structure - 1, attached ($)
Mean house or condo value by units in structure - 2 ($)
Mean house or condo value by units in structure by units in structure - 3 or 4 ($)
Mean house or condo value by units in structure - 5 or more ($)
Mean house or condo value by units in structure - Boat, RV, van, etc. ($)
Mean house or condo value by units in structure - Mobile home ($)
Median house or condo value ($) - White
Median house or condo value ($) - Black or African American
Median house or condo value ($) - Asian
Median house or condo value ($) - Hispanic or Latino
Median house or condo value ($) - American Indian and Alaska Native
Median house or condo value ($) - Multirace
Median house or condo value ($) - Other Race
Median resident age
Resident age diversity
Median resident age - Males
Median resident age - Females
Median resident age - White
Median resident age - Black or African American
Median resident age - Asian
Median resident age - Hispanic or Latino
Median resident age - American Indian and Alaska Native
Median resident age - Multirace
Median resident age - Other Race
Median resident age - Males - White
Median resident age - Males - Black or African American
Median resident age - Males - Asian
Median resident age - Males - Hispanic or Latino
Median resident age - Males - American Indian and Alaska Native
Median resident age - Males - Multirace
Median resident age - Males - Other Race
Median resident age - Females - White
Median resident age - Females - Black or African American
Median resident age - Females - Asian
Median resident age - Females - Hispanic or Latino
Median resident age - Females - American Indian and Alaska Native
Median resident age - Females - Multirace
Median resident age - Females - Other Race
Commute - mean travel time to work (minutes)
Travel time to work - Less than 5 minutes (%)
Travel time to work - Less than 5 minutes (% change since 2000)
Travel time to work - 5 to 9 minutes (%)
Travel time to work - 5 to 9 minutes (% change since 2000)
Travel time to work - 10 to 19 minutes (%)
Travel time to work - 10 to 19 minutes (% change since 2000)
Travel time to work - 20 to 29 minutes (%)
Travel time to work - 20 to 29 minutes (% change since 2000)
Travel time to work - 30 to 39 minutes (%)
Travel time to work - 30 to 39 minutes (% change since 2000)
Travel time to work - 40 to 59 minutes (%)
Travel time to work - 40 to 59 minutes (% change since 2000)
Travel time to work - 60 to 89 minutes (%)
Travel time to work - 60 to 89 minutes (% change since 2000)
Travel time to work - 90 or more minutes (%)
Travel time to work - 90 or more minutes (% change since 2000)
Marital status - Never married (%)
Marital status - Now married (%)
Marital status - Separated (%)
Marital status - Widowed (%)
Marital status - Divorced (%)
Median family income ($)
Median family income (% change since 2000)
Median non-family income ($)
Median non-family income (% change since 2000)
Median per capita income ($)
Median per capita income (% change since 2000)
Median family income ($) - White
Median family income ($) - Black or African American
Median family income ($) - Asian
Median family income ($) - Hispanic or Latino
Median family income ($) - American Indian and Alaska Native
Median family income ($) - Multirace
Median family income ($) - Other Race
Median year house/condo built
Median year apartment built
Year house built - Built 2005 or later (%)
Year house built - Built 2000 to 2004 (%)
Year house built - Built 1990 to 1999 (%)
Year house built - Built 1980 to 1989 (%)
Year house built - Built 1970 to 1979 (%)
Year house built - Built 1960 to 1969 (%)
Year house built - Built 1950 to 1959 (%)
Year house built - Built 1940 to 1949 (%)
Year house built - Built 1939 or earlier (%)
Average household size
Household density (households per square mile)
Average household size - White
Average household size - Black or African American
Average household size - Asian
Average household size - Hispanic or Latino
Average household size - American Indian and Alaska Native
Average household size - Multirace
Average household size - Other Race
Occupied housing units (%)
Vacant housing units (%)
Owner occupied housing units (%)
Renter occupied housing units (%)
Vacancy status - For rent (%)
Vacancy status - For sale only (%)
Vacancy status - Rented or sold, not occupied (%)
Vacancy status - For seasonal, recreational, or occasional use (%)
Vacancy status - For migrant workers (%)
Vacancy status - Other vacant (%)
Residents with income below the poverty level (%)
Residents with income below 50% of the poverty level (%)
Children below poverty level (%)
Poor families by family type - Married-couple family (%)
Poor families by family type - Male, no wife present (%)
Poor families by family type - Female, no husband present (%)
Poverty status for native-born residents (%)
Poverty status for foreign-born residents (%)
Poverty among high school graduates not in families (%)
Poverty among people who did not graduate high school not in families (%)
Residents with income below the poverty level (%) - White
Residents with income below the poverty level (%) - Black or African American
Residents with income below the poverty level (%) - Asian
Residents with income below the poverty level (%) - Hispanic or Latino
Residents with income below the poverty level (%) - American Indian and Alaska Native
Residents with income below the poverty level (%) - Multirace
Residents with income below the poverty level (%) - Other Race
Air pollution - Air Quality Index (AQI)
Air pollution - CO
Air pollution - NO2
Air pollution - SO2
Air pollution - Ozone
Air pollution - PM10
Air pollution - PM25
Air pollution - Pb
Crime - Murders per 100,000 population
Crime - Rapes per 100,000 population
Crime - Robberies per 100,000 population
Crime - Assaults per 100,000 population
Crime - Burglaries per 100,000 population
Crime - Thefts per 100,000 population
Crime - Auto thefts per 100,000 population
Crime - Arson per 100,000 population
Crime - City-data.com crime index
Crime - Violent crime index
Crime - Property crime index
Crime - Murders per 100,000 population (5 year average)
Crime - Rapes per 100,000 population (5 year average)
Crime - Robberies per 100,000 population (5 year average)
Crime - Assaults per 100,000 population (5 year average)
Crime - Burglaries per 100,000 population (5 year average)
Crime - Thefts per 100,000 population (5 year average)
Crime - Auto thefts per 100,000 population (5 year average)
Crime - Arson per 100,000 population (5 year average)
Crime - City-data.com crime index (5 year average)
Crime - Violent crime index (5 year average)
Crime - Property crime index (5 year average)
1996 Presidential Elections Results (%) - Democratic Party (Clinton)
1996 Presidential Elections Results (%) - Republican Party (Dole)
1996 Presidential Elections Results (%) - Other
2000 Presidential Elections Results (%) - Democratic Party (Gore)
2000 Presidential Elections Results (%) - Republican Party (Bush)
2000 Presidential Elections Results (%) - Other
2004 Presidential Elections Results (%) - Democratic Party (Kerry)
2004 Presidential Elections Results (%) - Republican Party (Bush)
2004 Presidential Elections Results (%) - Other
2008 Presidential Elections Results (%) - Democratic Party (Obama)
2008 Presidential Elections Results (%) - Republican Party (McCain)
2008 Presidential Elections Results (%) - Other
2012 Presidential Elections Results (%) - Democratic Party (Obama)
2012 Presidential Elections Results (%) - Republican Party (Romney)
2012 Presidential Elections Results (%) - Other
2016 Presidential Elections Results (%) - Democratic Party (Clinton)
2016 Presidential Elections Results (%) - Republican Party (Trump)
2016 Presidential Elections Results (%) - Other
2020 Presidential Elections Results (%) - Democratic Party (Biden)
2020 Presidential Elections Results (%) - Republican Party (Trump)
2020 Presidential Elections Results (%) - Other
Ancestries Reported - Arab (%)
Ancestries Reported - Czech (%)
Ancestries Reported - Danish (%)
Ancestries Reported - Dutch (%)
Ancestries Reported - English (%)
Ancestries Reported - French (%)
Ancestries Reported - French Canadian (%)
Ancestries Reported - German (%)
Ancestries Reported - Greek (%)
Ancestries Reported - Hungarian (%)
Ancestries Reported - Irish (%)
Ancestries Reported - Italian (%)
Ancestries Reported - Lithuanian (%)
Ancestries Reported - Norwegian (%)
Ancestries Reported - Polish (%)
Ancestries Reported - Portuguese (%)
Ancestries Reported - Russian (%)
Ancestries Reported - Scotch-Irish (%)
Ancestries Reported - Scottish (%)
Ancestries Reported - Slovak (%)
Ancestries Reported - Subsaharan African (%)
Ancestries Reported - Swedish (%)
Ancestries Reported - Swiss (%)
Ancestries Reported - Ukrainian (%)
Ancestries Reported - United States (%)
Ancestries Reported - Welsh (%)
Ancestries Reported - West Indian (%)
Ancestries Reported - Other (%)
Educational Attainment - No schooling completed (%)
Educational Attainment - Less than high school (%)
Educational Attainment - High school or equivalent (%)
Educational Attainment - Less than 1 year of college (%)
Educational Attainment - 1 or more years of college (%)
Educational Attainment - Associate degree (%)
Educational Attainment - Bachelor's degree (%)
Educational Attainment - Master's degree (%)
Educational Attainment - Professional school degree (%)
Educational Attainment - Doctorate degree (%)
School Enrollment - Nursery, preschool (%)
School Enrollment - Kindergarten (%)
School Enrollment - Grade 1 to 4 (%)
School Enrollment - Grade 5 to 8 (%)
School Enrollment - Grade 9 to 12 (%)
School Enrollment - College undergrad (%)
School Enrollment - Graduate or professional (%)
School Enrollment - Not enrolled in school (%)
School enrollment - Public schools (%)
School enrollment - Private schools (%)
School enrollment - Not enrolled (%)
Median number of rooms in houses and condos
Median number of rooms in apartments
Housing units lacking complete plumbing facilities (%)
Housing units lacking complete kitchen facilities (%)
Density of houses
Urban houses (%)
Rural houses (%)
Households with people 60 years and over (%)
Households with people 65 years and over (%)
Households with people 75 years and over (%)
Households with one or more nonrelatives (%)
Households with no nonrelatives (%)
Population in households (%)
Family households (%)
Nonfamily households (%)
Population in families (%)
Family households with own children (%)
Median number of bedrooms in owner occupied houses
Mean number of bedrooms in owner occupied houses
Median number of bedrooms in renter occupied houses
Mean number of bedrooms in renter occupied houses
Median number of vehichles in owner occupied houses
Mean number of vehichles in owner occupied houses
Median number of vehichles in renter occupied houses
Mean number of vehichles in renter occupied houses
Mortgage status - with mortgage (%)
Mortgage status - with second mortgage (%)
Mortgage status - with home equity loan (%)
Mortgage status - with both second mortgage and home equity loan (%)
Mortgage status - without a mortgage (%)
Average family size
Average family size - White
Average family size - Black or African American
Average family size - Asian
Average family size - Hispanic or Latino
Average family size - American Indian and Alaska Native
Average family size - Multirace
Average family size - Other Race
Geographical mobility - Same house 1 year ago (%)
Geographical mobility - Moved within same county (%)
Geographical mobility - Moved from different county within same state (%)
Geographical mobility - Moved from different state (%)
Geographical mobility - Moved from abroad (%)
Place of birth - Born in state of residence (%)
Place of birth - Born in other state (%)
Place of birth - Native, outside of US (%)
Place of birth - Foreign born (%)
Housing units in structures - 1, detached (%)
Housing units in structures - 1, attached (%)
Housing units in structures - 2 (%)
Housing units in structures - 3 or 4 (%)
Housing units in structures - 5 to 9 (%)
Housing units in structures - 10 to 19 (%)
Housing units in structures - 20 to 49 (%)
Housing units in structures - 50 or more (%)
Housing units in structures - Mobile home (%)
Housing units in structures - Boat, RV, van, etc. (%)
House/condo owner moved in on average (years ago)
Renter moved in on average (years ago)
Year householder moved into unit - Moved in 1999 to March 2000 (%)
Year householder moved into unit - Moved in 1995 to 1998 (%)
Year householder moved into unit - Moved in 1990 to 1994 (%)
Year householder moved into unit - Moved in 1980 to 1989 (%)
Year householder moved into unit - Moved in 1970 to 1979 (%)
Year householder moved into unit - Moved in 1969 or earlier (%)
Means of transportation to work - Drove car alone (%)
Means of transportation to work - Carpooled (%)
Means of transportation to work - Public transportation (%)
Means of transportation to work - Bus or trolley bus (%)
Means of transportation to work - Streetcar or trolley car (%)
Means of transportation to work - Subway or elevated (%)
Means of transportation to work - Railroad (%)
Means of transportation to work - Ferryboat (%)
Means of transportation to work - Taxicab (%)
Means of transportation to work - Motorcycle (%)
Means of transportation to work - Bicycle (%)
Means of transportation to work - Walked (%)
Means of transportation to work - Other means (%)
Working at home (%)
Industry diversity
Most Common Industries - Agriculture, forestry, fishing and hunting, and mining (%)
Most Common Industries - Agriculture, forestry, fishing and hunting (%)
Most Common Industries - Mining, quarrying, and oil and gas extraction (%)
Most Common Industries - Construction (%)
Most Common Industries - Manufacturing (%)
Most Common Industries - Wholesale trade (%)
Most Common Industries - Retail trade (%)
Most Common Industries - Transportation and warehousing, and utilities (%)
Most Common Industries - Transportation and warehousing (%)
Most Common Industries - Utilities (%)
Most Common Industries - Information (%)
Most Common Industries - Finance and insurance, and real estate and rental and leasing (%)
Most Common Industries - Finance and insurance (%)
Most Common Industries - Real estate and rental and leasing (%)
Most Common Industries - Professional, scientific, and management, and administrative and waste management services (%)
Most Common Industries - Professional, scientific, and technical services (%)
Most Common Industries - Management of companies and enterprises (%)
Most Common Industries - Administrative and support and waste management services (%)
Most Common Industries - Educational services, and health care and social assistance (%)
Most Common Industries - Educational services (%)
Most Common Industries - Health care and social assistance (%)
Most Common Industries - Arts, entertainment, and recreation, and accommodation and food services (%)
Most Common Industries - Arts, entertainment, and recreation (%)
Most Common Industries - Accommodation and food services (%)
Most Common Industries - Other services, except public administration (%)
Most Common Industries - Public administration (%)
Occupation diversity
Most Common Occupations - Management, business, science, and arts occupations (%)
Most Common Occupations - Management, business, and financial occupations (%)
Most Common Occupations - Management occupations (%)
Most Common Occupations - Business and financial operations occupations (%)
Most Common Occupations - Computer, engineering, and science occupations (%)
Most Common Occupations - Computer and mathematical occupations (%)
Most Common Occupations - Architecture and engineering occupations (%)
Most Common Occupations - Life, physical, and social science occupations (%)
Most Common Occupations - Education, legal, community service, arts, and media occupations (%)
Most Common Occupations - Community and social service occupations (%)
Most Common Occupations - Legal occupations (%)
Most Common Occupations - Education, training, and library occupations (%)
Most Common Occupations - Arts, design, entertainment, sports, and media occupations (%)
Most Common Occupations - Healthcare practitioners and technical occupations (%)
Most Common Occupations - Health diagnosing and treating practitioners and other technical occupations (%)
Most Common Occupations - Health technologists and technicians (%)
Most Common Occupations - Service occupations (%)
Most Common Occupations - Healthcare support occupations (%)
Most Common Occupations - Protective service occupations (%)
Most Common Occupations - Fire fighting and prevention, and other protective service workers including supervisors (%)
Most Common Occupations - Law enforcement workers including supervisors (%)
Most Common Occupations - Food preparation and serving related occupations (%)
Most Common Occupations - Building and grounds cleaning and maintenance occupations (%)
Most Common Occupations - Personal care and service occupations (%)
Most Common Occupations - Sales and office occupations (%)
Most Common Occupations - Sales and related occupations (%)
Most Common Occupations - Office and administrative support occupations (%)
Most Common Occupations - Natural resources, construction, and maintenance occupations (%)
Most Common Occupations - Farming, fishing, and forestry occupations (%)
Most Common Occupations - Construction and extraction occupations (%)
Most Common Occupations - Installation, maintenance, and repair occupations (%)
Most Common Occupations - Production, transportation, and material moving occupations (%)
Most Common Occupations - Production occupations (%)
Most Common Occupations - Transportation occupations (%)
Most Common Occupations - Material moving occupations (%)
People in Group quarters - Institutionalized population (%)
People in Group quarters - Correctional institutions (%)
People in Group quarters - Federal prisons and detention centers (%)
People in Group quarters - Halfway houses (%)
People in Group quarters - Local jails and other confinement facilities (including police lockups) (%)
People in Group quarters - Military disciplinary barracks (%)
People in Group quarters - State prisons (%)
People in Group quarters - Other types of correctional institutions (%)
People in Group quarters - Nursing homes (%)
People in Group quarters - Hospitals/wards, hospices, and schools for the handicapped (%)
People in Group quarters - Hospitals/wards and hospices for chronically ill (%)
People in Group quarters - Hospices or homes for chronically ill (%)
People in Group quarters - Military hospitals or wards for chronically ill (%)
People in Group quarters - Other hospitals or wards for chronically ill (%)
People in Group quarters - Hospitals or wards for drug/alcohol abuse (%)
People in Group quarters - Mental (Psychiatric) hospitals or wards (%)
People in Group quarters - Schools, hospitals, or wards for the mentally retarded (%)
People in Group quarters - Schools, hospitals, or wards for the physically handicapped (%)
People in Group quarters - Institutions for the deaf (%)
People in Group quarters - Institutions for the blind (%)
People in Group quarters - Orthopedic wards and institutions for the physically handicapped (%)
People in Group quarters - Wards in general hospitals for patients who have no usual home elsewhere (%)
People in Group quarters - Wards in military hospitals for patients who have no usual home elsewhere (%)
People in Group quarters - Juvenile institutions (%)
People in Group quarters - Long-term care (%)
People in Group quarters - Homes for abused, dependent, and neglected children (%)
People in Group quarters - Residential treatment centers for emotionally disturbed children (%)
People in Group quarters - Training schools for juvenile delinquents (%)
People in Group quarters - Short-term care, detention or diagnostic centers for delinquent children (%)
People in Group quarters - Type of juvenile institution unknown (%)
People in Group quarters - Noninstitutionalized population (%)
People in Group quarters - College dormitories (includes college quarters off campus) (%)
People in Group quarters - Military quarters (%)
People in Group quarters - On base (%)
People in Group quarters - Barracks, unaccompanied personnel housing (UPH), (Enlisted/Officer), ;and similar group living quarters for military personnel (%)
People in Group quarters - Transient quarters for temporary residents (%)
People in Group quarters - Military ships (%)
People in Group quarters - Group homes (%)
People in Group quarters - Homes or halfway houses for drug/alcohol abuse (%)
People in Group quarters - Homes for the mentally ill (%)
People in Group quarters - Homes for the mentally retarded (%)
People in Group quarters - Homes for the physically handicapped (%)
People in Group quarters - Other group homes (%)
People in Group quarters - Religious group quarters (%)
People in Group quarters - Dormitories (%)
People in Group quarters - Agriculture workers' dormitories on farms (%)
People in Group quarters - Job Corps and vocational training facilities (%)
People in Group quarters - Other workers' dormitories (%)
People in Group quarters - Crews of maritime vessels (%)
People in Group quarters - Other nonhousehold living situations (%)
People in Group quarters - Other noninstitutional group quarters (%)
Residents speaking English at home (%)
Residents speaking English at home - Born in the United States (%)
Residents speaking English at home - Native, born elsewhere (%)
Residents speaking English at home - Foreign born (%)
Residents speaking Spanish at home (%)
Residents speaking Spanish at home - Born in the United States (%)
Residents speaking Spanish at home - Native, born elsewhere (%)
Residents speaking Spanish at home - Foreign born (%)
Residents speaking other language at home (%)
Residents speaking other language at home - Born in the United States (%)
Residents speaking other language at home - Native, born elsewhere (%)
Residents speaking other language at home - Foreign born (%)
Class of Workers - Employee of private company (%)
Class of Workers - Self-employed in own incorporated business (%)
Class of Workers - Private not-for-profit wage and salary workers (%)
Class of Workers - Local government workers (%)
Class of Workers - State government workers (%)
Class of Workers - Federal government workers (%)
Class of Workers - Self-employed workers in own not incorporated business and Unpaid family workers (%)
House heating fuel used in houses and condos - Utility gas (%)
House heating fuel used in houses and condos - Bottled, tank, or LP gas (%)
House heating fuel used in houses and condos - Electricity (%)
House heating fuel used in houses and condos - Fuel oil, kerosene, etc. (%)
House heating fuel used in houses and condos - Coal or coke (%)
House heating fuel used in houses and condos - Wood (%)
House heating fuel used in houses and condos - Solar energy (%)
House heating fuel used in houses and condos - Other fuel (%)
House heating fuel used in houses and condos - No fuel used (%)
House heating fuel used in apartments - Utility gas (%)
House heating fuel used in apartments - Bottled, tank, or LP gas (%)
House heating fuel used in apartments - Electricity (%)
House heating fuel used in apartments - Fuel oil, kerosene, etc. (%)
House heating fuel used in apartments - Coal or coke (%)
House heating fuel used in apartments - Wood (%)
House heating fuel used in apartments - Solar energy (%)
House heating fuel used in apartments - Other fuel (%)
House heating fuel used in apartments - No fuel used (%)
Armed forces status - In Armed Forces (%)
Armed forces status - Civilian (%)
Armed forces status - Civilian - Veteran (%)
Armed forces status - Civilian - Nonveteran (%)
Fatal accidents locations in years 2005-2021
Fatal accidents locations in 2005
Fatal accidents locations in 2006
Fatal accidents locations in 2007
Fatal accidents locations in 2008
Fatal accidents locations in 2009
Fatal accidents locations in 2010
Fatal accidents locations in 2011
Fatal accidents locations in 2012
Fatal accidents locations in 2013
Fatal accidents locations in 2014
Fatal accidents locations in 2015
Fatal accidents locations in 2016
Fatal accidents locations in 2017
Fatal accidents locations in 2018
Fatal accidents locations in 2019
Fatal accidents locations in 2020
Fatal accidents locations in 2021
Alcohol use - People drinking some alcohol every month (%)
Alcohol use - People not drinking at all (%)
Alcohol use - Average days/month drinking alcohol
Alcohol use - Average drinks/week
Alcohol use - Average days/year people drink much
Audiometry - Average condition of hearing (%)
Audiometry - People that can hear a whisper from across a quiet room (%)
Audiometry - People that can hear normal voice from across a quiet room (%)
Audiometry - Ears ringing, roaring, buzzing (%)
Audiometry - Had a job exposure to loud noise (%)
Audiometry - Had off-work exposure to loud noise (%)
Blood Pressure & Cholesterol - Has high blood pressure (%)
Blood Pressure & Cholesterol - Checking blood pressure at home (%)
Blood Pressure & Cholesterol - Frequently checking blood cholesterol (%)
Blood Pressure & Cholesterol - Has high cholesterol level (%)
Consumer Behavior - Money monthly spent on food at supermarket/grocery store
Consumer Behavior - Money monthly spent on food at other stores
Consumer Behavior - Money monthly spent on eating out
Consumer Behavior - Money monthly spent on carryout/delivered foods
Consumer Behavior - Income spent on food at supermarket/grocery store (%)
Consumer Behavior - Income spent on food at other stores (%)
Consumer Behavior - Income spent on eating out (%)
Consumer Behavior - Income spent on carryout/delivered foods (%)
Current Health Status - General health condition (%)
Current Health Status - Blood donors (%)
Current Health Status - Has blood ever tested for HIV virus (%)
Current Health Status - Left-handed people (%)
Dermatology - People using sunscreen (%)
Diabetes - Diabetics (%)
Diabetes - Had a blood test for high blood sugar (%)
Diabetes - People taking insulin (%)
Diet Behavior & Nutrition - Diet health (%)
Diet Behavior & Nutrition - Milk product consumption (# of products/month)
Diet Behavior & Nutrition - Meals not home prepared (#/week)
Diet Behavior & Nutrition - Meals from fast food or pizza place (#/week)
Diet Behavior & Nutrition - Ready-to-eat foods (#/month)
Diet Behavior & Nutrition - Frozen meals/pizza (#/month)
Drug Use - People that ever used marijuana or hashish (%)
Drug Use - Ever used hard drugs (%)
Drug Use - Ever used any form of cocaine (%)
Drug Use - Ever used heroin (%)
Drug Use - Ever used methamphetamine (%)
Health Insurance - People covered by health insurance (%)
Kidney Conditions-Urology - Avg. # of times urinating at night
Medical Conditions - People with asthma (%)
Medical Conditions - People with anemia (%)
Medical Conditions - People with psoriasis (%)
Medical Conditions - People with overweight (%)
Medical Conditions - Elderly people having difficulties in thinking or remembering (%)
Medical Conditions - People who ever received blood transfusion (%)
Medical Conditions - People having trouble seeing even with glass/contacts (%)
Medical Conditions - People with arthritis (%)
Medical Conditions - People with gout (%)
Medical Conditions - People with congestive heart failure (%)
Medical Conditions - People with coronary heart disease (%)
Medical Conditions - People with angina pectoris (%)
Medical Conditions - People who ever had heart attack (%)
Medical Conditions - People who ever had stroke (%)
Medical Conditions - People with emphysema (%)
Medical Conditions - People with thyroid problem (%)
Medical Conditions - People with chronic bronchitis (%)
Medical Conditions - People with any liver condition (%)
Medical Conditions - People who ever had cancer or malignancy (%)
Mental Health - People who have little interest in doing things (%)
Mental Health - People feeling down, depressed, or hopeless (%)
Mental Health - People who have trouble sleeping or sleeping too much (%)
Mental Health - People feeling tired or having little energy (%)
Mental Health - People with poor appetite or overeating (%)
Mental Health - People feeling bad about themself (%)
Mental Health - People who have trouble concentrating on things (%)
Mental Health - People moving or speaking slowly or too fast (%)
Mental Health - People having thoughts they would be better off dead (%)
Oral Health - Average years since last visit a dentist
Oral Health - People embarrassed because of mouth (%)
Oral Health - People with gum disease (%)
Oral Health - General health of teeth and gums (%)
Oral Health - Average days a week using dental floss/device
Oral Health - Average days a week using mouthwash for dental problem
Oral Health - Average number of teeth
Pesticide Use - Households using pesticides to control insects (%)
Pesticide Use - Households using pesticides to kill weeds (%)
Physical Activity - People doing vigorous-intensity work activities (%)
Physical Activity - People doing moderate-intensity work activities (%)
Physical Activity - People walking or bicycling (%)
Physical Activity - People doing vigorous-intensity recreational activities (%)
Physical Activity - People doing moderate-intensity recreational activities (%)
Physical Activity - Average hours a day doing sedentary activities
Physical Activity - Average hours a day watching TV or videos
Physical Activity - Average hours a day using computer
Physical Functioning - People having limitations keeping them from working (%)
Physical Functioning - People limited in amount of work they can do (%)
Physical Functioning - People that need special equipment to walk (%)
Physical Functioning - People experiencing confusion/memory problems (%)
Physical Functioning - People requiring special healthcare equipment (%)
Prescription Medications - Average number of prescription medicines taking
Preventive Aspirin Use - Adults 40+ taking low-dose aspirin (%)
Reproductive Health - Vaginal deliveries (%)
Reproductive Health - Cesarean deliveries (%)
Reproductive Health - Deliveries resulted in a live birth (%)
Reproductive Health - Pregnancies resulted in a delivery (%)
Reproductive Health - Women breastfeeding newborns (%)
Reproductive Health - Women that had a hysterectomy (%)
Reproductive Health - Women that had both ovaries removed (%)
Reproductive Health - Women that have ever taken birth control pills (%)
Reproductive Health - Women taking birth control pills (%)
Reproductive Health - Women that have ever used Depo-Provera or injectables (%)
Reproductive Health - Women that have ever used female hormones (%)
Sexual Behavior - People 18+ that ever had sex (vaginal, anal, or oral) (%)
Sexual Behavior - Males 18+ that ever had vaginal sex with a woman (%)
Sexual Behavior - Males 18+ that ever performed oral sex on a woman (%)
Sexual Behavior - Males 18+ that ever had anal sex with a woman (%)
Sexual Behavior - Males 18+ that ever had any sex with a man (%)
Sexual Behavior - Females 18+ that ever had vaginal sex with a man (%)
Sexual Behavior - Females 18+ that ever performed oral sex on a man (%)
Sexual Behavior - Females 18+ that ever had anal sex with a man (%)
Sexual Behavior - Females 18+ that ever had any kind of sex with a woman (%)
Sexual Behavior - Average age people first had sex
Sexual Behavior - Average number of female sex partners in lifetime (males 18+)
Sexual Behavior - Average number of female vaginal sex partners in lifetime (males 18+)
Sexual Behavior - Average age people first performed oral sex on a woman (18+)
Sexual Behavior - Average number of woman performed oral sex on in lifetime (18+)
Sexual Behavior - Average number of male sex partners in lifetime (males 18+)
Sexual Behavior - Average number of male anal sex partners in lifetime (males 18+)
Sexual Behavior - Average age people first performed oral sex on a man (18+)
Sexual Behavior - Average number of male oral sex partners in lifetime (18+)
Sexual Behavior - People using protection when performing oral sex (%)
Sexual Behavior - Average number of times people have vaginal or anal sex a year
Sexual Behavior - People having sex without condom (%)
Sexual Behavior - Average number of male sex partners in lifetime (females 18+)
Sexual Behavior - Average number of male vaginal sex partners in lifetime (females 18+)
Sexual Behavior - Average number of female sex partners in lifetime (females 18+)
Sexual Behavior - Circumcised males 18+ (%)
Sleep Disorders - Average hours sleeping at night
Sleep Disorders - People that has trouble sleeping (%)
Smoking-Cigarette Use - People smoking cigarettes (%)
Taste & Smell - People 40+ having problems with smell (%)
Taste & Smell - People 40+ having problems with taste (%)
Taste & Smell - People 40+ that ever had wisdom teeth removed (%)
Taste & Smell - People 40+ that ever had tonsils teeth removed (%)
Taste & Smell - People 40+ that ever had a loss of consciousness because of a head injury (%)
Taste & Smell - People 40+ that ever had a broken nose or other serious injury to face or skull (%)
Taste & Smell - People 40+ that ever had two or more sinus infections (%)
Weight - Average height (inches)
Weight - Average weight (pounds)
Weight - Average BMI
Weight - People that are obese (%)
Weight - People that ever were obese (%)
Weight - People trying to lose weight (%)
100%
urban population.
Estimated median house/condo value in 2022: $197,637
19126:
$197,637Pennsylvania:
$245,500
Median resident age: This zip code:
38.8 yearsPennsylvania median age:
40.9 years
Average household size: This zip code:
2.6 peoplePennsylvania:
2.4 people
Averages for the 2020 tax year for zip code 19126, filed in 2021:
Average Adjusted Gross Income (AGI) in 2020: $45,619 (Individual Income Tax Returns) Here:
$45,619State:
$75,707
Salary/wage: $42,794 (reported on 81.8% of returns )Here:
$42,794State:
$62,806
(% of AGI for various income ranges: 975.3% for AGIs below $25k , 3446.6% for AGIs $25k-50k , 6472.3% for AGIs $50k-75k , 9649.8% for AGIs $75k-100k , 17639.4% for AGIs $100k-200k , 66745.0% for AGIs over 200k ) Taxable interest for individuals: $378 (reported on 15.4% of returns )This zip code:
$378Pennsylvania:
$1,633
(% of AGI for various income ranges: 4.6% for AGIs below $25k , 3.1% for AGIs $25k-50k , 11.0% for AGIs $50k-75k , 14.5% for AGIs $75k-100k , 25.5% for AGIs $100k-200k , 170.0% for AGIs over 200k ) Ordinary dividends: $1,647 (reported on 5.7% of returns )(% of AGI for various income ranges: 3.8% for AGIs below $25k , 5.2% for AGIs $25k-50k , 9.9% for AGIs $50k-75k , 28.0% for AGIs $75k-100k , 43.2% for AGIs $100k-200k , 890.0% for AGIs over 200k ) Net capital gain/loss in AGI: +$4,606 (reported on 4.8% of returns )Here:
+$4,606State:
+$23,522
(% of AGI for various income ranges: 2.6% for AGIs below $25k , 7.3% for AGIs $25k-50k , 19.8% for AGIs $50k-75k , 38.8% for AGIs $75k-100k , 189.7% for AGIs $100k-200k , 2555.0% for AGIs over 200k ) Profit/loss from business: +$3,723 (reported on 13.3% of returns )Here:
+$3,723State:
+$16,274
(% of AGI for various income ranges: 44.4% for AGIs below $25k , 20.8% for AGIs $25k-50k , 39.0% for AGIs $50k-75k , 202.2% for AGIs $75k-100k , 389.0% for AGIs $100k-200k ) Taxable individual retirement arrangement distribution: $13,855 (reported on 4.1% of returns )19126:
$13,855Pennsylvania:
$18,583
(% of AGI for various income ranges: 19.0% for AGIs below $25k , 29.4% for AGIs $25k-50k , 65.5% for AGIs $50k-75k , 207.5% for AGIs $75k-100k , 586.1% for AGIs $100k-200k ) Total itemized deductions: $25,269 (reported on 8.9% of returns )Here:
$25,269State:
$34,850
(% of AGI for various income ranges: 26.6% for AGIs below $25k , 135.4% for AGIs $25k-50k , 477.7% for AGIs $50k-75k , 869.0% for AGIs $75k-100k , 1361.0% for AGIs $100k-200k , 5385.0% for AGIs over 200k ) Charity contributions: $9,247 (reported on 7.6% of returns )(% of AGI for various income ranges: 51.2% for AGIs $25k-50k , 136.6% for AGIs $50k-75k , 246.5% for AGIs $75k-100k , 438.7% for AGIs $100k-200k , 2430.0% for AGIs over 200k ) Taxes paid: $7,367 (reported on 8.9% of returns )(% of AGI for various income ranges: 4.8% for AGIs below $25k , 31.3% for AGIs $25k-50k , 138.8% for AGIs $50k-75k , 283.8% for AGIs $75k-100k , 441.9% for AGIs $100k-200k , 1435.0% for AGIs over 200k ) Earned income credit: $2,051 (reported on 20.6% of returns )(% of AGI for various income ranges: 89.9% for AGIs below $25k , 67.1% for AGIs $25k-50k ) Percentage of individuals using paid preparers for their 2020 taxes: 89.5%(% for various income ranges: 89.7% for AGIs below $25k , 92.0% for AGIs $25k-50k , 86.9% for AGIs $50k-75k , 86.0% for AGIs $75k-100k , 85.5% for AGIs $100k-200k , 100.0% for AGIs over 200k )
Averages for the 2012 tax year for zip code 19126, filed in 2013:
Average Adjusted Gross Income (AGI) in 2012: $37,035 (Individual Income Tax Returns) Here:
$37,035State:
$61,346
Salary/wage: $34,427 (reported on 85.0% of returns )Here:
$34,427State:
$51,902
(% of AGI for various income ranges: 74.0% for AGIs below $25k , 82.9% for AGIs $25k-50k , 82.9% for AGIs $50k-75k , 76.3% for AGIs $75k-100k , 82.8% for AGIs $100k-200k ) Taxable interest for individuals: $596 (reported on 16.8% of returns )This zip code:
$596Pennsylvania:
$1,588
(% of AGI for various income ranges: 0.4% for AGIs below $25k , 0.2% for AGIs $25k-50k , 0.2% for AGIs $50k-75k , 0.4% for AGIs $75k-100k , 0.2% for AGIs $100k-200k ) Ordinary dividends: $2,071 (reported on 6.7% of returns )(% of AGI for various income ranges: 0.3% for AGIs below $25k , 0.3% for AGIs $25k-50k , 0.3% for AGIs $50k-75k , 0.2% for AGIs $75k-100k , 0.9% for AGIs $100k-200k ) Net capital gain/loss in AGI: +$989 (reported on 3.8% of returns )(% of AGI for various income ranges: 0.3% for AGIs $75k-100k , 0.4% for AGIs $100k-200k ) Profit/loss from business: +$6,425 (reported on 10.2% of returns )Here:
+$6,425State:
+$16,268
(% of AGI for various income ranges: 6.2% for AGIs below $25k , 0.9% for AGIs $25k-50k , 0.5% for AGIs $50k-75k , 1.4% for AGIs $75k-100k , 1.6% for AGIs $100k-200k ) Taxable individual retirement arrangement distribution: $11,700 (reported on 5.6% of returns )19126:
$11,700Pennsylvania:
$14,550
(% of AGI for various income ranges: 1.5% for AGIs below $25k , 0.9% for AGIs $25k-50k , 1.4% for AGIs $50k-75k , 2.7% for AGIs $75k-100k , 3.5% for AGIs $100k-200k ) Total itemized deductions: $17,568 (27% of AGI, reported on 30.4% of returns )Here:
$17,568State:
$23,538
Here:
27.2% of AGIState:
18.4% of AGI
(% of AGI for various income ranges: 6.8% for AGIs below $25k , 11.8% for AGIs $25k-50k , 18.0% for AGIs $50k-75k , 18.1% for AGIs $75k-100k , 18.2% for AGIs $100k-200k , 15.7% for AGIs over 200k ) Charity contributions: $4,039 (reported on 25.6% of returns )(% of AGI for various income ranges: 1.0% for AGIs below $25k , 2.4% for AGIs $25k-50k , 3.4% for AGIs $50k-75k , 3.5% for AGIs $75k-100k , 3.8% for AGIs $100k-200k , 3.7% for AGIs over 200k ) Taxes paid: $5,996 (reported on 30.3% of returns )(% of AGI for various income ranges: 1.6% for AGIs below $25k , 3.3% for AGIs $25k-50k , 6.2% for AGIs $50k-75k , 6.7% for AGIs $75k-100k , 7.4% for AGIs $100k-200k , 7.5% for AGIs over 200k ) Earned income credit: $2,262 (reported on 28.0% of returns )(% of AGI for various income ranges: 8.7% for AGIs below $25k , 1.3% for AGIs $25k-50k ) Percentage of individuals using paid preparers for their 2012 taxes: 43.0%(% for various income ranges: 42.4% for AGIs below $25k , 40.2% for AGIs $25k-50k , 44.3% for AGIs $50k-75k , 50.0% for AGIs $75k-100k , 57.6% for AGIs $100k-200k )
Averages for the 2004 tax year for zip code 19126, filed in 2005:
Average Adjusted Gross Income (AGI) in 2004: $32,397 (Individual Income Tax Returns) Here:
$32,397State:
$48,049
Salary/wage: $31,632 (reported on 88.0% of returns )Here:
$31,632State:
$42,646
(% of AGI for various income ranges: 89.7% for AGIs below $10k , 79.7% for AGIs $10k-25k , 88.4% for AGIs $25k-50k , 87.6% for AGIs $50k-75k , 87.3% for AGIs $75k-100k , 81.3% for AGIs over 100k ) Taxable interest for individuals: $916 (reported on 24.9% of returns )This zip code:
$916Pennsylvania:
$1,657
(% of AGI for various income ranges: 2.0% for AGIs below $10k , 0.9% for AGIs $10k-25k , 0.4% for AGIs $25k-50k , 0.6% for AGIs $50k-75k , 0.9% for AGIs $75k-100k , 0.9% for AGIs over 100k ) Taxable dividends: $1,534 (reported on 9.2% of returns )(% of AGI for various income ranges: 1.3% for AGIs below $10k , 0.4% for AGIs $10k-25k , 0.2% for AGIs $25k-50k , 0.4% for AGIs $50k-75k , 0.4% for AGIs $75k-100k , 1.0% for AGIs over 100k ) Net capital gain/loss: +$1,868 (reported on 5.2% of returns )Here:
+$1,868State:
+$9,716
(% of AGI for various income ranges: 0.8% for AGIs below $10k , 0.1% for AGIs $10k-25k , 0.2% for AGIs $25k-50k , 0.6% for AGIs $50k-75k , 0.1% for AGIs $75k-100k , 0.5% for AGIs over 100k ) Profit/loss from business: +$4,204 (reported on 7.2% of returns )Here:
+$4,204State:
+$14,267
(% of AGI for various income ranges: 6.4% for AGIs below $10k , 2.7% for AGIs $10k-25k , 0.4% for AGIs $25k-50k , 0.2% for AGIs $50k-75k , 0.3% for AGIs $75k-100k , 0.8% for AGIs over 100k ) IRA payment deduction: $1,983 (reported on 1.7% of returns )19126:
$1,983Pennsylvania:
$2,903
(% of AGI for various income ranges: 0.1% for AGIs $10k-25k , 0.1% for AGIs $25k-50k , 0.1% for AGIs $50k-75k , 0.2% for AGIs $75k-100k ) Total itemized deductions: $15,488 (28% of AGI, reported on 34.1% of returns )Here:
$15,488State:
$18,804
Here:
28.2% of AGIState:
19.5% of AGI
(% of AGI for various income ranges: 7.7% for AGIs below $10k , 8.4% for AGIs $10k-25k , 14.8% for AGIs $25k-50k , 20.4% for AGIs $50k-75k , 22.2% for AGIs $75k-100k , 19.9% for AGIs over 100k ) Charity contributions deductions: $3,664 (7% of AGI, reported on 31.7% of returns )Here:
6.5% of AGIState:
3.3% of AGI
(% of AGI for various income ranges: 0.8% for AGIs below $10k , 1.6% for AGIs $10k-25k , 3.3% for AGIs $25k-50k , 4.5% for AGIs $50k-75k , 4.7% for AGIs $75k-100k , 4.8% for AGIs over 100k ) Total tax: $3,655 (reported on 66.3% of returns )(% of AGI for various income ranges: 1.8% for AGIs below $10k , 3.0% for AGIs $10k-25k , 5.9% for AGIs $25k-50k , 8.7% for AGIs $50k-75k , 10.1% for AGIs $75k-100k , 14.0% for AGIs over 100k ) Earned income credit: $1,732 (reported on 26.9% of returns )Percentage of individuals using paid preparers for their 2004 taxes: 52.4%(% for various income ranges: 48.8% for AGIs below $10k , 58.7% for AGIs $10k-25k , 50.6% for AGIs $25k-50k , 48.4% for AGIs $50k-75k , 51.6% for AGIs $75k-100k , 51.9% for AGIs over 100k )
Estimated median household income in 2022: This zip code:
$57,889Pennsylvania:
$71,798
Nearest zip codes: 19141 ,
19138 ,
19027 ,
19120 ,
19012 ,
19095 .
Philadelphia Zip Code Map
Percentage of family households: This zip code:
41.3%Pennsylvania:
42.6%
Percentage of households with unmarried partners: This zip code:
2.3%Pennsylvania:
46.5%
Likely homosexual households (counted as self-reported same-sex unmarried-partner households)
Lesbian couples: 0.3% of all households Gay men: 0.0% of all households
Household received Food Stamps/SNAP in the past 12 months: 1,943Household did not receive Food Stamps/SNAP in the past 12 months: 4,655
Women who had a birth in the past 12 months: 68 (33 now married , 31 unmarried) Women who did not have a birth in the past 12 months: 4,567 (1,021 now married , 3,573 unmarried)
Housing units in zip code 19126 with a mortgage: 2,288 (146
second mortgage , 92
both second mortgage and home equity loan )
Houses without a mortgage: 71
Median monthly owner costs for units with a mortgage: $1,331
Median monthly owner costs for units without a mortgage: $555
Residents with income below the poverty level in 2022:
This zip code:
18.9%Whole state:
11.8%
Residents with income below 50% of the poverty level in 2022:
This zip code:
11.9%Whole state:
6.1%
Median number of rooms in houses and condos: Median number of rooms in apartments:
Year house built (houses)
0 2020 or later20 2010 to 2019258 2000 to 2009219 1990 to 1999163 1980 to 1989291 1970 to 1979929 1960 to 19691,550 1950 to 1959808 1940 to 19492,793 1939 or earlier
Zip code 19126 household income distribution in 2022 545 Less than $10,000246 $10,000 to $14,999171 $15,000 to $19,999525 $20,000 to $24,999304 $25,000 to $29,999290 $30,000 to $34,999364 $35,000 to $39,999351 $40,000 to $44,999142 $45,000 to $49,999417 $50,000 to $59,999810 $60,000 to $74,999891 $75,000 to $99,999645 $100,000 to $124,999296 $125,000 to $149,999305 $150,000 to $199,999263 $200,000 or moreEstimate of home value of owner-occupied houses/condos in 2022 in zip code 19126 16 Less than $10,00021 $10,000 to $14,99941 $15,000 to $19,99915 $25,000 to $29,99917 $40,000 to $49,99917 $60,000 to $69,99931 $70,000 to $79,99931 $80,000 to $89,99931 $90,000 to $99,999414 $100,000 to $124,999455 $125,000 to $149,999522 $150,000 to $174,999585 $175,000 to $199,999414 $200,000 to $249,999459 $250,000 to $299,999440 $300,000 to $399,999191 $400,000 to $499,99973 $500,000 to $749,99913 $750,000 to $999,99925 $2,000,000 or moreRent paid by renters in 2022 in zip code 19126 42 $100 to $14947 $150 to $19937 $200 to $24941 $250 to $29920 $300 to $34919 $450 to $49976 $500 to $54931 $550 to $59937 $600 to $64916 $650 to $699154 $700 to $749188 $750 to $799444 $800 to $899371 $900 to $999569 $1,000 to $1,249127 $1,250 to $1,49991 $1,500 to $1,99944 $2,000 to $2,49918 No cash rent
Median gross rent in 2022: $1,111.
Median price asked for vacant for-sale houses and condos in 2022: $363,482.
Estimated median house (or condo) value in 2022 for: White Non-Hispanic householders: $296,602Black or African American householders: $185,303Asian householders: $242,274Some other race householders: $231,702Two or more races householders: $256,957Hispanic or Latino householders: $210,558Estimated median house or condo value in 2022: $197,637
19126:
$197,637Pennsylvania:
$245,500
Lower value quartile - upper value quartile: $151,899 - $278,650
Mean price in 2022: Detached houses: $382,521Here:
$382,521State:
$317,202
Townhouses or other attached units: $260,733Here:
$260,733State:
$254,369
In 2-unit structures: $270,436Here:
$270,436State:
$249,182
In 3-to-4-unit structures: $324,453Here:
$324,453State:
$297,446
In 5-or-more-unit structures: $444,254Here:
$444,254State:
$320,068
Mobile homes: $57,703Here:
$57,703State:
$92,414
Occupied boats, RVs, vans, etc.: $424,146Here:
$424,146State:
$563,750
Housing units in structures:
One, detached: 1,107One, attached: 3,700Two: 5423 or 4: 4535 to 9: 20310 to 19: 24620 to 49: 49050 or more: 439Unemployment : 7.7%
Means of transportation to work in zip code 19126 53.2% 3,782 Drove a car alone7.4% 530 Carpooled12.3% 872 Bus or trolley bus6.2% 440 Streetcar or trolley car1.3% 96 Subway or elevated1.0% 71 Railroad1.0% 71 Taxi0.1% 4 Bicycle0.7% 47 Other means12.2% 868 Worked at homeTravel time to work (commute) in zip code 19126 41 Less than 5 minutes159 5 to 9 minutes182 10 to 14 minutes173 15 to 19 minutes1,026 20 to 24 minutes501 25 to 29 minutes1,836 30 to 34 minutes128 35 to 39 minutes337 40 to 44 minutes1,126 45 to 59 minutes539 60 to 89 minutes137 90 or more minutes
Neighborhoods in zip code 19126: Percentage of zip code residents living and working in this county: 73.7%
Household type by relationship:
Households: 17,603
Male householders: 2,505 (897 living alone ), Female householders: 4,048 (1,336 living alone )1,673 spouses (1,586 opposite-sex spouses ), 582 unmarried partners , (582 opposite-sex unmarried partners ), 5,004 children (4,548 natural , 233 adopted , 220 stepchildren ), 893 grandchildren , 558 brothers or sisters , 228 parents , 31 foster children , 851 other relatives , 382 non-relatives In group quarters: 777 (-1 institutionalized population )
Size of family households: 1,352 2-persons , 1,116 3-persons , 874 4-persons , 72 5-persons , 233 6-persons , 194 7-or-more-persons
Size of nonfamily households: 2,232 1-person , 313 2-persons , 87 3-persons , 35 4-persons
942 married couples with children. single-parent households (194 men , 1,384 women ).
88.1% of residents of 19126 zip code speak English at home. of residents speak Spanish at home (65% very well, 19% well, 8% not well, 8% not at all ).of residents speak other Indo-European language at home (29% very well, 48% well, 24% not well ).of residents speak Asian or Pacific Island language at home (43% very well, 14% well, 43% not well ).of residents speak other language at home (85% very well, 15% well ).
Foreign born population: 1,210 (6.9%)
(63.8%
of them are naturalized citizens )
This zip code:
6.9%Whole state:
7.5%
27% Haiti 12% Grenada 9% Liberia 7% Burma (Myanmar) 6% St. Vincent and the Grenadines 4% Japan 3% Thailand 1% West Indian 1% Haitian 1% Jamaican 1% African 1% German 1% Nigerian 1% Irish
Year of entry for the foreign-born population
97 2010 or later 313 2000 to 2009 461 1990 to 1999 444 Before 1990
There are
36 Medical Specialists in Zip Code 19126 .
Facilities with environmental interests located in this zip code:
ATLANTIC TRANS SVC (5TH & 66TH STREET in PHILADELPHIA, PA)
Small Quantity Generators, between 100 kg and 1000 kg of hazardous waste/month (Resource Conservation and Recovery Act (tracking hazardous waste)) - notification Business NAICS classification: AUTOMOTIVE TRANSMISSION REPAIR.Organizations: OPERNAME (CONTACT/OPERATOR)
, COHEN & MOCK INC T/A ATLANTIC (CONTACT/OWNER)
Alternative names: ATLANTIC TRANSMISSION
AMOCO 5202 TANKS (1700-16 W CHELTENHAM AVE TANKS in PHILADELPHIA, PA)
Small Quantity Generators, between 100 kg and 1000 kg of hazardous waste/month (Resource Conservation and Recovery Act (tracking hazardous waste)) - notification Organizations: AMOCO OIL COMPANY (CONTACT/OWNER)
AMOCO 689 TANKS (6620 N BROAD ST TANKS in PHILADELPHIA, PA)
Small Quantity Generators, between 100 kg and 1000 kg of hazardous waste/month (Resource Conservation and Recovery Act (tracking hazardous waste)) - notification Organizations: AMOCO OIL COMPANY (CONTACT/OWNER)
Housing units lacking complete plumbing facilities: 2.6%
Housing units lacking complete kitchen facilities: 1.1%
75.9% Utility gas 16.2% Electricity 6.1% Fuel oil, kerosene, etc. 0.7% Solar energy 0.6% Bottled, tank, or LP gas
Population in 1990: 22,000.
Place of birth for U.S.-born residents:
This state: 13,324Northeast: 747Midwest: 280South: 1,655West: 135
65% of the 19126 zip code residents lived in the same house 5 years ago.
Out of people who lived in different houses, 82% lived in this county.
Out of people who lived in different counties, 50% lived in Pennsylvania.
89% of the 19126 zip code residents lived in the same house 1 year ago.
Out of people who lived in different houses, 72% moved from this county.
Out of people who lived in different houses, 13% moved from different county within same state.
Out of people who lived in different houses, 11% moved from different state.
Out of people who lived in different houses, 2% moved from abroad.
Private vs. public school enrollment:
Students in private schools in grades 1 to 8 (elementary and middle school): 234
Here:
15.0%Pennsylvania:
15.7%
Students in private schools in grades 9 to 12 (high school): 84
Here:
7.3%Pennsylvania:
13.4%
Students in private undergraduate colleges: 331
Here:
44.5%Pennsylvania:
39.8%
Occupation by median earnings in the past 12 months ($)
74,695 Computer and mathematical occupations 73,356 Health diagnosing and treating practitioners and other technical occupations 69,173 Arts, design, entertainment, sports, and media occupations 68,719 Management occupations 68,430 Life, physical, and social science occupations 59,498 Law enforcement workers including supervisors
Companies with federal contracts located in this zip code:
midlantic medical transport (2557-59 in PHILADELPHIA, PA; small business) in 2 contracts in 2004
$7,054 with Bureau of Prisoners/Federal Prison System for Ambulance Service. Signed on 2004-11-09. Effective on 2004-10-01. Completion date: 2005-09-30.
, same as above. Signed on 2004-11-08. Completion date: 2004-11-08.
Top industries in this zip code by the number of employees in 2005:
Health Care and Social Assistance: Offices of Physicians (except Mental Health Specialists) (500-999 employees: 1 establishment, 1-4 employees: 5 establishments)Health Care and Social Assistance: Nursing Care Facilities (250-499: 1, 100-249: 2, 1-4: 1)Other Services (except Public Administration): Religious Organizations (20-49: 2, 10-19: 2, 5-9: 4, 1-4: 5)Accommodation and Food Services: Caterers (50-99: 1, 10-19: 1, 1-4: 1)Accommodation and Food Services: Full-Service Restaurants (20-49: 2, 5-9: 2, 1-4: 2)Health Care and Social Assistance: Offices of Physicians, Mental Health Specialists (50-99: 1)Health Care and Social Assistance: Child Day Care Services (10-19: 2, 1-4: 8)Health Care and Social Assistance: Residential Mental Health and Substance Abuse Facilities (10-19: 2, 5-9: 2)Health Care and Social Assistance: Residential Mental Retardation Facilities (10-19: 1, 5-9: 2, 1-4: 4)
People in group quarters in 2010:
575 people in nursing facilities/skilled-nursing facilities
76 people in group homes intended for adults
14 people in workers' group living quarters and job corps centers
9 people in residential treatment centers for adults
7 people in other noninstitutional facilities
People in group quarters in 2000:
577 people in nursing homes
115 people in homes for the mentally retarded
35 people in homes for the mentally ill
28 people in homes or halfway houses for drug/alcohol abuse
15 people in religious group quarters
10 people in other nonhousehold living situations
10 people in other noninstitutional group quarters
6 people in homes for abused, dependent, and neglected children
5 people in agriculture workers' dormitories on farms
Fatal accident statistics in 2014:
Fatal accident count: 2Vehicles involved in fatal accidents: 3Fatal accidents caused by drunken drivers: 0Fatalities: 2Persons involved in fatal accidents: 3Pedestrians involved in fatal accidents: 1
Fatal accident statistics in 2012:
Fatal accident count: 1Vehicles involved in fatal accidents: 1Fatal accidents caused by drunken drivers: 0Fatalities: 1Persons involved in fatal accidents: 1Pedestrians involved in fatal accidents: 1
Home Mortgage Disclosure Act Aggregated Statistics For Year 2009(Based on 2 full and 10 partial tracts) A) FHA, FSA/RHS & VA B) Conventional C) Refinancings D) Home Improvement Loans E) Loans on Dwellings For 5+ Families F) Non-occupant Loans on G) Loans On Manufactured Number Average Value Number Average Value Number Average Value Number Average Value Number Average Value Number Average Value Number Average Value
LOANS ORIGINATED 149 $138,870 41 $139,566 322 $121,855 92 $43,322 0 $0 29 $163,280 0 $0 APPLICATIONS APPROVED, NOT ACCEPTED 5 $154,636 4 $91,838 67 $133,284 21 $24,299 0 $0 4 $82,850 0 $0 APPLICATIONS DENIED 31 $125,336 35 $122,512 369 $130,351 231 $29,591 3 $214,547 41 $95,988 1 $2,690 APPLICATIONS WITHDRAWN 15 $151,783 15 $177,469 182 $116,151 12 $70,778 0 $0 14 $126,654 0 $0 FILES CLOSED FOR INCOMPLETENESS 6 $186,322 1 $51,130 45 $141,748 4 $68,180 0 $0 3 $95,163 0 $0
Aggregated Statistics For Year 2008(Based on 2 full and 10 partial tracts) A) FHA, FSA/RHS & VA B) Conventional C) Refinancings D) Home Improvement Loans E) Loans on Dwellings For 5+ Families F) Non-occupant Loans on G) Loans On Manufactured Number Average Value Number Average Value Number Average Value Number Average Value Number Average Value Number Average Value Number Average Value
LOANS ORIGINATED 114 $130,733 87 $130,698 416 $123,400 127 $43,482 2 $2,540,700 53 $112,758 1 $13,450 APPLICATIONS APPROVED, NOT ACCEPTED 16 $138,378 18 $148,279 84 $122,295 42 $37,639 0 $0 12 $65,866 0 $0 APPLICATIONS DENIED 29 $127,126 53 $112,363 565 $120,620 305 $35,899 2 $177,850 80 $80,907 7 $80,941 APPLICATIONS WITHDRAWN 21 $116,161 24 $133,501 193 $129,236 10 $75,751 2 $2,032,560 4 $211,518 0 $0 FILES CLOSED FOR INCOMPLETENESS 7 $151,514 9 $147,281 44 $145,680 7 $53,500 0 $0 4 $135,385 0 $0
Aggregated Statistics For Year 2007(Based on 2 full and 10 partial tracts) A) FHA, FSA/RHS & VA B) Conventional C) Refinancings D) Home Improvement Loans E) Loans on Dwellings For 5+ Families F) Non-occupant Loans on G) Loans On Manufactured Number Average Value Number Average Value Number Average Value Number Average Value Number Average Value Number Average Value Number Average Value
LOANS ORIGINATED 68 $135,640 306 $120,066 724 $108,701 208 $41,475 12 $1,423,876 96 $104,219 3 $73,697 APPLICATIONS APPROVED, NOT ACCEPTED 2 $126,190 63 $107,822 191 $122,440 52 $48,849 0 $0 32 $92,646 2 $34,725 APPLICATIONS DENIED 16 $118,678 194 $114,546 783 $120,793 436 $41,379 1 $383,270 143 $94,673 1 $10,230 APPLICATIONS WITHDRAWN 9 $168,213 58 $132,013 401 $120,613 40 $52,273 5 $1,012,790 37 $105,538 0 $0 FILES CLOSED FOR INCOMPLETENESS 0 $0 38 $104,942 99 $130,762 5 $60,776 0 $0 31 $97,798 0 $0
Aggregated Statistics For Year 2006(Based on 2 full and 10 partial tracts) A) FHA, FSA/RHS & VA B) Conventional C) Refinancings D) Home Improvement Loans E) Loans on Dwellings For 5+ Families F) Non-occupant Loans on G) Loans On Manufactured Number Average Value Number Average Value Number Average Value Number Average Value Number Average Value Number Average Value Number Average Value
LOANS ORIGINATED 49 $128,693 479 $108,522 870 $107,203 222 $44,306 11 $731,645 146 $97,568 1 $4,030 APPLICATIONS APPROVED, NOT ACCEPTED 2 $118,880 99 $124,983 187 $86,311 44 $43,684 0 $0 32 $99,268 1 $64,550 APPLICATIONS DENIED 13 $131,371 215 $102,424 922 $105,329 407 $33,469 2 $85,535 117 $81,768 5 $52,572 APPLICATIONS WITHDRAWN 21 $108,872 115 $112,331 576 $106,720 33 $69,086 1 $102,200 60 $86,041 0 $0 FILES CLOSED FOR INCOMPLETENESS 2 $82,355 36 $110,451 148 $105,588 5 $83,420 0 $0 8 $87,135 2 $83,070
Aggregated Statistics For Year 2005(Based on 2 full and 10 partial tracts) A) FHA, FSA/RHS & VA B) Conventional C) Refinancings D) Home Improvement Loans E) Loans on Dwellings For 5+ Families F) Non-occupant Loans on G) Loans On Manufactured Number Average Value Number Average Value Number Average Value Number Average Value Number Average Value Number Average Value Number Average Value
LOANS ORIGINATED 42 $114,559 475 $100,976 814 $94,437 209 $41,026 9 $3,176,004 150 $77,361 0 $0 APPLICATIONS APPROVED, NOT ACCEPTED 6 $83,467 79 $101,670 219 $81,600 42 $31,533 0 $0 41 $60,293 0 $0 APPLICATIONS DENIED 11 $115,318 216 $98,105 1,085 $88,141 419 $27,448 2 $437,565 162 $52,604 7 $73,671 APPLICATIONS WITHDRAWN 10 $82,429 105 $88,497 481 $104,274 91 $105,153 0 $0 37 $74,568 0 $0 FILES CLOSED FOR INCOMPLETENESS 3 $86,450 35 $105,145 199 $107,000 2 $50,495 0 $0 17 $82,109 0 $0
Aggregated Statistics For Year 2004(Based on 2 full and 10 partial tracts) A) FHA, FSA/RHS & VA B) Conventional C) Refinancings D) Home Improvement Loans E) Loans on Dwellings For 5+ Families F) Non-occupant Loans on G) Loans On Manufactured Number Average Value Number Average Value Number Average Value Number Average Value Number Average Value Number Average Value Number Average Value
LOANS ORIGINATED 46 $84,754 335 $93,510 811 $86,013 184 $36,062 5 $847,578 136 $66,346 1 $145,240 APPLICATIONS APPROVED, NOT ACCEPTED 11 $82,257 65 $82,940 253 $80,922 48 $39,448 0 $0 36 $73,810 2 $6,645 APPLICATIONS DENIED 11 $70,466 127 $87,914 1,040 $80,034 354 $32,415 0 $0 114 $44,287 3 $7,923 APPLICATIONS WITHDRAWN 12 $73,906 68 $95,553 495 $88,627 52 $41,259 0 $0 31 $82,722 0 $0 FILES CLOSED FOR INCOMPLETENESS 1 $80,790 22 $63,041 271 $90,485 11 $52,715 0 $0 15 $88,687 0 $0
Aggregated Statistics For Year 2003(Based on 2 full and 10 partial tracts) A) FHA, FSA/RHS & VA B) Conventional C) Refinancings D) Home Improvement Loans E) Loans on Dwellings For 5+ Families F) Non-occupant Loans on Number Average Value Number Average Value Number Average Value Number Average Value Number Average Value Number Average Value
LOANS ORIGINATED 75 $89,664 227 $87,836 779 $78,035 126 $22,485 8 $646,860 103 $78,480 APPLICATIONS APPROVED, NOT ACCEPTED 10 $101,078 39 $99,669 285 $72,517 54 $30,803 2 $859,605 20 $50,336 APPLICATIONS DENIED 9 $107,586 95 $79,254 1,047 $79,168 264 $26,919 0 $0 68 $50,426 APPLICATIONS WITHDRAWN 6 $83,538 31 $84,186 368 $78,843 20 $28,370 3 $2,273,057 18 $87,238 FILES CLOSED FOR INCOMPLETENESS 0 $0 20 $74,723 61 $76,422 11 $34,832 0 $0 4 $52,790
Aggregated Statistics For Year 2002(Based on 2 full and 10 partial tracts) A) FHA, FSA/RHS & VA B) Conventional C) Refinancings D) Home Improvement Loans E) Loans on Dwellings For 5+ Families F) Non-occupant Loans on Number Average Value Number Average Value Number Average Value Number Average Value Number Average Value Number Average Value
LOANS ORIGINATED 102 $76,120 153 $81,741 548 $73,997 85 $30,579 4 $1,125,842 53 $62,310 APPLICATIONS APPROVED, NOT ACCEPTED 12 $84,551 37 $75,901 236 $62,321 36 $26,431 0 $0 22 $69,821 APPLICATIONS DENIED 11 $93,666 67 $80,751 872 $68,395 244 $20,072 3 $469,747 44 $56,234 APPLICATIONS WITHDRAWN 17 $64,702 22 $88,778 260 $68,169 19 $28,991 0 $0 10 $51,018 FILES CLOSED FOR INCOMPLETENESS 4 $66,102 21 $76,382 153 $83,815 1 $45,720 0 $0 9 $71,988
Aggregated Statistics For Year 2001(Based on 2 full and 10 partial tracts) A) FHA, FSA/RHS & VA B) Conventional C) Refinancings D) Home Improvement Loans E) Loans on Dwellings For 5+ Families F) Non-occupant Loans on Number Average Value Number Average Value Number Average Value Number Average Value Number Average Value Number Average Value
LOANS ORIGINATED 120 $71,517 142 $72,749 414 $65,746 81 $27,783 12 $1,115,982 44 $51,628 APPLICATIONS APPROVED, NOT ACCEPTED 9 $83,229 51 $61,515 205 $65,514 43 $22,748 3 $108,130 17 $67,853 APPLICATIONS DENIED 12 $62,602 104 $62,329 785 $57,509 215 $20,862 2 $749,250 47 $46,068 APPLICATIONS WITHDRAWN 16 $85,038 25 $68,011 275 $57,653 43 $31,703 2 $87,225 15 $67,155 FILES CLOSED FOR INCOMPLETENESS 4 $47,068 8 $53,809 95 $63,675 4 $21,520 0 $0 0 $0
Aggregated Statistics For Year 2000(Based on 2 full and 10 partial tracts) A) FHA, FSA/RHS & VA B) Conventional C) Refinancings D) Home Improvement Loans E) Loans on Dwellings For 5+ Families F) Non-occupant Loans on Number Average Value Number Average Value Number Average Value Number Average Value Number Average Value Number Average Value
LOANS ORIGINATED 142 $78,184 174 $74,669 327 $51,989 163 $15,896 2 $313,355 38 $52,208 APPLICATIONS APPROVED, NOT ACCEPTED 8 $101,725 60 $54,447 170 $53,430 66 $20,868 0 $0 11 $48,915 APPLICATIONS DENIED 13 $90,323 146 $61,769 705 $54,461 312 $16,802 0 $0 51 $51,298 APPLICATIONS WITHDRAWN 7 $76,907 83 $65,350 317 $55,340 55 $26,032 0 $0 29 $51,096 FILES CLOSED FOR INCOMPLETENESS 4 $69,732 11 $69,415 80 $60,408 8 $32,746 0 $0 5 $89,150
Aggregated Statistics For Year 1999(Based on 1 full and 5 partial tracts) A) FHA, FSA/RHS & VA B) Conventional C) Refinancings D) Home Improvement Loans E) Loans on Dwellings For 5+ Families F) Non-occupant Loans on Number Average Value Number Average Value Number Average Value Number Average Value Number Average Value Number Average Value
LOANS ORIGINATED 49 $78,139 77 $68,076 234 $53,049 85 $19,338 1 $700,000 17 $45,723 APPLICATIONS APPROVED, NOT ACCEPTED 6 $100,185 28 $69,594 143 $54,604 43 $17,314 0 $0 8 $48,112 APPLICATIONS DENIED 4 $60,368 67 $62,141 314 $52,105 176 $15,866 1 $59,630 15 $43,520 APPLICATIONS WITHDRAWN 4 $71,768 29 $59,529 197 $53,484 31 $27,322 1 $691,000 12 $55,577 FILES CLOSED FOR INCOMPLETENESS 1 $109,510 4 $74,132 57 $58,845 3 $24,150 0 $0 1 $64,480
Private Mortgage Insurance Companies Aggregated Statistics For Year 2009(Based on 2 full and 10 partial tracts) A) Conventional B) Refinancings C) Non-occupant Loans on Number Average Value Number Average Value Number Average Value
LOANS ORIGINATED 6 $281,952 9 $161,112 0 $0 APPLICATIONS APPROVED, NOT ACCEPTED 4 $87,082 3 $192,397 0 $0 APPLICATIONS DENIED 1 $149,300 0 $0 0 $0 APPLICATIONS WITHDRAWN 2 $313,175 3 $185,927 0 $0 FILES CLOSED FOR INCOMPLETENESS 3 $117,893 0 $0 1 $158,690
Aggregated Statistics For Year 2008(Based on 2 full and 10 partial tracts) A) Conventional B) Refinancings C) Non-occupant Loans on Number Average Value Number Average Value Number Average Value
LOANS ORIGINATED 44 $142,484 13 $115,368 1 $53,180 APPLICATIONS APPROVED, NOT ACCEPTED 30 $134,512 19 $130,151 4 $101,130 APPLICATIONS DENIED 2 $107,260 0 $0 0 $0 APPLICATIONS WITHDRAWN 1 $162,720 3 $197,517 0 $0 FILES CLOSED FOR INCOMPLETENESS 0 $0 2 $127,825 1 $119,640
Aggregated Statistics For Year 2007(Based on 2 full and 10 partial tracts) A) Conventional B) Refinancings C) Non-occupant Loans on Number Average Value Number Average Value Number Average Value
LOANS ORIGINATED 160 $129,420 46 $126,570 9 $92,144 APPLICATIONS APPROVED, NOT ACCEPTED 44 $122,678 15 $155,735 5 $112,450 APPLICATIONS DENIED 15 $134,571 8 $211,080 7 $107,677 APPLICATIONS WITHDRAWN 13 $124,481 9 $137,323 7 $123,890 FILES CLOSED FOR INCOMPLETENESS 4 $220,200 0 $0 2 $68,600
Aggregated Statistics For Year 2006(Based on 2 full and 10 partial tracts) A) Conventional B) Refinancings C) Non-occupant Loans on Number Average Value Number Average Value Number Average Value
LOANS ORIGINATED 141 $122,388 29 $114,526 17 $101,372 APPLICATIONS APPROVED, NOT ACCEPTED 26 $137,541 3 $81,547 3 $145,640 APPLICATIONS DENIED 0 $0 0 $0 0 $0 APPLICATIONS WITHDRAWN 8 $215,976 1 $115,650 2 $323,675 FILES CLOSED FOR INCOMPLETENESS 3 $92,383 0 $0 3 $92,383
Aggregated Statistics For Year 2005(Based on 2 full and 10 partial tracts) A) Conventional B) Refinancings C) Non-occupant Loans on Number Average Value Number Average Value Number Average Value
LOANS ORIGINATED 155 $133,861 31 $99,069 21 $115,701 APPLICATIONS APPROVED, NOT ACCEPTED 33 $113,186 12 $112,931 3 $79,297 APPLICATIONS DENIED 4 $149,898 1 $123,720 0 $0 APPLICATIONS WITHDRAWN 8 $158,462 6 $137,382 0 $0 FILES CLOSED FOR INCOMPLETENESS 5 $75,530 1 $131,920 1 $76,690
Aggregated Statistics For Year 2004(Based on 2 full and 10 partial tracts) A) Conventional B) Refinancings C) Non-occupant Loans on Number Average Value Number Average Value Number Average Value
LOANS ORIGINATED 160 $93,999 33 $89,557 24 $83,817 APPLICATIONS APPROVED, NOT ACCEPTED 16 $72,689 13 $101,926 2 $84,450 APPLICATIONS DENIED 2 $78,020 0 $0 0 $0 APPLICATIONS WITHDRAWN 5 $117,228 5 $111,454 0 $0 FILES CLOSED FOR INCOMPLETENESS 2 $105,860 0 $0 0 $0
Aggregated Statistics For Year 2003(Based on 2 full and 10 partial tracts) A) Conventional B) Refinancings C) Non-occupant Loans on Number Average Value Number Average Value Number Average Value
LOANS ORIGINATED 99 $93,023 49 $82,326 10 $88,317 APPLICATIONS APPROVED, NOT ACCEPTED 14 $111,491 22 $106,280 5 $128,302 APPLICATIONS DENIED 8 $81,671 5 $109,698 7 $94,807 APPLICATIONS WITHDRAWN 5 $70,848 5 $107,386 4 $73,768 FILES CLOSED FOR INCOMPLETENESS 0 $0 0 $0 0 $0
Aggregated Statistics For Year 2002(Based on 2 full and 10 partial tracts) A) Conventional B) Refinancings C) Non-occupant Loans on Number Average Value Number Average Value Number Average Value
LOANS ORIGINATED 70 $96,038 53 $92,266 5 $66,124 APPLICATIONS APPROVED, NOT ACCEPTED 6 $80,772 10 $109,613 3 $34,323 APPLICATIONS DENIED 0 $0 3 $66,760 1 $68,510 APPLICATIONS WITHDRAWN 6 $91,158 1 $59,170 1 $59,170 FILES CLOSED FOR INCOMPLETENESS 1 $79,340 1 $71,580 0 $0
Aggregated Statistics For Year 2001(Based on 2 full and 10 partial tracts) A) Conventional B) Refinancings C) Non-occupant Loans on Number Average Value Number Average Value Number Average Value
LOANS ORIGINATED 63 $85,751 20 $84,887 5 $46,594 APPLICATIONS APPROVED, NOT ACCEPTED 18 $86,964 10 $115,379 3 $120,580 APPLICATIONS DENIED 5 $93,932 5 $88,078 2 $65,210 APPLICATIONS WITHDRAWN 0 $0 2 $53,355 0 $0 FILES CLOSED FOR INCOMPLETENESS 0 $0 2 $80,920 0 $0
Aggregated Statistics For Year 2000(Based on 2 full and 10 partial tracts) A) Conventional B) Refinancings C) Non-occupant Loans on Number Average Value Number Average Value Number Average Value
LOANS ORIGINATED 65 $89,673 20 $67,922 11 $81,426 APPLICATIONS APPROVED, NOT ACCEPTED 9 $99,436 7 $77,551 3 $86,660 APPLICATIONS DENIED 12 $71,260 2 $88,925 3 $71,980 APPLICATIONS WITHDRAWN 3 $92,470 2 $62,670 0 $0 FILES CLOSED FOR INCOMPLETENESS 0 $0 1 $45,720 1 $45,720
Aggregated Statistics For Year 1999(Based on 1 full and 5 partial tracts) A) Conventional B) Refinancings C) Non-occupant Loans on Number Average Value Number Average Value Number Average Value
LOANS ORIGINATED 17 $80,071 26 $60,500 4 $64,118 APPLICATIONS APPROVED, NOT ACCEPTED 3 $107,230 2 $70,745 1 $41,320 APPLICATIONS DENIED 1 $126,000 3 $61,377 0 $0 APPLICATIONS WITHDRAWN 0 $0 0 $0 0 $0 FILES CLOSED FOR INCOMPLETENESS 2 $136,500 0 $0 0 $0
2010 - 2018 National Fire Incident Reporting System (NFIRS) incidents See full 2006 National Fire Incident Reporting System statistics for zip code 19126, Pennsylvania
Most common first names in zip code 19126 among deceased individuals Name Count Lived (average)
John 240 75.0 years Mary 227 81.3 years William 212 75.3 years James 185 72.1 years Joseph 172 75.1 years Anna 150 84.0 years George 127 75.2 years Charles 113 75.2 years Margaret 105 80.1 years Robert 104 69.6 years
Most common last names in zip code 19126 among deceased individuals Last name Count Lived (average)
Smith 108 73.7 years Williams 87 74.5 years Brown 82 73.3 years Jones 62 71.9 years Johnson 56 77.5 years Jackson 42 71.2 years Harris 41 70.9 years Miller 41 77.9 years Davis 40 70.7 years Robinson 38 71.8 years
Businesses in zip code 19126
Name Count Name Count
7-Eleven 1 GNC 1 CVS 1 Rite Aid 1 Dunkin Donuts 1

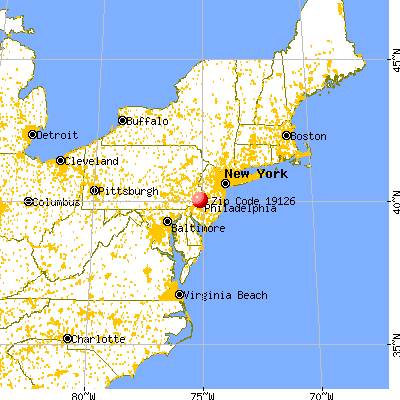


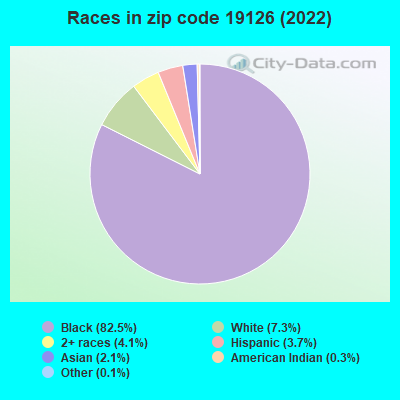


 Nearest zip codes: 19141, 19138, 19027, 19120, 19012, 19095.
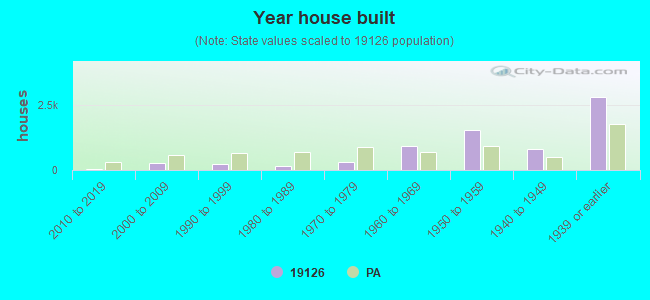

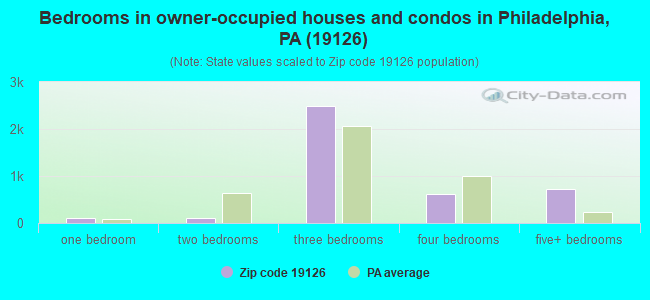
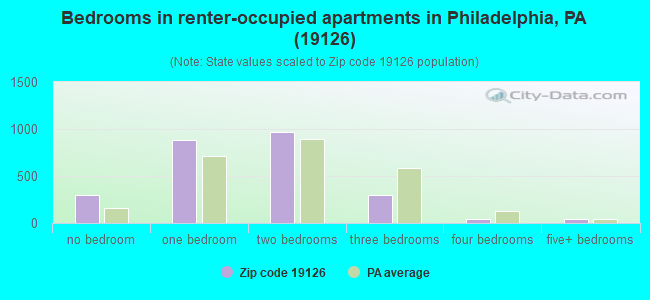
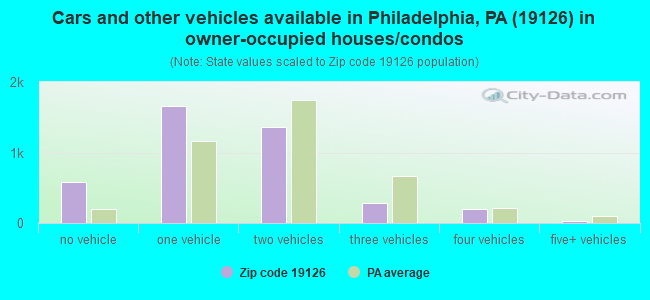


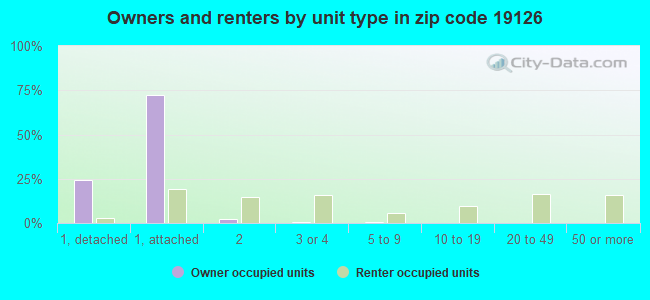
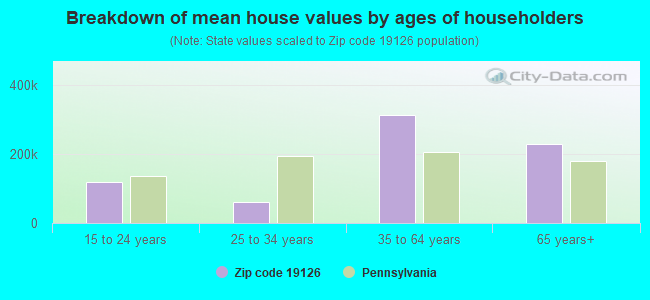


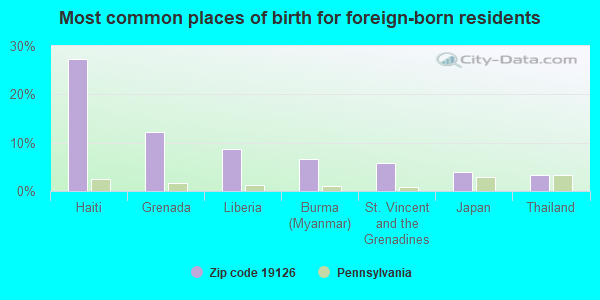
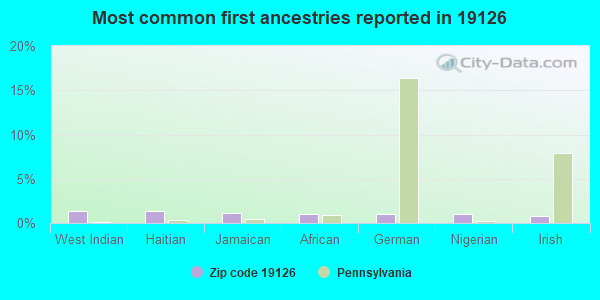
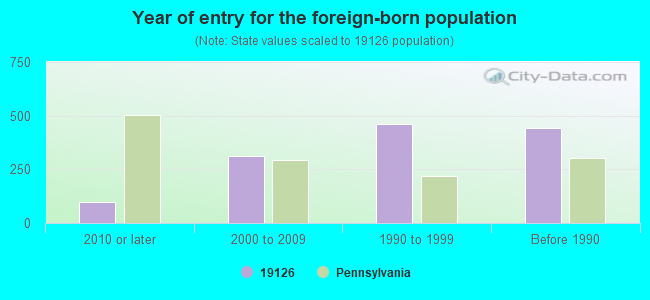


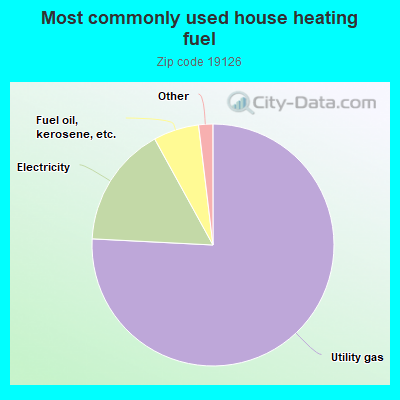
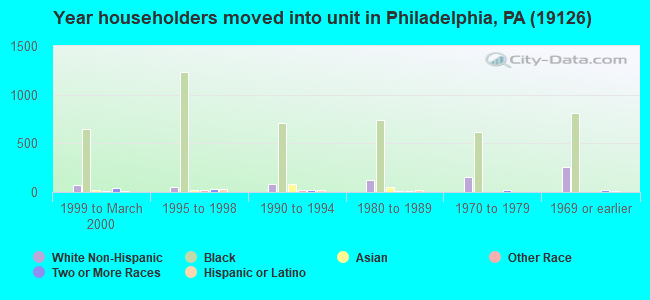
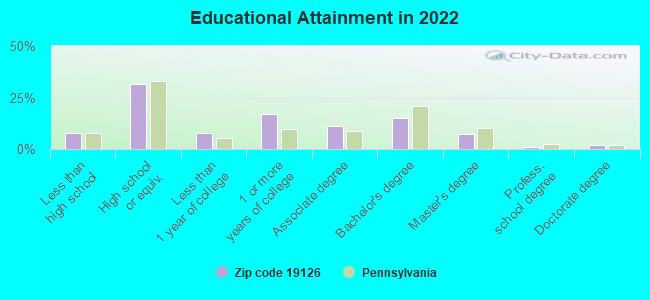
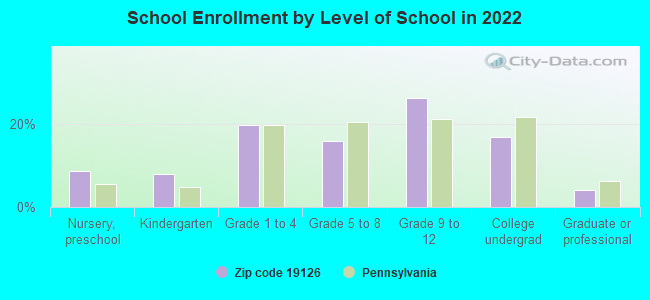
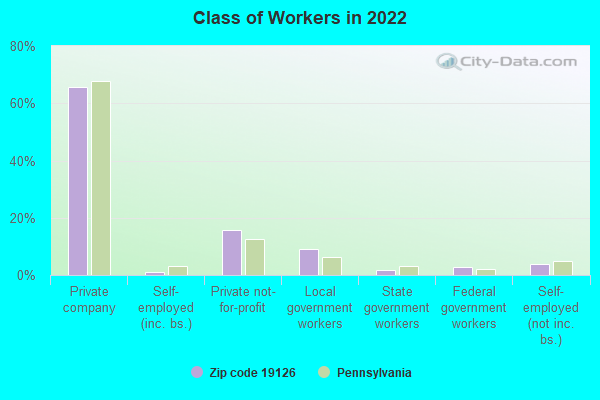
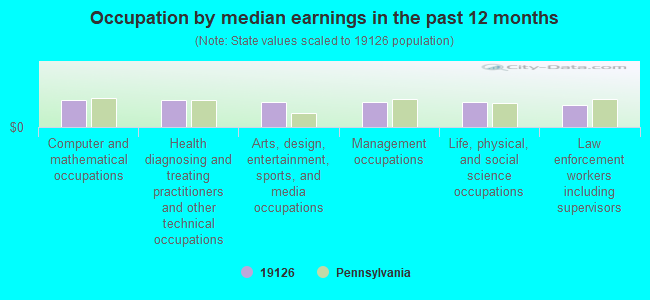
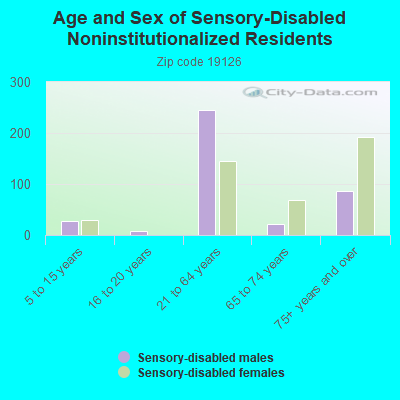
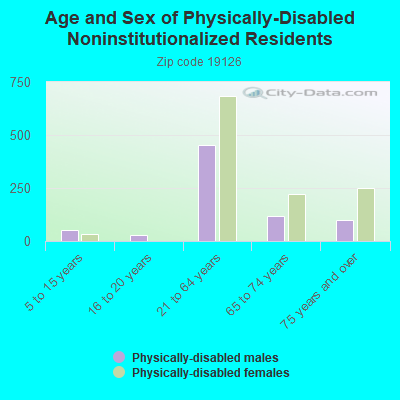
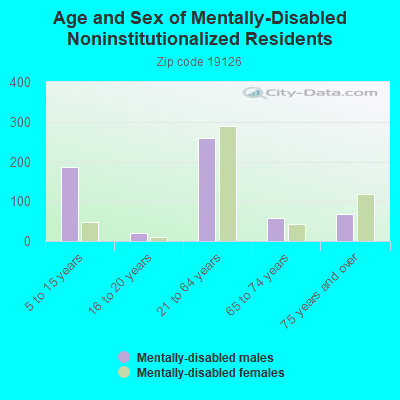
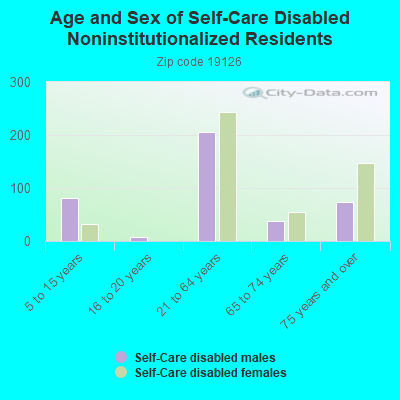
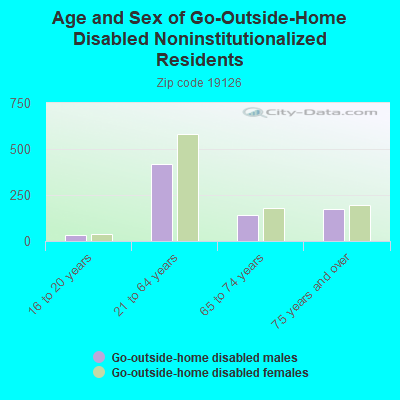
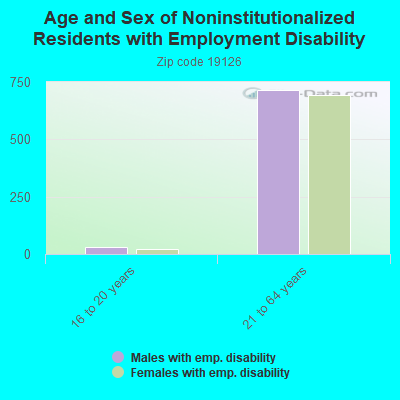
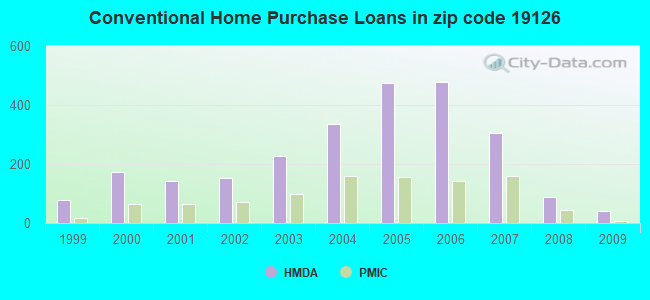
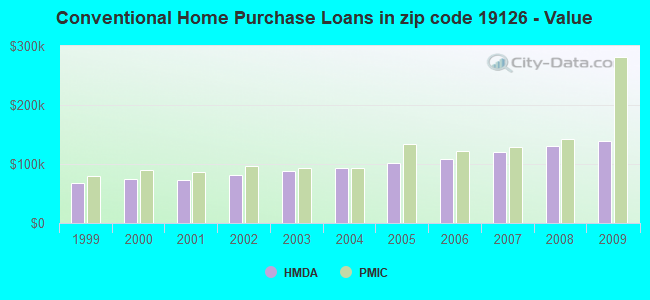
 According to the data from the years 2010 - 2018 the average number of fire incidents per year is 49. The highest number of reported fires - 94 took place in 2010, and the least - 0 in 2016. The data has a dropping trend.
 When looking into fire subcategories, the most reports belonged to: Structure Fires (55.9%), and Outside Fires (21.5%).