Estimated zip code population in 2022: 71,265
Zip code population in 2010: 68,104
Zip code population in 2000: 68,831
Houses and condos: 26,211
Renter-occupied apartments: 8,785
% of renters here:
35%State:
31%
March 2022 cost of living index in zip code 19120: 102.7
(near average, U.S. average is 100)
Land area: 3.4
sq. mi.
Water area: 0.0
sq. mi.
Population density: 20,938 people per square mile (very high).
OSM Map
General Map
Google Map
MSN Map
OSM Map
General Map
Google Map
MSN Map
OSM Map
General Map
Google Map
MSN Map
OSM Map
General Map
Google Map
MSN Map
Please wait while loading the map...
Real estate property taxes paid for housing units in 2022:
This zip code:
0.9% ($1,242)Pennsylvania:
1.3% ($3,094)
Median real estate property taxes paid for housing units with mortgages in 2022: $1,308 (0.8%)
Median real estate property taxes paid for housing units with no mortgage in 2022: $1,146 (0.9%)
Profiles of local businesses
Business Search - 14 Million verified businesses
Males: 33,212 Females: 38,054
For population 25 years and over in 19120:
High school or higher: 74.9%Bachelor's degree or higher: 14.6%Graduate or professional degree: 4.4%Unemployed: 8.2%Mean travel time to work (commute): 36.5 minutes
For population 15 years and over in 19120:
Never married: 48.0%Now married: 35.4%Separated: 3.4%Widowed: 4.5%Divorced: 8.7%
Zip code 19120 compared to state average:
Median household income below state average. Median house value below state average. Unemployed percentage above state average. Black race population percentage significantly above state average. Hispanic race population percentage significantly above state average. Median age below state average. Foreign-born population percentage significantly above state average. Length of stay since moving in significantly above state average. House age above state average. Percentage of population with a bachelor's degree or higher significantly below state average. 31,607 44.4% Black 23,945 33.6% Hispanic or Latino 8,609 12.1% Asian 3,422 4.8% White 2,829 4.0% Two or more races 757 1.1% Some other race 88 0.1% American Indian 4 0.01% Native Hawaiian and Other
Data:
Median household income ($)
Median household income (% change since 2000)
Household income diversity
Ratio of average income to average house value (%)
Ratio of average income to average rent
Median household income ($) - White
Median household income ($) - Black or African American
Median household income ($) - Asian
Median household income ($) - Hispanic or Latino
Median household income ($) - American Indian and Alaska Native
Median household income ($) - Multirace
Median household income ($) - Other Race
Median household income for houses/condos with a mortgage ($)
Median household income for apartments without a mortgage ($)
Races - White alone (%)
Races - White alone (% change since 2000)
Races - Black alone (%)
Races - Black alone (% change since 2000)
Races - American Indian alone (%)
Races - American Indian alone (% change since 2000)
Races - Asian alone (%)
Races - Asian alone (% change since 2000)
Races - Hispanic (%)
Races - Hispanic (% change since 2000)
Races - Native Hawaiian and Other Pacific Islander alone (%)
Races - Native Hawaiian and Other Pacific Islander alone (% change since 2000)
Races - Two or more races (%)
Races - Two or more races (% change since 2000)
Races - Other race alone (%)
Races - Other race alone (% change since 2000)
Racial diversity
Unemployment (%)
Unemployment (% change since 2000)
Unemployment (%) - White
Unemployment (%) - Black or African American
Unemployment (%) - Asian
Unemployment (%) - Hispanic or Latino
Unemployment (%) - American Indian and Alaska Native
Unemployment (%) - Multirace
Unemployment (%) - Other Race
Population density (people per square mile)
Population - Males (%)
Population - Females (%)
Population - Males (%) - White
Population - Males (%) - Black or African American
Population - Males (%) - Asian
Population - Males (%) - Hispanic or Latino
Population - Males (%) - American Indian and Alaska Native
Population - Males (%) - Multirace
Population - Males (%) - Other Race
Population - Females (%) - White
Population - Females (%) - Black or African American
Population - Females (%) - Asian
Population - Females (%) - Hispanic or Latino
Population - Females (%) - American Indian and Alaska Native
Population - Females (%) - Multirace
Population - Females (%) - Other Race
Coronavirus confirmed cases (Apr 27, 2024)
Deaths caused by coronavirus (Apr 27, 2024)
Coronavirus confirmed cases (per 100k population) (Apr 27, 2024)
Deaths caused by coronavirus (per 100k population) (Apr 27, 2024)
Daily increase in number of cases (Apr 27, 2024)
Weekly increase in number of cases (Apr 27, 2024)
Cases doubled (in days) (Apr 27, 2024)
Hospitalized patients (Apr 18, 2022)
Negative test results (Apr 18, 2022)
Total test results (Apr 18, 2022)
COVID Vaccine doses distributed (per 100k population) (Sep 19, 2023)
COVID Vaccine doses administered (per 100k population) (Sep 19, 2023)
COVID Vaccine doses distributed (Sep 19, 2023)
COVID Vaccine doses administered (Sep 19, 2023)
Likely homosexual households (%)
Likely homosexual households (% change since 2000)
Likely homosexual households - Lesbian couples (%)
Likely homosexual households - Lesbian couples (% change since 2000)
Likely homosexual households - Gay men (%)
Likely homosexual households - Gay men (% change since 2000)
Cost of living index
Median gross rent ($)
Median contract rent ($)
Median monthly housing costs ($)
Median house or condo value ($)
Median house or condo value ($ change since 2000)
Mean house or condo value by units in structure - 1, detached ($)
Mean house or condo value by units in structure - 1, attached ($)
Mean house or condo value by units in structure - 2 ($)
Mean house or condo value by units in structure by units in structure - 3 or 4 ($)
Mean house or condo value by units in structure - 5 or more ($)
Mean house or condo value by units in structure - Boat, RV, van, etc. ($)
Mean house or condo value by units in structure - Mobile home ($)
Median house or condo value ($) - White
Median house or condo value ($) - Black or African American
Median house or condo value ($) - Asian
Median house or condo value ($) - Hispanic or Latino
Median house or condo value ($) - American Indian and Alaska Native
Median house or condo value ($) - Multirace
Median house or condo value ($) - Other Race
Median resident age
Resident age diversity
Median resident age - Males
Median resident age - Females
Median resident age - White
Median resident age - Black or African American
Median resident age - Asian
Median resident age - Hispanic or Latino
Median resident age - American Indian and Alaska Native
Median resident age - Multirace
Median resident age - Other Race
Median resident age - Males - White
Median resident age - Males - Black or African American
Median resident age - Males - Asian
Median resident age - Males - Hispanic or Latino
Median resident age - Males - American Indian and Alaska Native
Median resident age - Males - Multirace
Median resident age - Males - Other Race
Median resident age - Females - White
Median resident age - Females - Black or African American
Median resident age - Females - Asian
Median resident age - Females - Hispanic or Latino
Median resident age - Females - American Indian and Alaska Native
Median resident age - Females - Multirace
Median resident age - Females - Other Race
Commute - mean travel time to work (minutes)
Travel time to work - Less than 5 minutes (%)
Travel time to work - Less than 5 minutes (% change since 2000)
Travel time to work - 5 to 9 minutes (%)
Travel time to work - 5 to 9 minutes (% change since 2000)
Travel time to work - 10 to 19 minutes (%)
Travel time to work - 10 to 19 minutes (% change since 2000)
Travel time to work - 20 to 29 minutes (%)
Travel time to work - 20 to 29 minutes (% change since 2000)
Travel time to work - 30 to 39 minutes (%)
Travel time to work - 30 to 39 minutes (% change since 2000)
Travel time to work - 40 to 59 minutes (%)
Travel time to work - 40 to 59 minutes (% change since 2000)
Travel time to work - 60 to 89 minutes (%)
Travel time to work - 60 to 89 minutes (% change since 2000)
Travel time to work - 90 or more minutes (%)
Travel time to work - 90 or more minutes (% change since 2000)
Marital status - Never married (%)
Marital status - Now married (%)
Marital status - Separated (%)
Marital status - Widowed (%)
Marital status - Divorced (%)
Median family income ($)
Median family income (% change since 2000)
Median non-family income ($)
Median non-family income (% change since 2000)
Median per capita income ($)
Median per capita income (% change since 2000)
Median family income ($) - White
Median family income ($) - Black or African American
Median family income ($) - Asian
Median family income ($) - Hispanic or Latino
Median family income ($) - American Indian and Alaska Native
Median family income ($) - Multirace
Median family income ($) - Other Race
Median year house/condo built
Median year apartment built
Year house built - Built 2005 or later (%)
Year house built - Built 2000 to 2004 (%)
Year house built - Built 1990 to 1999 (%)
Year house built - Built 1980 to 1989 (%)
Year house built - Built 1970 to 1979 (%)
Year house built - Built 1960 to 1969 (%)
Year house built - Built 1950 to 1959 (%)
Year house built - Built 1940 to 1949 (%)
Year house built - Built 1939 or earlier (%)
Average household size
Household density (households per square mile)
Average household size - White
Average household size - Black or African American
Average household size - Asian
Average household size - Hispanic or Latino
Average household size - American Indian and Alaska Native
Average household size - Multirace
Average household size - Other Race
Occupied housing units (%)
Vacant housing units (%)
Owner occupied housing units (%)
Renter occupied housing units (%)
Vacancy status - For rent (%)
Vacancy status - For sale only (%)
Vacancy status - Rented or sold, not occupied (%)
Vacancy status - For seasonal, recreational, or occasional use (%)
Vacancy status - For migrant workers (%)
Vacancy status - Other vacant (%)
Residents with income below the poverty level (%)
Residents with income below 50% of the poverty level (%)
Children below poverty level (%)
Poor families by family type - Married-couple family (%)
Poor families by family type - Male, no wife present (%)
Poor families by family type - Female, no husband present (%)
Poverty status for native-born residents (%)
Poverty status for foreign-born residents (%)
Poverty among high school graduates not in families (%)
Poverty among people who did not graduate high school not in families (%)
Residents with income below the poverty level (%) - White
Residents with income below the poverty level (%) - Black or African American
Residents with income below the poverty level (%) - Asian
Residents with income below the poverty level (%) - Hispanic or Latino
Residents with income below the poverty level (%) - American Indian and Alaska Native
Residents with income below the poverty level (%) - Multirace
Residents with income below the poverty level (%) - Other Race
Air pollution - Air Quality Index (AQI)
Air pollution - CO
Air pollution - NO2
Air pollution - SO2
Air pollution - Ozone
Air pollution - PM10
Air pollution - PM25
Air pollution - Pb
Crime - Murders per 100,000 population
Crime - Rapes per 100,000 population
Crime - Robberies per 100,000 population
Crime - Assaults per 100,000 population
Crime - Burglaries per 100,000 population
Crime - Thefts per 100,000 population
Crime - Auto thefts per 100,000 population
Crime - Arson per 100,000 population
Crime - City-data.com crime index
Crime - Violent crime index
Crime - Property crime index
Crime - Murders per 100,000 population (5 year average)
Crime - Rapes per 100,000 population (5 year average)
Crime - Robberies per 100,000 population (5 year average)
Crime - Assaults per 100,000 population (5 year average)
Crime - Burglaries per 100,000 population (5 year average)
Crime - Thefts per 100,000 population (5 year average)
Crime - Auto thefts per 100,000 population (5 year average)
Crime - Arson per 100,000 population (5 year average)
Crime - City-data.com crime index (5 year average)
Crime - Violent crime index (5 year average)
Crime - Property crime index (5 year average)
1996 Presidential Elections Results (%) - Democratic Party (Clinton)
1996 Presidential Elections Results (%) - Republican Party (Dole)
1996 Presidential Elections Results (%) - Other
2000 Presidential Elections Results (%) - Democratic Party (Gore)
2000 Presidential Elections Results (%) - Republican Party (Bush)
2000 Presidential Elections Results (%) - Other
2004 Presidential Elections Results (%) - Democratic Party (Kerry)
2004 Presidential Elections Results (%) - Republican Party (Bush)
2004 Presidential Elections Results (%) - Other
2008 Presidential Elections Results (%) - Democratic Party (Obama)
2008 Presidential Elections Results (%) - Republican Party (McCain)
2008 Presidential Elections Results (%) - Other
2012 Presidential Elections Results (%) - Democratic Party (Obama)
2012 Presidential Elections Results (%) - Republican Party (Romney)
2012 Presidential Elections Results (%) - Other
2016 Presidential Elections Results (%) - Democratic Party (Clinton)
2016 Presidential Elections Results (%) - Republican Party (Trump)
2016 Presidential Elections Results (%) - Other
2020 Presidential Elections Results (%) - Democratic Party (Biden)
2020 Presidential Elections Results (%) - Republican Party (Trump)
2020 Presidential Elections Results (%) - Other
Ancestries Reported - Arab (%)
Ancestries Reported - Czech (%)
Ancestries Reported - Danish (%)
Ancestries Reported - Dutch (%)
Ancestries Reported - English (%)
Ancestries Reported - French (%)
Ancestries Reported - French Canadian (%)
Ancestries Reported - German (%)
Ancestries Reported - Greek (%)
Ancestries Reported - Hungarian (%)
Ancestries Reported - Irish (%)
Ancestries Reported - Italian (%)
Ancestries Reported - Lithuanian (%)
Ancestries Reported - Norwegian (%)
Ancestries Reported - Polish (%)
Ancestries Reported - Portuguese (%)
Ancestries Reported - Russian (%)
Ancestries Reported - Scotch-Irish (%)
Ancestries Reported - Scottish (%)
Ancestries Reported - Slovak (%)
Ancestries Reported - Subsaharan African (%)
Ancestries Reported - Swedish (%)
Ancestries Reported - Swiss (%)
Ancestries Reported - Ukrainian (%)
Ancestries Reported - United States (%)
Ancestries Reported - Welsh (%)
Ancestries Reported - West Indian (%)
Ancestries Reported - Other (%)
Educational Attainment - No schooling completed (%)
Educational Attainment - Less than high school (%)
Educational Attainment - High school or equivalent (%)
Educational Attainment - Less than 1 year of college (%)
Educational Attainment - 1 or more years of college (%)
Educational Attainment - Associate degree (%)
Educational Attainment - Bachelor's degree (%)
Educational Attainment - Master's degree (%)
Educational Attainment - Professional school degree (%)
Educational Attainment - Doctorate degree (%)
School Enrollment - Nursery, preschool (%)
School Enrollment - Kindergarten (%)
School Enrollment - Grade 1 to 4 (%)
School Enrollment - Grade 5 to 8 (%)
School Enrollment - Grade 9 to 12 (%)
School Enrollment - College undergrad (%)
School Enrollment - Graduate or professional (%)
School Enrollment - Not enrolled in school (%)
School enrollment - Public schools (%)
School enrollment - Private schools (%)
School enrollment - Not enrolled (%)
Median number of rooms in houses and condos
Median number of rooms in apartments
Housing units lacking complete plumbing facilities (%)
Housing units lacking complete kitchen facilities (%)
Density of houses
Urban houses (%)
Rural houses (%)
Households with people 60 years and over (%)
Households with people 65 years and over (%)
Households with people 75 years and over (%)
Households with one or more nonrelatives (%)
Households with no nonrelatives (%)
Population in households (%)
Family households (%)
Nonfamily households (%)
Population in families (%)
Family households with own children (%)
Median number of bedrooms in owner occupied houses
Mean number of bedrooms in owner occupied houses
Median number of bedrooms in renter occupied houses
Mean number of bedrooms in renter occupied houses
Median number of vehichles in owner occupied houses
Mean number of vehichles in owner occupied houses
Median number of vehichles in renter occupied houses
Mean number of vehichles in renter occupied houses
Mortgage status - with mortgage (%)
Mortgage status - with second mortgage (%)
Mortgage status - with home equity loan (%)
Mortgage status - with both second mortgage and home equity loan (%)
Mortgage status - without a mortgage (%)
Average family size
Average family size - White
Average family size - Black or African American
Average family size - Asian
Average family size - Hispanic or Latino
Average family size - American Indian and Alaska Native
Average family size - Multirace
Average family size - Other Race
Geographical mobility - Same house 1 year ago (%)
Geographical mobility - Moved within same county (%)
Geographical mobility - Moved from different county within same state (%)
Geographical mobility - Moved from different state (%)
Geographical mobility - Moved from abroad (%)
Place of birth - Born in state of residence (%)
Place of birth - Born in other state (%)
Place of birth - Native, outside of US (%)
Place of birth - Foreign born (%)
Housing units in structures - 1, detached (%)
Housing units in structures - 1, attached (%)
Housing units in structures - 2 (%)
Housing units in structures - 3 or 4 (%)
Housing units in structures - 5 to 9 (%)
Housing units in structures - 10 to 19 (%)
Housing units in structures - 20 to 49 (%)
Housing units in structures - 50 or more (%)
Housing units in structures - Mobile home (%)
Housing units in structures - Boat, RV, van, etc. (%)
House/condo owner moved in on average (years ago)
Renter moved in on average (years ago)
Year householder moved into unit - Moved in 1999 to March 2000 (%)
Year householder moved into unit - Moved in 1995 to 1998 (%)
Year householder moved into unit - Moved in 1990 to 1994 (%)
Year householder moved into unit - Moved in 1980 to 1989 (%)
Year householder moved into unit - Moved in 1970 to 1979 (%)
Year householder moved into unit - Moved in 1969 or earlier (%)
Means of transportation to work - Drove car alone (%)
Means of transportation to work - Carpooled (%)
Means of transportation to work - Public transportation (%)
Means of transportation to work - Bus or trolley bus (%)
Means of transportation to work - Streetcar or trolley car (%)
Means of transportation to work - Subway or elevated (%)
Means of transportation to work - Railroad (%)
Means of transportation to work - Ferryboat (%)
Means of transportation to work - Taxicab (%)
Means of transportation to work - Motorcycle (%)
Means of transportation to work - Bicycle (%)
Means of transportation to work - Walked (%)
Means of transportation to work - Other means (%)
Working at home (%)
Industry diversity
Most Common Industries - Agriculture, forestry, fishing and hunting, and mining (%)
Most Common Industries - Agriculture, forestry, fishing and hunting (%)
Most Common Industries - Mining, quarrying, and oil and gas extraction (%)
Most Common Industries - Construction (%)
Most Common Industries - Manufacturing (%)
Most Common Industries - Wholesale trade (%)
Most Common Industries - Retail trade (%)
Most Common Industries - Transportation and warehousing, and utilities (%)
Most Common Industries - Transportation and warehousing (%)
Most Common Industries - Utilities (%)
Most Common Industries - Information (%)
Most Common Industries - Finance and insurance, and real estate and rental and leasing (%)
Most Common Industries - Finance and insurance (%)
Most Common Industries - Real estate and rental and leasing (%)
Most Common Industries - Professional, scientific, and management, and administrative and waste management services (%)
Most Common Industries - Professional, scientific, and technical services (%)
Most Common Industries - Management of companies and enterprises (%)
Most Common Industries - Administrative and support and waste management services (%)
Most Common Industries - Educational services, and health care and social assistance (%)
Most Common Industries - Educational services (%)
Most Common Industries - Health care and social assistance (%)
Most Common Industries - Arts, entertainment, and recreation, and accommodation and food services (%)
Most Common Industries - Arts, entertainment, and recreation (%)
Most Common Industries - Accommodation and food services (%)
Most Common Industries - Other services, except public administration (%)
Most Common Industries - Public administration (%)
Occupation diversity
Most Common Occupations - Management, business, science, and arts occupations (%)
Most Common Occupations - Management, business, and financial occupations (%)
Most Common Occupations - Management occupations (%)
Most Common Occupations - Business and financial operations occupations (%)
Most Common Occupations - Computer, engineering, and science occupations (%)
Most Common Occupations - Computer and mathematical occupations (%)
Most Common Occupations - Architecture and engineering occupations (%)
Most Common Occupations - Life, physical, and social science occupations (%)
Most Common Occupations - Education, legal, community service, arts, and media occupations (%)
Most Common Occupations - Community and social service occupations (%)
Most Common Occupations - Legal occupations (%)
Most Common Occupations - Education, training, and library occupations (%)
Most Common Occupations - Arts, design, entertainment, sports, and media occupations (%)
Most Common Occupations - Healthcare practitioners and technical occupations (%)
Most Common Occupations - Health diagnosing and treating practitioners and other technical occupations (%)
Most Common Occupations - Health technologists and technicians (%)
Most Common Occupations - Service occupations (%)
Most Common Occupations - Healthcare support occupations (%)
Most Common Occupations - Protective service occupations (%)
Most Common Occupations - Fire fighting and prevention, and other protective service workers including supervisors (%)
Most Common Occupations - Law enforcement workers including supervisors (%)
Most Common Occupations - Food preparation and serving related occupations (%)
Most Common Occupations - Building and grounds cleaning and maintenance occupations (%)
Most Common Occupations - Personal care and service occupations (%)
Most Common Occupations - Sales and office occupations (%)
Most Common Occupations - Sales and related occupations (%)
Most Common Occupations - Office and administrative support occupations (%)
Most Common Occupations - Natural resources, construction, and maintenance occupations (%)
Most Common Occupations - Farming, fishing, and forestry occupations (%)
Most Common Occupations - Construction and extraction occupations (%)
Most Common Occupations - Installation, maintenance, and repair occupations (%)
Most Common Occupations - Production, transportation, and material moving occupations (%)
Most Common Occupations - Production occupations (%)
Most Common Occupations - Transportation occupations (%)
Most Common Occupations - Material moving occupations (%)
People in Group quarters - Institutionalized population (%)
People in Group quarters - Correctional institutions (%)
People in Group quarters - Federal prisons and detention centers (%)
People in Group quarters - Halfway houses (%)
People in Group quarters - Local jails and other confinement facilities (including police lockups) (%)
People in Group quarters - Military disciplinary barracks (%)
People in Group quarters - State prisons (%)
People in Group quarters - Other types of correctional institutions (%)
People in Group quarters - Nursing homes (%)
People in Group quarters - Hospitals/wards, hospices, and schools for the handicapped (%)
People in Group quarters - Hospitals/wards and hospices for chronically ill (%)
People in Group quarters - Hospices or homes for chronically ill (%)
People in Group quarters - Military hospitals or wards for chronically ill (%)
People in Group quarters - Other hospitals or wards for chronically ill (%)
People in Group quarters - Hospitals or wards for drug/alcohol abuse (%)
People in Group quarters - Mental (Psychiatric) hospitals or wards (%)
People in Group quarters - Schools, hospitals, or wards for the mentally retarded (%)
People in Group quarters - Schools, hospitals, or wards for the physically handicapped (%)
People in Group quarters - Institutions for the deaf (%)
People in Group quarters - Institutions for the blind (%)
People in Group quarters - Orthopedic wards and institutions for the physically handicapped (%)
People in Group quarters - Wards in general hospitals for patients who have no usual home elsewhere (%)
People in Group quarters - Wards in military hospitals for patients who have no usual home elsewhere (%)
People in Group quarters - Juvenile institutions (%)
People in Group quarters - Long-term care (%)
People in Group quarters - Homes for abused, dependent, and neglected children (%)
People in Group quarters - Residential treatment centers for emotionally disturbed children (%)
People in Group quarters - Training schools for juvenile delinquents (%)
People in Group quarters - Short-term care, detention or diagnostic centers for delinquent children (%)
People in Group quarters - Type of juvenile institution unknown (%)
People in Group quarters - Noninstitutionalized population (%)
People in Group quarters - College dormitories (includes college quarters off campus) (%)
People in Group quarters - Military quarters (%)
People in Group quarters - On base (%)
People in Group quarters - Barracks, unaccompanied personnel housing (UPH), (Enlisted/Officer), ;and similar group living quarters for military personnel (%)
People in Group quarters - Transient quarters for temporary residents (%)
People in Group quarters - Military ships (%)
People in Group quarters - Group homes (%)
People in Group quarters - Homes or halfway houses for drug/alcohol abuse (%)
People in Group quarters - Homes for the mentally ill (%)
People in Group quarters - Homes for the mentally retarded (%)
People in Group quarters - Homes for the physically handicapped (%)
People in Group quarters - Other group homes (%)
People in Group quarters - Religious group quarters (%)
People in Group quarters - Dormitories (%)
People in Group quarters - Agriculture workers' dormitories on farms (%)
People in Group quarters - Job Corps and vocational training facilities (%)
People in Group quarters - Other workers' dormitories (%)
People in Group quarters - Crews of maritime vessels (%)
People in Group quarters - Other nonhousehold living situations (%)
People in Group quarters - Other noninstitutional group quarters (%)
Residents speaking English at home (%)
Residents speaking English at home - Born in the United States (%)
Residents speaking English at home - Native, born elsewhere (%)
Residents speaking English at home - Foreign born (%)
Residents speaking Spanish at home (%)
Residents speaking Spanish at home - Born in the United States (%)
Residents speaking Spanish at home - Native, born elsewhere (%)
Residents speaking Spanish at home - Foreign born (%)
Residents speaking other language at home (%)
Residents speaking other language at home - Born in the United States (%)
Residents speaking other language at home - Native, born elsewhere (%)
Residents speaking other language at home - Foreign born (%)
Class of Workers - Employee of private company (%)
Class of Workers - Self-employed in own incorporated business (%)
Class of Workers - Private not-for-profit wage and salary workers (%)
Class of Workers - Local government workers (%)
Class of Workers - State government workers (%)
Class of Workers - Federal government workers (%)
Class of Workers - Self-employed workers in own not incorporated business and Unpaid family workers (%)
House heating fuel used in houses and condos - Utility gas (%)
House heating fuel used in houses and condos - Bottled, tank, or LP gas (%)
House heating fuel used in houses and condos - Electricity (%)
House heating fuel used in houses and condos - Fuel oil, kerosene, etc. (%)
House heating fuel used in houses and condos - Coal or coke (%)
House heating fuel used in houses and condos - Wood (%)
House heating fuel used in houses and condos - Solar energy (%)
House heating fuel used in houses and condos - Other fuel (%)
House heating fuel used in houses and condos - No fuel used (%)
House heating fuel used in apartments - Utility gas (%)
House heating fuel used in apartments - Bottled, tank, or LP gas (%)
House heating fuel used in apartments - Electricity (%)
House heating fuel used in apartments - Fuel oil, kerosene, etc. (%)
House heating fuel used in apartments - Coal or coke (%)
House heating fuel used in apartments - Wood (%)
House heating fuel used in apartments - Solar energy (%)
House heating fuel used in apartments - Other fuel (%)
House heating fuel used in apartments - No fuel used (%)
Armed forces status - In Armed Forces (%)
Armed forces status - Civilian (%)
Armed forces status - Civilian - Veteran (%)
Armed forces status - Civilian - Nonveteran (%)
Fatal accidents locations in years 2005-2021
Fatal accidents locations in 2005
Fatal accidents locations in 2006
Fatal accidents locations in 2007
Fatal accidents locations in 2008
Fatal accidents locations in 2009
Fatal accidents locations in 2010
Fatal accidents locations in 2011
Fatal accidents locations in 2012
Fatal accidents locations in 2013
Fatal accidents locations in 2014
Fatal accidents locations in 2015
Fatal accidents locations in 2016
Fatal accidents locations in 2017
Fatal accidents locations in 2018
Fatal accidents locations in 2019
Fatal accidents locations in 2020
Fatal accidents locations in 2021
Alcohol use - People drinking some alcohol every month (%)
Alcohol use - People not drinking at all (%)
Alcohol use - Average days/month drinking alcohol
Alcohol use - Average drinks/week
Alcohol use - Average days/year people drink much
Audiometry - Average condition of hearing (%)
Audiometry - People that can hear a whisper from across a quiet room (%)
Audiometry - People that can hear normal voice from across a quiet room (%)
Audiometry - Ears ringing, roaring, buzzing (%)
Audiometry - Had a job exposure to loud noise (%)
Audiometry - Had off-work exposure to loud noise (%)
Blood Pressure & Cholesterol - Has high blood pressure (%)
Blood Pressure & Cholesterol - Checking blood pressure at home (%)
Blood Pressure & Cholesterol - Frequently checking blood cholesterol (%)
Blood Pressure & Cholesterol - Has high cholesterol level (%)
Consumer Behavior - Money monthly spent on food at supermarket/grocery store
Consumer Behavior - Money monthly spent on food at other stores
Consumer Behavior - Money monthly spent on eating out
Consumer Behavior - Money monthly spent on carryout/delivered foods
Consumer Behavior - Income spent on food at supermarket/grocery store (%)
Consumer Behavior - Income spent on food at other stores (%)
Consumer Behavior - Income spent on eating out (%)
Consumer Behavior - Income spent on carryout/delivered foods (%)
Current Health Status - General health condition (%)
Current Health Status - Blood donors (%)
Current Health Status - Has blood ever tested for HIV virus (%)
Current Health Status - Left-handed people (%)
Dermatology - People using sunscreen (%)
Diabetes - Diabetics (%)
Diabetes - Had a blood test for high blood sugar (%)
Diabetes - People taking insulin (%)
Diet Behavior & Nutrition - Diet health (%)
Diet Behavior & Nutrition - Milk product consumption (# of products/month)
Diet Behavior & Nutrition - Meals not home prepared (#/week)
Diet Behavior & Nutrition - Meals from fast food or pizza place (#/week)
Diet Behavior & Nutrition - Ready-to-eat foods (#/month)
Diet Behavior & Nutrition - Frozen meals/pizza (#/month)
Drug Use - People that ever used marijuana or hashish (%)
Drug Use - Ever used hard drugs (%)
Drug Use - Ever used any form of cocaine (%)
Drug Use - Ever used heroin (%)
Drug Use - Ever used methamphetamine (%)
Health Insurance - People covered by health insurance (%)
Kidney Conditions-Urology - Avg. # of times urinating at night
Medical Conditions - People with asthma (%)
Medical Conditions - People with anemia (%)
Medical Conditions - People with psoriasis (%)
Medical Conditions - People with overweight (%)
Medical Conditions - Elderly people having difficulties in thinking or remembering (%)
Medical Conditions - People who ever received blood transfusion (%)
Medical Conditions - People having trouble seeing even with glass/contacts (%)
Medical Conditions - People with arthritis (%)
Medical Conditions - People with gout (%)
Medical Conditions - People with congestive heart failure (%)
Medical Conditions - People with coronary heart disease (%)
Medical Conditions - People with angina pectoris (%)
Medical Conditions - People who ever had heart attack (%)
Medical Conditions - People who ever had stroke (%)
Medical Conditions - People with emphysema (%)
Medical Conditions - People with thyroid problem (%)
Medical Conditions - People with chronic bronchitis (%)
Medical Conditions - People with any liver condition (%)
Medical Conditions - People who ever had cancer or malignancy (%)
Mental Health - People who have little interest in doing things (%)
Mental Health - People feeling down, depressed, or hopeless (%)
Mental Health - People who have trouble sleeping or sleeping too much (%)
Mental Health - People feeling tired or having little energy (%)
Mental Health - People with poor appetite or overeating (%)
Mental Health - People feeling bad about themself (%)
Mental Health - People who have trouble concentrating on things (%)
Mental Health - People moving or speaking slowly or too fast (%)
Mental Health - People having thoughts they would be better off dead (%)
Oral Health - Average years since last visit a dentist
Oral Health - People embarrassed because of mouth (%)
Oral Health - People with gum disease (%)
Oral Health - General health of teeth and gums (%)
Oral Health - Average days a week using dental floss/device
Oral Health - Average days a week using mouthwash for dental problem
Oral Health - Average number of teeth
Pesticide Use - Households using pesticides to control insects (%)
Pesticide Use - Households using pesticides to kill weeds (%)
Physical Activity - People doing vigorous-intensity work activities (%)
Physical Activity - People doing moderate-intensity work activities (%)
Physical Activity - People walking or bicycling (%)
Physical Activity - People doing vigorous-intensity recreational activities (%)
Physical Activity - People doing moderate-intensity recreational activities (%)
Physical Activity - Average hours a day doing sedentary activities
Physical Activity - Average hours a day watching TV or videos
Physical Activity - Average hours a day using computer
Physical Functioning - People having limitations keeping them from working (%)
Physical Functioning - People limited in amount of work they can do (%)
Physical Functioning - People that need special equipment to walk (%)
Physical Functioning - People experiencing confusion/memory problems (%)
Physical Functioning - People requiring special healthcare equipment (%)
Prescription Medications - Average number of prescription medicines taking
Preventive Aspirin Use - Adults 40+ taking low-dose aspirin (%)
Reproductive Health - Vaginal deliveries (%)
Reproductive Health - Cesarean deliveries (%)
Reproductive Health - Deliveries resulted in a live birth (%)
Reproductive Health - Pregnancies resulted in a delivery (%)
Reproductive Health - Women breastfeeding newborns (%)
Reproductive Health - Women that had a hysterectomy (%)
Reproductive Health - Women that had both ovaries removed (%)
Reproductive Health - Women that have ever taken birth control pills (%)
Reproductive Health - Women taking birth control pills (%)
Reproductive Health - Women that have ever used Depo-Provera or injectables (%)
Reproductive Health - Women that have ever used female hormones (%)
Sexual Behavior - People 18+ that ever had sex (vaginal, anal, or oral) (%)
Sexual Behavior - Males 18+ that ever had vaginal sex with a woman (%)
Sexual Behavior - Males 18+ that ever performed oral sex on a woman (%)
Sexual Behavior - Males 18+ that ever had anal sex with a woman (%)
Sexual Behavior - Males 18+ that ever had any sex with a man (%)
Sexual Behavior - Females 18+ that ever had vaginal sex with a man (%)
Sexual Behavior - Females 18+ that ever performed oral sex on a man (%)
Sexual Behavior - Females 18+ that ever had anal sex with a man (%)
Sexual Behavior - Females 18+ that ever had any kind of sex with a woman (%)
Sexual Behavior - Average age people first had sex
Sexual Behavior - Average number of female sex partners in lifetime (males 18+)
Sexual Behavior - Average number of female vaginal sex partners in lifetime (males 18+)
Sexual Behavior - Average age people first performed oral sex on a woman (18+)
Sexual Behavior - Average number of woman performed oral sex on in lifetime (18+)
Sexual Behavior - Average number of male sex partners in lifetime (males 18+)
Sexual Behavior - Average number of male anal sex partners in lifetime (males 18+)
Sexual Behavior - Average age people first performed oral sex on a man (18+)
Sexual Behavior - Average number of male oral sex partners in lifetime (18+)
Sexual Behavior - People using protection when performing oral sex (%)
Sexual Behavior - Average number of times people have vaginal or anal sex a year
Sexual Behavior - People having sex without condom (%)
Sexual Behavior - Average number of male sex partners in lifetime (females 18+)
Sexual Behavior - Average number of male vaginal sex partners in lifetime (females 18+)
Sexual Behavior - Average number of female sex partners in lifetime (females 18+)
Sexual Behavior - Circumcised males 18+ (%)
Sleep Disorders - Average hours sleeping at night
Sleep Disorders - People that has trouble sleeping (%)
Smoking-Cigarette Use - People smoking cigarettes (%)
Taste & Smell - People 40+ having problems with smell (%)
Taste & Smell - People 40+ having problems with taste (%)
Taste & Smell - People 40+ that ever had wisdom teeth removed (%)
Taste & Smell - People 40+ that ever had tonsils teeth removed (%)
Taste & Smell - People 40+ that ever had a loss of consciousness because of a head injury (%)
Taste & Smell - People 40+ that ever had a broken nose or other serious injury to face or skull (%)
Taste & Smell - People 40+ that ever had two or more sinus infections (%)
Weight - Average height (inches)
Weight - Average weight (pounds)
Weight - Average BMI
Weight - People that are obese (%)
Weight - People that ever were obese (%)
Weight - People trying to lose weight (%)
100%
urban population.
Estimated median house/condo value in 2022: $144,565
19120:
$144,565Pennsylvania:
$245,500
According to our research of Pennsylvania and other state lists, there were 62 registered sex offenders living in 19120 zip code as of April 27, 2024 . The ratio of all residents to sex offenders in zip code 19120 is 1,251 to 1.The ratio of registered sex offenders to all residents in this zip code is lower than the state average.
Median resident age: This zip code:
34.3 yearsPennsylvania median age:
40.9 years
Average household size: This zip code:
2.8 peoplePennsylvania:
2.4 people
Averages for the 2020 tax year for zip code 19120, filed in 2021:
Average Adjusted Gross Income (AGI) in 2020: $35,489 (Individual Income Tax Returns) Here:
$35,489State:
$75,707
Salary/wage: $33,651 (reported on 82.9% of returns )Here:
$33,651State:
$62,806
(% of AGI for various income ranges: 989.9% for AGIs below $25k , 3387.9% for AGIs $25k-50k , 6674.7% for AGIs $50k-75k , 10624.8% for AGIs $75k-100k , 16588.6% for AGIs $100k-200k ) Taxable interest for individuals: $432 (reported on 9.2% of returns )This zip code:
$432Pennsylvania:
$1,633
(% of AGI for various income ranges: 2.2% for AGIs below $25k , 3.5% for AGIs $25k-50k , 8.1% for AGIs $50k-75k , 15.7% for AGIs $75k-100k , 36.8% for AGIs $100k-200k ) Ordinary dividends: $1,375 (reported on 2.6% of returns )(% of AGI for various income ranges: 2.0% for AGIs below $25k , 1.6% for AGIs $25k-50k , 7.3% for AGIs $50k-75k , 15.2% for AGIs $75k-100k , 63.2% for AGIs $100k-200k ) Net capital gain/loss in AGI: +$2,483 (reported on 2.7% of returns )Here:
+$2,483State:
+$23,522
(% of AGI for various income ranges: 1.4% for AGIs below $25k , 4.4% for AGIs $25k-50k , 15.3% for AGIs $50k-75k , 39.6% for AGIs $75k-100k , 108.0% for AGIs $100k-200k ) Profit/loss from business: +$4,998 (reported on 15.4% of returns )Here:
+$4,998State:
+$16,274
(% of AGI for various income ranges: 107.0% for AGIs below $25k , 67.2% for AGIs $25k-50k , 79.5% for AGIs $50k-75k , 166.6% for AGIs $75k-100k , 333.2% for AGIs $100k-200k ) Taxable individual retirement arrangement distribution: $10,504 (reported on 1.8% of returns )19120:
$10,504Pennsylvania:
$18,583
(% of AGI for various income ranges: 8.5% for AGIs below $25k , 11.2% for AGIs $25k-50k , 37.4% for AGIs $50k-75k , 67.2% for AGIs $75k-100k , 361.1% for AGIs $100k-200k ) Total itemized deductions: $25,994 (reported on 4.2% of returns )Here:
$25,994State:
$34,850
(% of AGI for various income ranges: 10.5% for AGIs below $25k , 98.5% for AGIs $25k-50k , 301.1% for AGIs $50k-75k , 627.0% for AGIs $75k-100k , 1147.9% for AGIs $100k-200k ) Charity contributions: $8,819 (reported on 3.5% of returns )(% of AGI for various income ranges: 1.3% for AGIs below $25k , 23.9% for AGIs $25k-50k , 91.2% for AGIs $50k-75k , 192.0% for AGIs $75k-100k , 380.5% for AGIs $100k-200k ) Taxes paid: $7,438 (reported on 4.2% of returns )(% of AGI for various income ranges: 2.2% for AGIs below $25k , 27.9% for AGIs $25k-50k , 87.3% for AGIs $50k-75k , 186.5% for AGIs $75k-100k , 315.7% for AGIs $100k-200k ) Earned income credit: $2,382 (reported on 31.5% of returns )(% of AGI for various income ranges: 137.0% for AGIs below $25k , 94.7% for AGIs $25k-50k , 0.9% for AGIs $50k-75k ) Percentage of individuals using paid preparers for their 2020 taxes: 91.8%(% for various income ranges: 91.4% for AGIs below $25k , 93.4% for AGIs $25k-50k , 91.0% for AGIs $50k-75k , 89.4% for AGIs $75k-100k , 85.7% for AGIs $100k-200k , 100.0% for AGIs over 200k )
Averages for the 2012 tax year for zip code 19120, filed in 2013:
Average Adjusted Gross Income (AGI) in 2012: $28,622 (Individual Income Tax Returns) Here:
$28,622State:
$61,346
Salary/wage: $28,278 (reported on 87.3% of returns )Here:
$28,278State:
$51,902
(% of AGI for various income ranges: 77.0% for AGIs below $25k , 90.6% for AGIs $25k-50k , 90.5% for AGIs $50k-75k , 87.7% for AGIs $75k-100k , 81.3% for AGIs $100k-200k ) Taxable interest for individuals: $495 (reported on 9.7% of returns )This zip code:
$495Pennsylvania:
$1,588
(% of AGI for various income ranges: 0.2% for AGIs below $25k , 0.1% for AGIs $25k-50k , 0.2% for AGIs $50k-75k , 0.3% for AGIs $75k-100k , 0.2% for AGIs $100k-200k ) Ordinary dividends: $1,905 (reported on 3.1% of returns )(% of AGI for various income ranges: 0.3% for AGIs below $25k , 0.1% for AGIs $25k-50k , 0.1% for AGIs $50k-75k , 0.3% for AGIs $75k-100k , 0.5% for AGIs $100k-200k ) Net capital gain/loss in AGI: +$581 (reported on 1.9% of returns )(% of AGI for various income ranges: 0.1% for AGIs $100k-200k ) Profit/loss from business: +$8,468 (reported on 12.2% of returns )Here:
+$8,468State:
+$16,268
(% of AGI for various income ranges: 11.7% for AGIs below $25k , 1.6% for AGIs $25k-50k , 0.3% for AGIs $50k-75k , 0.4% for AGIs $75k-100k , 0.3% for AGIs $100k-200k ) Taxable individual retirement arrangement distribution: $9,531 (reported on 2.3% of returns )19120:
$9,531Pennsylvania:
$14,550
(% of AGI for various income ranges: 0.5% for AGIs below $25k , 0.5% for AGIs $25k-50k , 0.7% for AGIs $50k-75k , 1.1% for AGIs $75k-100k , 2.6% for AGIs $100k-200k ) Total itemized deductions: $15,197 (29% of AGI, reported on 20.8% of returns )Here:
$15,197State:
$23,538
Here:
29.3% of AGIState:
18.4% of AGI
(% of AGI for various income ranges: 4.7% for AGIs below $25k , 11.6% for AGIs $25k-50k , 14.7% for AGIs $50k-75k , 14.8% for AGIs $75k-100k , 14.6% for AGIs $100k-200k ) Charity contributions: $3,203 (reported on 16.3% of returns )(% of AGI for various income ranges: 0.5% for AGIs below $25k , 1.8% for AGIs $25k-50k , 2.6% for AGIs $50k-75k , 2.9% for AGIs $75k-100k , 2.9% for AGIs $100k-200k ) Taxes paid: $5,052 (reported on 20.7% of returns )(% of AGI for various income ranges: 0.9% for AGIs below $25k , 3.3% for AGIs $25k-50k , 5.3% for AGIs $50k-75k , 6.3% for AGIs $75k-100k , 6.4% for AGIs $100k-200k ) Earned income credit: $2,553 (reported on 42.3% of returns )(% of AGI for various income ranges: 12.2% for AGIs below $25k , 2.0% for AGIs $25k-50k ) Percentage of individuals using paid preparers for their 2012 taxes: 53.5%(% for various income ranges: 55.8% for AGIs below $25k , 51.4% for AGIs $25k-50k , 49.6% for AGIs $50k-75k , 51.1% for AGIs $75k-100k , 47.8% for AGIs $100k-200k )
Averages for the 2004 tax year for zip code 19120, filed in 2005:
Average Adjusted Gross Income (AGI) in 2004: $26,527 (Individual Income Tax Returns) Here:
$26,527State:
$48,049
Salary/wage: $26,667 (reported on 90.7% of returns )Here:
$26,667State:
$42,646
(% of AGI for various income ranges: 80.2% for AGIs below $10k , 86.7% for AGIs $10k-25k , 94.6% for AGIs $25k-50k , 93.1% for AGIs $50k-75k , 92.0% for AGIs $75k-100k , 82.0% for AGIs over 100k ) Taxable interest for individuals: $959 (reported on 18.1% of returns )This zip code:
$959Pennsylvania:
$1,657
(% of AGI for various income ranges: 1.6% for AGIs below $10k , 0.7% for AGIs $10k-25k , 0.4% for AGIs $25k-50k , 0.7% for AGIs $50k-75k , 0.9% for AGIs $75k-100k , 1.4% for AGIs over 100k ) Taxable dividends: $1,150 (reported on 5.0% of returns )(% of AGI for various income ranges: 0.5% for AGIs below $10k , 0.2% for AGIs $10k-25k , 0.2% for AGIs $25k-50k , 0.2% for AGIs $50k-75k , 0.3% for AGIs $75k-100k , 0.2% for AGIs over 100k ) Net capital gain/loss: +$1,855 (reported on 3.3% of returns )Here:
+$1,855State:
+$9,716
(% of AGI for various income ranges: -0.2% for AGIs below $10k , 0.1% for AGIs $10k-25k , 0.1% for AGIs $25k-50k , 0.4% for AGIs $50k-75k , 0.6% for AGIs $75k-100k , 1.9% for AGIs over 100k ) Profit/loss from business: +$7,050 (reported on 8.4% of returns )Here:
+$7,050State:
+$14,267
(% of AGI for various income ranges: 11.3% for AGIs below $10k , 5.1% for AGIs $10k-25k , 1.1% for AGIs $25k-50k , 0.5% for AGIs $50k-75k , 0.8% for AGIs $75k-100k , 0.2% for AGIs over 100k ) IRA payment deduction: $2,163 (reported on 1.2% of returns )19120:
$2,163Pennsylvania:
$2,903
(% of AGI for various income ranges: 0.1% for AGIs below $10k , 0.1% for AGIs $10k-25k , 0.1% for AGIs $25k-50k , 0.1% for AGIs $50k-75k , 0.1% for AGIs $75k-100k ) Total itemized deductions: $13,320 (28% of AGI, reported on 25.0% of returns )Here:
$13,320State:
$18,804
Here:
28.4% of AGIState:
19.5% of AGI
(% of AGI for various income ranges: 3.3% for AGIs below $10k , 5.3% for AGIs $10k-25k , 13.5% for AGIs $25k-50k , 17.2% for AGIs $50k-75k , 18.3% for AGIs $75k-100k , 17.6% for AGIs over 100k ) Charity contributions deductions: $2,989 (6% of AGI, reported on 22.3% of returns )Here:
6.2% of AGIState:
3.3% of AGI
(% of AGI for various income ranges: 0.3% for AGIs below $10k , 0.9% for AGIs $10k-25k , 2.7% for AGIs $25k-50k , 3.5% for AGIs $50k-75k , 4.0% for AGIs $75k-100k , 4.3% for AGIs over 100k ) Total tax: $2,663 (reported on 57.3% of returns )(% of AGI for various income ranges: 2.4% for AGIs below $10k , 2.8% for AGIs $10k-25k , 5.0% for AGIs $25k-50k , 8.1% for AGIs $50k-75k , 9.8% for AGIs $75k-100k , 13.4% for AGIs over 100k ) Earned income credit: $1,956 (reported on 39.3% of returns )Percentage of individuals using paid preparers for their 2004 taxes: 58.6%(% for various income ranges: 56.8% for AGIs below $10k , 64.4% for AGIs $10k-25k , 55.2% for AGIs $25k-50k , 55.4% for AGIs $50k-75k , 50.8% for AGIs $75k-100k , 60.0% for AGIs over 100k )
Estimated median household income in 2022: This zip code:
$45,633Pennsylvania:
$71,798
Nearest zip codes: 19141 ,
19126 ,
19012 ,
19124 ,
19140 ,
19027 .
Philadelphia Zip Code Map
Percentage of family households: This zip code:
51.5%Pennsylvania:
42.6%
Percentage of households with unmarried partners: This zip code:
8.0%Pennsylvania:
46.5%
Likely homosexual households (counted as self-reported same-sex unmarried-partner households)
Lesbian couples: 0.1% of all households Gay men: 0.0% of all households
Household received Food Stamps/SNAP in the past 12 months: 10,490Household did not receive Food Stamps/SNAP in the past 12 months: 15,015
Women who had a birth in the past 12 months: 1,119 (394 now married , 641 unmarried) Women who did not have a birth in the past 12 months: 15,506 (4,858 now married , 10,693 unmarried)
Housing units in zip code 19120 with a mortgage: 9,963 (586
second mortgage , 56
home equity loan , 409
both second mortgage and home equity loan )
Houses without a mortgage: 794
Median monthly owner costs for units with a mortgage: $1,124
Median monthly owner costs for units without a mortgage: $410
Residents with income below the poverty level in 2022:
This zip code:
28.8%Whole state:
11.8%
Residents with income below 50% of the poverty level in 2022:
This zip code:
14.8%Whole state:
6.1%
Median number of rooms in houses and condos: Median number of rooms in apartments: Notable locations in this zip code not listed on our city pages
Click to draw/clear zip code borders Notable locations in zip code 19120: (A) , Fern Rock Station (B) , Tabor Station (C) , Olney Station (D) , Feltonville Community Center (E) , Greater Olney Branch Library Free Library of Philadelphia (F) , Philadelphia Fire Department Engine 61 (G) , Wyoming Branch Library Free Library of Philadelphia (H) , Olney Recreation Center (I) . Display/hide their locations on the map
Shopping Center: (1) . Display/hide its location on the map
Cemetery: (1) . Display/hide its location on the map
Reservoir: (A) . Display/hide its location on the map
Parks in zip code 19120 include: (1) , Fisher Park (2) , Lindley Playground (3) , Ziehler Playground (4) . Display/hide their locations on the map
Tourist attractions (not listed on the city page) :
Year house built (houses)
0 2020 or later69 2010 to 2019264 2000 to 2009712 1990 to 1999792 1980 to 19891,128 1970 to 19792,123 1960 to 19695,490 1950 to 19594,808 1940 to 194910,186 1939 or earlier
Zip code 19120 household income distribution in 2022 2,382 Less than $10,0001,852 $10,000 to $14,9991,820 $15,000 to $19,9991,558 $20,000 to $24,9991,036 $25,000 to $29,9991,399 $30,000 to $34,9991,094 $35,000 to $39,9991,196 $40,000 to $44,9991,010 $45,000 to $49,9992,301 $50,000 to $59,9992,038 $60,000 to $74,9993,442 $75,000 to $99,9991,336 $100,000 to $124,9991,049 $125,000 to $149,999703 $150,000 to $199,999947 $200,000 or moreEstimate of home value of owner-occupied houses/condos in 2022 in zip code 19120 156 Less than $10,000149 $10,000 to $14,99968 $15,000 to $19,99963 $20,000 to $24,99920 $25,000 to $29,9991 $30,000 to $34,999191 $40,000 to $49,999137 $50,000 to $59,999224 $60,000 to $69,999656 $70,000 to $79,999630 $80,000 to $89,9991,044 $90,000 to $99,9992,936 $100,000 to $124,9992,124 $125,000 to $149,9991,893 $150,000 to $174,9991,693 $175,000 to $199,999954 $200,000 to $249,999353 $250,000 to $299,999415 $300,000 to $399,99966 $400,000 to $499,999266 $500,000 to $749,999361 $750,000 to $999,99910 $1,000,000 to $1,499,99915 $1,500,000 to $1,999,999103 $2,000,000 or moreRent paid by renters in 2022 in zip code 19120 120 Less than $1004 $150 to $199293 $200 to $24967 $250 to $299122 $300 to $34956 $350 to $39930 $400 to $449117 $450 to $499178 $500 to $549507 $550 to $599269 $600 to $649769 $650 to $699308 $700 to $749493 $750 to $799863 $800 to $8991,170 $900 to $9992,162 $1,000 to $1,249586 $1,250 to $1,49963 $1,500 to $1,99912 $2,000 to $2,499396 No cash rent
Median gross rent in 2022: $1,138.
Median price asked for vacant for-sale houses and condos in 2022: $171,017.
Estimated median house (or condo) value in 2022 for: White Non-Hispanic householders: $140,167Black or African American householders: $153,634American Indian or Alaska Native householders: $150,611Asian householders: $146,214Native Hawaiian and other Pacific Islander householders: $48,096Some other race householders: $128,899Two or more races householders: $143,740Hispanic or Latino householders: $132,746Estimated median house or condo value in 2022: $144,565
19120:
$144,565Pennsylvania:
$245,500
Lower value quartile - upper value quartile: $111,745 - $191,157
Mean price in 2022: Detached houses: $382,521Here:
$382,521State:
$317,202
Townhouses or other attached units: $260,733Here:
$260,733State:
$254,369
In 2-unit structures: $270,436Here:
$270,436State:
$249,182
In 3-to-4-unit structures: $324,453Here:
$324,453State:
$297,446
In 5-or-more-unit structures: $444,254Here:
$444,254State:
$320,068
Mobile homes: $57,703Here:
$57,703State:
$92,414
Occupied boats, RVs, vans, etc.: $424,146Here:
$424,146State:
$563,750
Housing units in structures:
One, detached: 1,878One, attached: 19,737Two: 1,9823 or 4: 9385 to 9: 64210 to 19: 14120 to 49: 39450 or more: 263Mobile homes: 12Unemployment : 8.2%
Means of transportation to work in zip code 19120 57.9% 15,903 Drove a car alone13.3% 3,649 Carpooled10.1% 2,783 Bus or trolley bus2.7% 749 Streetcar or trolley car0.9% 250 Subway or elevated0.6% 176 Railroad0.1% 14 Bicycle1.3% 346 Walked1.7% 453 Other means6.5% 1,783 Worked at homeTravel time to work (commute) in zip code 19120 258 Less than 5 minutes744 5 to 9 minutes2,113 10 to 14 minutes2,455 15 to 19 minutes2,455 20 to 24 minutes1,564 25 to 29 minutes4,185 30 to 34 minutes610 35 to 39 minutes1,501 40 to 44 minutes4,726 45 to 59 minutes3,089 60 to 89 minutes1,353 90 or more minutes
Neighborhoods in zip code 19120: Percentage of zip code residents living and working in this county: 70.4%
Household type by relationship:
Households: 71,265
Male householders: 9,258 (2,496 living alone ), Female householders: 15,886 (3,671 living alone )7,407 spouses (7,383 opposite-sex spouses ), 2,159 unmarried partners , (2,010 opposite-sex unmarried partners ), 24,695 children (23,560 natural , 277 adopted , 866 stepchildren ), 4,860 grandchildren , 1,089 brothers or sisters , 1,782 parents , 90 foster children , 1,574 other relatives , 1,816 non-relatives In group quarters: 119 (-1 institutionalized population )
Size of family households: 5,211 2-persons , 5,389 3-persons , 2,668 4-persons , 2,263 5-persons , 704 6-persons , 922 7-or-more-persons
Size of nonfamily households: 6,166 1-person , 1,527 2-persons , 7 3-persons , 52 4-persons , 14 5-persons , 34 6-persons
6,688 married couples with children. single-parent households (1,532 men , 6,951 women ).
56.6% of residents of 19120 zip code speak English at home. of residents speak Spanish at home (52% very well, 22% well, 16% not well, 10% not at all ).of residents speak other Indo-European language at home (47% very well, 43% well, 9% not well, 1% not at all ).of residents speak Asian or Pacific Island language at home (34% very well, 13% well, 38% not well, 15% not at all ).of residents speak other language at home (79% very well, 10% well, 10% not well, 1% not at all ).
Foreign born population: 15,055 (21.1%)
(48.8%
of them are naturalized citizens )
This zip code:
21.1%Whole state:
7.5%
23% Dominica 17% Thailand 12% Burma (Myanmar) 4% Haiti 4% Grenada 3% El Salvador 3% Honduras 3% Haitian 2% American 2% African 1% Jamaican 1% Irish 1% Italian 1% German
Year of entry for the foreign-born population
7,057 2010 or later 4,169 2000 to 2009 3,248 1990 to 1999 6,665 Before 1990
There are
191 Medical Specialists in Zip Code 19120 .
Facilities with environmental interests located in this zip code:
ATLANTIC SVC STA (5338 N 5TH STREET in PHILADELPHIA, PA)
STATE MASTER (Pennsylvania database) - RCRIS-PAD987324472, HAZARDOUS WASTE PROGRAM Conditionally Exempt Small Quantity Generators, less than 100 kg/month of hazardous waste (Resource Conservation and Recovery Act (tracking hazardous waste)) - notification Organizations: OPERNAME (CONTACT/OPERATOR)
, ATLANTIC REFINING & MKTNG CO (CONTACT/OWNER)
, ATLANTIC REFINING & MARKETING CORPORATION (CONTACT/OWNER)
Alternative names: ATLANTIC SS 0363 1710, SUN COMPANY INC #0363-1710
ATOMIC TIRE & AUTO SVC (5633 E TABOR RD in PHILADELPHIA, PA)
STATE MASTER (Pennsylvania database) - RCRIS-PAD987393956, HAZARDOUS WASTE PROGRAM (Resource Conservation and Recovery Act (tracking hazardous waste))
3M BRANCH SALES CENTER (5698 RISING SUN AVE in PHILADELPHIA, PA)
(Resource Conservation and Recovery Act (tracking hazardous waste)) Organizations: OPERNAME (CONTACT/OPERATOR)
, MINNESOTA MINING & MANUFACTURING CO (CONTACT/OWNER)
ADAMS RUN DRY CLEANERS (6201 N. FRONT STREET in PHILADELPHIA, PA)
AIR MINOR (AIRS/AFS) Business SIC classification: DRYCLEANING PLANTS, EXCEPT RUG CLEANING
ALLEN TIRE & SVC (4439-41 WHITAKER AVE in PHILADELPHIA, PA)
Conditionally Exempt Small Quantity Generators, less than 100 kg/month of hazardous waste (Resource Conservation and Recovery Act (tracking hazardous waste)) - notification
Housing units lacking complete plumbing facilities: 0.9%
Housing units lacking complete kitchen facilities: 1.3%
76.1% Utility gas 18.6% Electricity 2.4% Fuel oil, kerosene, etc. 1.7% Bottled, tank, or LP gas 0.5% No fuel used
Population in 1990: 63,223. Population change in the 1990s: +5,608 (+8.9%).
Place of birth for U.S.-born residents:
This state: 41,981Northeast: 4,475Midwest: 309South: 2,627West: 669
66% of the 19120 zip code residents lived in the same house 5 years ago.
Out of people who lived in different houses, 84% lived in this county.
Out of people who lived in different counties, 50% lived in Pennsylvania.
92% of the 19120 zip code residents lived in the same house 1 year ago.
Out of people who lived in different houses, 75% moved from this county.
Out of people who lived in different houses, 3% moved from different county within same state.
Out of people who lived in different houses, 14% moved from different state.
Out of people who lived in different houses, 9% moved from abroad.
Private vs. public school enrollment:
Students in private schools in grades 1 to 8 (elementary and middle school): 941
Here:
11.7%Pennsylvania:
15.7%
Students in private schools in grades 9 to 12 (high school): 723
Here:
16.5%Pennsylvania:
13.4%
Students in private undergraduate colleges: 616
Here:
25.6%Pennsylvania:
39.8%
Occupation by median earnings in the past 12 months ($)
117,402 Law enforcement workers including supervisors 67,488 Architecture and engineering occupations 63,689 Management occupations 61,769 Business and financial operations occupations 57,275 Health diagnosing and treating practitioners and other technical occupations 52,923 Computer and mathematical occupations
Companies with federal contracts located in this zip code:
RUSCOMB TOOL & MACHINE CO (600 W RUSCOMB ST in PHILADELPHIA, PA; small business) in 20 contracts from 1999 to 2006
Contracts for Helicopter Rotor Blades, Drive Mechanisms and Components, Miscellaneous Power Transmission Equipment, Airframe Structural Components, Hardware, Commercial, and more by Army, Defense Logistics AgencySigned by year: 2000: $806,211; 2001: $115,910; 2002: $62,946; 2003: $555,128; 2004: $105,468; 2005: $379,841; 2006: $399,700.
Biggest contracts: with Army for Helicopter Rotor Blades, Drive Mechanisms and Components. Signed on 2003-10-07. Completion date: 2004-08-30.
, same as above. Signed on 2006-06-23. Completion date: 2011-08-31.
with Army for Miscellaneous Power Transmission Equipment. Signed on 2000-05-15. Completion date: 2003-02-28.
with Army for Helicopter Rotor Blades, Drive Mechanisms and Components. Signed on 2005-05-19. Completion date: 2008-10-31.
STOKES VACUUM INC (5500 TABOR RD in PHILADELPHIA, PA) in 4 contracts from 2001 to 2002
$45,525 with Navy for Other Defense -- Applied Research and Exploratory Development (R&D). Signed on 2001-09-24. Completion date: 2001-09-25.
with Defense Logistics Agency for Miscellaneous Special Industry Machinery. Signed on 2002-03-20. Completion date: 2002-04-03.
with NASA for Compressors and Vacuum Pumps. Signed on 2001-03-15. Completion date: 2001-05-15.
with Navy for Power and Hand Pumps. Signed on 2001-11-01. Completion date: 2001-11-30.
DARLINGTON, LARRY J (4915 N 7TH ST in PHILADELPHIA, PA; small business)
$5,750 with Army for Office Furniture. Signed on 2006-01-13. Completion date: 2006-01-06.
Top industries in this zip code by the number of employees in 2005:
Construction: Plumbing, Heating, and Air-Conditioning Contractors (500-999 employees: 1 establishment, 20-49 employees: 1 establishment, 5-9 employees: 2 establishments, 1-4 employees: 3 establishments)Other Services (except Public Administration): Religious Organizations (50-99: 1, 20-49: 4, 10-19: 2, 5-9: 7, 1-4: 12)Accommodation and Food Services: Limited-Service Restaurants (50-99: 1, 20-49: 3, 10-19: 2, 5-9: 5, 1-4: 26)
People in group quarters in 2010:
64 people in group homes intended for adults
40 people in other noninstitutional facilities
25 people in residential treatment centers for adults
People in group quarters in 2000:
38 people in religious group quarters
17 people in homes or halfway houses for drug/alcohol abuse
11 people in other group homes
9 people in other noninstitutional group quarters
4 people in other nonhousehold living situations
2 people in homes for the mentally ill
2 people in homes for the mentally retarded
Fatal accident statistics in 2014:
Fatal accident count: 1Vehicles involved in fatal accidents: 1Fatal accidents caused by drunken drivers: 0Fatalities: 1Persons involved in fatal accidents: 1Pedestrians involved in fatal accidents: 0
Fatal accident statistics in 2013:
Fatal accident count: 11Vehicles involved in fatal accidents: 20Fatal accidents caused by drunken drivers: 4Fatalities: 14Persons involved in fatal accidents: 29Pedestrians involved in fatal accidents: 8
Home Mortgage Disclosure Act Aggregated Statistics For Year 2009(Based on 10 full and 18 partial tracts) A) FHA, FSA/RHS & VA B) Conventional C) Refinancings D) Home Improvement Loans E) Loans on Dwellings For 5+ Families F) Non-occupant Loans on G) Loans On Manufactured Number Average Value Number Average Value Number Average Value Number Average Value Number Average Value Number Average Value Number Average Value
LOANS ORIGINATED 465 $99,595 94 $81,376 590 $88,890 138 $28,886 2 $1,615,370 54 $84,160 0 $0 APPLICATIONS APPROVED, NOT ACCEPTED 19 $99,645 10 $65,078 133 $83,819 26 $35,345 0 $0 4 $66,635 0 $0 APPLICATIONS DENIED 79 $91,671 54 $80,615 765 $89,723 480 $21,755 1 $6,220 94 $71,615 4 $22,000 APPLICATIONS WITHDRAWN 51 $108,882 31 $82,976 317 $94,926 18 $41,998 0 $0 19 $101,179 1 $124,000 FILES CLOSED FOR INCOMPLETENESS 10 $105,965 4 $54,918 94 $95,964 20 $27,648 0 $0 5 $74,738 0 $0
Aggregated Statistics For Year 2008(Based on 10 full and 18 partial tracts) A) FHA, FSA/RHS & VA B) Conventional C) Refinancings D) Home Improvement Loans E) Loans on Dwellings For 5+ Families F) Non-occupant Loans on G) Loans On Manufactured Number Average Value Number Average Value Number Average Value Number Average Value Number Average Value Number Average Value Number Average Value
LOANS ORIGINATED 372 $103,086 317 $84,634 920 $86,707 242 $31,757 2 $244,810 205 $88,810 3 $129,897 APPLICATIONS APPROVED, NOT ACCEPTED 26 $87,364 56 $86,308 220 $78,135 77 $32,351 0 $0 41 $73,498 0 $0 APPLICATIONS DENIED 96 $108,029 145 $88,231 1,306 $91,328 756 $29,623 6 $95,845 198 $80,007 5 $24,444 APPLICATIONS WITHDRAWN 55 $107,960 47 $102,899 348 $91,286 54 $49,514 0 $0 33 $72,942 6 $51,310 FILES CLOSED FOR INCOMPLETENESS 20 $95,458 24 $98,824 100 $113,813 21 $49,763 0 $0 12 $72,948 0 $0
Aggregated Statistics For Year 2007(Based on 10 full and 18 partial tracts) A) FHA, FSA/RHS & VA B) Conventional C) Refinancings D) Home Improvement Loans E) Loans on Dwellings For 5+ Families F) Non-occupant Loans on G) Loans On Manufactured Number Average Value Number Average Value Number Average Value Number Average Value Number Average Value Number Average Value Number Average Value
LOANS ORIGINATED 209 $103,983 1,019 $91,468 1,460 $84,109 484 $36,088 11 $383,731 438 $88,757 0 $0 APPLICATIONS APPROVED, NOT ACCEPTED 14 $99,581 170 $84,905 383 $80,834 130 $44,059 0 $0 94 $74,714 1 $8,870 APPLICATIONS DENIED 48 $111,518 512 $92,484 1,949 $89,792 1,024 $32,204 5 $980,560 379 $78,838 4 $44,358 APPLICATIONS WITHDRAWN 32 $98,860 147 $95,426 833 $93,868 101 $53,038 0 $0 102 $89,226 0 $0 FILES CLOSED FOR INCOMPLETENESS 2 $94,500 57 $100,330 174 $90,378 15 $59,803 0 $0 18 $71,438 0 $0
Aggregated Statistics For Year 2006(Based on 10 full and 18 partial tracts) A) FHA, FSA/RHS & VA B) Conventional C) Refinancings D) Home Improvement Loans E) Loans on Dwellings For 5+ Families F) Non-occupant Loans on G) Loans On Manufactured Number Average Value Number Average Value Number Average Value Number Average Value Number Average Value Number Average Value Number Average Value
LOANS ORIGINATED 234 $97,779 1,485 $81,696 1,869 $76,907 610 $37,390 3 $4,578,273 637 $72,602 5 $31,676 APPLICATIONS APPROVED, NOT ACCEPTED 9 $95,076 203 $80,150 514 $75,241 135 $42,172 0 $0 117 $77,547 0 $0 APPLICATIONS DENIED 24 $97,034 609 $81,256 2,179 $79,839 1,019 $32,606 2 $51,175 436 $66,175 9 $41,441 APPLICATIONS WITHDRAWN 20 $101,328 279 $90,908 1,028 $79,624 86 $43,444 2 $155,060 122 $78,211 2 $86,635 FILES CLOSED FOR INCOMPLETENESS 1 $124,000 91 $93,698 299 $86,476 22 $56,887 0 $0 38 $89,194 0 $0
Aggregated Statistics For Year 2005(Based on 10 full and 18 partial tracts) A) FHA, FSA/RHS & VA B) Conventional C) Refinancings D) Home Improvement Loans E) Loans on Dwellings For 5+ Families F) Non-occupant Loans on G) Loans On Manufactured Number Average Value Number Average Value Number Average Value Number Average Value Number Average Value Number Average Value Number Average Value
LOANS ORIGINATED 147 $80,969 1,564 $76,762 1,837 $72,016 491 $38,461 10 $570,272 736 $70,155 2 $57,565 APPLICATIONS APPROVED, NOT ACCEPTED 13 $74,822 162 $78,159 521 $67,343 106 $31,702 2 $75,975 112 $68,015 2 $6,000 APPLICATIONS DENIED 21 $83,914 560 $76,853 2,323 $70,170 1,135 $25,427 3 $167,703 481 $49,072 8 $32,281 APPLICATIONS WITHDRAWN 25 $85,894 324 $82,200 1,148 $79,322 170 $91,444 3 $48,323 144 $71,140 4 $68,462 FILES CLOSED FOR INCOMPLETENESS 1 $58,880 57 $83,887 214 $80,740 7 $47,373 0 $0 29 $96,657 0 $0
Aggregated Statistics For Year 2004(Based on 10 full and 18 partial tracts) A) FHA, FSA/RHS & VA B) Conventional C) Refinancings D) Home Improvement Loans E) Loans on Dwellings For 5+ Families F) Non-occupant Loans on G) Loans On Manufactured Number Average Value Number Average Value Number Average Value Number Average Value Number Average Value Number Average Value Number Average Value
LOANS ORIGINATED 239 $68,467 1,188 $64,023 1,628 $60,507 439 $31,553 9 $97,926 630 $56,917 3 $42,993 APPLICATIONS APPROVED, NOT ACCEPTED 16 $60,373 199 $68,048 582 $59,730 104 $32,180 0 $0 110 $57,681 0 $0 APPLICATIONS DENIED 40 $69,064 359 $73,809 2,500 $60,404 1,007 $25,032 2 $186,580 359 $43,863 4 $48,842 APPLICATIONS WITHDRAWN 32 $66,326 176 $64,154 987 $66,256 108 $43,262 1 $134,000 110 $58,726 3 $59,807 FILES CLOSED FOR INCOMPLETENESS 8 $72,792 47 $69,525 317 $67,746 26 $32,174 0 $0 25 $54,413 0 $0
Aggregated Statistics For Year 2003(Based on 10 full and 18 partial tracts) A) FHA, FSA/RHS & VA B) Conventional C) Refinancings D) Home Improvement Loans E) Loans on Dwellings For 5+ Families F) Non-occupant Loans on Number Average Value Number Average Value Number Average Value Number Average Value Number Average Value Number Average Value
LOANS ORIGINATED 404 $63,385 800 $58,797 1,710 $54,169 296 $21,676 3 $274,330 402 $47,225 APPLICATIONS APPROVED, NOT ACCEPTED 30 $58,941 104 $53,810 644 $51,700 92 $19,257 3 $105,130 84 $45,036 APPLICATIONS DENIED 59 $58,182 212 $53,770 2,144 $54,822 754 $16,994 3 $166,470 235 $39,403 APPLICATIONS WITHDRAWN 25 $75,517 104 $60,742 685 $59,544 40 $32,301 0 $0 68 $57,637 FILES CLOSED FOR INCOMPLETENESS 14 $52,505 29 $69,894 165 $53,613 15 $26,171 0 $0 16 $51,663
Aggregated Statistics For Year 2002(Based on 10 full and 18 partial tracts) A) FHA, FSA/RHS & VA B) Conventional C) Refinancings D) Home Improvement Loans E) Loans on Dwellings For 5+ Families F) Non-occupant Loans on Number Average Value Number Average Value Number Average Value Number Average Value Number Average Value Number Average Value
LOANS ORIGINATED 537 $197,591 597 $514,829 967 $101,922 183 $19,164 4 $407,630 286 $147,133 APPLICATIONS APPROVED, NOT ACCEPTED 21 $52,471 108 $51,747 515 $47,429 77 $24,432 1 $85,000 55 $42,141 APPLICATIONS DENIED 64 $62,844 157 $49,809 1,803 $50,035 468 $17,265 4 $615,540 143 $47,993 APPLICATIONS WITHDRAWN 41 $60,928 54 $56,812 481 $58,231 47 $28,424 0 $0 22 $45,504 FILES CLOSED FOR INCOMPLETENESS 15 $50,061 44 $52,381 192 $55,055 8 $32,484 0 $0 11 $46,579
Aggregated Statistics For Year 2001(Based on 10 full and 18 partial tracts) A) FHA, FSA/RHS & VA B) Conventional C) Refinancings D) Home Improvement Loans E) Loans on Dwellings For 5+ Families F) Non-occupant Loans on Number Average Value Number Average Value Number Average Value Number Average Value Number Average Value Number Average Value
LOANS ORIGINATED 716 $56,454 488 $47,435 720 $47,020 228 $21,349 4 $255,138 211 $41,408 APPLICATIONS APPROVED, NOT ACCEPTED 44 $58,942 97 $43,649 277 $48,564 75 $17,656 0 $0 23 $44,370 APPLICATIONS DENIED 57 $54,048 190 $44,867 1,630 $43,117 648 $14,972 1 $117,670 117 $36,300 APPLICATIONS WITHDRAWN 54 $53,431 71 $44,147 499 $46,246 82 $19,651 0 $0 35 $42,086 FILES CLOSED FOR INCOMPLETENESS 18 $48,786 13 $45,372 115 $54,233 6 $15,888 1 $30,000 7 $33,807
Aggregated Statistics For Year 2000(Based on 10 full and 18 partial tracts) A) FHA, FSA/RHS & VA B) Conventional C) Refinancings D) Home Improvement Loans E) Loans on Dwellings For 5+ Families F) Non-occupant Loans on Number Average Value Number Average Value Number Average Value Number Average Value Number Average Value Number Average Value
LOANS ORIGINATED 691 $54,978 544 $46,332 497 $39,273 320 $14,217 1 $115,000 127 $38,537 APPLICATIONS APPROVED, NOT ACCEPTED 18 $58,573 101 $42,915 216 $42,250 177 $17,418 0 $0 26 $30,598 APPLICATIONS DENIED 63 $51,996 294 $47,895 1,427 $35,713 814 $14,792 0 $0 65 $39,069 APPLICATIONS WITHDRAWN 49 $54,090 152 $52,738 589 $38,828 88 $24,291 2 $90,880 49 $46,605 FILES CLOSED FOR INCOMPLETENESS 9 $51,819 27 $49,244 123 $48,443 10 $40,646 0 $0 20 $51,050
Aggregated Statistics For Year 1999(Based on 7 full and 10 partial tracts) A) FHA, FSA/RHS & VA B) Conventional C) Refinancings D) Home Improvement Loans E) Loans on Dwellings For 5+ Families F) Non-occupant Loans on Number Average Value Number Average Value Number Average Value Number Average Value Number Average Value Number Average Value
LOANS ORIGINATED 450 $53,513 322 $43,632 434 $42,297 264 $14,044 3 $633,843 99 $40,633 APPLICATIONS APPROVED, NOT ACCEPTED 11 $47,656 79 $45,121 232 $42,542 149 $13,808 0 $0 28 $46,291 APPLICATIONS DENIED 44 $50,302 169 $50,743 823 $38,169 618 $13,889 0 $0 86 $35,275 APPLICATIONS WITHDRAWN 34 $55,998 78 $45,819 491 $42,368 85 $20,895 0 $0 30 $47,016 FILES CLOSED FOR INCOMPLETENESS 7 $56,217 25 $44,141 112 $43,107 3 $12,093 0 $0 3 $41,427
Private Mortgage Insurance Companies Aggregated Statistics For Year 2009(Based on 9 full and 14 partial tracts) A) Conventional B) Refinancings C) Non-occupant Loans on Number Average Value Number Average Value Number Average Value
LOANS ORIGINATED 17 $126,937 8 $99,430 0 $0 APPLICATIONS APPROVED, NOT ACCEPTED 10 $91,834 6 $116,422 3 $121,970 APPLICATIONS DENIED 1 $121,000 2 $78,350 0 $0 APPLICATIONS WITHDRAWN 0 $0 3 $77,140 0 $0 FILES CLOSED FOR INCOMPLETENESS 2 $135,960 0 $0 0 $0
Aggregated Statistics For Year 2008(Based on 10 full and 18 partial tracts) A) Conventional B) Refinancings C) Non-occupant Loans on Number Average Value Number Average Value Number Average Value
LOANS ORIGINATED 146 $97,661 60 $114,068 13 $96,661 APPLICATIONS APPROVED, NOT ACCEPTED 83 $111,084 42 $101,149 13 $108,012 APPLICATIONS DENIED 22 $85,289 3 $137,927 8 $96,782 APPLICATIONS WITHDRAWN 10 $94,494 11 $101,437 2 $63,765 FILES CLOSED FOR INCOMPLETENESS 15 $108,749 4 $119,480 9 $130,318
Aggregated Statistics For Year 2007(Based on 10 full and 18 partial tracts) A) Conventional B) Refinancings C) Non-occupant Loans on Number Average Value Number Average Value Number Average Value
LOANS ORIGINATED 556 $100,984 101 $107,750 73 $96,587 APPLICATIONS APPROVED, NOT ACCEPTED 104 $101,741 25 $95,400 16 $87,834 APPLICATIONS DENIED 25 $96,262 7 $98,629 12 $103,607 APPLICATIONS WITHDRAWN 46 $114,787 9 $88,408 5 $94,340 FILES CLOSED FOR INCOMPLETENESS 8 $104,414 0 $0 0 $0
Aggregated Statistics For Year 2006(Based on 10 full and 18 partial tracts) A) Conventional B) Refinancings C) Non-occupant Loans on Number Average Value Number Average Value Number Average Value
LOANS ORIGINATED 482 $95,128 86 $97,859 76 $83,201 APPLICATIONS APPROVED, NOT ACCEPTED 73 $88,373 25 $77,692 16 $75,771 APPLICATIONS DENIED 15 $78,563 2 $116,500 6 $65,217 APPLICATIONS WITHDRAWN 27 $85,290 4 $99,042 8 $67,706 FILES CLOSED FOR INCOMPLETENESS 2 $76,605 0 $0 1 $98,210
Aggregated Statistics For Year 2005(Based on 10 full and 18 partial tracts) A) Conventional B) Refinancings C) Non-occupant Loans on Number Average Value Number Average Value Number Average Value
LOANS ORIGINATED 497 $84,866 114 $82,618 91 $71,688 APPLICATIONS APPROVED, NOT ACCEPTED 68 $79,071 28 $74,261 8 $47,625 APPLICATIONS DENIED 19 $82,902 2 $42,095 5 $60,400 APPLICATIONS WITHDRAWN 23 $97,990 3 $71,090 3 $111,743 FILES CLOSED FOR INCOMPLETENESS 1 $107,050 2 $53,980 2 $53,980
Aggregated Statistics For Year 2004(Based on 10 full and 18 partial tracts) A) Conventional B) Refinancings C) Non-occupant Loans on Number Average Value Number Average Value Number Average Value
LOANS ORIGINATED 485 $71,746 95 $68,044 89 $64,702 APPLICATIONS APPROVED, NOT ACCEPTED 62 $73,536 27 $64,466 13 $65,796 APPLICATIONS DENIED 10 $57,059 3 $72,650 6 $47,890 APPLICATIONS WITHDRAWN 29 $66,508 13 $63,155 7 $73,821 FILES CLOSED FOR INCOMPLETENESS 2 $72,980 0 $0 0 $0
Aggregated Statistics For Year 2003(Based on 10 full and 18 partial tracts) A) Conventional B) Refinancings C) Non-occupant Loans on Number Average Value Number Average Value Number Average Value
LOANS ORIGINATED 354 $61,135 145 $62,910 60 $53,222 APPLICATIONS APPROVED, NOT ACCEPTED 40 $65,999 36 $64,010 13 $55,394 APPLICATIONS DENIED 9 $54,170 5 $77,168 8 $49,934 APPLICATIONS WITHDRAWN 22 $68,388 28 $64,554 6 $44,975 FILES CLOSED FOR INCOMPLETENESS 0 $0 2 $62,110 0 $0
Aggregated Statistics For Year 2002(Based on 10 full and 18 partial tracts) A) Conventional B) Refinancings C) Non-occupant Loans on Number Average Value Number Average Value Number Average Value
LOANS ORIGINATED 288 $57,234 93 $58,433 54 $49,079 APPLICATIONS APPROVED, NOT ACCEPTED 40 $56,416 36 $62,000 8 $63,215 APPLICATIONS DENIED 9 $49,056 8 $72,360 5 $60,888 APPLICATIONS WITHDRAWN 16 $49,768 2 $57,885 5 $42,024 FILES CLOSED FOR INCOMPLETENESS 1 $39,830 3 $57,297 1 $39,830
Aggregated Statistics For Year 2001(Based on 10 full and 18 partial tracts) A) Conventional B) Refinancings C) Non-occupant Loans on Number Average Value Number Average Value Number Average Value
LOANS ORIGINATED 233 $54,920 49 $56,353 45 $48,791 APPLICATIONS APPROVED, NOT ACCEPTED 33 $55,594 15 $69,917 8 $51,035 APPLICATIONS DENIED 11 $62,806 2 $39,965 4 $67,045 APPLICATIONS WITHDRAWN 2 $65,975 2 $57,985 0 $0 FILES CLOSED FOR INCOMPLETENESS 2 $67,090 2 $60,940 0 $0
Aggregated Statistics For Year 2000(Based on 10 full and 18 partial tracts) A) Conventional B) Refinancings C) Non-occupant Loans on Number Average Value Number Average Value Number Average Value
LOANS ORIGINATED 199 $50,002 32 $48,248 30 $41,109 APPLICATIONS APPROVED, NOT ACCEPTED 48 $54,141 4 $50,602 2 $31,320 APPLICATIONS DENIED 17 $47,655 5 $66,908 2 $31,320 APPLICATIONS WITHDRAWN 7 $50,630 1 $39,000 0 $0 FILES CLOSED FOR INCOMPLETENESS 1 $40,220 2 $73,970 0 $0
Aggregated Statistics For Year 1999(Based on 7 full and 9 partial tracts) A) Conventional B) Refinancings C) Non-occupant Loans on Number Average Value Number Average Value Number Average Value
LOANS ORIGINATED 103 $48,180 34 $53,050 9 $43,770 APPLICATIONS APPROVED, NOT ACCEPTED 18 $48,764 7 $45,106 2 $50,490 APPLICATIONS DENIED 15 $46,699 3 $58,543 3 $44,350 APPLICATIONS WITHDRAWN 1 $33,710 0 $0 0 $0 FILES CLOSED FOR INCOMPLETENESS 1 $65,140 1 $67,320 1 $65,140
2010 - 2018 National Fire Incident Reporting System (NFIRS) incidents See full 2006 National Fire Incident Reporting System statistics for zip code 19120, Pennsylvania
Most common first names in zip code 19120 among deceased individuals Name Count Lived (average)
John 884 72.8 years Mary 747 79.0 years William 681 72.9 years Joseph 621 72.0 years Anna 570 79.8 years Charles 415 74.3 years James 395 70.0 years George 369 73.4 years Margaret 340 77.3 years Helen 332 77.5 years
Most common last names in zip code 19120 among deceased individuals Last name Count Lived (average)
Smith 134 74.5 years Miller 133 71.8 years Brown 82 72.0 years Jones 71 72.4 years Johnson 70 68.4 years Kelly 68 70.8 years Williams 66 71.0 years Gallagher 61 73.7 years Murphy 55 73.4 years Wilson 51 70.8 years
Businesses in zip code 19120
Name Count Name Count
7-Eleven 3 Nike 4 AutoZone 1 Payless 1 Burger King 2 Popeyes 1 CVS 2 RadioShack 1 Cricket Wireless 6 Rite Aid 3 Dunkin Donuts 5 Subway 1 FedEx 1 True Value 1 GameStop 1 U-Haul 1 H&R Block 1 UPS 1 MasterBrand Cabinets 3 Wendy's 1


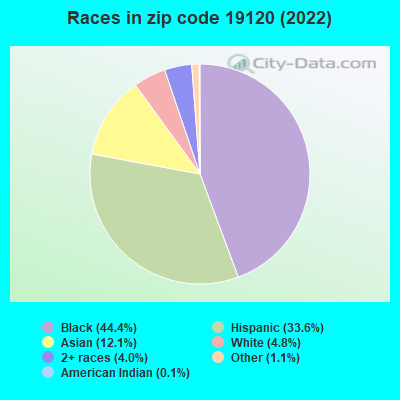


 Nearest zip codes: 19141, 19126, 19012, 19124, 19140, 19027.
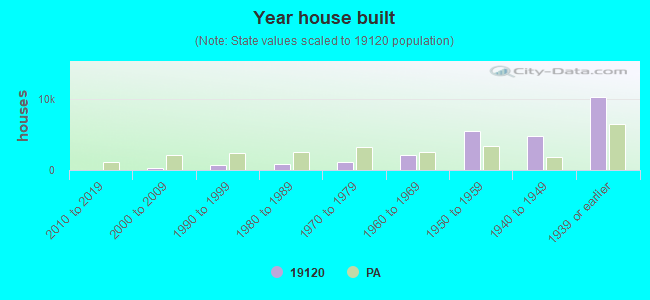

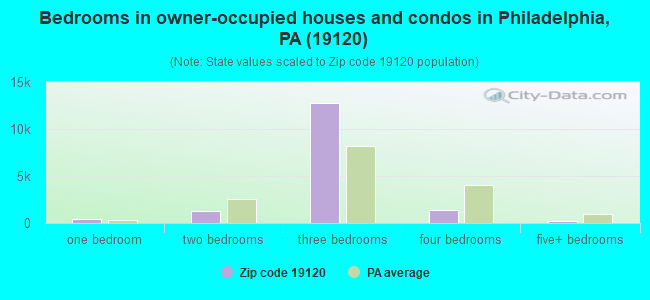


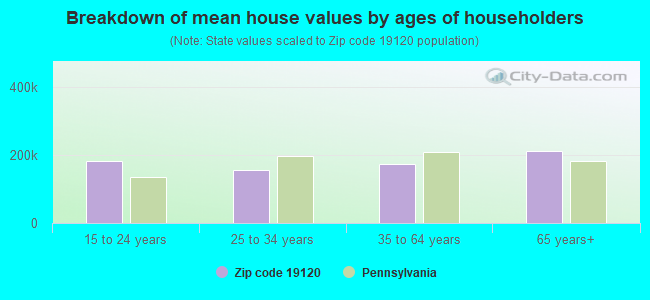


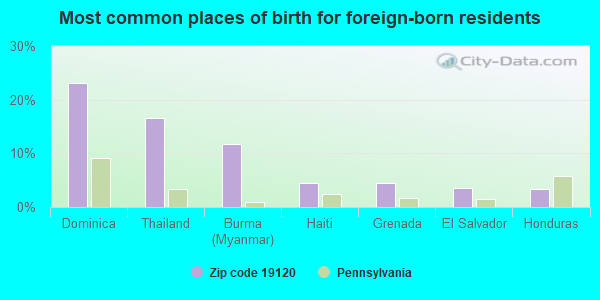
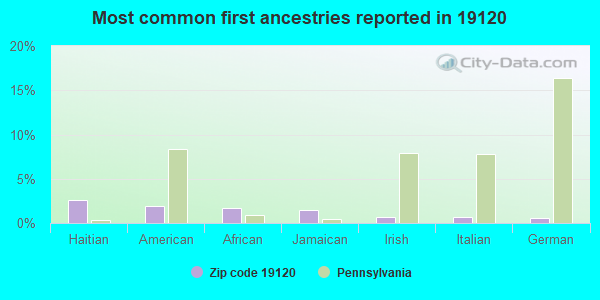
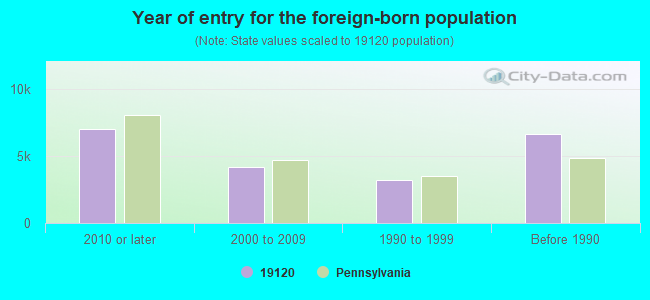


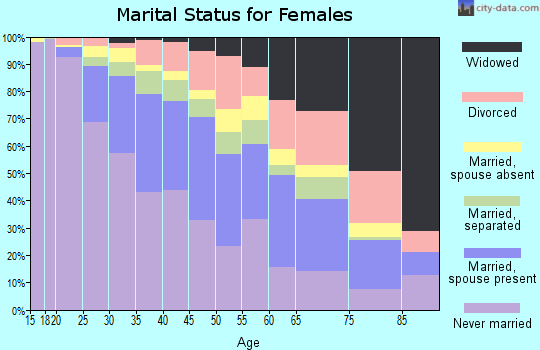
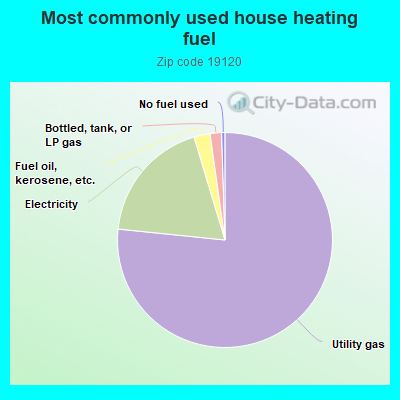
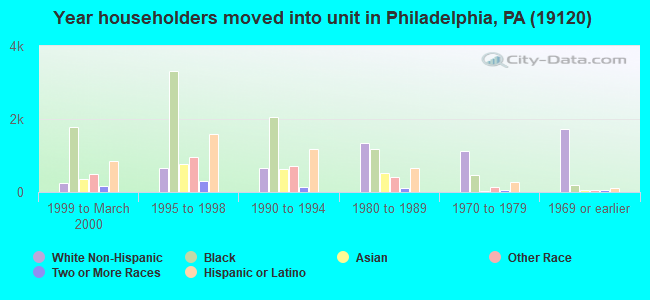
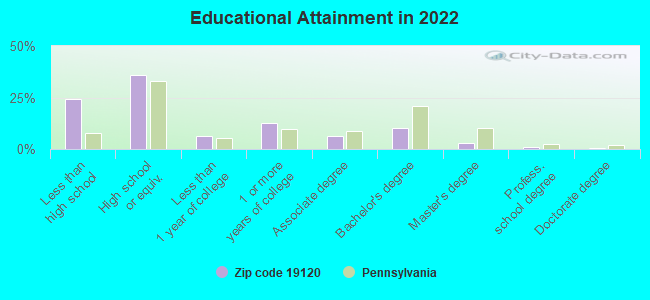
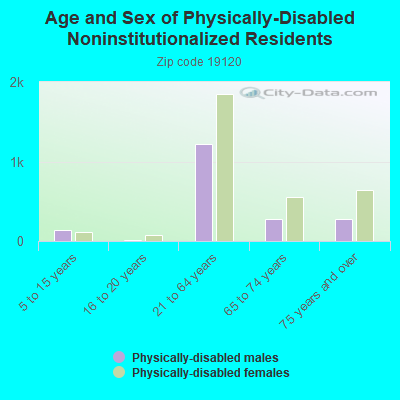
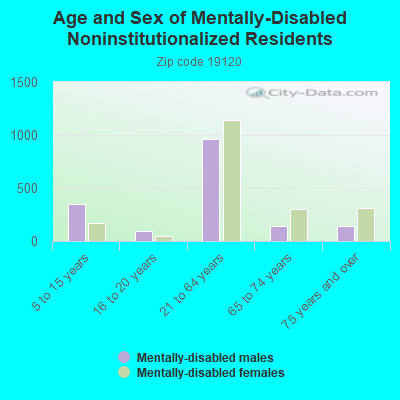
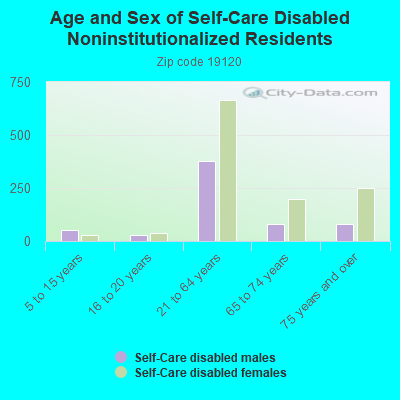
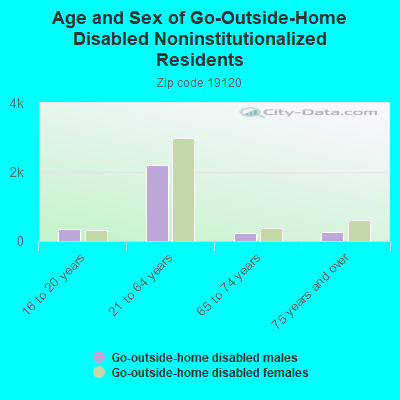
 According to the data from the years 2010 - 2018 the average number of fire incidents per year is 215. The highest number of reported fires - 308 took place in 2010, and the least - 0 in 2016. The data has a dropping trend.
 When looking into fire subcategories, the most reports belonged to: Structure Fires (48.7%), and Outside Fires (27.6%).