Estimated zip code population in 2022: 34,193
Zip code population in 2010: 31,376
Zip code population in 2000: 34,984
Houses and condos: 16,004
Renter-occupied apartments: 7,434
% of renters here:
49%State:
31%
March 2022 cost of living index in zip code 19141: 102.8
(near average, U.S. average is 100)
Land area: 1.8
sq. mi.
Water area: 0.0
sq. mi.
Population density: 18,854 people per square mile (very high).
OSM Map
General Map
Google Map
MSN Map
OSM Map
General Map
Google Map
MSN Map
OSM Map
General Map
Google Map
MSN Map
OSM Map
General Map
Google Map
MSN Map
Please wait while loading the map...
Real estate property taxes paid for housing units in 2022:
This zip code:
0.9% ($1,204)Pennsylvania:
1.3% ($3,094)
Median real estate property taxes paid for housing units with mortgages in 2022: $1,300 (0.8%)
Median real estate property taxes paid for housing units with no mortgage in 2022: $1,112 (0.9%)
Profiles of local businesses
Business Search - 14 Million verified businesses
Males: 14,472 Females: 19,723
For population 25 years and over in 19141:
High school or higher: 83.5%Bachelor's degree or higher: 14.5%Graduate or professional degree: 6.1%Unemployed: 11.3%Mean travel time to work (commute): 37.3 minutes
For population 15 years and over in 19141:
Never married: 49.8%Now married: 25.3%Separated: 5.6%Widowed: 8.0%Divorced: 11.3%
Zip code 19141 compared to state average:
Median household income below state average. Median house value below state average. Unemployed percentage above state average. Black race population percentage significantly above state average. Renting percentage above state average. Length of stay since moving in significantly above state average. House age above state average. Percentage of population with a bachelor's degree or higher significantly below state average. 29,148 85.3% Black 1,713 5.0% Hispanic or Latino 1,493 4.4% White 1,032 3.0% Asian 754 2.2% Two or more races 50 0.1% Some other race
Data:
Median household income ($)
Median household income (% change since 2000)
Household income diversity
Ratio of average income to average house value (%)
Ratio of average income to average rent
Median household income ($) - White
Median household income ($) - Black or African American
Median household income ($) - Asian
Median household income ($) - Hispanic or Latino
Median household income ($) - American Indian and Alaska Native
Median household income ($) - Multirace
Median household income ($) - Other Race
Median household income for houses/condos with a mortgage ($)
Median household income for apartments without a mortgage ($)
Races - White alone (%)
Races - White alone (% change since 2000)
Races - Black alone (%)
Races - Black alone (% change since 2000)
Races - American Indian alone (%)
Races - American Indian alone (% change since 2000)
Races - Asian alone (%)
Races - Asian alone (% change since 2000)
Races - Hispanic (%)
Races - Hispanic (% change since 2000)
Races - Native Hawaiian and Other Pacific Islander alone (%)
Races - Native Hawaiian and Other Pacific Islander alone (% change since 2000)
Races - Two or more races (%)
Races - Two or more races (% change since 2000)
Races - Other race alone (%)
Races - Other race alone (% change since 2000)
Racial diversity
Unemployment (%)
Unemployment (% change since 2000)
Unemployment (%) - White
Unemployment (%) - Black or African American
Unemployment (%) - Asian
Unemployment (%) - Hispanic or Latino
Unemployment (%) - American Indian and Alaska Native
Unemployment (%) - Multirace
Unemployment (%) - Other Race
Population density (people per square mile)
Population - Males (%)
Population - Females (%)
Population - Males (%) - White
Population - Males (%) - Black or African American
Population - Males (%) - Asian
Population - Males (%) - Hispanic or Latino
Population - Males (%) - American Indian and Alaska Native
Population - Males (%) - Multirace
Population - Males (%) - Other Race
Population - Females (%) - White
Population - Females (%) - Black or African American
Population - Females (%) - Asian
Population - Females (%) - Hispanic or Latino
Population - Females (%) - American Indian and Alaska Native
Population - Females (%) - Multirace
Population - Females (%) - Other Race
Coronavirus confirmed cases (Apr 27, 2024)
Deaths caused by coronavirus (Apr 27, 2024)
Coronavirus confirmed cases (per 100k population) (Apr 27, 2024)
Deaths caused by coronavirus (per 100k population) (Apr 27, 2024)
Daily increase in number of cases (Apr 27, 2024)
Weekly increase in number of cases (Apr 27, 2024)
Cases doubled (in days) (Apr 27, 2024)
Hospitalized patients (Apr 18, 2022)
Negative test results (Apr 18, 2022)
Total test results (Apr 18, 2022)
COVID Vaccine doses distributed (per 100k population) (Sep 19, 2023)
COVID Vaccine doses administered (per 100k population) (Sep 19, 2023)
COVID Vaccine doses distributed (Sep 19, 2023)
COVID Vaccine doses administered (Sep 19, 2023)
Likely homosexual households (%)
Likely homosexual households (% change since 2000)
Likely homosexual households - Lesbian couples (%)
Likely homosexual households - Lesbian couples (% change since 2000)
Likely homosexual households - Gay men (%)
Likely homosexual households - Gay men (% change since 2000)
Cost of living index
Median gross rent ($)
Median contract rent ($)
Median monthly housing costs ($)
Median house or condo value ($)
Median house or condo value ($ change since 2000)
Mean house or condo value by units in structure - 1, detached ($)
Mean house or condo value by units in structure - 1, attached ($)
Mean house or condo value by units in structure - 2 ($)
Mean house or condo value by units in structure by units in structure - 3 or 4 ($)
Mean house or condo value by units in structure - 5 or more ($)
Mean house or condo value by units in structure - Boat, RV, van, etc. ($)
Mean house or condo value by units in structure - Mobile home ($)
Median house or condo value ($) - White
Median house or condo value ($) - Black or African American
Median house or condo value ($) - Asian
Median house or condo value ($) - Hispanic or Latino
Median house or condo value ($) - American Indian and Alaska Native
Median house or condo value ($) - Multirace
Median house or condo value ($) - Other Race
Median resident age
Resident age diversity
Median resident age - Males
Median resident age - Females
Median resident age - White
Median resident age - Black or African American
Median resident age - Asian
Median resident age - Hispanic or Latino
Median resident age - American Indian and Alaska Native
Median resident age - Multirace
Median resident age - Other Race
Median resident age - Males - White
Median resident age - Males - Black or African American
Median resident age - Males - Asian
Median resident age - Males - Hispanic or Latino
Median resident age - Males - American Indian and Alaska Native
Median resident age - Males - Multirace
Median resident age - Males - Other Race
Median resident age - Females - White
Median resident age - Females - Black or African American
Median resident age - Females - Asian
Median resident age - Females - Hispanic or Latino
Median resident age - Females - American Indian and Alaska Native
Median resident age - Females - Multirace
Median resident age - Females - Other Race
Commute - mean travel time to work (minutes)
Travel time to work - Less than 5 minutes (%)
Travel time to work - Less than 5 minutes (% change since 2000)
Travel time to work - 5 to 9 minutes (%)
Travel time to work - 5 to 9 minutes (% change since 2000)
Travel time to work - 10 to 19 minutes (%)
Travel time to work - 10 to 19 minutes (% change since 2000)
Travel time to work - 20 to 29 minutes (%)
Travel time to work - 20 to 29 minutes (% change since 2000)
Travel time to work - 30 to 39 minutes (%)
Travel time to work - 30 to 39 minutes (% change since 2000)
Travel time to work - 40 to 59 minutes (%)
Travel time to work - 40 to 59 minutes (% change since 2000)
Travel time to work - 60 to 89 minutes (%)
Travel time to work - 60 to 89 minutes (% change since 2000)
Travel time to work - 90 or more minutes (%)
Travel time to work - 90 or more minutes (% change since 2000)
Marital status - Never married (%)
Marital status - Now married (%)
Marital status - Separated (%)
Marital status - Widowed (%)
Marital status - Divorced (%)
Median family income ($)
Median family income (% change since 2000)
Median non-family income ($)
Median non-family income (% change since 2000)
Median per capita income ($)
Median per capita income (% change since 2000)
Median family income ($) - White
Median family income ($) - Black or African American
Median family income ($) - Asian
Median family income ($) - Hispanic or Latino
Median family income ($) - American Indian and Alaska Native
Median family income ($) - Multirace
Median family income ($) - Other Race
Median year house/condo built
Median year apartment built
Year house built - Built 2005 or later (%)
Year house built - Built 2000 to 2004 (%)
Year house built - Built 1990 to 1999 (%)
Year house built - Built 1980 to 1989 (%)
Year house built - Built 1970 to 1979 (%)
Year house built - Built 1960 to 1969 (%)
Year house built - Built 1950 to 1959 (%)
Year house built - Built 1940 to 1949 (%)
Year house built - Built 1939 or earlier (%)
Average household size
Household density (households per square mile)
Average household size - White
Average household size - Black or African American
Average household size - Asian
Average household size - Hispanic or Latino
Average household size - American Indian and Alaska Native
Average household size - Multirace
Average household size - Other Race
Occupied housing units (%)
Vacant housing units (%)
Owner occupied housing units (%)
Renter occupied housing units (%)
Vacancy status - For rent (%)
Vacancy status - For sale only (%)
Vacancy status - Rented or sold, not occupied (%)
Vacancy status - For seasonal, recreational, or occasional use (%)
Vacancy status - For migrant workers (%)
Vacancy status - Other vacant (%)
Residents with income below the poverty level (%)
Residents with income below 50% of the poverty level (%)
Children below poverty level (%)
Poor families by family type - Married-couple family (%)
Poor families by family type - Male, no wife present (%)
Poor families by family type - Female, no husband present (%)
Poverty status for native-born residents (%)
Poverty status for foreign-born residents (%)
Poverty among high school graduates not in families (%)
Poverty among people who did not graduate high school not in families (%)
Residents with income below the poverty level (%) - White
Residents with income below the poverty level (%) - Black or African American
Residents with income below the poverty level (%) - Asian
Residents with income below the poverty level (%) - Hispanic or Latino
Residents with income below the poverty level (%) - American Indian and Alaska Native
Residents with income below the poverty level (%) - Multirace
Residents with income below the poverty level (%) - Other Race
Air pollution - Air Quality Index (AQI)
Air pollution - CO
Air pollution - NO2
Air pollution - SO2
Air pollution - Ozone
Air pollution - PM10
Air pollution - PM25
Air pollution - Pb
Crime - Murders per 100,000 population
Crime - Rapes per 100,000 population
Crime - Robberies per 100,000 population
Crime - Assaults per 100,000 population
Crime - Burglaries per 100,000 population
Crime - Thefts per 100,000 population
Crime - Auto thefts per 100,000 population
Crime - Arson per 100,000 population
Crime - City-data.com crime index
Crime - Violent crime index
Crime - Property crime index
Crime - Murders per 100,000 population (5 year average)
Crime - Rapes per 100,000 population (5 year average)
Crime - Robberies per 100,000 population (5 year average)
Crime - Assaults per 100,000 population (5 year average)
Crime - Burglaries per 100,000 population (5 year average)
Crime - Thefts per 100,000 population (5 year average)
Crime - Auto thefts per 100,000 population (5 year average)
Crime - Arson per 100,000 population (5 year average)
Crime - City-data.com crime index (5 year average)
Crime - Violent crime index (5 year average)
Crime - Property crime index (5 year average)
1996 Presidential Elections Results (%) - Democratic Party (Clinton)
1996 Presidential Elections Results (%) - Republican Party (Dole)
1996 Presidential Elections Results (%) - Other
2000 Presidential Elections Results (%) - Democratic Party (Gore)
2000 Presidential Elections Results (%) - Republican Party (Bush)
2000 Presidential Elections Results (%) - Other
2004 Presidential Elections Results (%) - Democratic Party (Kerry)
2004 Presidential Elections Results (%) - Republican Party (Bush)
2004 Presidential Elections Results (%) - Other
2008 Presidential Elections Results (%) - Democratic Party (Obama)
2008 Presidential Elections Results (%) - Republican Party (McCain)
2008 Presidential Elections Results (%) - Other
2012 Presidential Elections Results (%) - Democratic Party (Obama)
2012 Presidential Elections Results (%) - Republican Party (Romney)
2012 Presidential Elections Results (%) - Other
2016 Presidential Elections Results (%) - Democratic Party (Clinton)
2016 Presidential Elections Results (%) - Republican Party (Trump)
2016 Presidential Elections Results (%) - Other
2020 Presidential Elections Results (%) - Democratic Party (Biden)
2020 Presidential Elections Results (%) - Republican Party (Trump)
2020 Presidential Elections Results (%) - Other
Ancestries Reported - Arab (%)
Ancestries Reported - Czech (%)
Ancestries Reported - Danish (%)
Ancestries Reported - Dutch (%)
Ancestries Reported - English (%)
Ancestries Reported - French (%)
Ancestries Reported - French Canadian (%)
Ancestries Reported - German (%)
Ancestries Reported - Greek (%)
Ancestries Reported - Hungarian (%)
Ancestries Reported - Irish (%)
Ancestries Reported - Italian (%)
Ancestries Reported - Lithuanian (%)
Ancestries Reported - Norwegian (%)
Ancestries Reported - Polish (%)
Ancestries Reported - Portuguese (%)
Ancestries Reported - Russian (%)
Ancestries Reported - Scotch-Irish (%)
Ancestries Reported - Scottish (%)
Ancestries Reported - Slovak (%)
Ancestries Reported - Subsaharan African (%)
Ancestries Reported - Swedish (%)
Ancestries Reported - Swiss (%)
Ancestries Reported - Ukrainian (%)
Ancestries Reported - United States (%)
Ancestries Reported - Welsh (%)
Ancestries Reported - West Indian (%)
Ancestries Reported - Other (%)
Educational Attainment - No schooling completed (%)
Educational Attainment - Less than high school (%)
Educational Attainment - High school or equivalent (%)
Educational Attainment - Less than 1 year of college (%)
Educational Attainment - 1 or more years of college (%)
Educational Attainment - Associate degree (%)
Educational Attainment - Bachelor's degree (%)
Educational Attainment - Master's degree (%)
Educational Attainment - Professional school degree (%)
Educational Attainment - Doctorate degree (%)
School Enrollment - Nursery, preschool (%)
School Enrollment - Kindergarten (%)
School Enrollment - Grade 1 to 4 (%)
School Enrollment - Grade 5 to 8 (%)
School Enrollment - Grade 9 to 12 (%)
School Enrollment - College undergrad (%)
School Enrollment - Graduate or professional (%)
School Enrollment - Not enrolled in school (%)
School enrollment - Public schools (%)
School enrollment - Private schools (%)
School enrollment - Not enrolled (%)
Median number of rooms in houses and condos
Median number of rooms in apartments
Housing units lacking complete plumbing facilities (%)
Housing units lacking complete kitchen facilities (%)
Density of houses
Urban houses (%)
Rural houses (%)
Households with people 60 years and over (%)
Households with people 65 years and over (%)
Households with people 75 years and over (%)
Households with one or more nonrelatives (%)
Households with no nonrelatives (%)
Population in households (%)
Family households (%)
Nonfamily households (%)
Population in families (%)
Family households with own children (%)
Median number of bedrooms in owner occupied houses
Mean number of bedrooms in owner occupied houses
Median number of bedrooms in renter occupied houses
Mean number of bedrooms in renter occupied houses
Median number of vehichles in owner occupied houses
Mean number of vehichles in owner occupied houses
Median number of vehichles in renter occupied houses
Mean number of vehichles in renter occupied houses
Mortgage status - with mortgage (%)
Mortgage status - with second mortgage (%)
Mortgage status - with home equity loan (%)
Mortgage status - with both second mortgage and home equity loan (%)
Mortgage status - without a mortgage (%)
Average family size
Average family size - White
Average family size - Black or African American
Average family size - Asian
Average family size - Hispanic or Latino
Average family size - American Indian and Alaska Native
Average family size - Multirace
Average family size - Other Race
Geographical mobility - Same house 1 year ago (%)
Geographical mobility - Moved within same county (%)
Geographical mobility - Moved from different county within same state (%)
Geographical mobility - Moved from different state (%)
Geographical mobility - Moved from abroad (%)
Place of birth - Born in state of residence (%)
Place of birth - Born in other state (%)
Place of birth - Native, outside of US (%)
Place of birth - Foreign born (%)
Housing units in structures - 1, detached (%)
Housing units in structures - 1, attached (%)
Housing units in structures - 2 (%)
Housing units in structures - 3 or 4 (%)
Housing units in structures - 5 to 9 (%)
Housing units in structures - 10 to 19 (%)
Housing units in structures - 20 to 49 (%)
Housing units in structures - 50 or more (%)
Housing units in structures - Mobile home (%)
Housing units in structures - Boat, RV, van, etc. (%)
House/condo owner moved in on average (years ago)
Renter moved in on average (years ago)
Year householder moved into unit - Moved in 1999 to March 2000 (%)
Year householder moved into unit - Moved in 1995 to 1998 (%)
Year householder moved into unit - Moved in 1990 to 1994 (%)
Year householder moved into unit - Moved in 1980 to 1989 (%)
Year householder moved into unit - Moved in 1970 to 1979 (%)
Year householder moved into unit - Moved in 1969 or earlier (%)
Means of transportation to work - Drove car alone (%)
Means of transportation to work - Carpooled (%)
Means of transportation to work - Public transportation (%)
Means of transportation to work - Bus or trolley bus (%)
Means of transportation to work - Streetcar or trolley car (%)
Means of transportation to work - Subway or elevated (%)
Means of transportation to work - Railroad (%)
Means of transportation to work - Ferryboat (%)
Means of transportation to work - Taxicab (%)
Means of transportation to work - Motorcycle (%)
Means of transportation to work - Bicycle (%)
Means of transportation to work - Walked (%)
Means of transportation to work - Other means (%)
Working at home (%)
Industry diversity
Most Common Industries - Agriculture, forestry, fishing and hunting, and mining (%)
Most Common Industries - Agriculture, forestry, fishing and hunting (%)
Most Common Industries - Mining, quarrying, and oil and gas extraction (%)
Most Common Industries - Construction (%)
Most Common Industries - Manufacturing (%)
Most Common Industries - Wholesale trade (%)
Most Common Industries - Retail trade (%)
Most Common Industries - Transportation and warehousing, and utilities (%)
Most Common Industries - Transportation and warehousing (%)
Most Common Industries - Utilities (%)
Most Common Industries - Information (%)
Most Common Industries - Finance and insurance, and real estate and rental and leasing (%)
Most Common Industries - Finance and insurance (%)
Most Common Industries - Real estate and rental and leasing (%)
Most Common Industries - Professional, scientific, and management, and administrative and waste management services (%)
Most Common Industries - Professional, scientific, and technical services (%)
Most Common Industries - Management of companies and enterprises (%)
Most Common Industries - Administrative and support and waste management services (%)
Most Common Industries - Educational services, and health care and social assistance (%)
Most Common Industries - Educational services (%)
Most Common Industries - Health care and social assistance (%)
Most Common Industries - Arts, entertainment, and recreation, and accommodation and food services (%)
Most Common Industries - Arts, entertainment, and recreation (%)
Most Common Industries - Accommodation and food services (%)
Most Common Industries - Other services, except public administration (%)
Most Common Industries - Public administration (%)
Occupation diversity
Most Common Occupations - Management, business, science, and arts occupations (%)
Most Common Occupations - Management, business, and financial occupations (%)
Most Common Occupations - Management occupations (%)
Most Common Occupations - Business and financial operations occupations (%)
Most Common Occupations - Computer, engineering, and science occupations (%)
Most Common Occupations - Computer and mathematical occupations (%)
Most Common Occupations - Architecture and engineering occupations (%)
Most Common Occupations - Life, physical, and social science occupations (%)
Most Common Occupations - Education, legal, community service, arts, and media occupations (%)
Most Common Occupations - Community and social service occupations (%)
Most Common Occupations - Legal occupations (%)
Most Common Occupations - Education, training, and library occupations (%)
Most Common Occupations - Arts, design, entertainment, sports, and media occupations (%)
Most Common Occupations - Healthcare practitioners and technical occupations (%)
Most Common Occupations - Health diagnosing and treating practitioners and other technical occupations (%)
Most Common Occupations - Health technologists and technicians (%)
Most Common Occupations - Service occupations (%)
Most Common Occupations - Healthcare support occupations (%)
Most Common Occupations - Protective service occupations (%)
Most Common Occupations - Fire fighting and prevention, and other protective service workers including supervisors (%)
Most Common Occupations - Law enforcement workers including supervisors (%)
Most Common Occupations - Food preparation and serving related occupations (%)
Most Common Occupations - Building and grounds cleaning and maintenance occupations (%)
Most Common Occupations - Personal care and service occupations (%)
Most Common Occupations - Sales and office occupations (%)
Most Common Occupations - Sales and related occupations (%)
Most Common Occupations - Office and administrative support occupations (%)
Most Common Occupations - Natural resources, construction, and maintenance occupations (%)
Most Common Occupations - Farming, fishing, and forestry occupations (%)
Most Common Occupations - Construction and extraction occupations (%)
Most Common Occupations - Installation, maintenance, and repair occupations (%)
Most Common Occupations - Production, transportation, and material moving occupations (%)
Most Common Occupations - Production occupations (%)
Most Common Occupations - Transportation occupations (%)
Most Common Occupations - Material moving occupations (%)
People in Group quarters - Institutionalized population (%)
People in Group quarters - Correctional institutions (%)
People in Group quarters - Federal prisons and detention centers (%)
People in Group quarters - Halfway houses (%)
People in Group quarters - Local jails and other confinement facilities (including police lockups) (%)
People in Group quarters - Military disciplinary barracks (%)
People in Group quarters - State prisons (%)
People in Group quarters - Other types of correctional institutions (%)
People in Group quarters - Nursing homes (%)
People in Group quarters - Hospitals/wards, hospices, and schools for the handicapped (%)
People in Group quarters - Hospitals/wards and hospices for chronically ill (%)
People in Group quarters - Hospices or homes for chronically ill (%)
People in Group quarters - Military hospitals or wards for chronically ill (%)
People in Group quarters - Other hospitals or wards for chronically ill (%)
People in Group quarters - Hospitals or wards for drug/alcohol abuse (%)
People in Group quarters - Mental (Psychiatric) hospitals or wards (%)
People in Group quarters - Schools, hospitals, or wards for the mentally retarded (%)
People in Group quarters - Schools, hospitals, or wards for the physically handicapped (%)
People in Group quarters - Institutions for the deaf (%)
People in Group quarters - Institutions for the blind (%)
People in Group quarters - Orthopedic wards and institutions for the physically handicapped (%)
People in Group quarters - Wards in general hospitals for patients who have no usual home elsewhere (%)
People in Group quarters - Wards in military hospitals for patients who have no usual home elsewhere (%)
People in Group quarters - Juvenile institutions (%)
People in Group quarters - Long-term care (%)
People in Group quarters - Homes for abused, dependent, and neglected children (%)
People in Group quarters - Residential treatment centers for emotionally disturbed children (%)
People in Group quarters - Training schools for juvenile delinquents (%)
People in Group quarters - Short-term care, detention or diagnostic centers for delinquent children (%)
People in Group quarters - Type of juvenile institution unknown (%)
People in Group quarters - Noninstitutionalized population (%)
People in Group quarters - College dormitories (includes college quarters off campus) (%)
People in Group quarters - Military quarters (%)
People in Group quarters - On base (%)
People in Group quarters - Barracks, unaccompanied personnel housing (UPH), (Enlisted/Officer), ;and similar group living quarters for military personnel (%)
People in Group quarters - Transient quarters for temporary residents (%)
People in Group quarters - Military ships (%)
People in Group quarters - Group homes (%)
People in Group quarters - Homes or halfway houses for drug/alcohol abuse (%)
People in Group quarters - Homes for the mentally ill (%)
People in Group quarters - Homes for the mentally retarded (%)
People in Group quarters - Homes for the physically handicapped (%)
People in Group quarters - Other group homes (%)
People in Group quarters - Religious group quarters (%)
People in Group quarters - Dormitories (%)
People in Group quarters - Agriculture workers' dormitories on farms (%)
People in Group quarters - Job Corps and vocational training facilities (%)
People in Group quarters - Other workers' dormitories (%)
People in Group quarters - Crews of maritime vessels (%)
People in Group quarters - Other nonhousehold living situations (%)
People in Group quarters - Other noninstitutional group quarters (%)
Residents speaking English at home (%)
Residents speaking English at home - Born in the United States (%)
Residents speaking English at home - Native, born elsewhere (%)
Residents speaking English at home - Foreign born (%)
Residents speaking Spanish at home (%)
Residents speaking Spanish at home - Born in the United States (%)
Residents speaking Spanish at home - Native, born elsewhere (%)
Residents speaking Spanish at home - Foreign born (%)
Residents speaking other language at home (%)
Residents speaking other language at home - Born in the United States (%)
Residents speaking other language at home - Native, born elsewhere (%)
Residents speaking other language at home - Foreign born (%)
Class of Workers - Employee of private company (%)
Class of Workers - Self-employed in own incorporated business (%)
Class of Workers - Private not-for-profit wage and salary workers (%)
Class of Workers - Local government workers (%)
Class of Workers - State government workers (%)
Class of Workers - Federal government workers (%)
Class of Workers - Self-employed workers in own not incorporated business and Unpaid family workers (%)
House heating fuel used in houses and condos - Utility gas (%)
House heating fuel used in houses and condos - Bottled, tank, or LP gas (%)
House heating fuel used in houses and condos - Electricity (%)
House heating fuel used in houses and condos - Fuel oil, kerosene, etc. (%)
House heating fuel used in houses and condos - Coal or coke (%)
House heating fuel used in houses and condos - Wood (%)
House heating fuel used in houses and condos - Solar energy (%)
House heating fuel used in houses and condos - Other fuel (%)
House heating fuel used in houses and condos - No fuel used (%)
House heating fuel used in apartments - Utility gas (%)
House heating fuel used in apartments - Bottled, tank, or LP gas (%)
House heating fuel used in apartments - Electricity (%)
House heating fuel used in apartments - Fuel oil, kerosene, etc. (%)
House heating fuel used in apartments - Coal or coke (%)
House heating fuel used in apartments - Wood (%)
House heating fuel used in apartments - Solar energy (%)
House heating fuel used in apartments - Other fuel (%)
House heating fuel used in apartments - No fuel used (%)
Armed forces status - In Armed Forces (%)
Armed forces status - Civilian (%)
Armed forces status - Civilian - Veteran (%)
Armed forces status - Civilian - Nonveteran (%)
Fatal accidents locations in years 2005-2021
Fatal accidents locations in 2005
Fatal accidents locations in 2006
Fatal accidents locations in 2007
Fatal accidents locations in 2008
Fatal accidents locations in 2009
Fatal accidents locations in 2010
Fatal accidents locations in 2011
Fatal accidents locations in 2012
Fatal accidents locations in 2013
Fatal accidents locations in 2014
Fatal accidents locations in 2015
Fatal accidents locations in 2016
Fatal accidents locations in 2017
Fatal accidents locations in 2018
Fatal accidents locations in 2019
Fatal accidents locations in 2020
Fatal accidents locations in 2021
Alcohol use - People drinking some alcohol every month (%)
Alcohol use - People not drinking at all (%)
Alcohol use - Average days/month drinking alcohol
Alcohol use - Average drinks/week
Alcohol use - Average days/year people drink much
Audiometry - Average condition of hearing (%)
Audiometry - People that can hear a whisper from across a quiet room (%)
Audiometry - People that can hear normal voice from across a quiet room (%)
Audiometry - Ears ringing, roaring, buzzing (%)
Audiometry - Had a job exposure to loud noise (%)
Audiometry - Had off-work exposure to loud noise (%)
Blood Pressure & Cholesterol - Has high blood pressure (%)
Blood Pressure & Cholesterol - Checking blood pressure at home (%)
Blood Pressure & Cholesterol - Frequently checking blood cholesterol (%)
Blood Pressure & Cholesterol - Has high cholesterol level (%)
Consumer Behavior - Money monthly spent on food at supermarket/grocery store
Consumer Behavior - Money monthly spent on food at other stores
Consumer Behavior - Money monthly spent on eating out
Consumer Behavior - Money monthly spent on carryout/delivered foods
Consumer Behavior - Income spent on food at supermarket/grocery store (%)
Consumer Behavior - Income spent on food at other stores (%)
Consumer Behavior - Income spent on eating out (%)
Consumer Behavior - Income spent on carryout/delivered foods (%)
Current Health Status - General health condition (%)
Current Health Status - Blood donors (%)
Current Health Status - Has blood ever tested for HIV virus (%)
Current Health Status - Left-handed people (%)
Dermatology - People using sunscreen (%)
Diabetes - Diabetics (%)
Diabetes - Had a blood test for high blood sugar (%)
Diabetes - People taking insulin (%)
Diet Behavior & Nutrition - Diet health (%)
Diet Behavior & Nutrition - Milk product consumption (# of products/month)
Diet Behavior & Nutrition - Meals not home prepared (#/week)
Diet Behavior & Nutrition - Meals from fast food or pizza place (#/week)
Diet Behavior & Nutrition - Ready-to-eat foods (#/month)
Diet Behavior & Nutrition - Frozen meals/pizza (#/month)
Drug Use - People that ever used marijuana or hashish (%)
Drug Use - Ever used hard drugs (%)
Drug Use - Ever used any form of cocaine (%)
Drug Use - Ever used heroin (%)
Drug Use - Ever used methamphetamine (%)
Health Insurance - People covered by health insurance (%)
Kidney Conditions-Urology - Avg. # of times urinating at night
Medical Conditions - People with asthma (%)
Medical Conditions - People with anemia (%)
Medical Conditions - People with psoriasis (%)
Medical Conditions - People with overweight (%)
Medical Conditions - Elderly people having difficulties in thinking or remembering (%)
Medical Conditions - People who ever received blood transfusion (%)
Medical Conditions - People having trouble seeing even with glass/contacts (%)
Medical Conditions - People with arthritis (%)
Medical Conditions - People with gout (%)
Medical Conditions - People with congestive heart failure (%)
Medical Conditions - People with coronary heart disease (%)
Medical Conditions - People with angina pectoris (%)
Medical Conditions - People who ever had heart attack (%)
Medical Conditions - People who ever had stroke (%)
Medical Conditions - People with emphysema (%)
Medical Conditions - People with thyroid problem (%)
Medical Conditions - People with chronic bronchitis (%)
Medical Conditions - People with any liver condition (%)
Medical Conditions - People who ever had cancer or malignancy (%)
Mental Health - People who have little interest in doing things (%)
Mental Health - People feeling down, depressed, or hopeless (%)
Mental Health - People who have trouble sleeping or sleeping too much (%)
Mental Health - People feeling tired or having little energy (%)
Mental Health - People with poor appetite or overeating (%)
Mental Health - People feeling bad about themself (%)
Mental Health - People who have trouble concentrating on things (%)
Mental Health - People moving or speaking slowly or too fast (%)
Mental Health - People having thoughts they would be better off dead (%)
Oral Health - Average years since last visit a dentist
Oral Health - People embarrassed because of mouth (%)
Oral Health - People with gum disease (%)
Oral Health - General health of teeth and gums (%)
Oral Health - Average days a week using dental floss/device
Oral Health - Average days a week using mouthwash for dental problem
Oral Health - Average number of teeth
Pesticide Use - Households using pesticides to control insects (%)
Pesticide Use - Households using pesticides to kill weeds (%)
Physical Activity - People doing vigorous-intensity work activities (%)
Physical Activity - People doing moderate-intensity work activities (%)
Physical Activity - People walking or bicycling (%)
Physical Activity - People doing vigorous-intensity recreational activities (%)
Physical Activity - People doing moderate-intensity recreational activities (%)
Physical Activity - Average hours a day doing sedentary activities
Physical Activity - Average hours a day watching TV or videos
Physical Activity - Average hours a day using computer
Physical Functioning - People having limitations keeping them from working (%)
Physical Functioning - People limited in amount of work they can do (%)
Physical Functioning - People that need special equipment to walk (%)
Physical Functioning - People experiencing confusion/memory problems (%)
Physical Functioning - People requiring special healthcare equipment (%)
Prescription Medications - Average number of prescription medicines taking
Preventive Aspirin Use - Adults 40+ taking low-dose aspirin (%)
Reproductive Health - Vaginal deliveries (%)
Reproductive Health - Cesarean deliveries (%)
Reproductive Health - Deliveries resulted in a live birth (%)
Reproductive Health - Pregnancies resulted in a delivery (%)
Reproductive Health - Women breastfeeding newborns (%)
Reproductive Health - Women that had a hysterectomy (%)
Reproductive Health - Women that had both ovaries removed (%)
Reproductive Health - Women that have ever taken birth control pills (%)
Reproductive Health - Women taking birth control pills (%)
Reproductive Health - Women that have ever used Depo-Provera or injectables (%)
Reproductive Health - Women that have ever used female hormones (%)
Sexual Behavior - People 18+ that ever had sex (vaginal, anal, or oral) (%)
Sexual Behavior - Males 18+ that ever had vaginal sex with a woman (%)
Sexual Behavior - Males 18+ that ever performed oral sex on a woman (%)
Sexual Behavior - Males 18+ that ever had anal sex with a woman (%)
Sexual Behavior - Males 18+ that ever had any sex with a man (%)
Sexual Behavior - Females 18+ that ever had vaginal sex with a man (%)
Sexual Behavior - Females 18+ that ever performed oral sex on a man (%)
Sexual Behavior - Females 18+ that ever had anal sex with a man (%)
Sexual Behavior - Females 18+ that ever had any kind of sex with a woman (%)
Sexual Behavior - Average age people first had sex
Sexual Behavior - Average number of female sex partners in lifetime (males 18+)
Sexual Behavior - Average number of female vaginal sex partners in lifetime (males 18+)
Sexual Behavior - Average age people first performed oral sex on a woman (18+)
Sexual Behavior - Average number of woman performed oral sex on in lifetime (18+)
Sexual Behavior - Average number of male sex partners in lifetime (males 18+)
Sexual Behavior - Average number of male anal sex partners in lifetime (males 18+)
Sexual Behavior - Average age people first performed oral sex on a man (18+)
Sexual Behavior - Average number of male oral sex partners in lifetime (18+)
Sexual Behavior - People using protection when performing oral sex (%)
Sexual Behavior - Average number of times people have vaginal or anal sex a year
Sexual Behavior - People having sex without condom (%)
Sexual Behavior - Average number of male sex partners in lifetime (females 18+)
Sexual Behavior - Average number of male vaginal sex partners in lifetime (females 18+)
Sexual Behavior - Average number of female sex partners in lifetime (females 18+)
Sexual Behavior - Circumcised males 18+ (%)
Sleep Disorders - Average hours sleeping at night
Sleep Disorders - People that has trouble sleeping (%)
Smoking-Cigarette Use - People smoking cigarettes (%)
Taste & Smell - People 40+ having problems with smell (%)
Taste & Smell - People 40+ having problems with taste (%)
Taste & Smell - People 40+ that ever had wisdom teeth removed (%)
Taste & Smell - People 40+ that ever had tonsils teeth removed (%)
Taste & Smell - People 40+ that ever had a loss of consciousness because of a head injury (%)
Taste & Smell - People 40+ that ever had a broken nose or other serious injury to face or skull (%)
Taste & Smell - People 40+ that ever had two or more sinus infections (%)
Weight - Average height (inches)
Weight - Average weight (pounds)
Weight - Average BMI
Weight - People that are obese (%)
Weight - People that ever were obese (%)
Weight - People trying to lose weight (%)
100%
urban population.
Estimated median house/condo value in 2022: $139,030
19141:
$139,030Pennsylvania:
$245,500
Median resident age: This zip code:
38.4 yearsPennsylvania median age:
40.9 years
Average household size: This zip code:
2.2 peoplePennsylvania:
2.4 people
Averages for the 2020 tax year for zip code 19141, filed in 2021:
Average Adjusted Gross Income (AGI) in 2020: $36,294 (Individual Income Tax Returns) Here:
$36,294State:
$75,707
Salary/wage: $33,440 (reported on 83.3% of returns )Here:
$33,440State:
$62,806
(% of AGI for various income ranges: 997.6% for AGIs below $25k , 3310.6% for AGIs $25k-50k , 6593.7% for AGIs $50k-75k , 9367.3% for AGIs $75k-100k , 16310.4% for AGIs $100k-200k ) Taxable interest for individuals: $245 (reported on 9.9% of returns )This zip code:
$245Pennsylvania:
$1,633
(% of AGI for various income ranges: 1.6% for AGIs below $25k , 1.7% for AGIs $25k-50k , 4.6% for AGIs $50k-75k , 12.9% for AGIs $75k-100k , 21.2% for AGIs $100k-200k ) Ordinary dividends: $865 (reported on 2.9% of returns )(% of AGI for various income ranges: 1.8% for AGIs below $25k , 1.6% for AGIs $25k-50k , 6.2% for AGIs $50k-75k , 4.3% for AGIs $75k-100k , 32.1% for AGIs $100k-200k ) Net capital gain/loss in AGI: +$2,551 (reported on 2.5% of returns )Here:
+$2,551State:
+$23,522
(% of AGI for various income ranges: 1.5% for AGIs below $25k , 3.1% for AGIs $25k-50k , 13.0% for AGIs $50k-75k , 13.3% for AGIs $75k-100k , 176.7% for AGIs $100k-200k ) Profit/loss from business: +$2,531 (reported on 11.1% of returns )Here:
+$2,531State:
+$16,274
(% of AGI for various income ranges: 27.8% for AGIs below $25k , 21.4% for AGIs $25k-50k , 25.3% for AGIs $50k-75k , 61.0% for AGIs $75k-100k , 398.8% for AGIs $100k-200k ) Taxable individual retirement arrangement distribution: $9,537 (reported on 2.5% of returns )19141:
$9,537Pennsylvania:
$18,583
(% of AGI for various income ranges: 12.7% for AGIs below $25k , 14.3% for AGIs $25k-50k , 41.0% for AGIs $50k-75k , 92.7% for AGIs $75k-100k , 428.3% for AGIs $100k-200k ) Total itemized deductions: $24,919 (reported on 5.1% of returns )Here:
$24,919State:
$34,850
(% of AGI for various income ranges: 11.3% for AGIs below $25k , 101.9% for AGIs $25k-50k , 381.4% for AGIs $50k-75k , 642.0% for AGIs $75k-100k , 1419.6% for AGIs $100k-200k ) Charity contributions: $9,210 (reported on 4.4% of returns )(% of AGI for various income ranges: 1.5% for AGIs below $25k , 33.3% for AGIs $25k-50k , 122.7% for AGIs $50k-75k , 229.2% for AGIs $75k-100k , 443.3% for AGIs $100k-200k ) Taxes paid: $6,650 (reported on 5.1% of returns )(% of AGI for various income ranges: 1.4% for AGIs below $25k , 22.7% for AGIs $25k-50k , 99.2% for AGIs $50k-75k , 204.1% for AGIs $75k-100k , 438.3% for AGIs $100k-200k ) Earned income credit: $2,189 (reported on 28.8% of returns )(% of AGI for various income ranges: 107.4% for AGIs below $25k , 85.4% for AGIs $25k-50k ) Percentage of individuals using paid preparers for their 2020 taxes: 91.3%(% for various income ranges: 92.1% for AGIs below $25k , 92.4% for AGIs $25k-50k , 88.7% for AGIs $50k-75k , 87.1% for AGIs $75k-100k , 85.7% for AGIs $100k-200k , 100.0% for AGIs over 200k )
Averages for the 2012 tax year for zip code 19141, filed in 2013:
Average Adjusted Gross Income (AGI) in 2012: $29,840 (Individual Income Tax Returns) Here:
$29,840State:
$61,346
Salary/wage: $28,465 (reported on 84.8% of returns )Here:
$28,465State:
$51,902
(% of AGI for various income ranges: 73.6% for AGIs below $25k , 86.1% for AGIs $25k-50k , 82.9% for AGIs $50k-75k , 78.8% for AGIs $75k-100k , 73.6% for AGIs $100k-200k ) Taxable interest for individuals: $361 (reported on 10.9% of returns )This zip code:
$361Pennsylvania:
$1,588
(% of AGI for various income ranges: 0.2% for AGIs below $25k , 0.1% for AGIs $25k-50k , 0.1% for AGIs $75k-100k ) Ordinary dividends: $933 (reported on 3.5% of returns )(% of AGI for various income ranges: 0.2% for AGIs below $25k , 0.1% for AGIs $75k-100k ) Net capital gain/loss in AGI: +$243 (reported on 1.6% of returns )(% of AGI for various income ranges: ) Profit/loss from business: +$6,674 (reported on 9.2% of returns )Here:
+$6,674State:
+$16,268
(% of AGI for various income ranges: 6.9% for AGIs below $25k , 0.7% for AGIs $25k-50k , 0.7% for AGIs $50k-75k , 0.8% for AGIs $75k-100k ) Taxable individual retirement arrangement distribution: $8,579 (reported on 3.6% of returns )19141:
$8,579Pennsylvania:
$14,550
(% of AGI for various income ranges: 0.7% for AGIs below $25k , 0.6% for AGIs $25k-50k , 1.5% for AGIs $50k-75k , 1.6% for AGIs $75k-100k , 1.8% for AGIs $100k-200k ) Total itemized deductions: $15,537 (29% of AGI, reported on 20.9% of returns )Here:
$15,537State:
$23,538
Here:
28.7% of AGIState:
18.4% of AGI
(% of AGI for various income ranges: 4.7% for AGIs below $25k , 10.3% for AGIs $25k-50k , 14.7% for AGIs $50k-75k , 15.6% for AGIs $75k-100k , 14.6% for AGIs $100k-200k ) Charity contributions: $3,827 (reported on 16.8% of returns )(% of AGI for various income ranges: 0.7% for AGIs below $25k , 2.0% for AGIs $25k-50k , 2.9% for AGIs $50k-75k , 3.4% for AGIs $75k-100k , 3.6% for AGIs $100k-200k ) Taxes paid: $4,895 (reported on 20.6% of returns )(% of AGI for various income ranges: 1.1% for AGIs below $25k , 2.8% for AGIs $25k-50k , 4.7% for AGIs $50k-75k , 5.7% for AGIs $75k-100k , 5.9% for AGIs $100k-200k ) Earned income credit: $2,373 (reported on 37.5% of returns )(% of AGI for various income ranges: 10.6% for AGIs below $25k , 1.6% for AGIs $25k-50k ) Percentage of individuals using paid preparers for their 2012 taxes: 42.5%(% for various income ranges: 42.8% for AGIs below $25k , 40.4% for AGIs $25k-50k , 45.8% for AGIs $50k-75k , 46.8% for AGIs $75k-100k , 45.8% for AGIs $100k-200k )
Averages for the 2004 tax year for zip code 19141, filed in 2005:
Average Adjusted Gross Income (AGI) in 2004: $26,550 (Individual Income Tax Returns) Here:
$26,550State:
$48,049
Salary/wage: $25,900 (reported on 89.4% of returns )Here:
$25,900State:
$42,646
(% of AGI for various income ranges: 83.8% for AGIs below $10k , 83.8% for AGIs $10k-25k , 90.1% for AGIs $25k-50k , 88.0% for AGIs $50k-75k , 85.4% for AGIs $75k-100k , 80.9% for AGIs over 100k ) Taxable interest for individuals: $622 (reported on 17.7% of returns )This zip code:
$622Pennsylvania:
$1,657
(% of AGI for various income ranges: 0.9% for AGIs below $10k , 0.3% for AGIs $10k-25k , 0.3% for AGIs $25k-50k , 0.3% for AGIs $50k-75k , 0.7% for AGIs $75k-100k , 0.9% for AGIs over 100k ) Taxable dividends: $724 (reported on 5.0% of returns )(% of AGI for various income ranges: 0.2% for AGIs below $10k , 0.1% for AGIs $10k-25k , 0.1% for AGIs $25k-50k , 0.2% for AGIs $50k-75k , 0.2% for AGIs $75k-100k , 0.2% for AGIs over 100k ) Net capital gain/loss: +$1,089 (reported on 2.9% of returns )Here:
+$1,089State:
+$9,716
(% of AGI for various income ranges: -0.1% for AGIs below $10k , 0.1% for AGIs $10k-25k , -0.0% for AGIs $25k-50k , 0.1% for AGIs $50k-75k , 0.1% for AGIs $75k-100k , 1.5% for AGIs over 100k ) Profit/loss from business: +$4,033 (reported on 6.0% of returns )Here:
+$4,033State:
+$14,267
(% of AGI for various income ranges: 4.8% for AGIs below $10k , 2.1% for AGIs $10k-25k , 0.4% for AGIs $25k-50k , 0.3% for AGIs $50k-75k , 0.2% for AGIs $75k-100k , -0.2% for AGIs over 100k ) IRA payment deduction: $1,500 (reported on 1.0% of returns )19141:
$1,500Pennsylvania:
$2,903
Total itemized deductions: $13,833 (29% of AGI, reported on 24.4% of returns )Here:
$13,833State:
$18,804
Here:
29.2% of AGIState:
19.5% of AGI
(% of AGI for various income ranges: 3.0% for AGIs below $10k , 6.1% for AGIs $10k-25k , 12.9% for AGIs $25k-50k , 18.6% for AGIs $50k-75k , 18.3% for AGIs $75k-100k , 17.0% for AGIs over 100k ) Charity contributions deductions: $3,710 (8% of AGI, reported on 22.2% of returns )Here:
7.7% of AGIState:
3.3% of AGI
(% of AGI for various income ranges: 0.4% for AGIs below $10k , 1.3% for AGIs $10k-25k , 3.2% for AGIs $25k-50k , 4.9% for AGIs $50k-75k , 4.6% for AGIs $75k-100k , 4.1% for AGIs over 100k ) Total tax: $2,873 (reported on 58.7% of returns )(% of AGI for various income ranges: 1.5% for AGIs below $10k , 2.6% for AGIs $10k-25k , 5.7% for AGIs $25k-50k , 9.1% for AGIs $50k-75k , 10.8% for AGIs $75k-100k , 13.9% for AGIs over 100k ) Earned income credit: $1,859 (reported on 35.7% of returns )Percentage of individuals using paid preparers for their 2004 taxes: 55.4%(% for various income ranges: 53.7% for AGIs below $10k , 61.5% for AGIs $10k-25k , 51.5% for AGIs $25k-50k , 50.2% for AGIs $50k-75k , 53.9% for AGIs $75k-100k , 58.5% for AGIs over 100k )
Estimated median household income in 2022: This zip code:
$36,358Pennsylvania:
$71,798
Nearest zip codes: 19126 ,
19138 ,
19140 ,
19120 ,
19144 ,
19027 .
Philadelphia Zip Code Map
Percentage of family households: This zip code:
31.1%Pennsylvania:
42.6%
Percentage of households with unmarried partners: This zip code:
3.3%Pennsylvania:
46.5%
No gay or lesbian households reported
Household received Food Stamps/SNAP in the past 12 months: 5,801Household did not receive Food Stamps/SNAP in the past 12 months: 9,483
Women who had a birth in the past 12 months: 506 (140 now married , 320 unmarried) Women who did not have a birth in the past 12 months: 8,183 (1,601 now married , 6,638 unmarried)
Housing units in zip code 19141 with a mortgage: 3,616 (215
second mortgage , 23
home equity loan , 114
both second mortgage and home equity loan )
Houses without a mortgage: 125
Median monthly owner costs for units with a mortgage: $1,167
Median monthly owner costs for units without a mortgage: $506
Residents with income below the poverty level in 2022:
This zip code:
29.5%Whole state:
11.8%
Residents with income below 50% of the poverty level in 2022:
This zip code:
16.7%Whole state:
6.1%
Median number of rooms in houses and condos: Median number of rooms in apartments: Notable locations in this zip code not listed on our city pages
Click to draw/clear zip code borders Notable locations in zip code 19141: (A) , Logan Station (B) , Widener Home (C) , Moss Rehabilitation Hospital (D) , Fern Rock Transportation Center (E) , Logan Branch Library Free Library of Philadelphia (F) , La Salle University Art Museum (G) , Ogontz Library (H) , Philadelphia Fire Department Engine 51 (I) , Philadelphia Fire Department Engine 72 (J) , Philadelphia District 35 Police Station (K) . Display/hide their locations on the map
Parks in zip code 19141 include: (1) , Belfield Recreation Center (2) , Kemble Park (3) , Makefield Park (4) . Display/hide their locations on the map
Year house built (houses)
0 2020 or later0 2010 to 2019213 2000 to 2009262 1990 to 1999324 1980 to 19891,057 1970 to 19791,518 1960 to 19692,334 1950 to 19592,489 1940 to 19497,419 1939 or earlier
Zip code 19141 household income distribution in 2022 2,187 Less than $10,0001,581 $10,000 to $14,9991,063 $15,000 to $19,999737 $20,000 to $24,999938 $25,000 to $29,999737 $30,000 to $34,999755 $35,000 to $39,999581 $40,000 to $44,999538 $45,000 to $49,999977 $50,000 to $59,9991,940 $60,000 to $74,9991,628 $75,000 to $99,999717 $100,000 to $124,999411 $125,000 to $149,999328 $150,000 to $199,99994 $200,000 or moreEstimate of home value of owner-occupied houses/condos in 2022 in zip code 19141 190 Less than $10,00062 $10,000 to $14,999194 $15,000 to $19,99922 $20,000 to $24,9994 $30,000 to $34,999111 $40,000 to $49,999100 $50,000 to $59,999115 $60,000 to $69,999338 $70,000 to $79,999571 $80,000 to $89,999234 $90,000 to $99,9991,407 $100,000 to $124,999924 $125,000 to $149,999848 $150,000 to $174,999732 $175,000 to $199,999733 $200,000 to $249,999143 $250,000 to $299,99961 $300,000 to $399,99938 $400,000 to $499,99935 $750,000 to $999,999Rent paid by renters in 2022 in zip code 19141 267 Less than $10035 $100 to $149185 $150 to $199293 $200 to $249203 $250 to $299265 $300 to $349131 $350 to $399224 $400 to $449360 $450 to $49935 $500 to $54998 $550 to $599141 $600 to $649219 $650 to $699567 $700 to $749352 $750 to $799844 $800 to $899914 $900 to $9991,118 $1,000 to $1,249377 $1,250 to $1,499266 $1,500 to $1,99911 $2,000 to $2,499335 No cash rent
Median gross rent in 2022: $961.
Median price asked for vacant for-sale houses and condos in 2022: $410,688.
Estimated median house (or condo) value in 2022 for: White Non-Hispanic householders: $136,673Black or African American householders: $137,982American Indian or Alaska Native householders: $140,862Asian householders: $156,572Some other race householders: $131,960Two or more races householders: $135,887Hispanic or Latino householders: $153,953Estimated median house or condo value in 2022: $139,030
19141:
$139,030Pennsylvania:
$245,500
Lower value quartile - upper value quartile: $104,906 - $186,552
Mean price in 2022: Detached houses: $382,521Here:
$382,521State:
$317,202
Townhouses or other attached units: $260,733Here:
$260,733State:
$254,369
In 2-unit structures: $270,436Here:
$270,436State:
$249,182
In 3-to-4-unit structures: $324,453Here:
$324,453State:
$297,446
In 5-or-more-unit structures: $444,254Here:
$444,254State:
$320,068
Mobile homes: $57,703Here:
$57,703State:
$92,414
Occupied boats, RVs, vans, etc.: $424,146Here:
$424,146State:
$563,750
Housing units in structures:
One, detached: 1,041One, attached: 9,051Two: 1,7223 or 4: 8715 to 9: 33110 to 19: 37020 to 49: 84050 or more: 1,829Unemployment : 11.3%
Means of transportation to work in zip code 19141 41.6% 5,452 Drove a car alone7.0% 920 Carpooled18.7% 2,456 Bus or trolley bus7.7% 1,007 Streetcar or trolley car1.3% 174 Subway or elevated2.8% 364 Taxi0.1% 13 Bicycle3.1% 412 Walked1.4% 190 Other means9.4% 1,228 Worked at homeTravel time to work (commute) in zip code 19141 123 Less than 5 minutes584 5 to 9 minutes825 10 to 14 minutes1,297 15 to 19 minutes1,322 20 to 24 minutes378 25 to 29 minutes2,670 30 to 34 minutes228 35 to 39 minutes471 40 to 44 minutes1,602 45 to 59 minutes1,132 60 to 89 minutes1,058 90 or more minutes
Neighborhoods in zip code 19141: Percentage of zip code residents living and working in this county: 75.6%
Household type by relationship:
Households: 34,193
Male householders: 4,805 (2,377 living alone ), Female householders: 10,314 (4,108 living alone )2,523 spouses (2,456 opposite-sex spouses ), 652 unmarried partners , (652 opposite-sex unmarried partners ), 9,017 children (8,801 natural , 77 adopted , 145 stepchildren ), 2,545 grandchildren , 607 brothers or sisters , 610 parents , 27 foster children , 990 other relatives , 947 non-relatives In group quarters: 1,090 (-1 institutionalized population )
Size of family households: 3,757 2-persons , 1,851 3-persons , 556 4-persons , 1,227 5-persons , 204 6-persons , 112 7-or-more-persons
Size of nonfamily households: 6,484 1-person , 865 2-persons , 41 3-persons , 12 4-persons
1,546 married couples with children. single-parent households (300 men , 3,119 women ).
87.4% of residents of 19141 zip code speak English at home. of residents speak Spanish at home (77% very well, 8% well, 13% not well, 2% not at all ).of residents speak other Indo-European language at home (59% very well, 18% well, 10% not well, 13% not at all ).of residents speak Asian or Pacific Island language at home (34% very well, 29% well, 35% not well, 2% not at all ).of residents speak other language at home (90% very well, 10% well ).
Foreign born population: 3,159 (9.2%)
(43.3%
of them are naturalized citizens )
This zip code:
9.2%Whole state:
7.5%
19% Haiti 17% Liberia 9% St. Vincent and the Grenadines 7% Democratic Republic of Congo (Zaire) 6% Burma (Myanmar) 5% Belize 5% Grenada 2% Jamaican 2% Nigerian 1% Trinidadian and Tobagonian 1% American 1% African 1% West Indian 0% Haitian
Year of entry for the foreign-born population
1,813 2010 or later 527 2000 to 2009 429 1990 to 1999 892 Before 1990
There are
181 Internal Medicine Specialists 88 Optometrists 85 Emergency Medicine Specialists 469 Other Medical Specialists in Zip Code 19141.
Facilities with environmental interests located in this zip code:
ALBERT EINSTEIN MED CTR (5501 OLD YORK ROAD in PHILADELPHIA, PA)
AIR SYNTHETIC MINOR (AIRS/AFS) CRITERIA AND HAZARDOUS AIR POLLUTANT INVENTORY (Inventory of air pollution sources) STATE MASTER (Pennsylvania database) - RCRIS-PAD981106198, HAZARDOUS WASTE PROGRAM Small Quantity Generators, between 100 kg and 1000 kg of hazardous waste/month (Resource Conservation and Recovery Act (tracking hazardous waste)) - notification Business SIC classification: GENERAL MEDICAL AND SURGICAL HOSPITALSOrganizations: OPERNAME (CONTACT/OPERATOR)
, AEMC HEALTHCARE FOUNDATION (CONTACT/OWNER)
Alternative names: ALBERT EINSTEIN MEDICAL COLLEGE, ALBERT EINSTEIN MEDICAL CENTER, EINSTEIN, ALBERT MEDICAL CENTER, EINSTEIN NORTH DIV
BELL OF PA (4900 N BROAD ST in PHILADELPHIA, PA)
STATE MASTER (Pennsylvania database) - RCRIS-PAD987338183, HAZARDOUS WASTE PROGRAM Conditionally Exempt Small Quantity Generators, less than 100 kg/month of hazardous waste (Resource Conservation and Recovery Act (tracking hazardous waste)) - notification Organizations: OPERNAME (CONTACT/OPERATOR)
, BELL OF PENNSYLVANIA (CONTACT/OWNER)
, VERIZON COMMUNICATIONS (CONTACT/OWNER)
BIRNEY GEN DAVIS B SCH (900 W LINDLEY AVE in PHILADELPHIA, PA)
(National Center for Education Statistics) - STATE ID-3733 Organizations: PHILADELPHIA CITY SD (SCHOOL DISTRICT)
60 MINUTE CLEANERS (1123 W LOUDEN ST in PHILADELPHIA, PA)
AIR MINOR (AIRS/AFS) Small Quantity Generators, between 100 kg and 1000 kg of hazardous waste/month (Resource Conservation and Recovery Act (tracking hazardous waste)) - notification Business SIC classification: DRYCLEANING PLANTS, EXCEPT RUG CLEANINGOrganizations: OPERNAME (CONTACT/OPERATOR)
, KIM, HUNG (CONTACT/OWNER)
Alternative names: 60 MINUTES CLEANERS, 60 MINUTES CLNR SVC
AJS AUTO COLLISION (6000 OLD YORK RD in PHILADELPHIA, PA)
Conditionally Exempt Small Quantity Generators, less than 100 kg/month of hazardous waste (Resource Conservation and Recovery Act (tracking hazardous waste)) - notification Conditionally Exempt Small Quantity Generators, less than 100 kg/month of hazardous waste (Resource Conservation and Recovery Act (tracking hazardous waste)) - notification Organizations: LICHT ALLEN (CONTACT/OWNER)
, JUHASZ ALLAN (CONTACT/OWNER)
Alternative names: AUTO USA
Housing units lacking complete plumbing facilities: 2.0%
Housing units lacking complete kitchen facilities: 3.3%
68.2% Utility gas 24.1% Electricity 5.0% Fuel oil, kerosene, etc. 1.0% Bottled, tank, or LP gas 0.8% Other fuel 0.7% No fuel used
Population in 1990: 38,546.
Place of birth for U.S.-born residents:
This state: 25,647Northeast: 1,060Midwest: 233South: 3,490West: 100
64% of the 19141 zip code residents lived in the same house 5 years ago.
Out of people who lived in different houses, 70% lived in this county.
Out of people who lived in different counties, 50% lived in Pennsylvania.
91% of the 19141 zip code residents lived in the same house 1 year ago.
Out of people who lived in different houses, 65% moved from this county.
Out of people who lived in different houses, 5% moved from different county within same state.
Out of people who lived in different houses, 23% moved from different state.
Out of people who lived in different houses, 9% moved from abroad.
Private vs. public school enrollment:
Students in private schools in grades 1 to 8 (elementary and middle school): 263
Here:
7.5%Pennsylvania:
15.7%
Students in private schools in grades 9 to 12 (high school): 402
Here:
20.1%Pennsylvania:
13.4%
Students in private undergraduate colleges: 1,153
Here:
63.3%Pennsylvania:
39.8%
Occupation by median earnings in the past 12 months ($)
73,912 Law enforcement workers including supervisors 68,448 Health diagnosing and treating practitioners and other technical occupations 57,534 Management occupations 55,593 Health technologists and technicians 54,454 Business and financial operations occupations 46,336 Community and social service occupations
Companies with federal contracts located in this zip code:
LA SALLE UNIVERSITY (1900 WEST OLNEY AVENUE in PHILADELPHIA, PA)
$136,000 with Navy for Education Services. Signed on 1999-12-13. Completion date: 2000-01-12.
Dawud Adib (1300 W. Lindley Ave. in Philadelphia, pa; small business)
$4,100 with Bureau of Prisoners/Federal Prison System for Training/Curriculum Development. Taking place in KS. Signed on 2004-12-08. Completion date: 2005-01-10.
Top industries in this zip code by the number of employees in 2005:
Health Care and Social Assistance: General Medical and Surgical Hospitals (over 1000 employees: 1 establishment)Educational Services: Colleges, Universities, and Professional Schools (over 1000: 1)Health Care and Social Assistance: Offices of Physicians (except Mental Health Specialists) (250-499: 2, 10-19: 3, 5-9: 7, 1-4: 17)Health Care and Social Assistance: Specialty (except Psychiatric and Substance Abuse) Hospitals (500-999: 1, 1-4: 1)Management of Companies and Enterprises: Corporate, Subsidiary, and Regional Managing Offices (250-499: 1)Health Care and Social Assistance: Nursing Care Facilities (100-249: 2)Accommodation and Food Services: Limited-Service Restaurants (50-99: 1, 20-49: 3, 1-4: 17)Health Care and Social Assistance: Offices of Optometrists (100-249: 1)Health Care and Social Assistance: All Other Outpatient Care Centers (100-249: 1)Other Services (except Public Administration): Religious Organizations (20-49: 3, 10-19: 1, 5-9: 2, 1-4: 7)
People in group quarters in 2010:
973 people in college/university student housing
104 people in nursing facilities/skilled-nursing facilities
74 people in group homes intended for adults
41 people in other noninstitutional facilities
22 people in residential treatment centers for adults
People in group quarters in 2000:
1,713 people in college dormitories (includes college quarters off campus)
480 people in nursing homes
97 people in hospitals/wards and hospices for chronically ill
76 people in military hospitals or wards for chronically ill
54 people in homes for the mentally ill
35 people in other nonhousehold living situations
26 people in homes or halfway houses for drug/alcohol abuse
24 people in other group homes
22 people in religious group quarters
21 people in federal prisons and detention centers
21 people in other hospitals or wards for chronically ill
20 people in other noninstitutional group quarters
Fatal accident statistics in 2014:
Fatal accident count: 1Vehicles involved in fatal accidents: 2Fatal accidents caused by drunken drivers: 0Fatalities: 1Persons involved in fatal accidents: 2Pedestrians involved in fatal accidents: 0
Fatal accident statistics in 2012:
Fatal accident count: 1Vehicles involved in fatal accidents: 2Fatal accidents caused by drunken drivers: 1Fatalities: 1Persons involved in fatal accidents: 30Pedestrians involved in fatal accidents: 0
Home Mortgage Disclosure Act Aggregated Statistics For Year 2009(Based on 5 full and 16 partial tracts) A) FHA, FSA/RHS & VA B) Conventional C) Refinancings D) Home Improvement Loans E) Loans on Dwellings For 5+ Families F) Non-occupant Loans on G) Loans On Manufactured Number Average Value Number Average Value Number Average Value Number Average Value Number Average Value Number Average Value Number Average Value
LOANS ORIGINATED 186 $103,322 45 $81,557 206 $83,792 106 $25,139 2 $1,722,050 49 $74,543 3 $49,807 APPLICATIONS APPROVED, NOT ACCEPTED 17 $107,695 2 $132,290 58 $83,157 20 $23,190 1 $262,450 4 $71,285 0 $0 APPLICATIONS DENIED 45 $103,512 41 $84,389 341 $81,725 295 $19,735 2 $451,380 79 $62,360 0 $0 APPLICATIONS WITHDRAWN 25 $102,038 18 $74,468 169 $85,580 21 $44,426 0 $0 18 $133,007 0 $0 FILES CLOSED FOR INCOMPLETENESS 3 $91,270 3 $49,357 35 $84,137 8 $22,256 0 $0 7 $45,149 0 $0
Aggregated Statistics For Year 2008(Based on 5 full and 16 partial tracts) A) FHA, FSA/RHS & VA B) Conventional C) Refinancings D) Home Improvement Loans E) Loans on Dwellings For 5+ Families F) Non-occupant Loans on G) Loans On Manufactured Number Average Value Number Average Value Number Average Value Number Average Value Number Average Value Number Average Value Number Average Value
LOANS ORIGINATED 150 $101,356 147 $80,706 406 $81,771 166 $27,114 5 $3,258,240 138 $81,178 0 $0 APPLICATIONS APPROVED, NOT ACCEPTED 13 $108,466 34 $91,702 100 $76,704 42 $28,063 0 $0 24 $77,575 0 $0 APPLICATIONS DENIED 52 $86,519 112 $85,885 693 $85,508 503 $27,863 2 $117,745 155 $76,774 2 $51,195 APPLICATIONS WITHDRAWN 41 $86,012 33 $95,017 208 $99,779 22 $36,199 1 $4,875,600 32 $177,243 0 $0 FILES CLOSED FOR INCOMPLETENESS 6 $154,462 18 $107,245 76 $102,439 8 $36,502 0 $0 13 $90,796 0 $0
Aggregated Statistics For Year 2007(Based on 5 full and 16 partial tracts) A) FHA, FSA/RHS & VA B) Conventional C) Refinancings D) Home Improvement Loans E) Loans on Dwellings For 5+ Families F) Non-occupant Loans on G) Loans On Manufactured Number Average Value Number Average Value Number Average Value Number Average Value Number Average Value Number Average Value Number Average Value
LOANS ORIGINATED 65 $105,111 387 $84,851 708 $75,481 248 $36,252 16 $1,963,126 266 $76,316 3 $34,723 APPLICATIONS APPROVED, NOT ACCEPTED 6 $93,760 77 $78,187 172 $78,352 68 $36,333 0 $0 63 $71,694 0 $0 APPLICATIONS DENIED 14 $122,453 277 $88,634 1,009 $83,352 614 $28,871 8 $911,911 282 $74,490 6 $47,738 APPLICATIONS WITHDRAWN 13 $101,763 84 $89,307 436 $89,871 53 $46,569 10 $1,315,671 66 $85,337 0 $0 FILES CLOSED FOR INCOMPLETENESS 1 $107,080 49 $95,589 87 $83,515 3 $38,090 1 $365,000 27 $71,703 0 $0
Aggregated Statistics For Year 2006(Based on 5 full and 16 partial tracts) A) FHA, FSA/RHS & VA B) Conventional C) Refinancings D) Home Improvement Loans E) Loans on Dwellings For 5+ Families F) Non-occupant Loans on G) Loans On Manufactured Number Average Value Number Average Value Number Average Value Number Average Value Number Average Value Number Average Value Number Average Value
LOANS ORIGINATED 63 $95,252 577 $78,364 940 $72,700 311 $32,645 16 $2,763,296 379 $74,595 3 $57,820 APPLICATIONS APPROVED, NOT ACCEPTED 2 $48,880 130 $67,476 248 $67,455 51 $28,874 2 $19,305 85 $59,705 0 $0 APPLICATIONS DENIED 9 $90,294 396 $70,465 1,160 $75,018 591 $28,169 4 $115,935 335 $64,634 3 $21,430 APPLICATIONS WITHDRAWN 17 $90,322 123 $78,369 514 $76,515 40 $38,343 4 $335,710 79 $73,525 4 $51,718 FILES CLOSED FOR INCOMPLETENESS 0 $0 43 $90,187 130 $75,769 5 $53,730 0 $0 16 $74,562 0 $0
Aggregated Statistics For Year 2005(Based on 5 full and 16 partial tracts) A) FHA, FSA/RHS & VA B) Conventional C) Refinancings D) Home Improvement Loans E) Loans on Dwellings For 5+ Families F) Non-occupant Loans on G) Loans On Manufactured Number Average Value Number Average Value Number Average Value Number Average Value Number Average Value Number Average Value Number Average Value
LOANS ORIGINATED 68 $79,771 476 $66,969 795 $65,394 280 $30,208 11 $2,783,603 349 $60,315 0 $0 APPLICATIONS APPROVED, NOT ACCEPTED 2 $81,515 87 $69,900 253 $58,398 45 $26,911 0 $0 64 $60,614 1 $60,970 APPLICATIONS DENIED 14 $72,765 302 $71,152 1,342 $61,788 596 $24,572 5 $375,686 322 $46,381 4 $49,038 APPLICATIONS WITHDRAWN 9 $79,880 141 $67,583 537 $75,124 88 $69,314 3 $363,730 85 $76,277 1 $49,230 FILES CLOSED FOR INCOMPLETENESS 0 $0 32 $82,294 134 $74,168 9 $62,124 0 $0 18 $71,053 0 $0
Aggregated Statistics For Year 2004(Based on 5 full and 16 partial tracts) A) FHA, FSA/RHS & VA B) Conventional C) Refinancings D) Home Improvement Loans E) Loans on Dwellings For 5+ Families F) Non-occupant Loans on G) Loans On Manufactured Number Average Value Number Average Value Number Average Value Number Average Value Number Average Value Number Average Value Number Average Value
LOANS ORIGINATED 76 $68,357 340 $61,192 690 $58,762 259 $25,951 12 $1,264,208 314 $54,738 1 $2,000 APPLICATIONS APPROVED, NOT ACCEPTED 16 $58,399 70 $61,526 262 $56,547 58 $17,719 2 $96,505 84 $58,176 1 $40,460 APPLICATIONS DENIED 14 $75,636 164 $59,890 1,300 $59,033 574 $19,091 8 $208,709 286 $39,527 6 $34,928 APPLICATIONS WITHDRAWN 10 $71,228 71 $61,012 522 $63,430 80 $38,020 1 $11,290 74 $53,781 0 $0 FILES CLOSED FOR INCOMPLETENESS 2 $77,285 24 $71,203 168 $68,109 17 $43,190 0 $0 34 $56,877 0 $0
Aggregated Statistics For Year 2003(Based on 5 full and 16 partial tracts) A) FHA, FSA/RHS & VA B) Conventional C) Refinancings D) Home Improvement Loans E) Loans on Dwellings For 5+ Families F) Non-occupant Loans on Number Average Value Number Average Value Number Average Value Number Average Value Number Average Value Number Average Value
LOANS ORIGINATED 81 $60,989 234 $55,926 686 $52,329 208 $18,824 9 $647,340 235 $48,449 APPLICATIONS APPROVED, NOT ACCEPTED 9 $57,166 48 $47,332 279 $54,815 44 $22,197 2 $242,530 64 $49,348 APPLICATIONS DENIED 10 $59,698 147 $55,385 1,157 $55,060 442 $18,157 3 $124,497 174 $44,676 APPLICATIONS WITHDRAWN 10 $58,441 31 $56,350 369 $57,068 29 $27,135 0 $0 43 $51,944 FILES CLOSED FOR INCOMPLETENESS 1 $64,270 18 $52,634 74 $50,861 9 $29,501 1 $57,430 22 $39,011
Aggregated Statistics For Year 2002(Based on 5 full and 16 partial tracts) A) FHA, FSA/RHS & VA B) Conventional C) Refinancings D) Home Improvement Loans E) Loans on Dwellings For 5+ Families F) Non-occupant Loans on Number Average Value Number Average Value Number Average Value Number Average Value Number Average Value Number Average Value
LOANS ORIGINATED 100 $59,668 136 $50,123 520 $49,028 123 $21,430 3 $1,040,960 130 $46,290 APPLICATIONS APPROVED, NOT ACCEPTED 7 $62,504 59 $47,162 299 $49,160 33 $23,330 0 $0 39 $48,060 APPLICATIONS DENIED 10 $64,722 112 $48,416 1,118 $46,498 276 $19,151 4 $248,450 123 $44,540 APPLICATIONS WITHDRAWN 15 $60,665 35 $39,638 353 $49,051 25 $24,052 4 $257,293 30 $41,012 FILES CLOSED FOR INCOMPLETENESS 2 $43,915 27 $51,326 110 $62,198 0 $0 0 $0 8 $68,724
Aggregated Statistics For Year 2001(Based on 5 full and 16 partial tracts) A) FHA, FSA/RHS & VA B) Conventional C) Refinancings D) Home Improvement Loans E) Loans on Dwellings For 5+ Families F) Non-occupant Loans on Number Average Value Number Average Value Number Average Value Number Average Value Number Average Value Number Average Value
LOANS ORIGINATED 124 $56,937 125 $48,076 436 $43,823 122 $19,265 10 $864,303 124 $43,131 APPLICATIONS APPROVED, NOT ACCEPTED 8 $58,164 74 $46,754 259 $43,317 57 $27,561 2 $134,010 35 $43,895 APPLICATIONS DENIED 13 $54,765 137 $47,510 1,047 $44,078 448 $17,177 6 $1,573,410 88 $42,930 APPLICATIONS WITHDRAWN 17 $54,365 32 $54,435 317 $43,928 48 $22,693 3 $224,843 26 $45,590 FILES CLOSED FOR INCOMPLETENESS 5 $60,894 11 $62,168 78 $46,721 9 $21,077 0 $0 8 $45,992
Aggregated Statistics For Year 2000(Based on 5 full and 16 partial tracts) A) FHA, FSA/RHS & VA B) Conventional C) Refinancings D) Home Improvement Loans E) Loans on Dwellings For 5+ Families F) Non-occupant Loans on Number Average Value Number Average Value Number Average Value Number Average Value Number Average Value Number Average Value
LOANS ORIGINATED 117 $55,002 173 $51,194 502 $39,381 305 $14,693 2 $78,040 82 $39,944 APPLICATIONS APPROVED, NOT ACCEPTED 5 $36,514 44 $42,958 224 $40,193 121 $16,713 0 $0 20 $40,384 APPLICATIONS DENIED 12 $55,186 159 $47,188 994 $41,894 605 $15,689 1 $2,187,840 115 $48,804 APPLICATIONS WITHDRAWN 15 $50,231 78 $53,806 476 $43,505 88 $25,907 2 $16,085 57 $41,734 FILES CLOSED FOR INCOMPLETENESS 2 $40,210 14 $43,329 116 $49,580 4 $21,712 0 $0 10 $137,399
Aggregated Statistics For Year 1999(Based on 3 full and 8 partial tracts) A) FHA, FSA/RHS & VA B) Conventional C) Refinancings D) Home Improvement Loans E) Loans on Dwellings For 5+ Families F) Non-occupant Loans on Number Average Value Number Average Value Number Average Value Number Average Value Number Average Value Number Average Value
LOANS ORIGINATED 68 $54,150 84 $45,835 363 $40,362 161 $16,783 2 $609,280 63 $38,800 APPLICATIONS APPROVED, NOT ACCEPTED 5 $57,274 33 $43,773 237 $40,710 80 $14,377 1 $10,760 25 $41,652 APPLICATIONS DENIED 7 $45,934 73 $47,288 536 $39,657 373 $13,918 1 $60,520 66 $39,211 APPLICATIONS WITHDRAWN 5 $51,476 44 $48,748 303 $41,634 53 $18,856 1 $42,240 22 $42,731 FILES CLOSED FOR INCOMPLETENESS 2 $69,815 4 $61,220 91 $43,459 1 $29,180 0 $0 8 $38,155
Private Mortgage Insurance Companies Aggregated Statistics For Year 2009(Based on 5 full and 12 partial tracts) A) Conventional B) Refinancings C) Non-occupant Loans on Number Average Value Number Average Value Number Average Value
LOANS ORIGINATED 11 $99,200 1 $219,870 0 $0 APPLICATIONS APPROVED, NOT ACCEPTED 9 $96,150 0 $0 1 $140,000 APPLICATIONS DENIED 1 $82,420 2 $90,980 0 $0 APPLICATIONS WITHDRAWN 1 $184,470 1 $103,000 0 $0 FILES CLOSED FOR INCOMPLETENESS 0 $0 0 $0 0 $0
Aggregated Statistics For Year 2008(Based on 5 full and 16 partial tracts) A) Conventional B) Refinancings C) Non-occupant Loans on Number Average Value Number Average Value Number Average Value
LOANS ORIGINATED 83 $90,536 12 $94,472 19 $75,404 APPLICATIONS APPROVED, NOT ACCEPTED 49 $98,377 23 $95,570 13 $78,269 APPLICATIONS DENIED 9 $79,367 0 $0 3 $76,940 APPLICATIONS WITHDRAWN 8 $82,416 0 $0 3 $53,637 FILES CLOSED FOR INCOMPLETENESS 4 $125,950 0 $0 2 $130,400
Aggregated Statistics For Year 2007(Based on 5 full and 16 partial tracts) A) Conventional B) Refinancings C) Non-occupant Loans on Number Average Value Number Average Value Number Average Value
LOANS ORIGINATED 211 $95,852 33 $88,170 52 $79,474 APPLICATIONS APPROVED, NOT ACCEPTED 53 $86,538 8 $91,942 9 $67,196 APPLICATIONS DENIED 14 $111,794 3 $91,530 6 $109,183 APPLICATIONS WITHDRAWN 16 $92,469 5 $113,452 7 $93,801 FILES CLOSED FOR INCOMPLETENESS 2 $106,475 0 $0 0 $0
Aggregated Statistics For Year 2006(Based on 5 full and 16 partial tracts) A) Conventional B) Refinancings C) Non-occupant Loans on Number Average Value Number Average Value Number Average Value
LOANS ORIGINATED 177 $81,895 29 $74,762 44 $67,718 APPLICATIONS APPROVED, NOT ACCEPTED 38 $71,104 5 $67,566 6 $66,792 APPLICATIONS DENIED 8 $78,292 3 $63,157 5 $38,854 APPLICATIONS WITHDRAWN 9 $58,006 2 $151,635 3 $38,863 FILES CLOSED FOR INCOMPLETENESS 0 $0 0 $0 0 $0
Aggregated Statistics For Year 2005(Based on 5 full and 16 partial tracts) A) Conventional B) Refinancings C) Non-occupant Loans on Number Average Value Number Average Value Number Average Value
LOANS ORIGINATED 166 $74,464 28 $72,026 53 $66,954 APPLICATIONS APPROVED, NOT ACCEPTED 32 $66,951 10 $55,803 14 $53,489 APPLICATIONS DENIED 5 $66,880 1 $26,850 5 $66,880 APPLICATIONS WITHDRAWN 12 $72,418 4 $76,975 6 $58,118 FILES CLOSED FOR INCOMPLETENESS 1 $56,450 1 $71,390 1 $56,450
Aggregated Statistics For Year 2004(Based on 5 full and 16 partial tracts) A) Conventional B) Refinancings C) Non-occupant Loans on Number Average Value Number Average Value Number Average Value
LOANS ORIGINATED 144 $62,093 35 $63,426 59 $55,507 APPLICATIONS APPROVED, NOT ACCEPTED 13 $43,798 15 $66,518 9 $43,579 APPLICATIONS DENIED 3 $47,703 1 $62,990 3 $57,783 APPLICATIONS WITHDRAWN 5 $58,364 5 $73,744 3 $68,303 FILES CLOSED FOR INCOMPLETENESS 0 $0 0 $0 0 $0
Aggregated Statistics For Year 2003(Based on 5 full and 16 partial tracts) A) Conventional B) Refinancings C) Non-occupant Loans on Number Average Value Number Average Value Number Average Value
LOANS ORIGINATED 99 $62,211 40 $65,900 42 $55,926 APPLICATIONS APPROVED, NOT ACCEPTED 20 $53,436 11 $68,645 4 $64,793 APPLICATIONS DENIED 7 $45,734 4 $77,110 5 $49,684 APPLICATIONS WITHDRAWN 3 $68,177 5 $64,082 0 $0 FILES CLOSED FOR INCOMPLETENESS 1 $60,170 0 $0 0 $0
Aggregated Statistics For Year 2002(Based on 5 full and 16 partial tracts) A) Conventional B) Refinancings C) Non-occupant Loans on Number Average Value Number Average Value Number Average Value
LOANS ORIGINATED 64 $52,766 38 $58,458 19 $44,143 APPLICATIONS APPROVED, NOT ACCEPTED 18 $48,363 7 $62,846 3 $39,877 APPLICATIONS DENIED 3 $41,997 1 $56,450 1 $56,450 APPLICATIONS WITHDRAWN 2 $36,995 1 $58,710 0 $0 FILES CLOSED FOR INCOMPLETENESS 0 $0 0 $0 0 $0
Aggregated Statistics For Year 2001(Based on 5 full and 16 partial tracts) A) Conventional B) Refinancings C) Non-occupant Loans on Number Average Value Number Average Value Number Average Value
LOANS ORIGINATED 51 $54,895 14 $58,536 25 $51,172 APPLICATIONS APPROVED, NOT ACCEPTED 11 $54,951 10 $68,703 2 $62,585 APPLICATIONS DENIED 4 $48,605 3 $68,037 1 $44,760 APPLICATIONS WITHDRAWN 1 $40,940 3 $53,510 0 $0 FILES CLOSED FOR INCOMPLETENESS 0 $0 1 $64,270 1 $64,270
Aggregated Statistics For Year 2000(Based on 5 full and 16 partial tracts) A) Conventional B) Refinancings C) Non-occupant Loans on Number Average Value Number Average Value Number Average Value
LOANS ORIGINATED 39 $54,094 29 $47,174 13 $50,919 APPLICATIONS APPROVED, NOT ACCEPTED 6 $65,620 6 $52,340 1 $73,340 APPLICATIONS DENIED 3 $55,220 0 $0 0 $0 APPLICATIONS WITHDRAWN 0 $0 1 $48,120 0 $0 FILES CLOSED FOR INCOMPLETENESS 0 $0 0 $0 0 $0
Aggregated Statistics For Year 1999(Based on 3 full and 8 partial tracts) A) Conventional B) Refinancings C) Non-occupant Loans on Number Average Value Number Average Value Number Average Value
LOANS ORIGINATED 19 $51,853 47 $44,731 6 $46,523 APPLICATIONS APPROVED, NOT ACCEPTED 0 $0 1 $92,420 0 $0 APPLICATIONS DENIED 4 $39,445 0 $0 1 $54,000 APPLICATIONS WITHDRAWN 0 $0 0 $0 0 $0 FILES CLOSED FOR INCOMPLETENESS 0 $0 1 $36,330 0 $0
2010 - 2018 National Fire Incident Reporting System (NFIRS) incidents See full 2006 National Fire Incident Reporting System statistics for zip code 19141, Pennsylvania
Most common first names in zip code 19141 among deceased individuals Name Count Lived (average)
William 310 73.9 years John 293 74.0 years Mary 291 80.2 years Anna 282 83.7 years James 259 68.8 years Rose 249 84.3 years Joseph 228 76.3 years Samuel 205 80.4 years Harry 185 80.9 years Charles 176 75.3 years
Most common last names in zip code 19141 among deceased individuals Last name Count Lived (average)
Johnson 138 70.8 years Smith 136 72.2 years Williams 136 66.6 years Brown 123 71.5 years Jones 109 71.8 years Cohen 108 82.1 years Davis 70 72.9 years Jackson 68 72.6 years Robinson 68 71.5 years Miller 64 79.6 years
Businesses in zip code 19141
Name Count Name Count
7-Eleven 1 KFC 1 Burger King 1 McDonald's 2 Church's Chicken 2 Nike 3 Cricket Wireless 3 Papa John's Pizza 1 Dunkin Donuts 3 Popeyes 1 FedEx 1 Rite Aid 2 GNC 1 Taco Bell 1 H&R Block 1 Wendy's 1


 Nearest zip codes: 19126, 19138, 19140, 19120, 19144, 19027.
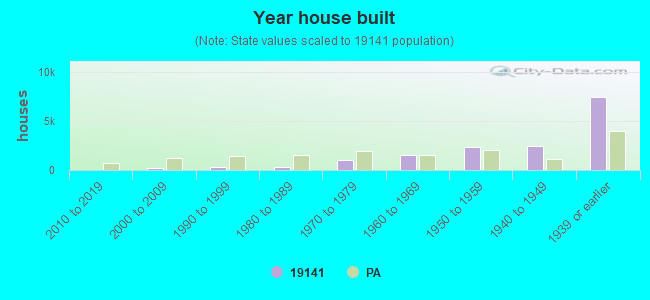

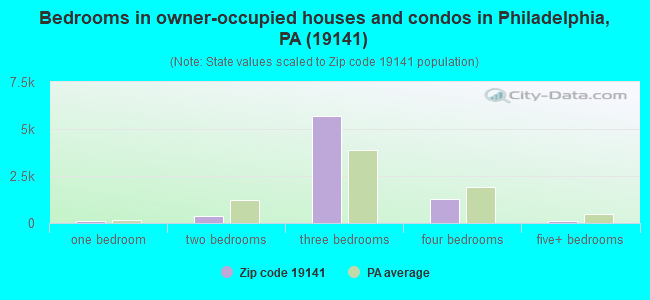
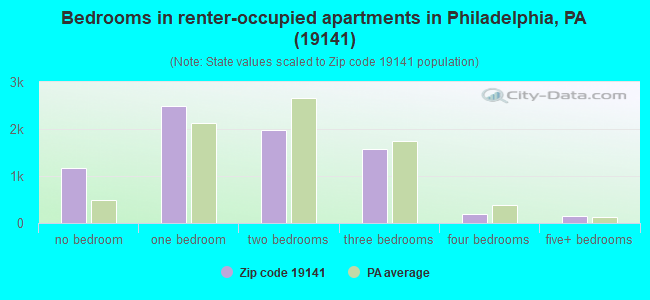
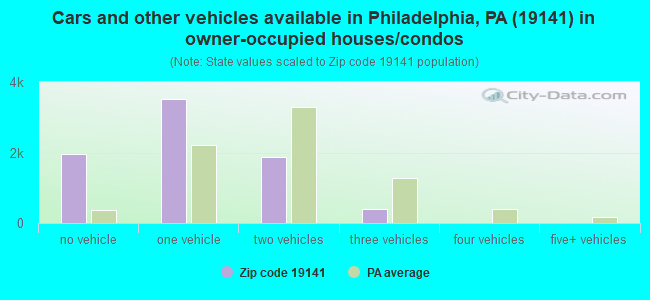
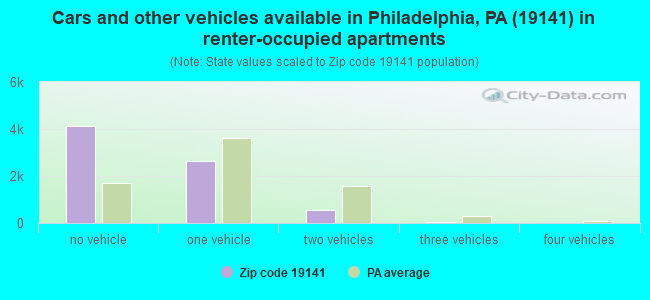


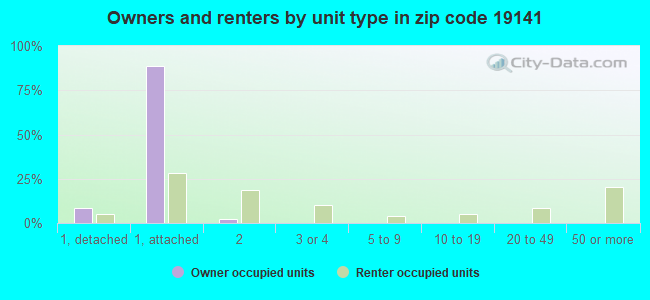
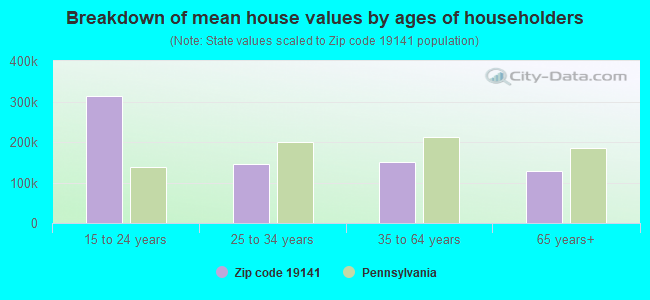


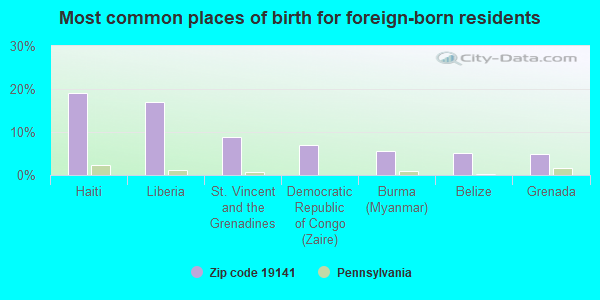
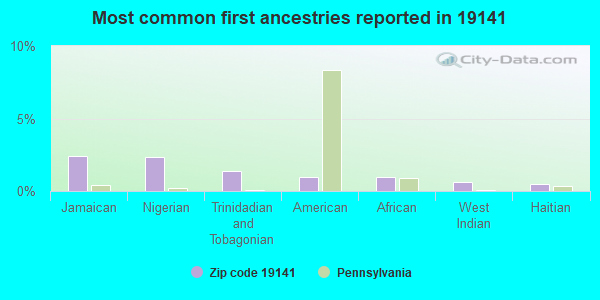
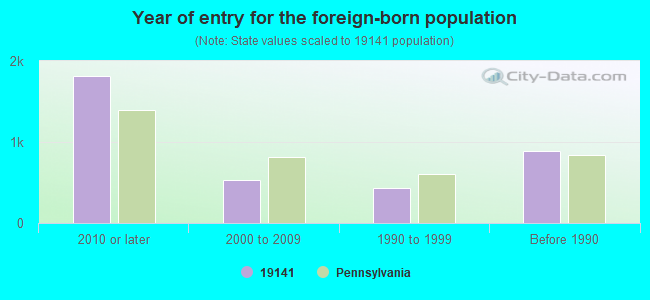


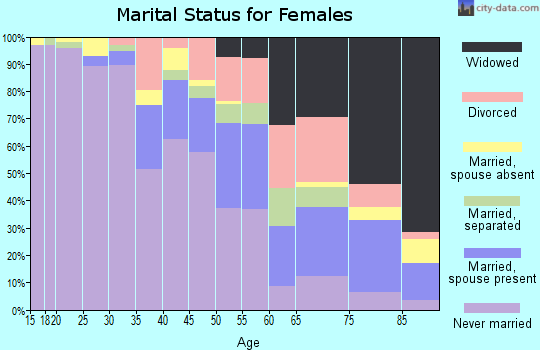
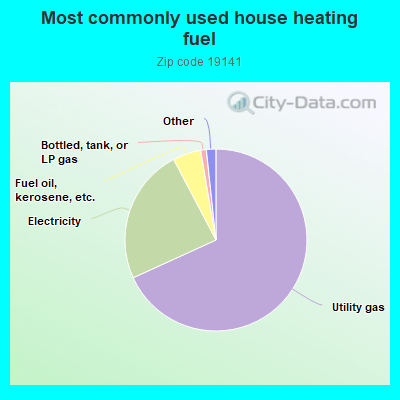
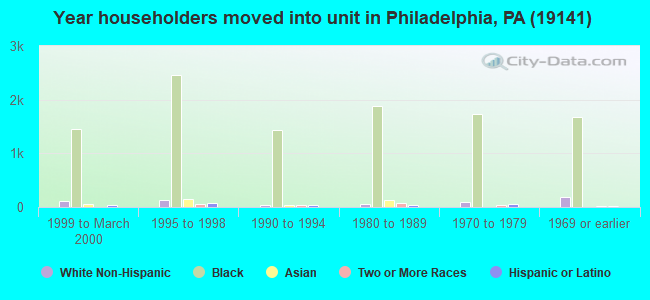
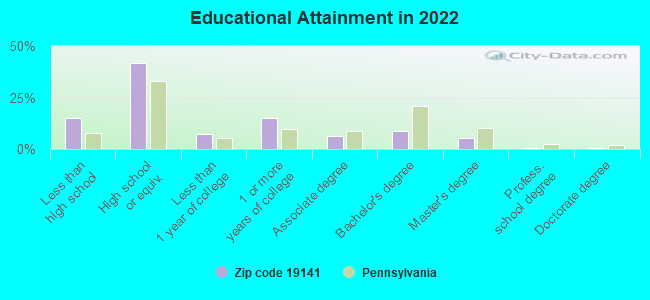
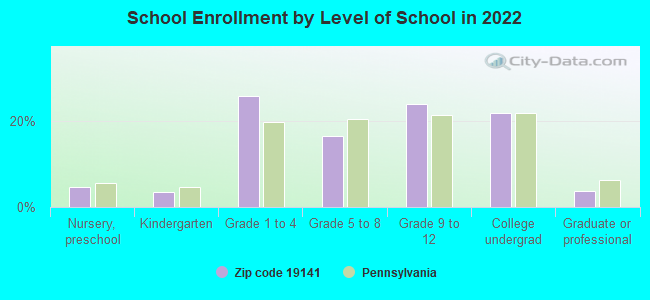
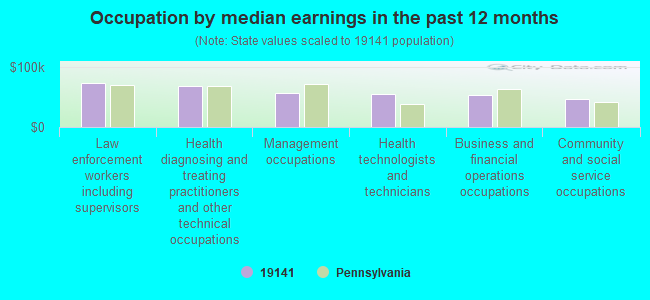
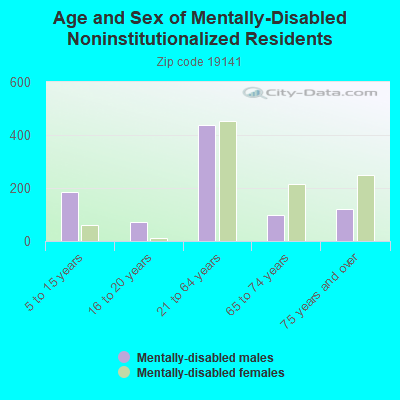
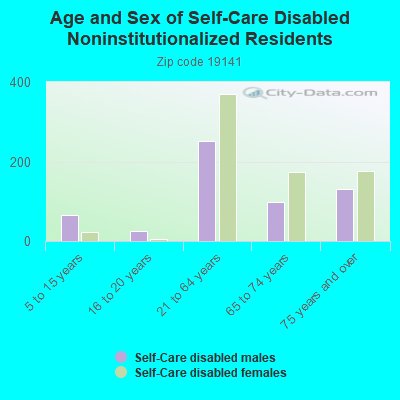
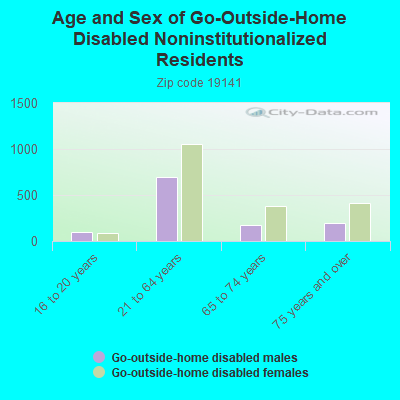
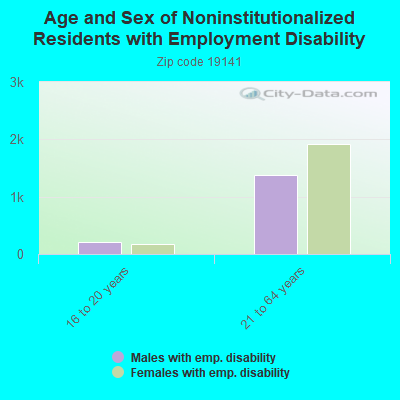
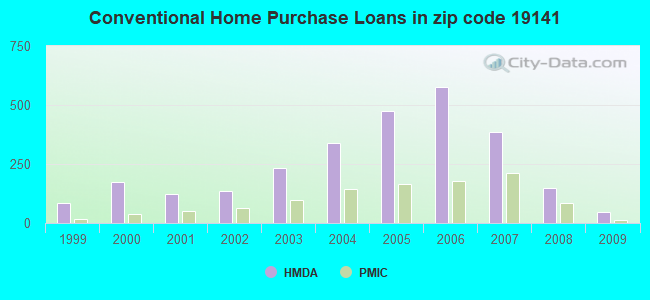
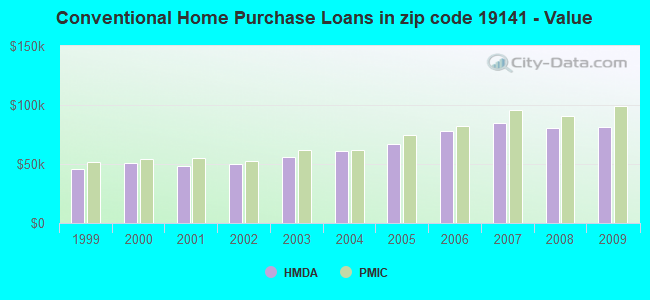
 Based on the data from the years 2010 - 2018 the average number of fire incidents per year is 173. The highest number of fire incidents - 281 took place in 2011, and the least - 0 in 2016. The data has a declining trend.
 When looking into fire subcategories, the most reports belonged to: Structure Fires (53.4%), and Outside Fires (29.1%).