Estimated zip code population in 2022: 67,060 Zip code population in 2010: 63,090 Zip code population in 2000: 58,874
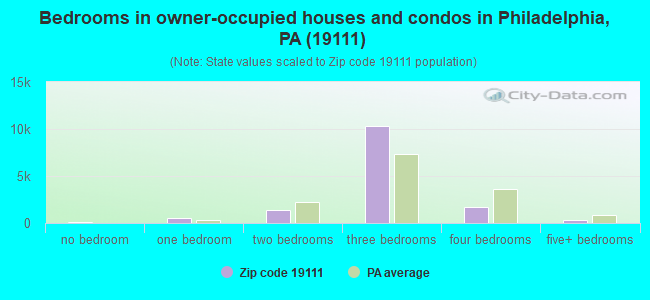
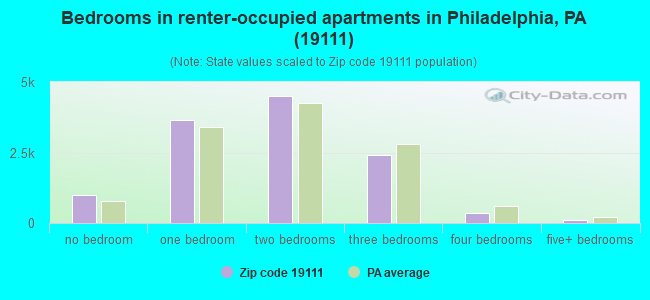
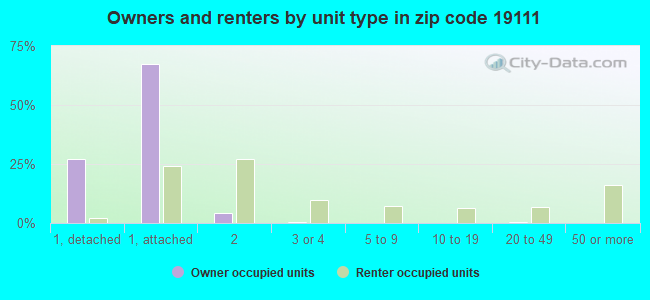
Houses and condos: 27,979 Renter-occupied apartments: 11,953
% of renters here:
45%
State:
31%
March 2022 cost of living index in zip code 19111: 104.2 (near average, U.S. average is 100)
Land area: 4.8 sq. mi. Water area: 0.0 sq. mi.
Population density: 13,880 people per square mile
(very high).
OSM Map
General Map
Google Map
MSN Map
OSM Map
General Map
Google Map
MSN Map
OSM Map
General Map
Google Map
MSN Map
OSM Map
General Map
Google Map
MSN Map
Please wait while loading the map...
Real estate property taxes paid for housing units in 2022:
This zip code:
0.9% ($2,237)
Pennsylvania:
1.3% ($3,094)
Median real estate property taxes paid for housing units with mortgages in 2022: $2,208 (0.9%) Median real estate property taxes paid for housing units with no mortgage in 2022: $2,281 (0.9%)
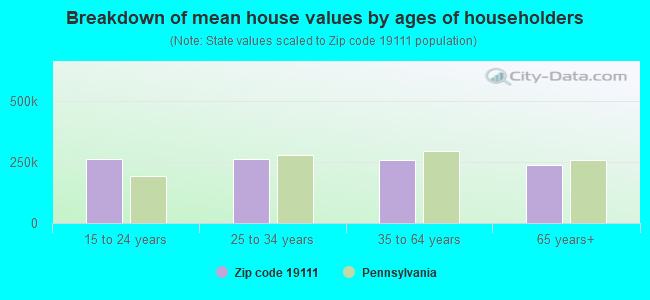
Estimated median house/condo value in 2022: $245,391
19111:
$245,391
Pennsylvania:
$245,500
According to our research of Pennsylvania and other state lists, there were 71 registered sex offenders living in 19111 zip code as of April 27, 2024. The ratio of all residents to sex offenders in zip code 19111 is 999 to 1. The ratio of registered sex offenders to all residents in this zip code is lower than the state average.
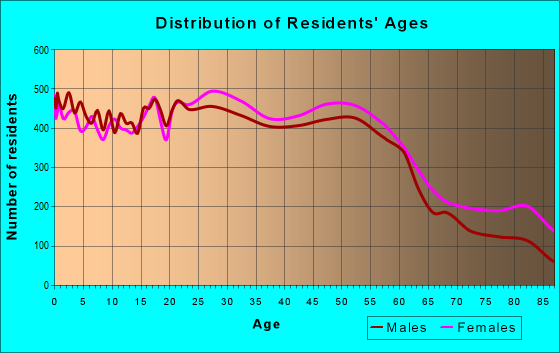
Median resident age:
This zip code:
38.3 years
Pennsylvania median age:
40.9 years
Average household size:
This zip code:
2.5 people
Pennsylvania:
2.4 people
Averages for the 2020 tax year for zip code 19111, filed in 2021:
Average Adjusted Gross Income (AGI) in 2020: $47,120 (Individual Income Tax Returns)
Here:
$47,120
State:
$75,707
Salary/wage: $44,585 (reported on 78.3% of returns)
Here:
$44,585
State:
$62,806
(% of AGI for various income ranges: 1017.5% for AGIs below $25k, 3353.4% for AGIs $25k-50k, 6455.2% for AGIs $50k-75k, 9510.5% for AGIs $75k-100k, 16896.8% for AGIs $100k-200k, 51877.3% for AGIs over 200k)
Taxable interest for individuals: $1,121 (reported on 23.5% of returns)
This zip code:
$1,121
Pennsylvania:
$1,633
(% of AGI for various income ranges: 15.9% for AGIs below $25k, 19.6% for AGIs $25k-50k, 34.6% for AGIs $50k-75k, 63.5% for AGIs $75k-100k, 137.0% for AGIs $100k-200k, 647.3% for AGIs over 200k)
Ordinary dividends: $2,995 (reported on 9.9% of returns)
Here:
$2,995
State:
$7,382
(% of AGI for various income ranges: 11.9% for AGIs below $25k, 16.6% for AGIs $25k-50k, 44.6% for AGIs $50k-75k, 56.9% for AGIs $75k-100k, 163.9% for AGIs $100k-200k, 1384.5% for AGIs over 200k)
Net capital gain/loss in AGI: +$6,329 (reported on 8.6% of returns)
Here:
+$6,329
State:
+$23,522
(% of AGI for various income ranges: 3.8% for AGIs below $25k, 15.5% for AGIs $25k-50k, 44.5% for AGIs $50k-75k, 91.2% for AGIs $75k-100k, 324.8% for AGIs $100k-200k, 5977.3% for AGIs over 200k)
Profit/loss from business: +$8,718 (reported on 17.4% of returns)
Here:
+$8,718
State:
+$16,274
(% of AGI for various income ranges: 154.6% for AGIs below $25k, 180.1% for AGIs $25k-50k, 142.0% for AGIs $50k-75k, 232.1% for AGIs $75k-100k, 472.4% for AGIs $100k-200k, 3766.4% for AGIs over 200k)
Taxable individual retirement arrangement distribution: $12,379 (reported on 6.1% of returns)
19111:
$12,379
Pennsylvania:
$18,583
(% of AGI for various income ranges: 39.8% for AGIs below $25k, 49.5% for AGIs $25k-50k, 113.5% for AGIs $50k-75k, 199.2% for AGIs $75k-100k, 430.1% for AGIs $100k-200k, 1529.1% for AGIs over 200k)
Self-employed (Keogh) retirement plans: $18,700 (reported on 0.1% of returns)
19111:
$18,700
Pennsylvania:
$25,407
(% of AGI for various income ranges: 34.0% for AGIs $100k-200k)
Total itemized deductions: $26,272 (reported on 6.2% of returns)
Here:
$26,272
State:
$34,850
(% of AGI for various income ranges: 33.7% for AGIs below $25k, 102.3% for AGIs $25k-50k, 325.7% for AGIs $50k-75k, 612.0% for AGIs $75k-100k, 834.4% for AGIs $100k-200k, 2974.5% for AGIs over 200k)
Charity contributions: $7,209 (reported on 5.1% of returns)
Here:
$7,209
State:
$12,392
(% of AGI for various income ranges: 3.1% for AGIs below $25k, 18.4% for AGIs $25k-50k, 61.9% for AGIs $50k-75k, 128.4% for AGIs $75k-100k, 228.2% for AGIs $100k-200k, 1111.8% for AGIs over 200k)
Taxes paid: $7,845 (reported on 6.1% of returns)
19111:
$7,845
State:
$8,200
(% of AGI for various income ranges: 5.4% for AGIs below $25k, 24.3% for AGIs $25k-50k, 93.6% for AGIs $50k-75k, 213.3% for AGIs $75k-100k, 270.0% for AGIs $100k-200k, 734.5% for AGIs over 200k)
Earned income credit: $2,309 (reported on 21.4% of returns)
Here:
$2,309
State:
$2,100
(% of AGI for various income ranges: 113.6% for AGIs below $25k, 85.5% for AGIs $25k-50k, 1.2% for AGIs $50k-75k)
Percentage of individuals using paid preparers for their 2020 taxes: 91.4%
Here:
91%
State:
92%
(% for various income ranges: 90.3% for AGIs below $25k, 93.1% for AGIs $25k-50k, 92.2% for AGIs $50k-75k, 90.5% for AGIs $75k-100k, 89.7% for AGIs $100k-200k, 93.9% for AGIs over 200k)
Averages for the 2012 tax year for zip code 19111, filed in 2013:
Average Adjusted Gross Income (AGI) in 2012: $40,784 (Individual Income Tax Returns)
Here:
$40,784
State:
$61,346
Salary/wage: $39,563 (reported on 81.9% of returns)
Here:
$39,563
State:
$51,902
(% of AGI for various income ranges: 68.0% for AGIs below $25k, 81.8% for AGIs $25k-50k, 82.4% for AGIs $50k-75k, 82.0% for AGIs $75k-100k, 82.8% for AGIs $100k-200k, 52.9% for AGIs over 200k)
Taxable interest for individuals: $1,141 (reported on 28.2% of returns)
This zip code:
$1,141
Pennsylvania:
$1,588
(% of AGI for various income ranges: 1.4% for AGIs below $25k, 0.7% for AGIs $25k-50k, 0.6% for AGIs $50k-75k, 0.8% for AGIs $75k-100k, 0.7% for AGIs $100k-200k, 0.9% for AGIs over 200k)
Ordinary dividends: $2,845 (reported on 12.7% of returns)
Here:
$2,845
State:
$5,827
(% of AGI for various income ranges: 1.2% for AGIs below $25k, 0.7% for AGIs $25k-50k, 0.7% for AGIs $50k-75k, 0.8% for AGIs $75k-100k, 0.8% for AGIs $100k-200k, 3.7% for AGIs over 200k)
Net capital gain/loss in AGI: +$1,673 (reported on 8.3% of returns)
Here:
+$1,673
State:
+$14,495
(% of AGI for various income ranges: 0.2% for AGIs $50k-75k, 0.2% for AGIs $75k-100k, 0.9% for AGIs $100k-200k, 2.5% for AGIs over 200k)
Profit/loss from business: +$10,454 (reported on 12.0% of returns)
Here:
+$10,454
State:
+$16,268
(% of AGI for various income ranges: 11.3% for AGIs below $25k, 2.8% for AGIs $25k-50k, 1.6% for AGIs $50k-75k, 1.0% for AGIs $75k-100k, 1.9% for AGIs $100k-200k)
Taxable individual retirement arrangement distribution: $9,544 (reported on 8.6% of returns)
19111:
$9,544
Pennsylvania:
$14,550
(% of AGI for various income ranges: 2.8% for AGIs below $25k, 1.7% for AGIs $25k-50k, 1.8% for AGIs $50k-75k, 1.8% for AGIs $75k-100k, 2.0% for AGIs $100k-200k, 4.6% for AGIs over 200k)
Self-employment retirement plans: $12,050 (reported on 0.1% of returns)
19111:
$12,050
Pennsylvania:
$20,922
Total itemized deductions: $17,972 (25% of AGI, reported on 31.1% of returns)
Here:
$17,972
State:
$23,538
Here:
25.1% of AGI
State:
18.4% of AGI
(% of AGI for various income ranges: 8.2% for AGIs below $25k, 11.9% for AGIs $25k-50k, 14.9% for AGIs $50k-75k, 16.3% for AGIs $75k-100k, 16.0% for AGIs $100k-200k, 13.7% for AGIs over 200k)
Charity contributions: $2,549 (reported on 25.3% of returns)
Here:
$2,549
State:
$4,025
(% of AGI for various income ranges: 0.6% for AGIs below $25k, 1.3% for AGIs $25k-50k, 1.8% for AGIs $50k-75k, 1.9% for AGIs $75k-100k, 2.0% for AGIs $100k-200k, 2.1% for AGIs over 200k)
Taxes paid: $6,922 (reported on 31.0% of returns)
19111:
$6,922
State:
$9,982
(% of AGI for various income ranges: 1.8% for AGIs below $25k, 3.8% for AGIs $25k-50k, 5.4% for AGIs $50k-75k, 6.9% for AGIs $75k-100k, 7.7% for AGIs $100k-200k, 5.5% for AGIs over 200k)
Earned income credit: $2,322 (reported on 24.2% of returns)
Here:
$2,322
State:
$2,106
(% of AGI for various income ranges: 8.0% for AGIs below $25k, 1.3% for AGIs $25k-50k)
Percentage of individuals using paid preparers for their 2012 taxes: 54.9%
Here:
55%
State:
53%
(% for various income ranges: 54.8% for AGIs below $25k, 53.6% for AGIs $25k-50k, 55.2% for AGIs $50k-75k, 55.7% for AGIs $75k-100k, 58.8% for AGIs $100k-200k, 63.6% for AGIs over 200k)
Averages for the 2004 tax year for zip code 19111, filed in 2005:
Average Adjusted Gross Income (AGI) in 2004: $37,211 (Individual Income Tax Returns)
Here:
$37,211
State:
$48,049
Salary/wage: $36,974 (reported on 81.1% of returns)
Here:
$36,974
State:
$42,646
(% of AGI for various income ranges: 69.7% for AGIs below $10k, 69.6% for AGIs $10k-25k, 83.9% for AGIs $25k-50k, 84.5% for AGIs $50k-75k, 86.2% for AGIs $75k-100k, 73.7% for AGIs over 100k)
Taxable interest for individuals: $1,749 (reported on 48.1% of returns)
This zip code:
$1,749
Pennsylvania:
$1,657
(% of AGI for various income ranges: 7.6% for AGIs below $10k, 4.4% for AGIs $10k-25k, 2.2% for AGIs $25k-50k, 1.7% for AGIs $50k-75k, 1.5% for AGIs $75k-100k, 1.8% for AGIs over 100k)
Taxable dividends: $1,990 (reported on 19.7% of returns)
Here:
$1,990
State:
$3,566
(% of AGI for various income ranges: 3.2% for AGIs below $10k, 1.6% for AGIs $10k-25k, 0.9% for AGIs $25k-50k, 1.0% for AGIs $50k-75k, 0.7% for AGIs $75k-100k, 1.1% for AGIs over 100k)
Net capital gain/loss: +$4,681 (reported on 13.3% of returns)
Here:
+$4,681
State:
+$9,716
(% of AGI for various income ranges: -1.4% for AGIs below $10k, 0.2% for AGIs $10k-25k, 0.1% for AGIs $25k-50k, 0.6% for AGIs $50k-75k, 0.7% for AGIs $75k-100k, 7.8% for AGIs over 100k)
Profit/loss from business: +$8,660 (reported on 9.9% of returns)
Here:
+$8,660
State:
+$14,267
(% of AGI for various income ranges: 9.4% for AGIs below $10k, 5.9% for AGIs $10k-25k, 1.9% for AGIs $25k-50k, 1.2% for AGIs $50k-75k, 1.4% for AGIs $75k-100k, 2.0% for AGIs over 100k)
IRA payment deduction: $2,750 (reported on 2.5% of returns)
19111:
$2,750
Pennsylvania:
$2,903
(% of AGI for various income ranges: 0.2% for AGIs below $10k, 0.3% for AGIs $10k-25k, 0.3% for AGIs $25k-50k, 0.2% for AGIs $50k-75k, 0.1% for AGIs $75k-100k, 0.1% for AGIs over 100k)
Self-employed pension: $7,783 (reported on 0.2% of returns)
Here:
$7,783
Pennsylvania:
$14,674
(% of AGI for various income ranges: 0.0% for AGIs $25k-50k, 0.0% for AGIs $50k-75k, 0.0% for AGIs $75k-100k, 0.2% for AGIs over 100k)
Total itemized deductions: $15,520 (25% of AGI, reported on 35.6% of returns)
Here:
$15,520
State:
$18,804
Here:
24.6% of AGI
State:
19.5% of AGI
(% of AGI for various income ranges: 8.1% for AGIs below $10k, 8.3% for AGIs $10k-25k, 14.1% for AGIs $25k-50k, 17.2% for AGIs $50k-75k, 17.8% for AGIs $75k-100k, 15.4% for AGIs over 100k)
Charity contributions deductions: $2,417 (4% of AGI, reported on 32.4% of returns)
Here:
$2,417
State:
$3,337
Here:
3.7% of AGI
State:
3.3% of AGI
(% of AGI for various income ranges: 0.5% for AGIs below $10k, 1.0% for AGIs $10k-25k, 1.9% for AGIs $25k-50k, 2.5% for AGIs $50k-75k, 2.5% for AGIs $75k-100k, 2.3% for AGIs over 100k)
Total tax: $4,477 (reported on 73.2% of returns)
19111:
$4,477
State:
$8,008
(% of AGI for various income ranges: 2.7% for AGIs below $10k, 4.0% for AGIs $10k-25k, 6.7% for AGIs $25k-50k, 8.9% for AGIs $50k-75k, 9.6% for AGIs $75k-100k, 15.1% for AGIs over 100k)
Earned income credit: $1,709 (reported on 15.8% of returns)
Here:
$1,709
State:
$1,643
Percentage of individuals using paid preparers for their 2004 taxes: 54.7%
Here:
55%
State:
56%
(% for various income ranges: 49.3% for AGIs below $10k, 58.1% for AGIs $10k-25k, 53.6% for AGIs $25k-50k, 56.4% for AGIs $50k-75k, 54.1% for AGIs $75k-100k, 62.1% for AGIs over 100k)
Likely homosexual households (counted as self-reported same-sex unmarried-partner households)
Lesbian couples: 0.1% of all households
Gay men: 0.0% of all households
Household received Food Stamps/SNAP in the past 12 months: 6,587 Household did not receive Food Stamps/SNAP in the past 12 months: 20,027
Women who had a birth in the past 12 months: 913 (632 now married, 275 unmarried) Women who did not have a birth in the past 12 months: 15,157 (5,506 now married, 9,668 unmarried)
Housing units in zip code 19111 with a mortgage: 9,079 (718 second mortgage, 498 both second mortgage and home equity loan) Houses without a mortgage: 328
Median monthly owner costs for units with a mortgage: $1,446 Median monthly owner costs for units without a mortgage: $567
Residents with income below the poverty level in 2022:
This zip code:
15.6%
Whole state:
11.8%
Residents with income below 50% of the poverty level in 2022:
This zip code:
10.0%
Whole state:
6.1%
Median number of rooms in houses and condos:
Here:
6.3
State:
6.8
Median number of rooms in apartments:
Here:
4.0
State:
4.3
Notable locations in this zip code not listed on our city pages
Notable locations in zip code 19111: Jordan Recreation Center (A), Ryers Station (B), Cheltenham Station (C), Lawndale Station (D), Lawn Crest Recreation Center (E), Fox Chase Library (F), Jardel Community Center (G), Lawncrest Branch Library Free Library of Philadelphia (H), Philadelphia Fire Department Engine 56 (I), Philadelphia Fire Department Engine 64 (J), Philadelphia Fire Department Engine 71 (K), Robert W Ryers Library and Museum (L). Display/hide their locations on the map
Churches in zip code 19111 include: Oxford Church (A), Saint Aiden Episcopal Church (B), Friends Meetinghouse Church (C). Display/hide their locations on the map
Parks in zip code 19111 include: Fox Chase Playground (1), Burholme Park (2), Lawncrest Playground (3), Barnes and Loney Park (4), Jardel Playground (5), Tarken Playground (6). Display/hide their locations on the map
8,161 married couples with children.
6,255 single-parent households (1,037 men, 5,218 women).
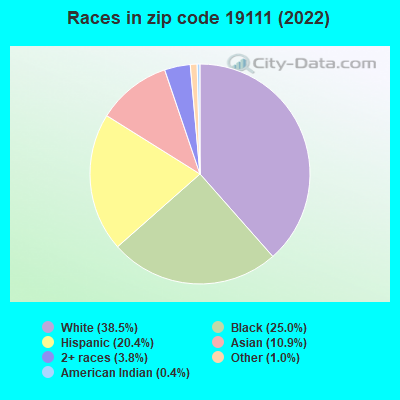
62.6% of residents of 19111 zip code speak English at home.
15.0% of residents speak Spanish at home (54% very well, 16% well, 19% not well, 11% not at all).
12.2% of residents speak other Indo-European language at home (47% very well, 23% well, 18% not well, 12% not at all).
7.3% of residents speak Asian or Pacific Island language at home (33% very well, 26% well, 33% not well, 8% not at all).
4.4% of residents speak other language at home (58% very well, 33% well, 9% not well).
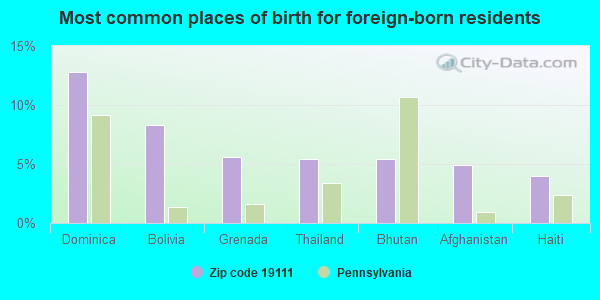
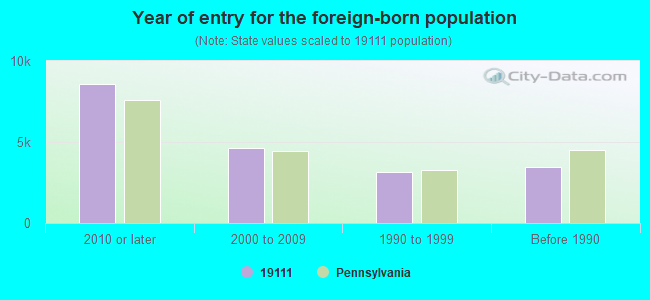
Foreign born population: 17,611 (26.3%) (56.7% of them are naturalized citizens)
Facilities with environmental interests located in this zip code:
AETNA ELECTROPLATING (7770 DUNGAN RD in PHILADELPHIA, PA)
STATE MASTER (Pennsylvania database) - RCRIS-PAD002301745, HAZARDOUS WASTE PROGRAM (Resource Conservation and Recovery Act (tracking hazardous waste)) Business SIC and NAICS classification: ELECTROPLATING, PLATING, POLISHING, ANODIZING, AND COLORING Organizations: OPERNAME (CONTACT/OPERATOR)
, FARREN, ROBERT L PRESIDENT (CONTACT/OWNER)
ANY GARMENT CLNR (7350 OXFORD AVE in PHILADELPHIA, PA)
STATE MASTER (Pennsylvania database) - RCRIS-PAR000505834, HAZARDOUS WASTE PROGRAM Small Quantity Generators, between 100 kg and 1000 kg of hazardous waste/month (Resource Conservation and Recovery Act (tracking hazardous waste)) - notification Organizations: AGUIRRE, RUBEN (CONTACT/OWNER)
AVERY DENNISON CORPORATION (7722 DUNGAN ROAD in PHILADELPHIA, PA)
AIR SYNTHETIC MINOR (AIRS/AFS) CRITERIA AND HAZARDOUS AIR POLLUTANT INVENTORY (Inventory of air pollution sources) Small Quantity Generators, between 100 kg and 1000 kg of hazardous waste/month (Resource Conservation and Recovery Act (tracking hazardous waste)) - notification TRI REPORTER (Tracking of toxic chemicals releasing facilities) Business SIC classification: COMMERCIAL PRINTING Business NAICS classification: COMMERCIAL FLEXOGRAPHIC PRINTING. Organizations: OPERNAME (CONTACT/OPERATOR)
, MUTUAL PHARMACEUTICAL CO INC (CONTACT/OPERATOR)
, DUNGAN MUTUAL ASSOCIATION LLC (CONTACT/OWNER)
Alternative names: AVERY DENNISON, PHILA PLANT, AVERY DENNISON SOABAR SYS, AVERY SOABAR PRODS. GROUP
7 ELEVEN 23031 (6822 CASTOR AVE in PHILADELPHIA, PA)
(Resource Conservation and Recovery Act (tracking hazardous waste)) Organizations: OPERNAME (CONTACT/OPERATOR)
, SOUTHLAND CORPORATION THE (CONTACT/OWNER)
AMERICAN ONCOLOGIC HOSPITAL - FCCC (CENTRAL AVENUE AT SHELMIRE AVENUE in PHILADELPHIA, PA)
AL JRS AUTO BODY (509 KNORR ST in PHILADELPHIA, PA)
Conditionally Exempt Small Quantity Generators, less than 100 kg/month of hazardous waste (Resource Conservation and Recovery Act (tracking hazardous waste)) Organizations: ALFIE NATALE (CONTACT/OPERATOR)
, SINJH KJ (CONTACT/OWNER)
, DIEGO MORALES (CONTACT/OWNER)
Alternative names: MAACO AUTO PAINTING, MAACO auto PAINTING & bodywork
ALLEN TIRE & SRVC CO (6301 RISING SUN AVE in PHILADELPHIA, PA)
Small Quantity Generators, between 100 kg and 1000 kg of hazardous waste/month (Resource Conservation and Recovery Act (tracking hazardous waste)) - notification Organizations: OPERNAME (CONTACT/OPERATOR)
, MYERS CRAIG (CONTACT/OWNER)
AUTO CENTER (7990 ROCKWELL AVENUE in PHILADELPHIA, PA)
Small Quantity Generators, between 100 kg and 1000 kg of hazardous waste/month (Resource Conservation and Recovery Act (tracking hazardous waste)) - notification Organizations: NATALE AL (CONTACT/OWNER)
, RICHMOND BEN (CONTACT/OWNER)
BILL ANGELONIS (6011 RISING SUN AVENUE in PHILADELPHIA, PA)
Small Quantity Generators, between 100 kg and 1000 kg of hazardous waste/month (Resource Conservation and Recovery Act (tracking hazardous waste)) - notification Organizations: OPERNAME (CONTACT/OPERATOR)
, ANGELONI, BILL JR (CONTACT/OWNER)
Alternative names: ANGELONIS, BILL
AL JRS AUTO BODY (7676 ROCKWELL AVENUE in PHILADELPHIA, PA)
Small Quantity Generators, between 100 kg and 1000 kg of hazardous waste/month (Resource Conservation and Recovery Act (tracking hazardous waste)) - notification Organizations: NATALE ALFIE (CONTACT/OWNER)
Housing units lacking complete plumbing facilities: 1.5% Housing units lacking complete kitchen facilities: 1.3%
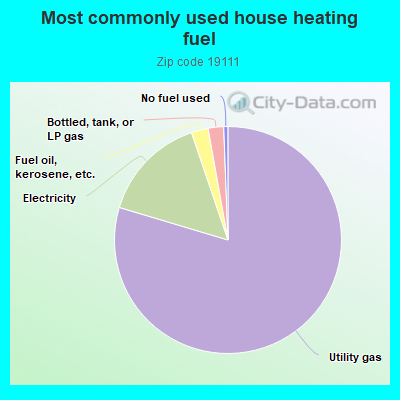
79.4%Utility gas
15.1%Electricity
2.4%Fuel oil, kerosene, etc.
2.2%Bottled, tank, or LP gas
0.6%No fuel used
Population in 1990: 61,416.
Place of birth for U.S.-born residents:
This state: 40,804
Northeast: 4,255
Midwest: 592
South: 1,806
West: 240
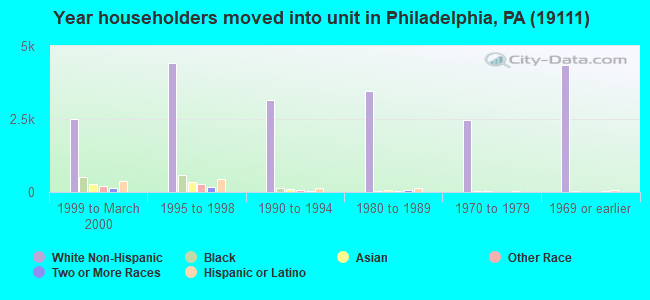
65% of the 19111 zip code residents lived in the same house 5 years ago. Out of people who lived in different houses, 81% lived in this county. Out of people who lived in different counties, 50% lived in Pennsylvania.
90% of the 19111 zip code residents lived in the same house 1 year ago. Out of people who lived in different houses, 63% moved from this county. Out of people who lived in different houses, 18% moved from different county within same state. Out of people who lived in different houses, 3% moved from different state. Out of people who lived in different houses, 17% moved from abroad.
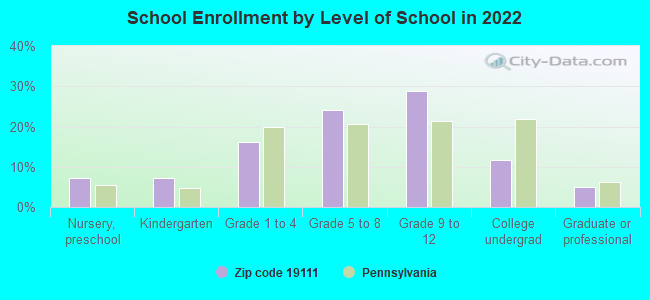
Private vs. public school enrollment:
Students in private schools in grades 1 to 8 (elementary and middle school): 1,409
Here:
21.0%
Pennsylvania:
15.7%
Students in private schools in grades 9 to 12 (high school): 1,094
Here:
22.8%
Pennsylvania:
13.4%
Students in private undergraduate colleges: 642
Here:
33.4%
Pennsylvania:
39.8%
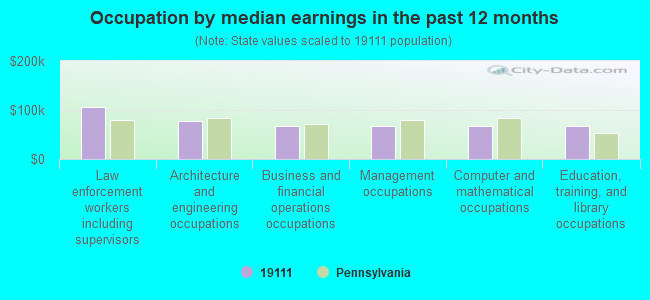
Occupation by median earnings in the past 12 months ($)
105,150Law enforcement workers including supervisors
77,177Architecture and engineering occupations
67,907Business and financial operations occupations
66,949Management occupations
66,812Computer and mathematical occupations
66,676Education, training, and library occupations
Companies with federal contracts located in this zip code (PHILADELPHIA, PA):
DEFENSE LOGISTICS AGENCY (700 ROBBINS AVE) : $53,213,385 in 696 contractsfrom 2001 to 2006
Contracts for Composite Food Packages, Trash/Garbage Collection Services - Including Portable Sanitation Services, X-Ray Equipment and Supplies: Medical, Dental, Veterinary, Medical and Surgical Instruments, Equipment, and Supplies, and moreby Federal Supply Service, Immigration and Naturalization Service, Department of Veterans Affairs, Public Health Service, and others Signed by year:2000: $0; 2001: $302,000; 2002: $3,186,693; 2003: $4,824,415; 2004: $4,826,315; 2005: $32,811,006; 2006: $7,262,956.
Biggest contracts:
$25,000,000 with Federal Supply Service for Composite Food Packages. Signed on 2005-09-03. Completion date: 2005-09-03.
$1,320,000 with Immigration and Naturalization Service for Trash/Garbage Collection Services - Including Portable Sanitation Services. Taking place in TX. Signed on 2002-10-15. Completion date: 2003-03-15.
$749,278 with Department of Veterans Affairs for X-Ray Equipment and Supplies: Medical, Dental, Veterinary. Signed on 2005-09-29. Completion date: 2006-06-15.
$719,065, same as above.Signed on 2005-09-29. Completion date: 2006-06-15.
U S DEPARTMENT OF DEFENSE (700 ROBBINS AVE BLDG 4D) : $20,118,656 in 499 contractsfrom 2002 to 2006
Contracts for Maintenance, Repair and Rebuilding of Equipment -- Automatic Data Processing Equipment (Including Firmware), Software, Supplies and Support Equipment, Lease or Rental of Equipment -- Office Machines, Text Processing Systems and Visible Record Equipment, Lease or Rental of Equipment -- Special Industry Machinery, Office Devices and Accessories, and moreby Defense Logistics Agency, Army Signed by year:2000: $0; 2001: $0; 2002: $64,046; 2003: $0; 2004: $18,706,598; 2005: $1,300,691; 2006: $47,321.
Biggest contracts:
$1,496,701 with Defense Logistics Agency for Maintenance, Repair and Rebuilding of Equipment -- Automatic Data Processing Equipment (Including Firmware), Software, Supplies and Support Equipment. Taking place in WA. Signed on 2004-10-01. Completion date: 2005-09-30.
$1,391,840 with Defense Logistics Agency for Lease or Rental of Equipment -- Office Machines, Text Processing Systems and Visible Record Equipment. Taking place in DC. Signed on 2004-10-01. Completion date: 2005-09-30.
$1,010,381, same as above.Signed on 2004-10-01. Completion date: 2005-09-30.
$772,982 with Defense Logistics Agency for Maintenance, Repair and Rebuilding of Equipment -- Automatic Data Processing Equipment (Including Firmware), Software, Supplies and Support Equipment. Taking place in WA. Signed on 2004-10-01. Completion date: 2005-09-30.
ARMY, UNITED STATES DEPARTMENT (700 ROBBINS ST) : $972,375 in 7 contractsfrom 1999 to 2000
Contracts for Other Photographic, Mapping, Printing, and Publication Services by Department of Defense Signed by year:2000: $689,061; 2001: $0; 2002: $0; 2003: $0; 2004: $0; 2005: $0; 2006: $0.
Biggest contracts:
$493,014 with Department of Defense for Other Photographic, Mapping, Printing, and Publication Services. Taking place in OH. Signed on 2000-10-02. Completion date: 2001-09-28.
$127,408, same as above.Signed on 1999-12-21. Completion date: 2000-07-31.
$107,101, same as above.Signed on 2000-01-27. Completion date: 2000-09-30.
$88,946, same as above.Signed on 2000-05-09. Completion date: 2000-09-30.
DELEO, COLLEN (700 ROBBINS ST; small business)
$78,225 with Navy for Miscellaneous Office Machines. Signed on 2005-07-01. Completion date: 2005-08-10.
MELROM (321 BORBECK AVE) : $69,506 in 4 contractsfrom 2001 to 2003
$53,000 with Department of State for ADP Supplies. Signed on 2001-09-15. Completion date: 2002-03-15.
$10,776 with Army for ADPE System Configuration. Taking place in RI. Signed on 2002-09-27. Completion date: 2002-12-19.
$2,896 with Army for ADP Components. Signed on 2003-01-15. Completion date: 2003-01-15.
$2,834 with Army for ADPE System Configuration. Taking place in RI. Signed on 2002-09-17. Completion date: 2002-12-19.
PRECISION OPTICAL MACHINE COMP (7806 ROCKWELL AVE; small business) : $7,293 in 2 contractsin 2005
$6,944 with Army for Ophthalmic Instruments, Equipment, and Supplies. Signed on 2005-07-20. Completion date: 2005-05-06.
$349 with Department of Veterans Affairs for Medical and Surgical Instruments, Equipment, and Supplies. Taking place in VA. Signed on 2005-07-01. Completion date: 2005-07-31.
BEST DOORS (1105 COTTMAN AVE; small business)
$6,150 with Navy for Maintenance, Repair or Alteration of Real Property -- Family Housing Facilities. Signed on 2004-07-28. Completion date: 2004-09-12.
EVELYNN L KRATZ (1325 WELLS ST; small business)
$3,724 with Defense Logistics Agency for Chain and Wire Rope. Taking place in TX. Signed on 2004-12-08. Completion date: 2005-03-09.
DELTRON ELECTRIC CORPORATION (1146 PASSMORE ST.; small business)
$2,550 with Navy for Construction of Structures and Facilities -- Other Non-Building Facilities. Signed on 2000-03-28. Completion date: 2000-05-12.
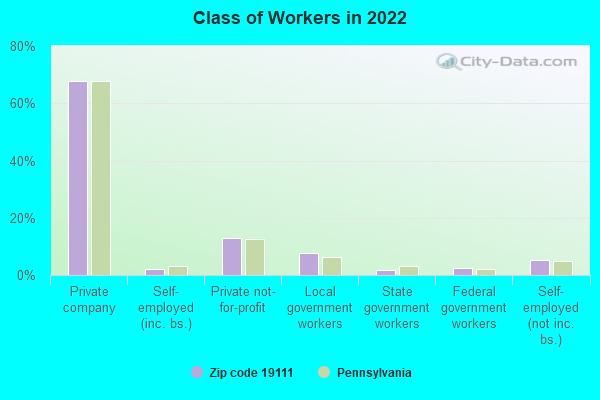
Top industries in this zip code by the number of employees in 2005:
Health Care and Social Assistance: Home Health Care Services (over 1000 employees: 1 establishment, 10-19 employees: 1 establishment, 1-4 employees: 2 establishments)
Health Care and Social Assistance: General Medical and Surgical Hospitals (over 1000: 1, 10-19: 1)
Professional, Scientific, and Technical Services: Research and Development in the Physical, Engineering, and Life Sciences (500-999: 1, 250-499: 1)
Health Care and Social Assistance: Specialty (except Psychiatric and Substance Abuse) Hospitals (500-999: 1, 100-249: 1)
Health Care and Social Assistance: Nursing Care Facilities (250-499: 1, 50-99: 1, 1-4: 3)
Health Care and Social Assistance: Offices of Physicians (except Mental Health Specialists) (100-249: 1, 50-99: 1, 10-19: 8, 5-9: 5, 1-4: 22)
Health Care and Social Assistance: Continuing Care Retirement Communities (250-499: 1, 20-49: 1)
Other Services (except Public Administration): Funeral Homes and Funeral Services (100-249: 2, 10-19: 1, 1-4: 2)
2007 - 2018 National Fire Incident Reporting System (NFIRS) incidents
According to the data from the years 2007 - 2018 the average number of fire incidents per year is 121. The highest number of reported fires - 294 took place in 2010, and the least - 0 in 2008. The data has a growing trend.
When looking into fire subcategories, the most reports belonged to: Structure Fires (47.2%), and Outside Fires (37.5%).
Fire incident types reported to NFIRS in Zip Code 19111
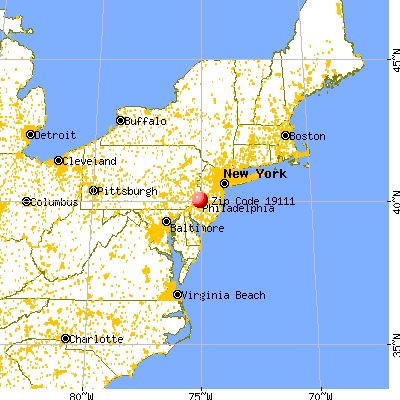


 Nearest zip codes: 19012, 19149, 19152, 19124, 19027, 19120.
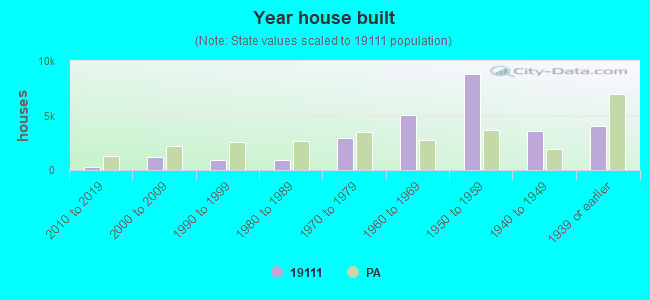


 According to the data from the years 2007 - 2018 the average number of fire incidents per year is 121. The highest number of reported fires - 294 took place in 2010, and the least - 0 in 2008. The data has a growing trend.
 When looking into fire subcategories, the most reports belonged to: Structure Fires (47.2%), and Outside Fires (37.5%).