Estimated zip code population in 2022: 58,663
Zip code population in 2010: 55,006
Zip code population in 2000: 48,483
Houses and condos: 20,919
Renter-occupied apartments: 8,870
% of renters here:
45%State:
31%
March 2022 cost of living index in zip code 19149: 104.2
(near average, U.S. average is 100)
Land area: 2.4
sq. mi.
Water area: 0.0
sq. mi.
Population density: 24,154 people per square mile (very high).
OSM Map
General Map
Google Map
MSN Map
OSM Map
General Map
Google Map
MSN Map
OSM Map
General Map
Google Map
MSN Map
OSM Map
General Map
Google Map
MSN Map
Please wait while loading the map...
Real estate property taxes paid for housing units in 2022:
This zip code:
0.9% ($1,633)Pennsylvania:
1.3% ($3,094)
Median real estate property taxes paid for housing units with mortgages in 2022: $1,631 (0.9%)
Median real estate property taxes paid for housing units with no mortgage in 2022: $1,638 (0.8%)
Profiles of local businesses
Business Search - 14 Million verified businesses
Males: 29,345 Females: 29,317
For population 25 years and over in 19149:
High school or higher: 76.0%Bachelor's degree or higher: 15.5%Graduate or professional degree: 5.5%Unemployed: 8.6%Mean travel time to work (commute): 35.6 minutes
For population 15 years and over in 19149:
Never married: 43.3%Now married: 41.0%Separated: 3.4%Widowed: 4.5%Divorced: 7.8%
Zip code 19149 compared to state average:
Unemployed percentage above state average. Black race population percentage above state average. Hispanic race population percentage significantly above state average. Median age below state average. Foreign-born population percentage significantly above state average. Length of stay since moving in above state average. Percentage of population with a bachelor's degree or higher significantly below state average. 17,414 29.7% Hispanic or Latino 14,948 25.5% White 11,245 19.2% Black 10,856 18.5% Asian 2,887 4.9% Two or more races 1,300 2.2% Some other race 10 0.02% American Indian
Data:
Median household income ($)
Median household income (% change since 2000)
Household income diversity
Ratio of average income to average house value (%)
Ratio of average income to average rent
Median household income ($) - White
Median household income ($) - Black or African American
Median household income ($) - Asian
Median household income ($) - Hispanic or Latino
Median household income ($) - American Indian and Alaska Native
Median household income ($) - Multirace
Median household income ($) - Other Race
Median household income for houses/condos with a mortgage ($)
Median household income for apartments without a mortgage ($)
Races - White alone (%)
Races - White alone (% change since 2000)
Races - Black alone (%)
Races - Black alone (% change since 2000)
Races - American Indian alone (%)
Races - American Indian alone (% change since 2000)
Races - Asian alone (%)
Races - Asian alone (% change since 2000)
Races - Hispanic (%)
Races - Hispanic (% change since 2000)
Races - Native Hawaiian and Other Pacific Islander alone (%)
Races - Native Hawaiian and Other Pacific Islander alone (% change since 2000)
Races - Two or more races (%)
Races - Two or more races (% change since 2000)
Races - Other race alone (%)
Races - Other race alone (% change since 2000)
Racial diversity
Unemployment (%)
Unemployment (% change since 2000)
Unemployment (%) - White
Unemployment (%) - Black or African American
Unemployment (%) - Asian
Unemployment (%) - Hispanic or Latino
Unemployment (%) - American Indian and Alaska Native
Unemployment (%) - Multirace
Unemployment (%) - Other Race
Population density (people per square mile)
Population - Males (%)
Population - Females (%)
Population - Males (%) - White
Population - Males (%) - Black or African American
Population - Males (%) - Asian
Population - Males (%) - Hispanic or Latino
Population - Males (%) - American Indian and Alaska Native
Population - Males (%) - Multirace
Population - Males (%) - Other Race
Population - Females (%) - White
Population - Females (%) - Black or African American
Population - Females (%) - Asian
Population - Females (%) - Hispanic or Latino
Population - Females (%) - American Indian and Alaska Native
Population - Females (%) - Multirace
Population - Females (%) - Other Race
Coronavirus confirmed cases (Apr 27, 2024)
Deaths caused by coronavirus (Apr 27, 2024)
Coronavirus confirmed cases (per 100k population) (Apr 27, 2024)
Deaths caused by coronavirus (per 100k population) (Apr 27, 2024)
Daily increase in number of cases (Apr 27, 2024)
Weekly increase in number of cases (Apr 27, 2024)
Cases doubled (in days) (Apr 27, 2024)
Hospitalized patients (Apr 18, 2022)
Negative test results (Apr 18, 2022)
Total test results (Apr 18, 2022)
COVID Vaccine doses distributed (per 100k population) (Sep 19, 2023)
COVID Vaccine doses administered (per 100k population) (Sep 19, 2023)
COVID Vaccine doses distributed (Sep 19, 2023)
COVID Vaccine doses administered (Sep 19, 2023)
Likely homosexual households (%)
Likely homosexual households (% change since 2000)
Likely homosexual households - Lesbian couples (%)
Likely homosexual households - Lesbian couples (% change since 2000)
Likely homosexual households - Gay men (%)
Likely homosexual households - Gay men (% change since 2000)
Cost of living index
Median gross rent ($)
Median contract rent ($)
Median monthly housing costs ($)
Median house or condo value ($)
Median house or condo value ($ change since 2000)
Mean house or condo value by units in structure - 1, detached ($)
Mean house or condo value by units in structure - 1, attached ($)
Mean house or condo value by units in structure - 2 ($)
Mean house or condo value by units in structure by units in structure - 3 or 4 ($)
Mean house or condo value by units in structure - 5 or more ($)
Mean house or condo value by units in structure - Boat, RV, van, etc. ($)
Mean house or condo value by units in structure - Mobile home ($)
Median house or condo value ($) - White
Median house or condo value ($) - Black or African American
Median house or condo value ($) - Asian
Median house or condo value ($) - Hispanic or Latino
Median house or condo value ($) - American Indian and Alaska Native
Median house or condo value ($) - Multirace
Median house or condo value ($) - Other Race
Median resident age
Resident age diversity
Median resident age - Males
Median resident age - Females
Median resident age - White
Median resident age - Black or African American
Median resident age - Asian
Median resident age - Hispanic or Latino
Median resident age - American Indian and Alaska Native
Median resident age - Multirace
Median resident age - Other Race
Median resident age - Males - White
Median resident age - Males - Black or African American
Median resident age - Males - Asian
Median resident age - Males - Hispanic or Latino
Median resident age - Males - American Indian and Alaska Native
Median resident age - Males - Multirace
Median resident age - Males - Other Race
Median resident age - Females - White
Median resident age - Females - Black or African American
Median resident age - Females - Asian
Median resident age - Females - Hispanic or Latino
Median resident age - Females - American Indian and Alaska Native
Median resident age - Females - Multirace
Median resident age - Females - Other Race
Commute - mean travel time to work (minutes)
Travel time to work - Less than 5 minutes (%)
Travel time to work - Less than 5 minutes (% change since 2000)
Travel time to work - 5 to 9 minutes (%)
Travel time to work - 5 to 9 minutes (% change since 2000)
Travel time to work - 10 to 19 minutes (%)
Travel time to work - 10 to 19 minutes (% change since 2000)
Travel time to work - 20 to 29 minutes (%)
Travel time to work - 20 to 29 minutes (% change since 2000)
Travel time to work - 30 to 39 minutes (%)
Travel time to work - 30 to 39 minutes (% change since 2000)
Travel time to work - 40 to 59 minutes (%)
Travel time to work - 40 to 59 minutes (% change since 2000)
Travel time to work - 60 to 89 minutes (%)
Travel time to work - 60 to 89 minutes (% change since 2000)
Travel time to work - 90 or more minutes (%)
Travel time to work - 90 or more minutes (% change since 2000)
Marital status - Never married (%)
Marital status - Now married (%)
Marital status - Separated (%)
Marital status - Widowed (%)
Marital status - Divorced (%)
Median family income ($)
Median family income (% change since 2000)
Median non-family income ($)
Median non-family income (% change since 2000)
Median per capita income ($)
Median per capita income (% change since 2000)
Median family income ($) - White
Median family income ($) - Black or African American
Median family income ($) - Asian
Median family income ($) - Hispanic or Latino
Median family income ($) - American Indian and Alaska Native
Median family income ($) - Multirace
Median family income ($) - Other Race
Median year house/condo built
Median year apartment built
Year house built - Built 2005 or later (%)
Year house built - Built 2000 to 2004 (%)
Year house built - Built 1990 to 1999 (%)
Year house built - Built 1980 to 1989 (%)
Year house built - Built 1970 to 1979 (%)
Year house built - Built 1960 to 1969 (%)
Year house built - Built 1950 to 1959 (%)
Year house built - Built 1940 to 1949 (%)
Year house built - Built 1939 or earlier (%)
Average household size
Household density (households per square mile)
Average household size - White
Average household size - Black or African American
Average household size - Asian
Average household size - Hispanic or Latino
Average household size - American Indian and Alaska Native
Average household size - Multirace
Average household size - Other Race
Occupied housing units (%)
Vacant housing units (%)
Owner occupied housing units (%)
Renter occupied housing units (%)
Vacancy status - For rent (%)
Vacancy status - For sale only (%)
Vacancy status - Rented or sold, not occupied (%)
Vacancy status - For seasonal, recreational, or occasional use (%)
Vacancy status - For migrant workers (%)
Vacancy status - Other vacant (%)
Residents with income below the poverty level (%)
Residents with income below 50% of the poverty level (%)
Children below poverty level (%)
Poor families by family type - Married-couple family (%)
Poor families by family type - Male, no wife present (%)
Poor families by family type - Female, no husband present (%)
Poverty status for native-born residents (%)
Poverty status for foreign-born residents (%)
Poverty among high school graduates not in families (%)
Poverty among people who did not graduate high school not in families (%)
Residents with income below the poverty level (%) - White
Residents with income below the poverty level (%) - Black or African American
Residents with income below the poverty level (%) - Asian
Residents with income below the poverty level (%) - Hispanic or Latino
Residents with income below the poverty level (%) - American Indian and Alaska Native
Residents with income below the poverty level (%) - Multirace
Residents with income below the poverty level (%) - Other Race
Air pollution - Air Quality Index (AQI)
Air pollution - CO
Air pollution - NO2
Air pollution - SO2
Air pollution - Ozone
Air pollution - PM10
Air pollution - PM25
Air pollution - Pb
Crime - Murders per 100,000 population
Crime - Rapes per 100,000 population
Crime - Robberies per 100,000 population
Crime - Assaults per 100,000 population
Crime - Burglaries per 100,000 population
Crime - Thefts per 100,000 population
Crime - Auto thefts per 100,000 population
Crime - Arson per 100,000 population
Crime - City-data.com crime index
Crime - Violent crime index
Crime - Property crime index
Crime - Murders per 100,000 population (5 year average)
Crime - Rapes per 100,000 population (5 year average)
Crime - Robberies per 100,000 population (5 year average)
Crime - Assaults per 100,000 population (5 year average)
Crime - Burglaries per 100,000 population (5 year average)
Crime - Thefts per 100,000 population (5 year average)
Crime - Auto thefts per 100,000 population (5 year average)
Crime - Arson per 100,000 population (5 year average)
Crime - City-data.com crime index (5 year average)
Crime - Violent crime index (5 year average)
Crime - Property crime index (5 year average)
1996 Presidential Elections Results (%) - Democratic Party (Clinton)
1996 Presidential Elections Results (%) - Republican Party (Dole)
1996 Presidential Elections Results (%) - Other
2000 Presidential Elections Results (%) - Democratic Party (Gore)
2000 Presidential Elections Results (%) - Republican Party (Bush)
2000 Presidential Elections Results (%) - Other
2004 Presidential Elections Results (%) - Democratic Party (Kerry)
2004 Presidential Elections Results (%) - Republican Party (Bush)
2004 Presidential Elections Results (%) - Other
2008 Presidential Elections Results (%) - Democratic Party (Obama)
2008 Presidential Elections Results (%) - Republican Party (McCain)
2008 Presidential Elections Results (%) - Other
2012 Presidential Elections Results (%) - Democratic Party (Obama)
2012 Presidential Elections Results (%) - Republican Party (Romney)
2012 Presidential Elections Results (%) - Other
2016 Presidential Elections Results (%) - Democratic Party (Clinton)
2016 Presidential Elections Results (%) - Republican Party (Trump)
2016 Presidential Elections Results (%) - Other
2020 Presidential Elections Results (%) - Democratic Party (Biden)
2020 Presidential Elections Results (%) - Republican Party (Trump)
2020 Presidential Elections Results (%) - Other
Ancestries Reported - Arab (%)
Ancestries Reported - Czech (%)
Ancestries Reported - Danish (%)
Ancestries Reported - Dutch (%)
Ancestries Reported - English (%)
Ancestries Reported - French (%)
Ancestries Reported - French Canadian (%)
Ancestries Reported - German (%)
Ancestries Reported - Greek (%)
Ancestries Reported - Hungarian (%)
Ancestries Reported - Irish (%)
Ancestries Reported - Italian (%)
Ancestries Reported - Lithuanian (%)
Ancestries Reported - Norwegian (%)
Ancestries Reported - Polish (%)
Ancestries Reported - Portuguese (%)
Ancestries Reported - Russian (%)
Ancestries Reported - Scotch-Irish (%)
Ancestries Reported - Scottish (%)
Ancestries Reported - Slovak (%)
Ancestries Reported - Subsaharan African (%)
Ancestries Reported - Swedish (%)
Ancestries Reported - Swiss (%)
Ancestries Reported - Ukrainian (%)
Ancestries Reported - United States (%)
Ancestries Reported - Welsh (%)
Ancestries Reported - West Indian (%)
Ancestries Reported - Other (%)
Educational Attainment - No schooling completed (%)
Educational Attainment - Less than high school (%)
Educational Attainment - High school or equivalent (%)
Educational Attainment - Less than 1 year of college (%)
Educational Attainment - 1 or more years of college (%)
Educational Attainment - Associate degree (%)
Educational Attainment - Bachelor's degree (%)
Educational Attainment - Master's degree (%)
Educational Attainment - Professional school degree (%)
Educational Attainment - Doctorate degree (%)
School Enrollment - Nursery, preschool (%)
School Enrollment - Kindergarten (%)
School Enrollment - Grade 1 to 4 (%)
School Enrollment - Grade 5 to 8 (%)
School Enrollment - Grade 9 to 12 (%)
School Enrollment - College undergrad (%)
School Enrollment - Graduate or professional (%)
School Enrollment - Not enrolled in school (%)
School enrollment - Public schools (%)
School enrollment - Private schools (%)
School enrollment - Not enrolled (%)
Median number of rooms in houses and condos
Median number of rooms in apartments
Housing units lacking complete plumbing facilities (%)
Housing units lacking complete kitchen facilities (%)
Density of houses
Urban houses (%)
Rural houses (%)
Households with people 60 years and over (%)
Households with people 65 years and over (%)
Households with people 75 years and over (%)
Households with one or more nonrelatives (%)
Households with no nonrelatives (%)
Population in households (%)
Family households (%)
Nonfamily households (%)
Population in families (%)
Family households with own children (%)
Median number of bedrooms in owner occupied houses
Mean number of bedrooms in owner occupied houses
Median number of bedrooms in renter occupied houses
Mean number of bedrooms in renter occupied houses
Median number of vehichles in owner occupied houses
Mean number of vehichles in owner occupied houses
Median number of vehichles in renter occupied houses
Mean number of vehichles in renter occupied houses
Mortgage status - with mortgage (%)
Mortgage status - with second mortgage (%)
Mortgage status - with home equity loan (%)
Mortgage status - with both second mortgage and home equity loan (%)
Mortgage status - without a mortgage (%)
Average family size
Average family size - White
Average family size - Black or African American
Average family size - Asian
Average family size - Hispanic or Latino
Average family size - American Indian and Alaska Native
Average family size - Multirace
Average family size - Other Race
Geographical mobility - Same house 1 year ago (%)
Geographical mobility - Moved within same county (%)
Geographical mobility - Moved from different county within same state (%)
Geographical mobility - Moved from different state (%)
Geographical mobility - Moved from abroad (%)
Place of birth - Born in state of residence (%)
Place of birth - Born in other state (%)
Place of birth - Native, outside of US (%)
Place of birth - Foreign born (%)
Housing units in structures - 1, detached (%)
Housing units in structures - 1, attached (%)
Housing units in structures - 2 (%)
Housing units in structures - 3 or 4 (%)
Housing units in structures - 5 to 9 (%)
Housing units in structures - 10 to 19 (%)
Housing units in structures - 20 to 49 (%)
Housing units in structures - 50 or more (%)
Housing units in structures - Mobile home (%)
Housing units in structures - Boat, RV, van, etc. (%)
House/condo owner moved in on average (years ago)
Renter moved in on average (years ago)
Year householder moved into unit - Moved in 1999 to March 2000 (%)
Year householder moved into unit - Moved in 1995 to 1998 (%)
Year householder moved into unit - Moved in 1990 to 1994 (%)
Year householder moved into unit - Moved in 1980 to 1989 (%)
Year householder moved into unit - Moved in 1970 to 1979 (%)
Year householder moved into unit - Moved in 1969 or earlier (%)
Means of transportation to work - Drove car alone (%)
Means of transportation to work - Carpooled (%)
Means of transportation to work - Public transportation (%)
Means of transportation to work - Bus or trolley bus (%)
Means of transportation to work - Streetcar or trolley car (%)
Means of transportation to work - Subway or elevated (%)
Means of transportation to work - Railroad (%)
Means of transportation to work - Ferryboat (%)
Means of transportation to work - Taxicab (%)
Means of transportation to work - Motorcycle (%)
Means of transportation to work - Bicycle (%)
Means of transportation to work - Walked (%)
Means of transportation to work - Other means (%)
Working at home (%)
Industry diversity
Most Common Industries - Agriculture, forestry, fishing and hunting, and mining (%)
Most Common Industries - Agriculture, forestry, fishing and hunting (%)
Most Common Industries - Mining, quarrying, and oil and gas extraction (%)
Most Common Industries - Construction (%)
Most Common Industries - Manufacturing (%)
Most Common Industries - Wholesale trade (%)
Most Common Industries - Retail trade (%)
Most Common Industries - Transportation and warehousing, and utilities (%)
Most Common Industries - Transportation and warehousing (%)
Most Common Industries - Utilities (%)
Most Common Industries - Information (%)
Most Common Industries - Finance and insurance, and real estate and rental and leasing (%)
Most Common Industries - Finance and insurance (%)
Most Common Industries - Real estate and rental and leasing (%)
Most Common Industries - Professional, scientific, and management, and administrative and waste management services (%)
Most Common Industries - Professional, scientific, and technical services (%)
Most Common Industries - Management of companies and enterprises (%)
Most Common Industries - Administrative and support and waste management services (%)
Most Common Industries - Educational services, and health care and social assistance (%)
Most Common Industries - Educational services (%)
Most Common Industries - Health care and social assistance (%)
Most Common Industries - Arts, entertainment, and recreation, and accommodation and food services (%)
Most Common Industries - Arts, entertainment, and recreation (%)
Most Common Industries - Accommodation and food services (%)
Most Common Industries - Other services, except public administration (%)
Most Common Industries - Public administration (%)
Occupation diversity
Most Common Occupations - Management, business, science, and arts occupations (%)
Most Common Occupations - Management, business, and financial occupations (%)
Most Common Occupations - Management occupations (%)
Most Common Occupations - Business and financial operations occupations (%)
Most Common Occupations - Computer, engineering, and science occupations (%)
Most Common Occupations - Computer and mathematical occupations (%)
Most Common Occupations - Architecture and engineering occupations (%)
Most Common Occupations - Life, physical, and social science occupations (%)
Most Common Occupations - Education, legal, community service, arts, and media occupations (%)
Most Common Occupations - Community and social service occupations (%)
Most Common Occupations - Legal occupations (%)
Most Common Occupations - Education, training, and library occupations (%)
Most Common Occupations - Arts, design, entertainment, sports, and media occupations (%)
Most Common Occupations - Healthcare practitioners and technical occupations (%)
Most Common Occupations - Health diagnosing and treating practitioners and other technical occupations (%)
Most Common Occupations - Health technologists and technicians (%)
Most Common Occupations - Service occupations (%)
Most Common Occupations - Healthcare support occupations (%)
Most Common Occupations - Protective service occupations (%)
Most Common Occupations - Fire fighting and prevention, and other protective service workers including supervisors (%)
Most Common Occupations - Law enforcement workers including supervisors (%)
Most Common Occupations - Food preparation and serving related occupations (%)
Most Common Occupations - Building and grounds cleaning and maintenance occupations (%)
Most Common Occupations - Personal care and service occupations (%)
Most Common Occupations - Sales and office occupations (%)
Most Common Occupations - Sales and related occupations (%)
Most Common Occupations - Office and administrative support occupations (%)
Most Common Occupations - Natural resources, construction, and maintenance occupations (%)
Most Common Occupations - Farming, fishing, and forestry occupations (%)
Most Common Occupations - Construction and extraction occupations (%)
Most Common Occupations - Installation, maintenance, and repair occupations (%)
Most Common Occupations - Production, transportation, and material moving occupations (%)
Most Common Occupations - Production occupations (%)
Most Common Occupations - Transportation occupations (%)
Most Common Occupations - Material moving occupations (%)
People in Group quarters - Institutionalized population (%)
People in Group quarters - Correctional institutions (%)
People in Group quarters - Federal prisons and detention centers (%)
People in Group quarters - Halfway houses (%)
People in Group quarters - Local jails and other confinement facilities (including police lockups) (%)
People in Group quarters - Military disciplinary barracks (%)
People in Group quarters - State prisons (%)
People in Group quarters - Other types of correctional institutions (%)
People in Group quarters - Nursing homes (%)
People in Group quarters - Hospitals/wards, hospices, and schools for the handicapped (%)
People in Group quarters - Hospitals/wards and hospices for chronically ill (%)
People in Group quarters - Hospices or homes for chronically ill (%)
People in Group quarters - Military hospitals or wards for chronically ill (%)
People in Group quarters - Other hospitals or wards for chronically ill (%)
People in Group quarters - Hospitals or wards for drug/alcohol abuse (%)
People in Group quarters - Mental (Psychiatric) hospitals or wards (%)
People in Group quarters - Schools, hospitals, or wards for the mentally retarded (%)
People in Group quarters - Schools, hospitals, or wards for the physically handicapped (%)
People in Group quarters - Institutions for the deaf (%)
People in Group quarters - Institutions for the blind (%)
People in Group quarters - Orthopedic wards and institutions for the physically handicapped (%)
People in Group quarters - Wards in general hospitals for patients who have no usual home elsewhere (%)
People in Group quarters - Wards in military hospitals for patients who have no usual home elsewhere (%)
People in Group quarters - Juvenile institutions (%)
People in Group quarters - Long-term care (%)
People in Group quarters - Homes for abused, dependent, and neglected children (%)
People in Group quarters - Residential treatment centers for emotionally disturbed children (%)
People in Group quarters - Training schools for juvenile delinquents (%)
People in Group quarters - Short-term care, detention or diagnostic centers for delinquent children (%)
People in Group quarters - Type of juvenile institution unknown (%)
People in Group quarters - Noninstitutionalized population (%)
People in Group quarters - College dormitories (includes college quarters off campus) (%)
People in Group quarters - Military quarters (%)
People in Group quarters - On base (%)
People in Group quarters - Barracks, unaccompanied personnel housing (UPH), (Enlisted/Officer), ;and similar group living quarters for military personnel (%)
People in Group quarters - Transient quarters for temporary residents (%)
People in Group quarters - Military ships (%)
People in Group quarters - Group homes (%)
People in Group quarters - Homes or halfway houses for drug/alcohol abuse (%)
People in Group quarters - Homes for the mentally ill (%)
People in Group quarters - Homes for the mentally retarded (%)
People in Group quarters - Homes for the physically handicapped (%)
People in Group quarters - Other group homes (%)
People in Group quarters - Religious group quarters (%)
People in Group quarters - Dormitories (%)
People in Group quarters - Agriculture workers' dormitories on farms (%)
People in Group quarters - Job Corps and vocational training facilities (%)
People in Group quarters - Other workers' dormitories (%)
People in Group quarters - Crews of maritime vessels (%)
People in Group quarters - Other nonhousehold living situations (%)
People in Group quarters - Other noninstitutional group quarters (%)
Residents speaking English at home (%)
Residents speaking English at home - Born in the United States (%)
Residents speaking English at home - Native, born elsewhere (%)
Residents speaking English at home - Foreign born (%)
Residents speaking Spanish at home (%)
Residents speaking Spanish at home - Born in the United States (%)
Residents speaking Spanish at home - Native, born elsewhere (%)
Residents speaking Spanish at home - Foreign born (%)
Residents speaking other language at home (%)
Residents speaking other language at home - Born in the United States (%)
Residents speaking other language at home - Native, born elsewhere (%)
Residents speaking other language at home - Foreign born (%)
Class of Workers - Employee of private company (%)
Class of Workers - Self-employed in own incorporated business (%)
Class of Workers - Private not-for-profit wage and salary workers (%)
Class of Workers - Local government workers (%)
Class of Workers - State government workers (%)
Class of Workers - Federal government workers (%)
Class of Workers - Self-employed workers in own not incorporated business and Unpaid family workers (%)
House heating fuel used in houses and condos - Utility gas (%)
House heating fuel used in houses and condos - Bottled, tank, or LP gas (%)
House heating fuel used in houses and condos - Electricity (%)
House heating fuel used in houses and condos - Fuel oil, kerosene, etc. (%)
House heating fuel used in houses and condos - Coal or coke (%)
House heating fuel used in houses and condos - Wood (%)
House heating fuel used in houses and condos - Solar energy (%)
House heating fuel used in houses and condos - Other fuel (%)
House heating fuel used in houses and condos - No fuel used (%)
House heating fuel used in apartments - Utility gas (%)
House heating fuel used in apartments - Bottled, tank, or LP gas (%)
House heating fuel used in apartments - Electricity (%)
House heating fuel used in apartments - Fuel oil, kerosene, etc. (%)
House heating fuel used in apartments - Coal or coke (%)
House heating fuel used in apartments - Wood (%)
House heating fuel used in apartments - Solar energy (%)
House heating fuel used in apartments - Other fuel (%)
House heating fuel used in apartments - No fuel used (%)
Armed forces status - In Armed Forces (%)
Armed forces status - Civilian (%)
Armed forces status - Civilian - Veteran (%)
Armed forces status - Civilian - Nonveteran (%)
Fatal accidents locations in years 2005-2021
Fatal accidents locations in 2005
Fatal accidents locations in 2006
Fatal accidents locations in 2007
Fatal accidents locations in 2008
Fatal accidents locations in 2009
Fatal accidents locations in 2010
Fatal accidents locations in 2011
Fatal accidents locations in 2012
Fatal accidents locations in 2013
Fatal accidents locations in 2014
Fatal accidents locations in 2015
Fatal accidents locations in 2016
Fatal accidents locations in 2017
Fatal accidents locations in 2018
Fatal accidents locations in 2019
Fatal accidents locations in 2020
Fatal accidents locations in 2021
Alcohol use - People drinking some alcohol every month (%)
Alcohol use - People not drinking at all (%)
Alcohol use - Average days/month drinking alcohol
Alcohol use - Average drinks/week
Alcohol use - Average days/year people drink much
Audiometry - Average condition of hearing (%)
Audiometry - People that can hear a whisper from across a quiet room (%)
Audiometry - People that can hear normal voice from across a quiet room (%)
Audiometry - Ears ringing, roaring, buzzing (%)
Audiometry - Had a job exposure to loud noise (%)
Audiometry - Had off-work exposure to loud noise (%)
Blood Pressure & Cholesterol - Has high blood pressure (%)
Blood Pressure & Cholesterol - Checking blood pressure at home (%)
Blood Pressure & Cholesterol - Frequently checking blood cholesterol (%)
Blood Pressure & Cholesterol - Has high cholesterol level (%)
Consumer Behavior - Money monthly spent on food at supermarket/grocery store
Consumer Behavior - Money monthly spent on food at other stores
Consumer Behavior - Money monthly spent on eating out
Consumer Behavior - Money monthly spent on carryout/delivered foods
Consumer Behavior - Income spent on food at supermarket/grocery store (%)
Consumer Behavior - Income spent on food at other stores (%)
Consumer Behavior - Income spent on eating out (%)
Consumer Behavior - Income spent on carryout/delivered foods (%)
Current Health Status - General health condition (%)
Current Health Status - Blood donors (%)
Current Health Status - Has blood ever tested for HIV virus (%)
Current Health Status - Left-handed people (%)
Dermatology - People using sunscreen (%)
Diabetes - Diabetics (%)
Diabetes - Had a blood test for high blood sugar (%)
Diabetes - People taking insulin (%)
Diet Behavior & Nutrition - Diet health (%)
Diet Behavior & Nutrition - Milk product consumption (# of products/month)
Diet Behavior & Nutrition - Meals not home prepared (#/week)
Diet Behavior & Nutrition - Meals from fast food or pizza place (#/week)
Diet Behavior & Nutrition - Ready-to-eat foods (#/month)
Diet Behavior & Nutrition - Frozen meals/pizza (#/month)
Drug Use - People that ever used marijuana or hashish (%)
Drug Use - Ever used hard drugs (%)
Drug Use - Ever used any form of cocaine (%)
Drug Use - Ever used heroin (%)
Drug Use - Ever used methamphetamine (%)
Health Insurance - People covered by health insurance (%)
Kidney Conditions-Urology - Avg. # of times urinating at night
Medical Conditions - People with asthma (%)
Medical Conditions - People with anemia (%)
Medical Conditions - People with psoriasis (%)
Medical Conditions - People with overweight (%)
Medical Conditions - Elderly people having difficulties in thinking or remembering (%)
Medical Conditions - People who ever received blood transfusion (%)
Medical Conditions - People having trouble seeing even with glass/contacts (%)
Medical Conditions - People with arthritis (%)
Medical Conditions - People with gout (%)
Medical Conditions - People with congestive heart failure (%)
Medical Conditions - People with coronary heart disease (%)
Medical Conditions - People with angina pectoris (%)
Medical Conditions - People who ever had heart attack (%)
Medical Conditions - People who ever had stroke (%)
Medical Conditions - People with emphysema (%)
Medical Conditions - People with thyroid problem (%)
Medical Conditions - People with chronic bronchitis (%)
Medical Conditions - People with any liver condition (%)
Medical Conditions - People who ever had cancer or malignancy (%)
Mental Health - People who have little interest in doing things (%)
Mental Health - People feeling down, depressed, or hopeless (%)
Mental Health - People who have trouble sleeping or sleeping too much (%)
Mental Health - People feeling tired or having little energy (%)
Mental Health - People with poor appetite or overeating (%)
Mental Health - People feeling bad about themself (%)
Mental Health - People who have trouble concentrating on things (%)
Mental Health - People moving or speaking slowly or too fast (%)
Mental Health - People having thoughts they would be better off dead (%)
Oral Health - Average years since last visit a dentist
Oral Health - People embarrassed because of mouth (%)
Oral Health - People with gum disease (%)
Oral Health - General health of teeth and gums (%)
Oral Health - Average days a week using dental floss/device
Oral Health - Average days a week using mouthwash for dental problem
Oral Health - Average number of teeth
Pesticide Use - Households using pesticides to control insects (%)
Pesticide Use - Households using pesticides to kill weeds (%)
Physical Activity - People doing vigorous-intensity work activities (%)
Physical Activity - People doing moderate-intensity work activities (%)
Physical Activity - People walking or bicycling (%)
Physical Activity - People doing vigorous-intensity recreational activities (%)
Physical Activity - People doing moderate-intensity recreational activities (%)
Physical Activity - Average hours a day doing sedentary activities
Physical Activity - Average hours a day watching TV or videos
Physical Activity - Average hours a day using computer
Physical Functioning - People having limitations keeping them from working (%)
Physical Functioning - People limited in amount of work they can do (%)
Physical Functioning - People that need special equipment to walk (%)
Physical Functioning - People experiencing confusion/memory problems (%)
Physical Functioning - People requiring special healthcare equipment (%)
Prescription Medications - Average number of prescription medicines taking
Preventive Aspirin Use - Adults 40+ taking low-dose aspirin (%)
Reproductive Health - Vaginal deliveries (%)
Reproductive Health - Cesarean deliveries (%)
Reproductive Health - Deliveries resulted in a live birth (%)
Reproductive Health - Pregnancies resulted in a delivery (%)
Reproductive Health - Women breastfeeding newborns (%)
Reproductive Health - Women that had a hysterectomy (%)
Reproductive Health - Women that had both ovaries removed (%)
Reproductive Health - Women that have ever taken birth control pills (%)
Reproductive Health - Women taking birth control pills (%)
Reproductive Health - Women that have ever used Depo-Provera or injectables (%)
Reproductive Health - Women that have ever used female hormones (%)
Sexual Behavior - People 18+ that ever had sex (vaginal, anal, or oral) (%)
Sexual Behavior - Males 18+ that ever had vaginal sex with a woman (%)
Sexual Behavior - Males 18+ that ever performed oral sex on a woman (%)
Sexual Behavior - Males 18+ that ever had anal sex with a woman (%)
Sexual Behavior - Males 18+ that ever had any sex with a man (%)
Sexual Behavior - Females 18+ that ever had vaginal sex with a man (%)
Sexual Behavior - Females 18+ that ever performed oral sex on a man (%)
Sexual Behavior - Females 18+ that ever had anal sex with a man (%)
Sexual Behavior - Females 18+ that ever had any kind of sex with a woman (%)
Sexual Behavior - Average age people first had sex
Sexual Behavior - Average number of female sex partners in lifetime (males 18+)
Sexual Behavior - Average number of female vaginal sex partners in lifetime (males 18+)
Sexual Behavior - Average age people first performed oral sex on a woman (18+)
Sexual Behavior - Average number of woman performed oral sex on in lifetime (18+)
Sexual Behavior - Average number of male sex partners in lifetime (males 18+)
Sexual Behavior - Average number of male anal sex partners in lifetime (males 18+)
Sexual Behavior - Average age people first performed oral sex on a man (18+)
Sexual Behavior - Average number of male oral sex partners in lifetime (18+)
Sexual Behavior - People using protection when performing oral sex (%)
Sexual Behavior - Average number of times people have vaginal or anal sex a year
Sexual Behavior - People having sex without condom (%)
Sexual Behavior - Average number of male sex partners in lifetime (females 18+)
Sexual Behavior - Average number of male vaginal sex partners in lifetime (females 18+)
Sexual Behavior - Average number of female sex partners in lifetime (females 18+)
Sexual Behavior - Circumcised males 18+ (%)
Sleep Disorders - Average hours sleeping at night
Sleep Disorders - People that has trouble sleeping (%)
Smoking-Cigarette Use - People smoking cigarettes (%)
Taste & Smell - People 40+ having problems with smell (%)
Taste & Smell - People 40+ having problems with taste (%)
Taste & Smell - People 40+ that ever had wisdom teeth removed (%)
Taste & Smell - People 40+ that ever had tonsils teeth removed (%)
Taste & Smell - People 40+ that ever had a loss of consciousness because of a head injury (%)
Taste & Smell - People 40+ that ever had a broken nose or other serious injury to face or skull (%)
Taste & Smell - People 40+ that ever had two or more sinus infections (%)
Weight - Average height (inches)
Weight - Average weight (pounds)
Weight - Average BMI
Weight - People that are obese (%)
Weight - People that ever were obese (%)
Weight - People trying to lose weight (%)
100%
urban population.
Estimated median house/condo value in 2022: $191,451
19149:
$191,451Pennsylvania:
$245,500
According to our research of Pennsylvania and other state lists, there were 56 registered sex offenders living in 19149 zip code as of April 27, 2024 . The ratio of all residents to sex offenders in zip code 19149 is 1,031 to 1.The ratio of registered sex offenders to all residents in this zip code is lower than the state average.
Median resident age: This zip code:
33.6 yearsPennsylvania median age:
40.9 years
Average household size: This zip code:
2.9 peoplePennsylvania:
2.4 people
Averages for the 2020 tax year for zip code 19149, filed in 2021:
Average Adjusted Gross Income (AGI) in 2020: $35,875 (Individual Income Tax Returns) Here:
$35,875State:
$75,707
Salary/wage: $34,108 (reported on 77.8% of returns )Here:
$34,108State:
$62,806
(% of AGI for various income ranges: 995.7% for AGIs below $25k , 3235.8% for AGIs $25k-50k , 6601.2% for AGIs $50k-75k , 9790.4% for AGIs $75k-100k , 16306.1% for AGIs $100k-200k , 53710.0% for AGIs over 200k ) Taxable interest for individuals: $717 (reported on 13.6% of returns )This zip code:
$717Pennsylvania:
$1,633
(% of AGI for various income ranges: 5.4% for AGIs below $25k , 7.6% for AGIs $25k-50k , 18.7% for AGIs $50k-75k , 40.3% for AGIs $75k-100k , 93.6% for AGIs $100k-200k , 410.0% for AGIs over 200k ) Ordinary dividends: $1,965 (reported on 4.9% of returns )(% of AGI for various income ranges: 4.7% for AGIs below $25k , 4.6% for AGIs $25k-50k , 14.8% for AGIs $50k-75k , 32.6% for AGIs $75k-100k , 126.9% for AGIs $100k-200k , 1270.0% for AGIs over 200k ) Net capital gain/loss in AGI: +$5,378 (reported on 4.9% of returns )Here:
+$5,378State:
+$23,522
(% of AGI for various income ranges: 2.7% for AGIs below $25k , 10.1% for AGIs $25k-50k , 27.9% for AGIs $50k-75k , 131.5% for AGIs $75k-100k , 416.7% for AGIs $100k-200k , 5860.0% for AGIs over 200k ) Profit/loss from business: +$8,353 (reported on 20.2% of returns )Here:
+$8,353State:
+$16,274
(% of AGI for various income ranges: 208.8% for AGIs below $25k , 229.0% for AGIs $25k-50k , 223.2% for AGIs $50k-75k , 232.8% for AGIs $75k-100k , 342.1% for AGIs $100k-200k ) Taxable individual retirement arrangement distribution: $9,130 (reported on 2.8% of returns )19149:
$9,130Pennsylvania:
$18,583
(% of AGI for various income ranges: 15.5% for AGIs below $25k , 20.2% for AGIs $25k-50k , 47.9% for AGIs $50k-75k , 116.3% for AGIs $75k-100k , 236.6% for AGIs $100k-200k ) Total itemized deductions: $26,324 (reported on 3.0% of returns )Here:
$26,324State:
$34,850
(% of AGI for various income ranges: 8.6% for AGIs below $25k , 69.9% for AGIs $25k-50k , 229.4% for AGIs $50k-75k , 419.9% for AGIs $75k-100k , 798.0% for AGIs $100k-200k ) Charity contributions: $7,857 (reported on 2.4% of returns )(% of AGI for various income ranges: 0.7% for AGIs below $25k , 13.0% for AGIs $25k-50k , 55.9% for AGIs $50k-75k , 117.9% for AGIs $75k-100k , 219.0% for AGIs $100k-200k ) Taxes paid: $7,555 (reported on 3.0% of returns )(% of AGI for various income ranges: 1.7% for AGIs below $25k , 19.3% for AGIs $25k-50k , 66.3% for AGIs $50k-75k , 117.0% for AGIs $75k-100k , 238.0% for AGIs $100k-200k ) Earned income credit: $2,584 (reported on 31.6% of returns )(% of AGI for various income ranges: 155.4% for AGIs below $25k , 114.7% for AGIs $25k-50k , 1.2% for AGIs $50k-75k ) Percentage of individuals using paid preparers for their 2020 taxes: 91.9%(% for various income ranges: 90.0% for AGIs below $25k , 94.2% for AGIs $25k-50k , 92.8% for AGIs $50k-75k , 90.8% for AGIs $75k-100k , 90.8% for AGIs $100k-200k , 100.0% for AGIs over 200k )
Averages for the 2012 tax year for zip code 19149, filed in 2013:
Average Adjusted Gross Income (AGI) in 2012: $33,983 (Individual Income Tax Returns) Here:
$33,983State:
$61,346
Salary/wage: $33,406 (reported on 84.5% of returns )Here:
$33,406State:
$51,902
(% of AGI for various income ranges: 72.2% for AGIs below $25k , 87.3% for AGIs $25k-50k , 87.0% for AGIs $50k-75k , 86.0% for AGIs $75k-100k , 84.0% for AGIs $100k-200k , 50.9% for AGIs over 200k ) Taxable interest for individuals: $961 (reported on 18.3% of returns )This zip code:
$961Pennsylvania:
$1,588
(% of AGI for various income ranges: 0.8% for AGIs below $25k , 0.3% for AGIs $25k-50k , 0.5% for AGIs $50k-75k , 0.6% for AGIs $75k-100k , 0.6% for AGIs $100k-200k , 0.4% for AGIs over 200k ) Ordinary dividends: $2,614 (reported on 7.5% of returns )(% of AGI for various income ranges: 1.3% for AGIs below $25k , 0.3% for AGIs $25k-50k , 0.3% for AGIs $50k-75k , 0.4% for AGIs $75k-100k , 0.9% for AGIs $100k-200k ) Net capital gain/loss in AGI: +$1,107 (reported on 4.2% of returns )Here:
+$1,107State:
+$14,495
(% of AGI for various income ranges: 0.1% for AGIs $50k-75k , 0.2% for AGIs $75k-100k , 0.5% for AGIs $100k-200k ) Profit/loss from business: +$8,877 (reported on 12.6% of returns )Here:
+$8,877State:
+$16,268
(% of AGI for various income ranges: 12.5% for AGIs below $25k , 1.8% for AGIs $25k-50k , 0.8% for AGIs $50k-75k , 0.8% for AGIs $75k-100k , 0.8% for AGIs $100k-200k ) Taxable individual retirement arrangement distribution: $8,704 (reported on 5.0% of returns )19149:
$8,704Pennsylvania:
$14,550
(% of AGI for various income ranges: 1.5% for AGIs below $25k , 1.0% for AGIs $25k-50k , 1.0% for AGIs $50k-75k , 1.3% for AGIs $75k-100k , 2.1% for AGIs $100k-200k ) Total itemized deductions: $15,470 (25% of AGI, reported on 24.2% of returns )Here:
$15,470State:
$23,538
Here:
24.8% of AGIState:
18.4% of AGI
(% of AGI for various income ranges: 4.9% for AGIs below $25k , 10.5% for AGIs $25k-50k , 13.7% for AGIs $50k-75k , 13.9% for AGIs $75k-100k , 14.0% for AGIs $100k-200k , 8.3% for AGIs over 200k ) Charity contributions: $2,225 (reported on 19.1% of returns )(% of AGI for various income ranges: 0.4% for AGIs below $25k , 1.2% for AGIs $25k-50k , 1.7% for AGIs $50k-75k , 1.6% for AGIs $75k-100k , 1.7% for AGIs $100k-200k , 0.5% for AGIs over 200k ) Taxes paid: $5,769 (reported on 24.1% of returns )(% of AGI for various income ranges: 1.0% for AGIs below $25k , 3.1% for AGIs $25k-50k , 5.2% for AGIs $50k-75k , 6.1% for AGIs $75k-100k , 6.8% for AGIs $100k-200k , 4.6% for AGIs over 200k ) Earned income credit: $2,566 (reported on 33.5% of returns )(% of AGI for various income ranges: 10.6% for AGIs below $25k , 1.8% for AGIs $25k-50k ) Percentage of individuals using paid preparers for their 2012 taxes: 56.5%(% for various income ranges: 58.2% for AGIs below $25k , 55.4% for AGIs $25k-50k , 53.0% for AGIs $50k-75k , 54.0% for AGIs $75k-100k , 57.3% for AGIs $100k-200k , 75.0% for AGIs over 200k )
Averages for the 2004 tax year for zip code 19149, filed in 2005:
Average Adjusted Gross Income (AGI) in 2004: $32,040 (Individual Income Tax Returns) Here:
$32,040State:
$48,049
Salary/wage: $32,162 (reported on 84.6% of returns )Here:
$32,162State:
$42,646
(% of AGI for various income ranges: 74.0% for AGIs below $10k , 74.8% for AGIs $10k-25k , 88.6% for AGIs $25k-50k , 88.4% for AGIs $50k-75k , 88.3% for AGIs $75k-100k , 77.8% for AGIs over 100k ) Taxable interest for individuals: $1,540 (reported on 38.7% of returns )This zip code:
$1,540Pennsylvania:
$1,657
(% of AGI for various income ranges: 4.4% for AGIs below $10k , 2.7% for AGIs $10k-25k , 1.2% for AGIs $25k-50k , 1.4% for AGIs $50k-75k , 1.5% for AGIs $75k-100k , 3.6% for AGIs over 100k ) Taxable dividends: $1,383 (reported on 13.2% of returns )(% of AGI for various income ranges: 1.7% for AGIs below $10k , 0.8% for AGIs $10k-25k , 0.4% for AGIs $25k-50k , 0.4% for AGIs $50k-75k , 0.6% for AGIs $75k-100k , 1.0% for AGIs over 100k ) Net capital gain/loss: +$3,045 (reported on 8.5% of returns )Here:
+$3,045State:
+$9,716
(% of AGI for various income ranges: -0.8% for AGIs below $10k , 0.2% for AGIs $10k-25k , 0.1% for AGIs $25k-50k , 0.5% for AGIs $50k-75k , 0.5% for AGIs $75k-100k , 6.2% for AGIs over 100k ) Profit/loss from business: +$7,430 (reported on 9.4% of returns )Here:
+$7,430State:
+$14,267
(% of AGI for various income ranges: 12.3% for AGIs below $10k , 6.1% for AGIs $10k-25k , 1.2% for AGIs $25k-50k , 0.8% for AGIs $50k-75k , 1.1% for AGIs $75k-100k , 1.1% for AGIs over 100k ) IRA payment deduction: $2,476 (reported on 2.2% of returns )19149:
$2,476Pennsylvania:
$2,903
(% of AGI for various income ranges: 0.1% for AGIs below $10k , 0.2% for AGIs $10k-25k , 0.2% for AGIs $25k-50k , 0.1% for AGIs $50k-75k , 0.1% for AGIs $75k-100k , 0.1% for AGIs over 100k ) Self-employed pension: $5,500 (reported on 0.1% of returns )Here:
$5,500Pennsylvania:
$14,674
Total itemized deductions: $13,164 (24% of AGI, reported on 30.9% of returns )Here:
$13,164State:
$18,804
Here:
24.2% of AGIState:
19.5% of AGI
(% of AGI for various income ranges: 3.8% for AGIs below $10k , 6.7% for AGIs $10k-25k , 12.9% for AGIs $25k-50k , 15.2% for AGIs $50k-75k , 15.5% for AGIs $75k-100k , 13.9% for AGIs over 100k ) Charity contributions deductions: $2,040 (4% of AGI, reported on 27.9% of returns )Here:
3.6% of AGIState:
3.3% of AGI
(% of AGI for various income ranges: 0.3% for AGIs below $10k , 0.8% for AGIs $10k-25k , 1.8% for AGIs $25k-50k , 2.2% for AGIs $50k-75k , 2.2% for AGIs $75k-100k , 2.1% for AGIs over 100k ) Total tax: $3,537 (reported on 69.2% of returns )(% of AGI for various income ranges: 2.7% for AGIs below $10k , 3.7% for AGIs $10k-25k , 6.1% for AGIs $25k-50k , 8.8% for AGIs $50k-75k , 10.0% for AGIs $75k-100k , 14.6% for AGIs over 100k ) Earned income credit: $1,837 (reported on 22.7% of returns )Percentage of individuals using paid preparers for their 2004 taxes: 55.9%(% for various income ranges: 51.8% for AGIs below $10k , 60.9% for AGIs $10k-25k , 54.3% for AGIs $25k-50k , 55.3% for AGIs $50k-75k , 53.6% for AGIs $75k-100k , 61.7% for AGIs over 100k )
Estimated median household income in 2022: This zip code:
$52,558Pennsylvania:
$71,798
Nearest zip codes: 19135 ,
19111 ,
19152 ,
19124 ,
19137 ,
19012 .
Philadelphia Zip Code Map
Percentage of family households: This zip code:
55.0%Pennsylvania:
42.6%
Percentage of households with unmarried partners: This zip code:
7.6%Pennsylvania:
46.5%
Likely homosexual households (counted as self-reported same-sex unmarried-partner households)
Lesbian couples: 0.1% of all households Gay men: 0.0% of all households
Household received Food Stamps/SNAP in the past 12 months: 6,556Household did not receive Food Stamps/SNAP in the past 12 months: 13,531
Women who had a birth in the past 12 months: 1,066 (841 now married , 239 unmarried) Women who did not have a birth in the past 12 months: 13,383 (4,255 now married , 9,165 unmarried)
Housing units in zip code 19149 with a mortgage: 6,587 (500
second mortgage , 25
home equity loan , 319
both second mortgage and home equity loan )
Houses without a mortgage: 687
Median monthly owner costs for units with a mortgage: $1,165
Median monthly owner costs for units without a mortgage: $460
Residents with income below the poverty level in 2022:
This zip code:
21.9%Whole state:
11.8%
Residents with income below 50% of the poverty level in 2022:
This zip code:
12.1%Whole state:
6.1%
Median number of rooms in houses and condos: Median number of rooms in apartments:
Year house built (houses)
0 2020 or later121 2010 to 201995 2000 to 2009495 1990 to 1999338 1980 to 19891,254 1970 to 19792,577 1960 to 19699,286 1950 to 19594,205 1940 to 19492,148 1939 or earlier
Zip code 19149 household income distribution in 2022 1,455 Less than $10,000554 $10,000 to $14,999901 $15,000 to $19,9991,688 $20,000 to $24,999955 $25,000 to $29,9991,040 $30,000 to $34,999957 $35,000 to $39,999790 $40,000 to $44,9991,060 $45,000 to $49,9991,739 $50,000 to $59,9992,243 $60,000 to $74,9992,392 $75,000 to $99,9991,780 $100,000 to $124,999968 $125,000 to $149,999748 $150,000 to $199,999613 $200,000 or moreEstimate of home value of owner-occupied houses/condos in 2022 in zip code 19149 181 Less than $10,00068 $10,000 to $14,99972 $15,000 to $19,99942 $20,000 to $24,99936 $25,000 to $29,99920 $30,000 to $34,99968 $35,000 to $39,99946 $40,000 to $49,99917 $50,000 to $59,99944 $60,000 to $69,999130 $70,000 to $79,99929 $80,000 to $89,999172 $90,000 to $99,9991,060 $100,000 to $124,9991,321 $125,000 to $149,9991,457 $150,000 to $174,9991,327 $175,000 to $199,9992,284 $200,000 to $249,9991,351 $250,000 to $299,999258 $300,000 to $399,9994 $400,000 to $499,99950 $500,000 to $749,99933 $2,000,000 or moreRent paid by renters in 2022 in zip code 19149 44 Less than $100165 $300 to $34985 $400 to $449103 $500 to $54966 $550 to $59977 $600 to $649100 $650 to $699332 $700 to $749326 $750 to $799431 $800 to $8991,380 $900 to $9992,670 $1,000 to $1,2492,399 $1,250 to $1,499186 $1,500 to $1,99948 $3,000 to $3,499283 No cash rent
Median gross rent in 2022: $1,407.
Median price asked for vacant for-sale houses and condos in 2022: $211,191.
Estimated median house (or condo) value in 2022 for: White Non-Hispanic householders: $190,858Black or African American householders: $182,263American Indian or Alaska Native householders: $333,409Asian householders: $192,932Native Hawaiian and other Pacific Islander householders: $212,789Some other race householders: $195,007Two or more races householders: $178,707Hispanic or Latino householders: $192,043Estimated median house or condo value in 2022: $191,451
19149:
$191,451Pennsylvania:
$245,500
Lower value quartile - upper value quartile: $146,714 - $243,096
Mean price in 2022: Detached houses: $281,015Here:
$281,015State:
$317,202
Townhouses or other attached units: $187,102Here:
$187,102State:
$254,369
In 2-unit structures: $250,109Here:
$250,109State:
$249,182
Mobile homes: $70,316Here:
$70,316State:
$92,414
Housing units in structures:
One, detached: 1,094One, attached: 17,311Two: 1,4933 or 4: 31510 to 19: 3220 to 49: 31050 or more: 81Mobile homes: 70Unemployment : 8.6%
Means of transportation to work in zip code 19149 53.7% 13,918 Drove a car alone15.8% 4,088 Carpooled10.3% 2,681 Bus or trolley bus2.0% 523 Streetcar or trolley car0.5% 129 Subway or elevated0.6% 163 Taxi0.8% 211 Bicycle2.5% 652 Walked3.6% 936 Other means5.8% 1,515 Worked at homeTravel time to work (commute) in zip code 19149 273 Less than 5 minutes555 5 to 9 minutes1,335 10 to 14 minutes1,990 15 to 19 minutes3,800 20 to 24 minutes1,849 25 to 29 minutes3,641 30 to 34 minutes880 35 to 39 minutes1,846 40 to 44 minutes3,855 45 to 59 minutes2,733 60 to 89 minutes1,045 90 or more minutes
Neighborhoods in zip code 19149: Percentage of zip code residents living and working in this county: 76.7%
Household type by relationship:
Households: 58,663
Male householders: 8,652 (2,003 living alone ), Female householders: 11,226 (2,603 living alone )7,111 spouses (6,959 opposite-sex spouses ), 2,113 unmarried partners , (1,845 opposite-sex unmarried partners ), 19,959 children (18,679 natural , 203 adopted , 1,082 stepchildren ), 2,135 grandchildren , 1,190 brothers or sisters , 2,111 parents , 0 foster children , 1,888 other relatives , 1,673 non-relatives In group quarters: 68 (-1 institutionalized population )
Size of family households: 3,814 2-persons , 3,568 3-persons , 3,660 4-persons , 1,401 5-persons , 795 6-persons , 598 7-or-more-persons
Size of nonfamily households: 4,606 1-person , 1,090 2-persons , 27 3-persons , 119 4-persons
6,281 married couples with children. single-parent households (1,531 men , 5,196 women ).
47.2% of residents of 19149 zip code speak English at home. of residents speak Spanish at home (50% very well, 14% well, 29% not well, 7% not at all ).of residents speak other Indo-European language at home (38% very well, 22% well, 26% not well, 14% not at all ).of residents speak Asian or Pacific Island language at home (24% very well, 23% well, 34% not well, 19% not at all ).of residents speak other language at home (46% very well, 26% well, 20% not well, 8% not at all ).
Foreign born population: 20,702 (35.3%)
(45.7%
of them are naturalized citizens )
This zip code:
35.3%Whole state:
7.5%
14% Bolivia 9% Dominica 8% El Salvador 6% Uruguay 4% Thailand 4% Colombia 4% Costa Rica 4% Brazilian 4% Irish 3% Palestinian 2% Italian 2% Haitian 2% Albanian 2% Polish
Year of entry for the foreign-born population
9,921 2010 or later 7,193 2000 to 2009 4,243 1990 to 1999 2,362 Before 1990
There are
212 Medical Specialists in Zip Code 19149 .
Facilities with environmental interests located in this zip code:
ATLANTIC 0363 3229 (6626 CASTOR AVE in PHILADELPHIA, PA)
STATE MASTER (Pennsylvania database) - RCRIS-PAD987326998, HAZARDOUS WASTE PROGRAM Conditionally Exempt Small Quantity Generators, less than 100 kg/month of hazardous waste (Resource Conservation and Recovery Act (tracking hazardous waste)) - notification Organizations: OPERNAME (CONTACT/OPERATOR)
, ATLANTIC REFINING & MKTNG CO (CONTACT/OWNER)
, ATLANTIC REFINING & MARKETING CORPORATION (CONTACT/OWNER)
Alternative names: ATLANTIC SERVICE STATION
ALLEN ETHAN SCH ( in PHILADELPHIA, PA)
(National Center for Education Statistics) - STATE ID-3758 Organizations: PHILADELPHIA CITY SD (SCHOOL DISTRICT)
ABLE ONE HOUR CLEANERS (6932 BUSTLETON AVENUE in PHILADELPHIA, PA)
Small Quantity Generators, between 100 kg and 1000 kg of hazardous waste/month (Resource Conservation and Recovery Act (tracking hazardous waste)) - notification Organizations: OPERNAME (CONTACT/OPERATOR)
, CRELL, PHYLLIS (CONTACT/OWNER)
Alternative names: ABLE 1 HR CLNR SVC
AMOCO (6400 ROOSEVELT BOULEVARD in PHILADELPHIA, PA)
Small Quantity Generators, between 100 kg and 1000 kg of hazardous waste/month (Resource Conservation and Recovery Act (tracking hazardous waste)) - notification Organizations: AMOCO OIL COMPANY (CONTACT/OWNER)
Alternative names: AMOCO 84768 TANKS
AMOCO 84767 TANKS (5801 OXFORD & BUSTELTON AVES in PHILADELPHIA, PA)
Small Quantity Generators, between 100 kg and 1000 kg of hazardous waste/month (Resource Conservation and Recovery Act (tracking hazardous waste)) - notification Organizations: AMOCO OIL COMPANY (CONTACT/OWNER)
Housing units lacking complete plumbing facilities: 1.0%
Housing units lacking complete kitchen facilities: 1.6%
83.4% Utility gas 9.4% Electricity 3.1% Fuel oil, kerosene, etc. 2.3% No fuel used 1.5% Bottled, tank, or LP gas
Population in 1990: 47,535. Population change in the 1990s: +948 (+2.0%).
Place of birth for U.S.-born residents:
This state: 29,139Northeast: 4,903Midwest: 154South: 1,232West: 281
67% of the 19149 zip code residents lived in the same house 5 years ago.
Out of people who lived in different houses, 80% lived in this county.
Out of people who lived in different counties, 50% lived in Pennsylvania.
93% of the 19149 zip code residents lived in the same house 1 year ago.
Out of people who lived in different houses, 55% moved from this county.
Out of people who lived in different houses, 3% moved from different county within same state.
Out of people who lived in different houses, 29% moved from different state.
Out of people who lived in different houses, 16% moved from abroad.
Private vs. public school enrollment:
Students in private schools in grades 1 to 8 (elementary and middle school): 656
Here:
10.0%Pennsylvania:
15.7%
Students in private schools in grades 9 to 12 (high school): 438
Here:
12.0%Pennsylvania:
13.4%
Students in private undergraduate colleges: 1,400
Here:
44.7%Pennsylvania:
39.8%
Occupation by median earnings in the past 12 months ($)
100,515 Architecture and engineering occupations 92,181 Health diagnosing and treating practitioners and other technical occupations 72,494 Law enforcement workers including supervisors 69,187 Business and financial operations occupations 67,662 Legal occupations 61,961 Computer and mathematical occupations
Top industries in this zip code by the number of employees in 2005:
Accommodation and Food Services: Full-Service Restaurants (50-99 employees: 3 establishments, 20-49 employees: 3 establishments, 10-19 employees: 1 establishment, 5-9 employees: 7 establishments, 1-4 employees: 11 establishments)Accommodation and Food Services: Limited-Service Restaurants (50-99: 1, 20-49: 4, 10-19: 3, 5-9: 7, 1-4: 20)Health Care and Social Assistance: Offices of Dentists (100-249: 1, 10-19: 2, 5-9: 5, 1-4: 6)Health Care and Social Assistance: Offices of Physicians (except Mental Health Specialists) (20-49: 3, 10-19: 3, 5-9: 5, 1-4: 13)Other Services (except Public Administration): Religious Organizations (50-99: 2, 10-19: 1, 5-9: 5, 1-4: 5)Educational Services: Elementary and Secondary Schools (100-249: 1, 10-19: 1, 1-4: 1)
People in group quarters in 2010:
43 people in other noninstitutional facilities
7 people in group homes intended for adults
6 people in residential treatment centers for adults
People in group quarters in 2000:
57 people in religious group quarters
21 people in homes for the mentally retarded
3 people in homes for the mentally ill
2 people in homes or halfway houses for drug/alcohol abuse
Fatal accident statistics in 2014:
Fatal accident count: 4Vehicles involved in fatal accidents: 5Fatal accidents caused by drunken drivers: 0Fatalities: 4Persons involved in fatal accidents: 7Pedestrians involved in fatal accidents: 3
Fatal accident statistics in 2013:
Fatal accident count: 2Vehicles involved in fatal accidents: 4Fatal accidents caused by drunken drivers: 0Fatalities: 2Persons involved in fatal accidents: 9Pedestrians involved in fatal accidents: 0
Home Mortgage Disclosure Act Aggregated Statistics For Year 2009(Based on 13 full and 10 partial tracts) A) FHA, FSA/RHS & VA B) Conventional C) Refinancings D) Home Improvement Loans E) Loans on Dwellings For 5+ Families F) Non-occupant Loans on G) Loans On Manufactured Number Average Value Number Average Value Number Average Value Number Average Value Number Average Value Number Average Value Number Average Value
LOANS ORIGINATED 652 $126,949 394 $91,305 1,080 $102,648 164 $29,657 0 $0 121 $98,823 2 $34,415 APPLICATIONS APPROVED, NOT ACCEPTED 20 $107,547 19 $92,062 121 $99,238 23 $42,059 0 $0 11 $78,625 0 $0 APPLICATIONS DENIED 86 $115,294 97 $93,166 687 $109,856 307 $24,428 0 $0 84 $94,798 4 $52,575 APPLICATIONS WITHDRAWN 51 $117,538 48 $100,995 476 $108,225 32 $49,613 2 $9,900 31 $93,650 0 $0 FILES CLOSED FOR INCOMPLETENESS 14 $108,409 11 $79,778 108 $103,613 8 $50,988 0 $0 3 $93,040 0 $0
Aggregated Statistics For Year 2008(Based on 13 full and 10 partial tracts) A) FHA, FSA/RHS & VA B) Conventional C) Refinancings D) Home Improvement Loans E) Loans on Dwellings For 5+ Families F) Non-occupant Loans on G) Loans On Manufactured Number Average Value Number Average Value Number Average Value Number Average Value Number Average Value Number Average Value Number Average Value
LOANS ORIGINATED 350 $130,705 742 $98,948 1,184 $94,243 308 $37,482 3 $3,344,657 215 $92,653 3 $105,480 APPLICATIONS APPROVED, NOT ACCEPTED 32 $126,597 73 $109,686 271 $100,780 67 $45,010 0 $0 41 $89,498 2 $174,405 APPLICATIONS DENIED 84 $131,841 187 $102,667 1,261 $110,187 566 $36,534 1 $265,520 118 $86,776 13 $86,362 APPLICATIONS WITHDRAWN 55 $131,706 86 $95,896 442 $110,698 51 $53,143 0 $0 43 $84,524 4 $38,158 FILES CLOSED FOR INCOMPLETENESS 6 $122,120 25 $132,584 103 $117,853 9 $54,991 0 $0 11 $91,884 0 $0
Aggregated Statistics For Year 2007(Based on 13 full and 10 partial tracts) A) FHA, FSA/RHS & VA B) Conventional C) Refinancings D) Home Improvement Loans E) Loans on Dwellings For 5+ Families F) Non-occupant Loans on G) Loans On Manufactured Number Average Value Number Average Value Number Average Value Number Average Value Number Average Value Number Average Value Number Average Value
LOANS ORIGINATED 278 $135,702 1,620 $110,733 1,605 $93,807 503 $38,855 9 $2,118,126 393 $105,239 0 $0 APPLICATIONS APPROVED, NOT ACCEPTED 9 $126,871 143 $102,527 380 $96,537 121 $47,209 0 $0 63 $87,187 1 $161,050 APPLICATIONS DENIED 35 $135,163 345 $117,705 1,594 $112,492 815 $35,365 3 $367,873 201 $92,774 7 $109,770 APPLICATIONS WITHDRAWN 14 $143,236 179 $111,315 721 $111,054 89 $56,063 0 $0 80 $100,416 0 $0 FILES CLOSED FOR INCOMPLETENESS 0 $0 80 $126,530 157 $121,196 6 $81,847 0 $0 23 $149,939 0 $0
Aggregated Statistics For Year 2006(Based on 13 full and 10 partial tracts) A) FHA, FSA/RHS & VA B) Conventional C) Refinancings D) Home Improvement Loans E) Loans on Dwellings For 5+ Families F) Non-occupant Loans on G) Loans On Manufactured Number Average Value Number Average Value Number Average Value Number Average Value Number Average Value Number Average Value Number Average Value
LOANS ORIGINATED 161 $133,789 2,170 $105,701 2,282 $94,734 636 $39,764 7 $237,789 580 $102,078 2 $108,650 APPLICATIONS APPROVED, NOT ACCEPTED 5 $112,304 201 $97,147 440 $92,221 91 $42,960 2 $5,930 84 $98,282 3 $71,847 APPLICATIONS DENIED 14 $127,244 402 $114,555 1,768 $103,202 816 $36,240 4 $108,382 244 $87,130 5 $39,136 APPLICATIONS WITHDRAWN 21 $128,696 239 $103,430 1,096 $100,521 82 $71,552 2 $113,555 78 $99,088 6 $137,652 FILES CLOSED FOR INCOMPLETENESS 0 $0 58 $129,168 250 $112,755 16 $105,526 0 $0 15 $108,247 0 $0
Aggregated Statistics For Year 2005(Based on 13 full and 10 partial tracts) A) FHA, FSA/RHS & VA B) Conventional C) Refinancings D) Home Improvement Loans E) Loans on Dwellings For 5+ Families F) Non-occupant Loans on G) Loans On Manufactured Number Average Value Number Average Value Number Average Value Number Average Value Number Average Value Number Average Value Number Average Value
LOANS ORIGINATED 78 $128,086 3,246 $103,415 3,166 $90,624 749 $40,751 8 $157,511 1,277 $98,226 5 $53,878 APPLICATIONS APPROVED, NOT ACCEPTED 8 $113,645 214 $101,923 573 $85,799 124 $37,501 0 $0 125 $89,792 1 $30,890 APPLICATIONS DENIED 6 $130,027 478 $102,557 2,149 $90,203 891 $26,593 0 $0 402 $57,533 9 $24,094 APPLICATIONS WITHDRAWN 5 $99,624 356 $112,862 1,380 $94,515 172 $96,740 1 $93,000 147 $104,539 2 $79,335 FILES CLOSED FOR INCOMPLETENESS 2 $62,475 78 $106,866 330 $99,995 22 $43,588 0 $0 30 $103,223 0 $0
Aggregated Statistics For Year 2004(Based on 13 full and 10 partial tracts) A) FHA, FSA/RHS & VA B) Conventional C) Refinancings D) Home Improvement Loans E) Loans on Dwellings For 5+ Families F) Non-occupant Loans on G) Loans On Manufactured Number Average Value Number Average Value Number Average Value Number Average Value Number Average Value Number Average Value Number Average Value
LOANS ORIGINATED 113 $88,159 2,856 $82,536 2,772 $71,770 671 $32,503 5 $207,562 1,008 $73,423 2 $60,495 APPLICATIONS APPROVED, NOT ACCEPTED 8 $77,911 235 $82,959 615 $68,969 122 $35,630 0 $0 129 $67,365 2 $49,585 APPLICATIONS DENIED 14 $82,814 374 $83,834 2,273 $74,561 807 $22,680 0 $0 297 $49,279 2 $42,545 APPLICATIONS WITHDRAWN 20 $92,586 257 $84,375 1,123 $78,147 118 $35,895 4 $3,589,912 134 $71,770 0 $0 FILES CLOSED FOR INCOMPLETENESS 6 $64,003 80 $82,579 628 $82,357 23 $40,566 0 $0 33 $84,058 0 $0
Aggregated Statistics For Year 2003(Based on 13 full and 10 partial tracts) A) FHA, FSA/RHS & VA B) Conventional C) Refinancings D) Home Improvement Loans E) Loans on Dwellings For 5+ Families F) Non-occupant Loans on Number Average Value Number Average Value Number Average Value Number Average Value Number Average Value Number Average Value
LOANS ORIGINATED 392 $75,870 2,061 $69,424 3,295 $60,903 555 $28,671 7 $2,068,176 588 $67,115 APPLICATIONS APPROVED, NOT ACCEPTED 34 $69,848 193 $69,402 808 $61,767 123 $28,121 0 $0 85 $66,236 APPLICATIONS DENIED 31 $76,923 319 $73,027 2,336 $65,940 579 $19,360 0 $0 165 $50,416 APPLICATIONS WITHDRAWN 38 $70,437 152 $80,761 886 $67,450 77 $33,115 0 $0 50 $64,298 FILES CLOSED FOR INCOMPLETENESS 12 $85,655 91 $68,896 219 $66,237 30 $32,579 0 $0 30 $56,639
Aggregated Statistics For Year 2002(Based on 13 full and 10 partial tracts) A) FHA, FSA/RHS & VA B) Conventional C) Refinancings D) Home Improvement Loans E) Loans on Dwellings For 5+ Families F) Non-occupant Loans on Number Average Value Number Average Value Number Average Value Number Average Value Number Average Value Number Average Value
LOANS ORIGINATED 796 $552,086 1,243 $304,477 1,655 $218,120 303 $23,735 2 $229,705 369 $423,549 APPLICATIONS APPROVED, NOT ACCEPTED 28 $64,606 109 $54,766 491 $55,436 72 $22,937 0 $0 50 $47,090 APPLICATIONS DENIED 42 $67,400 182 $63,513 1,451 $56,665 361 $22,829 2 $2,975 78 $52,295 APPLICATIONS WITHDRAWN 39 $4,310,427 100 $1,746,218 615 $61,492 52 $21,024 1 $63,900 42 $60,242 FILES CLOSED FOR INCOMPLETENESS 10 $66,110 52 $57,415 286 $61,803 25 $47,804 0 $0 15 $61,147
Aggregated Statistics For Year 2001(Based on 13 full and 10 partial tracts) A) FHA, FSA/RHS & VA B) Conventional C) Refinancings D) Home Improvement Loans E) Loans on Dwellings For 5+ Families F) Non-occupant Loans on Number Average Value Number Average Value Number Average Value Number Average Value Number Average Value Number Average Value
LOANS ORIGINATED 997 $65,265 989 $56,727 1,107 $52,446 335 $21,795 8 $714,545 231 $48,621 APPLICATIONS APPROVED, NOT ACCEPTED 43 $64,543 132 $57,744 249 $50,330 75 $21,514 0 $0 20 $39,914 APPLICATIONS DENIED 54 $63,442 209 $55,414 1,373 $47,699 371 $16,431 2 $199,280 56 $48,094 APPLICATIONS WITHDRAWN 74 $62,522 77 $59,925 495 $55,802 96 $19,232 0 $0 23 $47,069 FILES CLOSED FOR INCOMPLETENESS 7 $61,777 23 $45,557 111 $56,692 18 $31,537 0 $0 5 $35,224
Aggregated Statistics For Year 2000(Based on 13 full and 10 partial tracts) A) FHA, FSA/RHS & VA B) Conventional C) Refinancings D) Home Improvement Loans E) Loans on Dwellings For 5+ Families F) Non-occupant Loans on Number Average Value Number Average Value Number Average Value Number Average Value Number Average Value Number Average Value
LOANS ORIGINATED 942 $61,576 973 $52,483 481 $49,437 338 $18,450 3 $125,933 153 $62,725 APPLICATIONS APPROVED, NOT ACCEPTED 28 $58,040 110 $50,138 185 $49,866 88 $18,473 0 $0 24 $49,300 APPLICATIONS DENIED 54 $63,760 263 $54,214 828 $39,336 485 $17,165 0 $0 52 $39,938 APPLICATIONS WITHDRAWN 50 $62,344 122 $52,245 356 $41,872 74 $22,445 0 $0 22 $57,595 FILES CLOSED FOR INCOMPLETENESS 5 $62,992 25 $60,499 146 $57,645 7 $16,647 0 $0 4 $81,385
Aggregated Statistics For Year 1999(Based on 7 full and 5 partial tracts) A) FHA, FSA/RHS & VA B) Conventional C) Refinancings D) Home Improvement Loans E) Loans on Dwellings For 5+ Families F) Non-occupant Loans on Number Average Value Number Average Value Number Average Value Number Average Value Number Average Value Number Average Value
LOANS ORIGINATED 440 $60,361 410 $48,865 447 $45,872 184 $18,328 1 $14,770 117 $46,461 APPLICATIONS APPROVED, NOT ACCEPTED 5 $59,854 43 $48,383 158 $48,956 38 $14,334 0 $0 7 $46,571 APPLICATIONS DENIED 43 $59,175 97 $48,917 409 $45,695 168 $15,119 0 $0 24 $41,439 APPLICATIONS WITHDRAWN 33 $61,913 55 $48,120 259 $49,192 50 $25,094 0 $0 19 $49,905 FILES CLOSED FOR INCOMPLETENESS 7 $70,583 17 $57,089 73 $56,311 2 $21,660 0 $0 7 $50,951
Private Mortgage Insurance Companies Aggregated Statistics For Year 2009(Based on 13 full and 10 partial tracts) A) Conventional B) Refinancings C) Non-occupant Loans on Number Average Value Number Average Value Number Average Value
LOANS ORIGINATED 28 $120,720 17 $135,601 0 $0 APPLICATIONS APPROVED, NOT ACCEPTED 17 $120,952 6 $149,830 2 $109,690 APPLICATIONS DENIED 2 $112,825 7 $218,456 0 $0 APPLICATIONS WITHDRAWN 2 $113,860 5 $132,280 0 $0 FILES CLOSED FOR INCOMPLETENESS 1 $77,650 0 $0 0 $0
Aggregated Statistics For Year 2008(Based on 13 full and 10 partial tracts) A) Conventional B) Refinancings C) Non-occupant Loans on Number Average Value Number Average Value Number Average Value
LOANS ORIGINATED 212 $125,466 65 $129,204 14 $116,174 APPLICATIONS APPROVED, NOT ACCEPTED 68 $124,591 41 $134,491 4 $98,275 APPLICATIONS DENIED 24 $127,990 1 $100,930 12 $131,731 APPLICATIONS WITHDRAWN 5 $123,016 1 $119,540 0 $0 FILES CLOSED FOR INCOMPLETENESS 7 $107,260 1 $242,680 2 $149,970
Aggregated Statistics For Year 2007(Based on 13 full and 10 partial tracts) A) Conventional B) Refinancings C) Non-occupant Loans on Number Average Value Number Average Value Number Average Value
LOANS ORIGINATED 687 $130,423 130 $133,568 46 $103,367 APPLICATIONS APPROVED, NOT ACCEPTED 82 $136,174 22 $132,948 12 $123,597 APPLICATIONS DENIED 12 $126,492 3 $144,280 1 $130,000 APPLICATIONS WITHDRAWN 30 $130,756 11 $140,679 1 $68,050 FILES CLOSED FOR INCOMPLETENESS 1 $174,290 2 $89,675 1 $85,310
Aggregated Statistics For Year 2006(Based on 13 full and 10 partial tracts) A) Conventional B) Refinancings C) Non-occupant Loans on Number Average Value Number Average Value Number Average Value
LOANS ORIGINATED 526 $130,151 84 $131,710 53 $112,638 APPLICATIONS APPROVED, NOT ACCEPTED 73 $128,357 22 $126,804 16 $110,319 APPLICATIONS DENIED 7 $134,423 1 $65,210 1 $96,780 APPLICATIONS WITHDRAWN 14 $121,213 14 $109,784 3 $87,877 FILES CLOSED FOR INCOMPLETENESS 2 $147,765 1 $119,130 1 $119,130
Aggregated Statistics For Year 2005(Based on 13 full and 10 partial tracts) A) Conventional B) Refinancings C) Non-occupant Loans on Number Average Value Number Average Value Number Average Value
LOANS ORIGINATED 597 $124,171 87 $110,244 72 $107,011 APPLICATIONS APPROVED, NOT ACCEPTED 63 $105,699 29 $98,226 17 $84,208 APPLICATIONS DENIED 13 $126,194 1 $124,770 6 $128,940 APPLICATIONS WITHDRAWN 18 $107,598 11 $105,667 4 $91,445 FILES CLOSED FOR INCOMPLETENESS 2 $129,530 3 $66,867 0 $0
Aggregated Statistics For Year 2004(Based on 13 full and 10 partial tracts) A) Conventional B) Refinancings C) Non-occupant Loans on Number Average Value Number Average Value Number Average Value
LOANS ORIGINATED 731 $93,751 134 $89,182 89 $76,272 APPLICATIONS APPROVED, NOT ACCEPTED 94 $88,102 52 $78,666 21 $79,748 APPLICATIONS DENIED 17 $103,283 0 $0 2 $81,180 APPLICATIONS WITHDRAWN 30 $89,246 21 $76,826 2 $87,130 FILES CLOSED FOR INCOMPLETENESS 7 $91,846 0 $0 1 $118,600
Aggregated Statistics For Year 2003(Based on 13 full and 10 partial tracts) A) Conventional B) Refinancings C) Non-occupant Loans on Number Average Value Number Average Value Number Average Value
LOANS ORIGINATED 795 $78,452 283 $72,852 104 $74,827 APPLICATIONS APPROVED, NOT ACCEPTED 75 $72,756 89 $75,353 18 $72,326 APPLICATIONS DENIED 23 $71,961 5 $76,470 4 $78,830 APPLICATIONS WITHDRAWN 33 $83,038 12 $77,553 0 $0 FILES CLOSED FOR INCOMPLETENESS 5 $83,332 0 $0 0 $0
Aggregated Statistics For Year 2002(Based on 13 full and 10 partial tracts) A) Conventional B) Refinancings C) Non-occupant Loans on Number Average Value Number Average Value Number Average Value
LOANS ORIGINATED 565 $67,457 155 $69,730 78 $57,287 APPLICATIONS APPROVED, NOT ACCEPTED 64 $64,150 26 $68,723 11 $57,531 APPLICATIONS DENIED 20 $68,606 5 $64,822 3 $59,140 APPLICATIONS WITHDRAWN 37 $68,739 15 $66,727 7 $57,409 FILES CLOSED FOR INCOMPLETENESS 4 $67,822 0 $0 2 $67,325
Aggregated Statistics For Year 2001(Based on 13 full and 10 partial tracts) A) Conventional B) Refinancings C) Non-occupant Loans on Number Average Value Number Average Value Number Average Value
LOANS ORIGINATED 443 $62,621 91 $69,587 52 $57,198 APPLICATIONS APPROVED, NOT ACCEPTED 67 $66,145 9 $74,202 8 $66,088 APPLICATIONS DENIED 12 $53,191 0 $0 1 $39,520 APPLICATIONS WITHDRAWN 11 $98,227 2 $65,450 0 $0 FILES CLOSED FOR INCOMPLETENESS 6 $51,848 0 $0 2 $38,675
Aggregated Statistics For Year 2000(Based on 13 full and 10 partial tracts) A) Conventional B) Refinancings C) Non-occupant Loans on Number Average Value Number Average Value Number Average Value
LOANS ORIGINATED 285 $57,824 34 $58,622 32 $49,272 APPLICATIONS APPROVED, NOT ACCEPTED 35 $57,548 15 $65,407 4 $41,762 APPLICATIONS DENIED 20 $64,890 4 $53,505 2 $42,855 APPLICATIONS WITHDRAWN 14 $62,444 0 $0 0 $0 FILES CLOSED FOR INCOMPLETENESS 0 $0 0 $0 0 $0
Aggregated Statistics For Year 1999(Based on 7 full and 5 partial tracts) A) Conventional B) Refinancings C) Non-occupant Loans on Number Average Value Number Average Value Number Average Value
LOANS ORIGINATED 115 $54,680 37 $61,897 23 $50,706 APPLICATIONS APPROVED, NOT ACCEPTED 16 $57,147 10 $61,605 3 $55,287 APPLICATIONS DENIED 8 $58,920 2 $79,210 3 $62,750 APPLICATIONS WITHDRAWN 1 $76,620 1 $73,190 1 $48,800 FILES CLOSED FOR INCOMPLETENESS 1 $27,800 0 $0 0 $0
2010 - 2018 National Fire Incident Reporting System (NFIRS) incidents See full 2006 National Fire Incident Reporting System statistics for zip code 19149, Pennsylvania
Most common first names in zip code 19149 among deceased individuals Name Count Lived (average)
John 697 74.0 years Mary 674 79.7 years Joseph 648 73.7 years Anna 522 80.6 years William 515 74.1 years James 339 72.6 years Margaret 338 78.4 years Charles 330 73.5 years Helen 310 78.7 years Edward 305 73.5 years
Most common last names in zip code 19149 among deceased individuals Last name Count Lived (average)
Smith 116 75.9 years Cohen 115 75.1 years Miller 106 74.4 years Brown 72 78.7 years Kelly 55 78.6 years Schwartz 51 78.7 years Gallagher 51 75.6 years Levin 50 77.9 years Goldstein 46 76.9 years Goldberg 45 74.2 years
Businesses in zip code 19149
Name Count Name Count
7-Eleven 2 McDonald's 1 Avenue 1 Men's Wearhouse 2 Burger King 1 Motherhood Maternity 1 CVS 1 New York & Co 1 Casual Male XL 1 Nike 5 Chevrolet 1 OfficeMax 1 Cricket Wireless 2 Papa John's Pizza 1 DHL 1 Pathmark 1 Deb 1 Payless 2 Dunkin Donuts 4 Popeyes 1 Fashion Bug 2 RadioShack 2 FedEx 4 Rite Aid 2 Foot Locker 2 Sears 1 GNC 1 Sprint Nextel 2 GameStop 3 Subway 1 H&R Block 3 T-Mobile 1 Jones New York 2 Taco Bell 1 KFC 1 The Room Place 1 Kmart 1 Toys"R"Us 2 Lane Bryant 1 U-Haul 1 Lane Furniture 1 UPS 2 LensCrafters 1 Verizon Wireless 1 Macy's 1 Walgreens 1 MasterBrand Cabinets 1 Wendy's 1

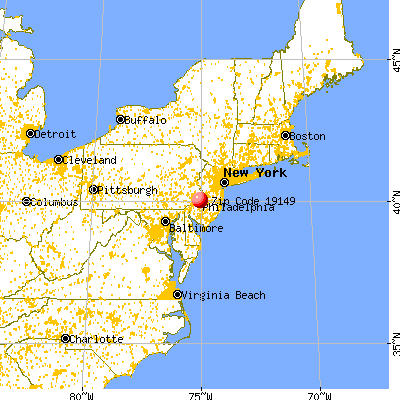


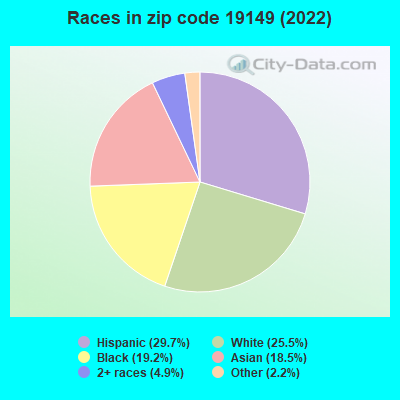


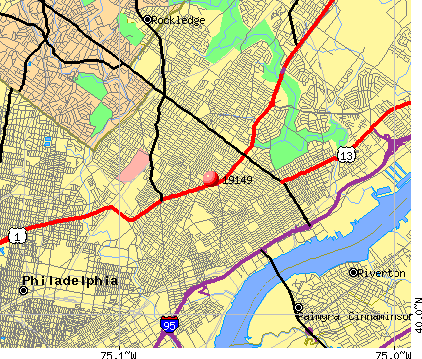 Nearest zip codes: 19135, 19111, 19152, 19124, 19137, 19012.
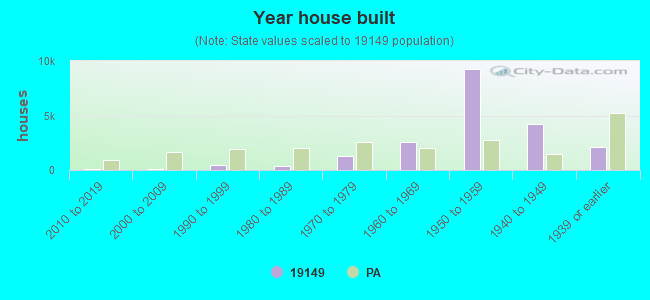


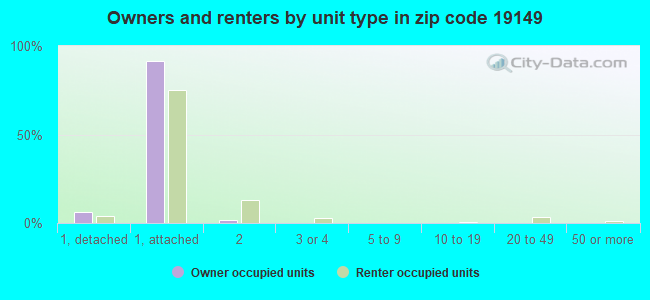
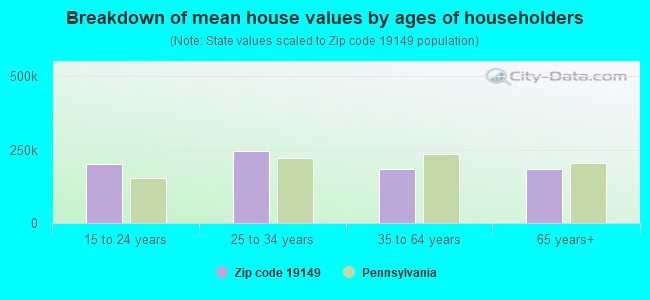


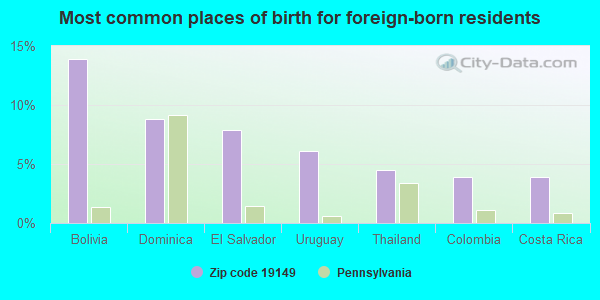
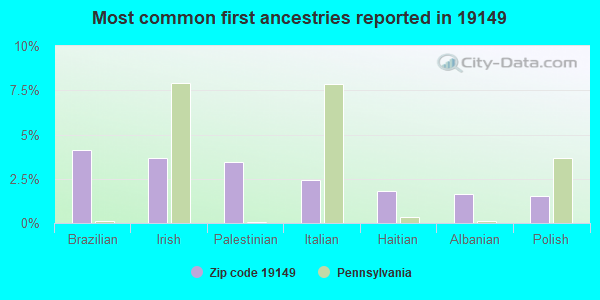
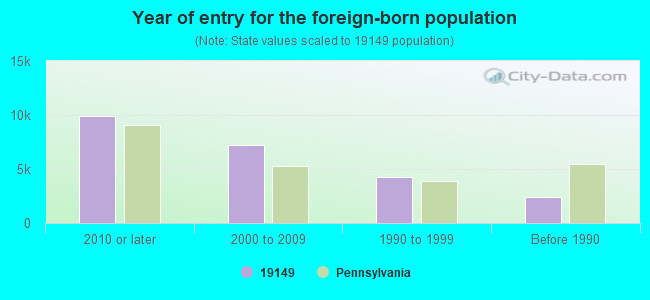
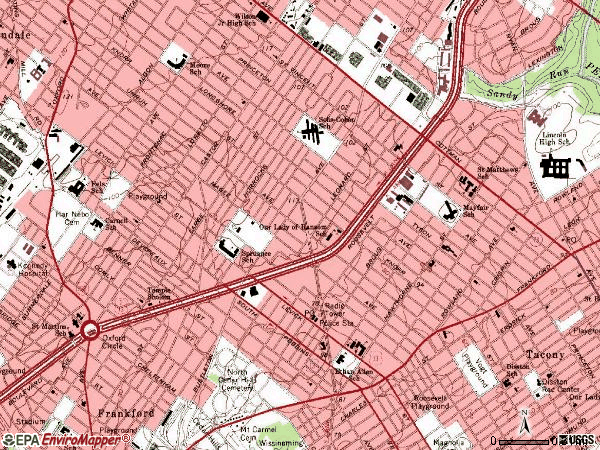

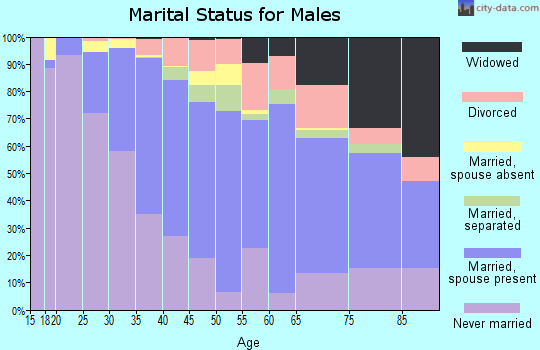
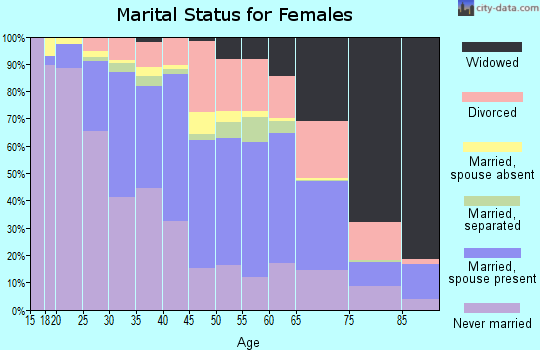
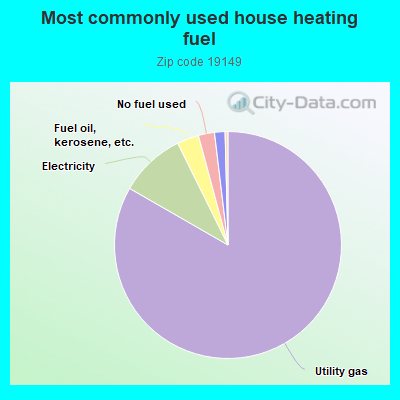
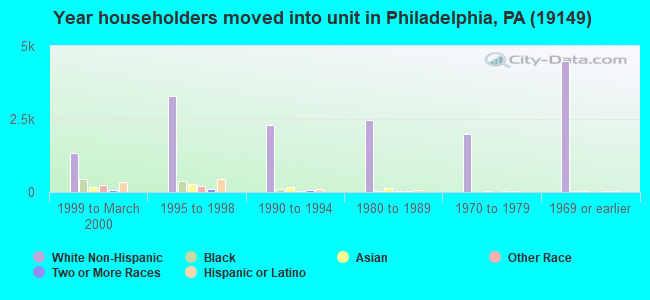

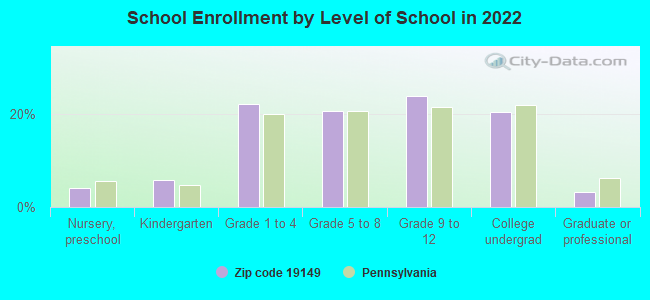
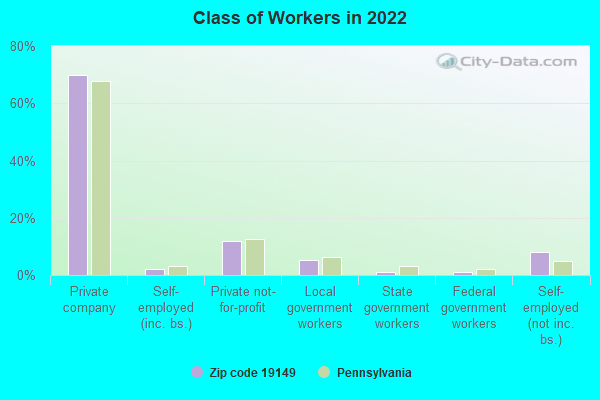
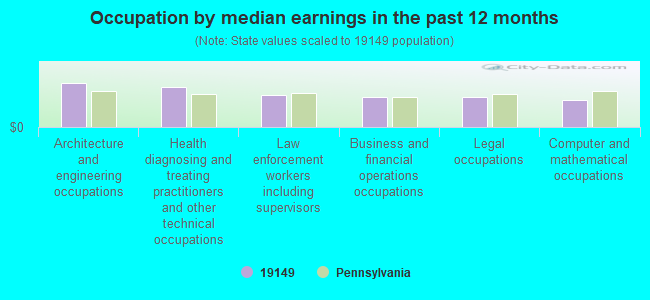
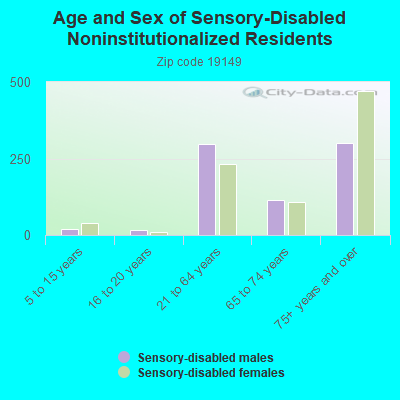
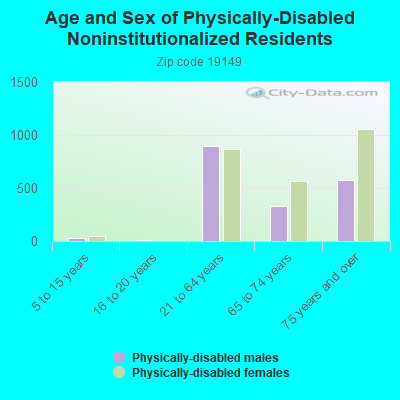
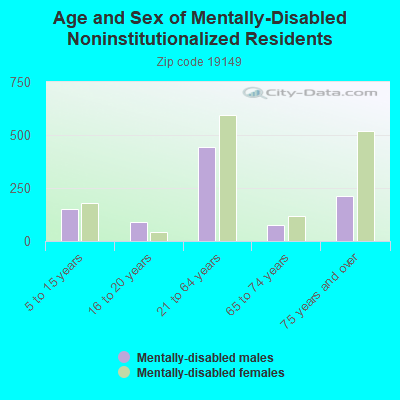
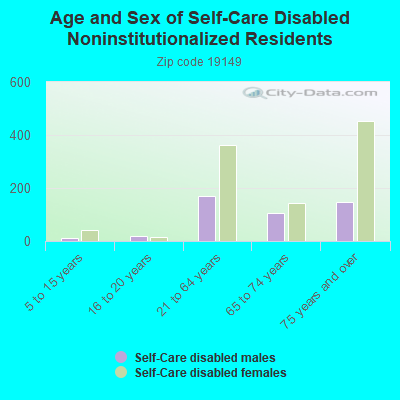
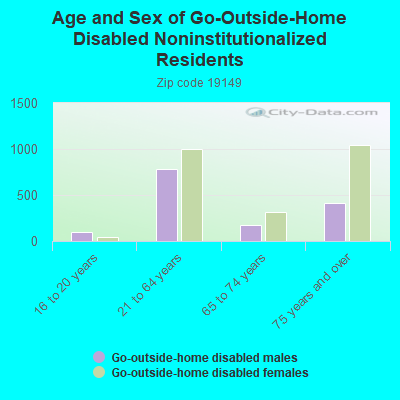
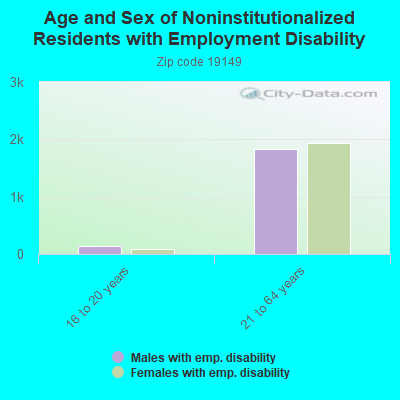

 According to the data from the years 2010 - 2018 the average number of fire incidents per year is 106. The highest number of reported fire incidents - 163 took place in 2018, and the least - 0 in 2016. The data has an increasing trend.
 When looking into fire subcategories, the most reports belonged to: Structure Fires (44.2%), and Outside Fires (34.3%).