Estimated zip code population in 2022: 8,089 Zip code population in 2010: 8,638 Zip code population in 2000: 8,069
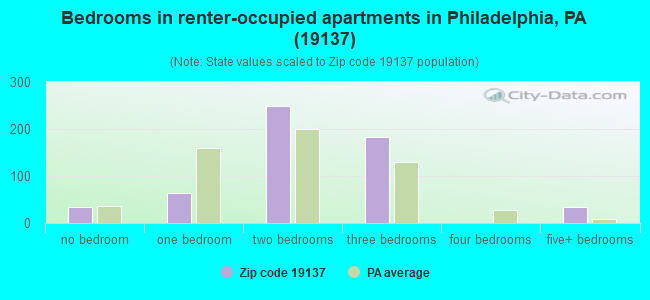
Houses and condos: 3,616 Renter-occupied apartments: 566
% of renters here:
17%
State:
31%
March 2022 cost of living index in zip code 19137: 103.8 (near average, U.S. average is 100)
Land area: 2.4 sq. mi. Water area: 0.9 sq. mi.
Population density: 3,360 people per square mile
(average).
OSM Map
General Map
Google Map
MSN Map
OSM Map
General Map
Google Map
MSN Map
OSM Map
General Map
Google Map
MSN Map
OSM Map
General Map
Google Map
MSN Map
Please wait while loading the map...
Real estate property taxes paid for housing units in 2022:
This zip code:
0.8% ($1,808)
Pennsylvania:
1.3% ($3,094)
Median real estate property taxes paid for housing units with mortgages in 2022: $1,888 (0.8%) Median real estate property taxes paid for housing units with no mortgage in 2022: $1,727 (0.9%)
Estimated median house/condo value in 2022: $216,630
19137:
$216,630
Pennsylvania:
$245,500
According to our research of Pennsylvania and other state lists, there were 16 registered sex offenders living in 19137 zip code as of April 26, 2024. The ratio of all residents to sex offenders in zip code 19137 is 525 to 1. The ratio of registered sex offenders to all residents in this zip code is near the state average.
Median resident age:
This zip code:
42.3 years
Pennsylvania median age:
40.9 years
Average household size:
This zip code:
2.5 people
Pennsylvania:
2.4 people
Averages for the 2020 tax year for zip code 19137, filed in 2021:
Average Adjusted Gross Income (AGI) in 2020: $50,718 (Individual Income Tax Returns)
Here:
$50,718
State:
$75,707
Salary/wage: $48,434 (reported on 81.7% of returns)
Here:
$48,434
State:
$62,806
(% of AGI for various income ranges: 852.2% for AGIs below $25k, 3457.1% for AGIs $25k-50k, 6178.9% for AGIs $50k-75k, 8844.7% for AGIs $75k-100k, 14632.5% for AGIs $100k-200k)
Taxable interest for individuals: $544 (reported on 23.4% of returns)
This zip code:
$544
Pennsylvania:
$1,633
(% of AGI for various income ranges: 10.5% for AGIs below $25k, 15.7% for AGIs $25k-50k, 12.5% for AGIs $50k-75k, 25.3% for AGIs $75k-100k, 24.4% for AGIs $100k-200k)
Ordinary dividends: $1,545 (reported on 7.3% of returns)
Here:
$1,545
State:
$7,382
(% of AGI for various income ranges: 7.3% for AGIs below $25k, 7.2% for AGIs $25k-50k, 14.4% for AGIs $50k-75k, 23.1% for AGIs $75k-100k, 47.2% for AGIs $100k-200k)
Net capital gain/loss in AGI: +$5,761 (reported on 5.8% of returns)
Here:
+$5,761
State:
+$23,522
(% of AGI for various income ranges: 3.5% for AGIs below $25k, 9.1% for AGIs $25k-50k, 25.8% for AGIs $50k-75k, 88.8% for AGIs $75k-100k, 241.6% for AGIs $100k-200k)
Profit/loss from business: +$7,708 (reported on 9.8% of returns)
Here:
+$7,708
State:
+$16,274
(% of AGI for various income ranges: 70.3% for AGIs below $25k, 98.8% for AGIs $25k-50k, 119.5% for AGIs $50k-75k, 151.2% for AGIs $75k-100k, 65.3% for AGIs $100k-200k)
Taxable individual retirement arrangement distribution: $10,329 (reported on 5.3% of returns)
19137:
$10,329
Pennsylvania:
$18,583
(% of AGI for various income ranges: 50.8% for AGIs below $25k, 33.0% for AGIs $25k-50k, 33.7% for AGIs $50k-75k, 186.2% for AGIs $75k-100k, 175.9% for AGIs $100k-200k)
Total itemized deductions: $20,060 (reported on 5.0% of returns)
Here:
$20,060
State:
$34,850
(% of AGI for various income ranges: 87.2% for AGIs $25k-50k, 143.3% for AGIs $50k-75k, 319.1% for AGIs $75k-100k, 423.1% for AGIs $100k-200k)
Charity contributions: $2,653 (reported on 3.8% of returns)
Here:
$2,653
State:
$12,392
(% of AGI for various income ranges: 9.0% for AGIs $25k-50k, 12.6% for AGIs $50k-75k, 30.9% for AGIs $75k-100k, 44.4% for AGIs $100k-200k)
Taxes paid: $7,455 (reported on 5.0% of returns)
19137:
$7,455
State:
$8,200
(% of AGI for various income ranges: 17.2% for AGIs $25k-50k, 52.3% for AGIs $50k-75k, 149.7% for AGIs $75k-100k, 172.5% for AGIs $100k-200k)
Earned income credit: $2,175 (reported on 18.1% of returns)
Here:
$2,175
State:
$2,100
(% of AGI for various income ranges: 94.5% for AGIs below $25k, 66.1% for AGIs $25k-50k)
Percentage of individuals using paid preparers for their 2020 taxes: 93.7%
Here:
94%
State:
92%
(% for various income ranges: 93.8% for AGIs below $25k, 94.7% for AGIs $25k-50k, 95.7% for AGIs $50k-75k, 90.5% for AGIs $75k-100k, 92.9% for AGIs $100k-200k, 75.0% for AGIs over 200k)
Averages for the 2012 tax year for zip code 19137, filed in 2013:
Average Adjusted Gross Income (AGI) in 2012: $40,872 (Individual Income Tax Returns)
Here:
$40,872
State:
$61,346
Salary/wage: $39,847 (reported on 83.9% of returns)
Here:
$39,847
State:
$51,902
(% of AGI for various income ranges: 68.9% for AGIs below $25k, 82.1% for AGIs $25k-50k, 86.0% for AGIs $50k-75k, 85.7% for AGIs $75k-100k, 80.4% for AGIs $100k-200k)
Taxable interest for individuals: $672 (reported on 27.1% of returns)
This zip code:
$672
Pennsylvania:
$1,588
(% of AGI for various income ranges: 1.1% for AGIs below $25k, 0.4% for AGIs $25k-50k, 0.4% for AGIs $50k-75k, 0.5% for AGIs $75k-100k, 0.2% for AGIs $100k-200k)
Ordinary dividends: $1,078 (reported on 9.4% of returns)
Here:
$1,078
State:
$5,827
(% of AGI for various income ranges: 0.5% for AGIs below $25k, 0.2% for AGIs $25k-50k, 0.1% for AGIs $50k-75k, 0.3% for AGIs $75k-100k, 0.2% for AGIs $100k-200k)
Net capital gain/loss in AGI: +$1,147 (reported on 4.4% of returns)
Here:
+$1,147
State:
+$14,495
(% of AGI for various income ranges: 0.2% for AGIs $50k-75k, 0.4% for AGIs $75k-100k)
Profit/loss from business: +$12,687 (reported on 8.1% of returns)
Here:
+$12,687
State:
+$16,268
(% of AGI for various income ranges: 8.0% for AGIs below $25k, 2.5% for AGIs $25k-50k, 1.6% for AGIs $50k-75k, 2.6% for AGIs $100k-200k)
Taxable individual retirement arrangement distribution: $10,785 (reported on 6.8% of returns)
19137:
$10,785
Pennsylvania:
$14,550
(% of AGI for various income ranges: 2.6% for AGIs below $25k, 1.6% for AGIs $25k-50k, 1.2% for AGIs $50k-75k, 1.4% for AGIs $75k-100k, 2.5% for AGIs $100k-200k)
Total itemized deductions: $15,845 (22% of AGI, reported on 28.6% of returns)
Here:
$15,845
State:
$23,538
Here:
22.0% of AGI
State:
18.4% of AGI
(% of AGI for various income ranges: 5.3% for AGIs below $25k, 8.9% for AGIs $25k-50k, 11.7% for AGIs $50k-75k, 13.8% for AGIs $75k-100k, 14.2% for AGIs $100k-200k)
Charity contributions: $1,723 (reported on 23.4% of returns)
Here:
$1,723
State:
$4,025
(% of AGI for various income ranges: 0.3% for AGIs below $25k, 0.7% for AGIs $25k-50k, 1.1% for AGIs $50k-75k, 1.3% for AGIs $75k-100k, 1.4% for AGIs $100k-200k)
Taxes paid: $6,214 (reported on 28.6% of returns)
19137:
$6,214
State:
$9,982
(% of AGI for various income ranges: 1.2% for AGIs below $25k, 2.5% for AGIs $25k-50k, 4.5% for AGIs $50k-75k, 5.9% for AGIs $75k-100k, 7.0% for AGIs $100k-200k)
Earned income credit: $2,232 (reported on 21.1% of returns)
Here:
$2,232
State:
$2,106
(% of AGI for various income ranges: 7.4% for AGIs below $25k, 1.1% for AGIs $25k-50k)
Percentage of individuals using paid preparers for their 2012 taxes: 56.5%
Here:
57%
State:
53%
(% for various income ranges: 51.3% for AGIs below $25k, 58.6% for AGIs $25k-50k, 58.1% for AGIs $50k-75k, 65.6% for AGIs $75k-100k, 64.0% for AGIs $100k-200k)
Averages for the 2004 tax year for zip code 19137, filed in 2005:
Average Adjusted Gross Income (AGI) in 2004: $33,027 (Individual Income Tax Returns)
Here:
$33,027
State:
$48,049
Salary/wage: $32,725 (reported on 85.8% of returns)
Here:
$32,725
State:
$42,646
(% of AGI for various income ranges: 76.1% for AGIs below $10k, 74.3% for AGIs $10k-25k, 87.9% for AGIs $25k-50k, 88.7% for AGIs $50k-75k, 90.1% for AGIs $75k-100k, 75.6% for AGIs over 100k)
Taxable interest for individuals: $925 (reported on 41.0% of returns)
This zip code:
$925
Pennsylvania:
$1,657
(% of AGI for various income ranges: 5.3% for AGIs below $10k, 2.2% for AGIs $10k-25k, 0.7% for AGIs $25k-50k, 0.9% for AGIs $50k-75k, 0.4% for AGIs $75k-100k, 1.8% for AGIs over 100k)
Taxable dividends: $959 (reported on 13.3% of returns)
Here:
$959
State:
$3,566
(% of AGI for various income ranges: 1.6% for AGIs below $10k, 0.8% for AGIs $10k-25k, 0.3% for AGIs $25k-50k, 0.1% for AGIs $50k-75k, 0.0% for AGIs $75k-100k, 1.1% for AGIs over 100k)
Net capital gain/loss: +$3,913 (reported on 6.9% of returns)
Here:
+$3,913
State:
+$9,716
(% of AGI for various income ranges: -0.4% for AGIs below $10k, -0.1% for AGIs $10k-25k, -0.0% for AGIs $25k-50k, 0.1% for AGIs $50k-75k, 0.0% for AGIs $75k-100k, 8.5% for AGIs over 100k)
Profit/loss from business: +$5,509 (reported on 5.8% of returns)
Here:
+$5,509
State:
+$14,267
(% of AGI for various income ranges: 7.3% for AGIs below $10k, 2.1% for AGIs $10k-25k, 0.7% for AGIs $25k-50k, 0.3% for AGIs $50k-75k, 0.4% for AGIs $75k-100k, 1.0% for AGIs over 100k)
IRA payment deduction: $2,569 (reported on 1.8% of returns)
19137:
$2,569
Pennsylvania:
$2,903
Total itemized deductions: $12,793 (22% of AGI, reported on 28.0% of returns)
Here:
$12,793
State:
$18,804
Here:
22.2% of AGI
State:
19.5% of AGI
(% of AGI for various income ranges: 4.4% for AGIs below $10k, 5.2% for AGIs $10k-25k, 8.8% for AGIs $25k-50k, 13.5% for AGIs $50k-75k, 14.3% for AGIs $75k-100k, 15.6% for AGIs over 100k)
Charity contributions deductions: $1,967 (3% of AGI, reported on 25.9% of returns)
Here:
$1,967
State:
$3,337
Here:
3.3% of AGI
State:
3.3% of AGI
(% of AGI for various income ranges: 0.5% for AGIs below $10k, 0.7% for AGIs $10k-25k, 1.3% for AGIs $25k-50k, 1.9% for AGIs $50k-75k, 2.0% for AGIs $75k-100k, 2.4% for AGIs over 100k)
Total tax: $3,756 (reported on 71.5% of returns)
19137:
$3,756
State:
$8,008
(% of AGI for various income ranges: 1.8% for AGIs below $10k, 3.9% for AGIs $10k-25k, 6.7% for AGIs $25k-50k, 9.1% for AGIs $50k-75k, 10.4% for AGIs $75k-100k, 15.3% for AGIs over 100k)
Earned income credit: $1,690 (reported on 18.5% of returns)
Here:
$1,690
State:
$1,643
Percentage of individuals using paid preparers for their 2004 taxes: 53.7%
Here:
54%
State:
56%
(% for various income ranges: 44.9% for AGIs below $10k, 54.4% for AGIs $10k-25k, 54.3% for AGIs $25k-50k, 59.5% for AGIs $50k-75k, 60.0% for AGIs $75k-100k, 65.1% for AGIs over 100k)
Likely homosexual households (counted as self-reported same-sex unmarried-partner households)
Lesbian couples: 0.6% of all households
Gay men: 0.0% of all households
Household received Food Stamps/SNAP in the past 12 months: 751 Household did not receive Food Stamps/SNAP in the past 12 months: 2,534
Women who had a birth in the past 12 months: 209 (116 now married, 85 unmarried) Women who did not have a birth in the past 12 months: 1,459 (463 now married, 999 unmarried)
Housing units in zip code 19137 with a mortgage: 1,455 (198 second mortgage, 5 home equity loan, 184 both second mortgage and home equity loan) Houses without a mortgage: 27
Median monthly owner costs for units with a mortgage: $1,373 Median monthly owner costs for units without a mortgage: $483
Residents with income below the poverty level in 2022:
This zip code:
16.5%
Whole state:
11.8%
Residents with income below 50% of the poverty level in 2022:
This zip code:
8.3%
Whole state:
6.1%
Median number of rooms in houses and condos:
Here:
6.2
State:
6.8
Median number of rooms in apartments:
Here:
5.0
State:
4.3
Notable locations in this zip code not listed on our city pages
Notable locations in zip code 19137: Northeast Waste Water Treatment Plant (A), Bridesburg Community Center (B), Philadelphia Fire Department Engine 33 (C). Display/hide their locations on the map
In group quarters: 44 (-1 institutionalized population)
Size of family households: 990 2-persons, 579 3-persons, 334 4-persons, 229 5-persons, 30 6-persons, 46 7-or-more-persons
Size of nonfamily households: 847 1-person, 197 2-persons, 7 5-persons
767 married couples with children.
730 single-parent households (170 men, 560 women).
90.0% of residents of 19137 zip code speak English at home.
3.8% of residents speak Spanish at home (77% very well, 16% well, 4% not well, 3% not at all).
4.9% of residents speak other Indo-European language at home (56% very well, 27% well, 17% not well).
0.6% of residents speak Asian or Pacific Island language at home (100% very well).
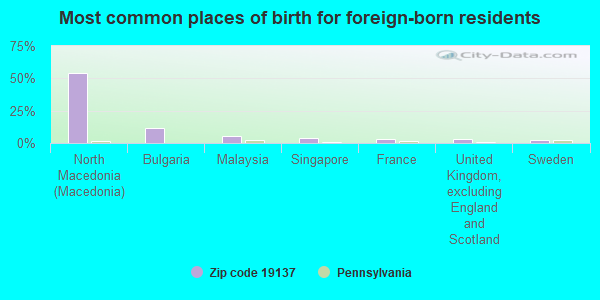
Foreign born population: 458 (5.7%) (69.2% of them are naturalized citizens)
Facilities with environmental interests located in this zip code:
BFI WASTE SVC OF PA (3000 E HEDLEY STREET in PHILADELPHIA, PA)
STATE MASTER (Pennsylvania database) - PCS-PAR800064, National Pollutant Discharge Elimination System Permit National Pollutant Discharge Elimination System NON-MAJOR (Tracking pollutant discharge elimination systems) - permit Conditionally Exempt Small Quantity Generators, less than 100 kg/month of hazardous waste (Resource Conservation and Recovery Act (tracking hazardous waste)) - notification Business SIC classification: LOCAL TRUCKING WITHOUT STORAGE Organizations: OPERNAME (CONTACT/OPERATOR)
, BFI OF PORT RICHMOND INC (CONTACT/OWNER)
, BFI WASTE SERVICES OF PENNSYLVANIA, LLC (CONTACT/OWNER)
Alternative names: BFI OF PORT RICHMOND INC, BFI WASTE SERVICES OF PA LLC, BFI WASTE SYSTEMS OF NORTH AMERICA
7 ELEVEN 24586 (BRIDGE STREET AT EAST THOMPSON STREET in PHILADELPHIA, PA)
STATE MASTER (Pennsylvania database) - RCRIS-PAD987327350, HAZARDOUS WASTE PROGRAM Small Quantity Generators, between 100 kg and 1000 kg of hazardous waste/month (Resource Conservation and Recovery Act (tracking hazardous waste)) - notification Organizations: OPERNAME (CONTACT/OPERATOR)
, SOUTHLAND CORPORATION THE (CONTACT/OWNER)
Alternative names: 7-ELEVEN #24586
APA TRANSP PHILA (THOMPSON & WHEATSHEAF LANE in PHILADELPHIA, PA)
STATE MASTER (Pennsylvania database) - RCRIS-PAD987381506, HAZARDOUS WASTE PROGRAM Conditionally Exempt Small Quantity Generators, less than 100 kg/month of hazardous waste (Resource Conservation and Recovery Act (tracking hazardous waste)) - notification Organizations: ARTHUR IMPERATORE (CONTACT/OWNER)
Alternative names: APA TRANSPORT PHILADELPHIA
ABF FREIGHT SYSTEM INC (4000 RICHMOND ST in PHILADELPHIA, PA)
National Pollutant Discharge Elimination System NON-MAJOR (Tracking pollutant discharge elimination systems) - permit National Pollutant Discharge Elimination System NON-MAJOR (Tracking pollutant discharge elimination systems) - permit Business SIC classification: TRUCKING, EXCEPT LOCAL
ATLANTIC METALS CORP (3100 E. ORTHODOX ST. in PHILADELPHIA, PA)
AIR MINOR (AIRS/AFS) COMPLIANCE ACTIVITY (Tracking inspections of insecticide, fungicide, and rodenticide, and toxic substances) TRI REPORTER (Tracking of toxic chemicals releasing facilities) Business SIC classification: SECONDARY SMELTING AND REFINING OF NONFERROUS METALS; MANUFACTURING INDUSTRIES Alternative names: NATCO INTERN'L DIV. ATLANTIC METALS CORP
ACER ENGINEERS INC (JIMMIES AUTO PARTS in PHILADELPHIA, PA)
National Pollutant Discharge Elimination System NON-MAJOR (Tracking pollutant discharge elimination systems) - permit Business SIC classification: MOTOR VEHICLE PARTS, USED Alternative names: JIMMIES AUTO PARTS
BIG SAVE CLEANERS (3849 ARAMINGO AVE in PHILADELPHIA, PA)
AIR MINOR (AIRS/AFS) Business SIC classification: DRYCLEANING PLANTS, EXCEPT RUG CLEANING
AMERICAN MEDICAL RESPONSE (5301 TACONY STREET in PHILADELPHIA, PA)
Conditionally Exempt Small Quantity Generators, less than 100 kg/month of hazardous waste (Resource Conservation and Recovery Act (tracking hazardous waste)) - notification
AMOCO #13610 (2300 EAST BUTLER AVENUE in PHILADELPHIA, PA)
Small Quantity Generators, between 100 kg and 1000 kg of hazardous waste/month (Resource Conservation and Recovery Act (tracking hazardous waste)) - notification Organizations: AMOCO OIL CO (CONTACT/OWNER)
Alternative names: AMOCO NO 13610 TANKS
ATLAS PHOTOENGRAVING INCORPORATED (5301 TACONY STREET SUITE 328B in PHILADELPHIA, PA)
Small Quantity Generators, between 100 kg and 1000 kg of hazardous waste/month (Resource Conservation and Recovery Act (tracking hazardous waste)) - notification
2514 ORTHODOX STREET SITE (2514 ORTHODOX STREET in PHILADELPHIA, PA)
SUPERFUND (Superfund database)
Housing units lacking complete plumbing facilities: 6.1% Housing units lacking complete kitchen facilities: 8.2%
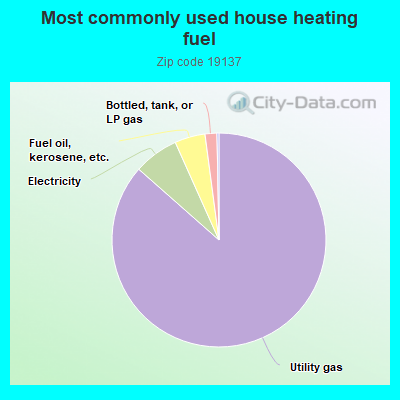
86.6%Utility gas
6.8%Electricity
4.6%Fuel oil, kerosene, etc.
1.8%Bottled, tank, or LP gas
Population in 1990: 8,395.
Place of birth for U.S.-born residents:
This state: 6,763
Northeast: 184
Midwest: 103
South: 177
West: 75
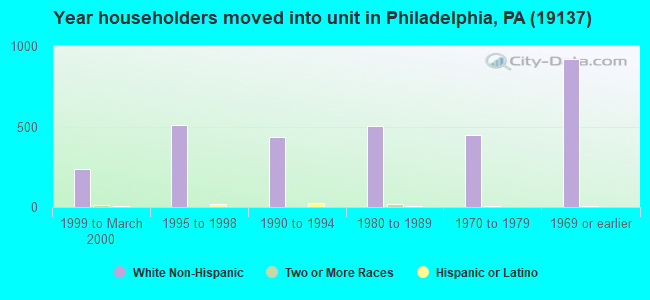
73% of the 19137 zip code residents lived in the same house 5 years ago. Out of people who lived in different houses, 90% lived in this county. Out of people who lived in different counties, 50% lived in Pennsylvania.
96% of the 19137 zip code residents lived in the same house 1 year ago. Out of people who lived in different houses, 45% moved from this county. Out of people who lived in different houses, 47% moved from different county within same state. Out of people who lived in different houses, 13% moved from different state.
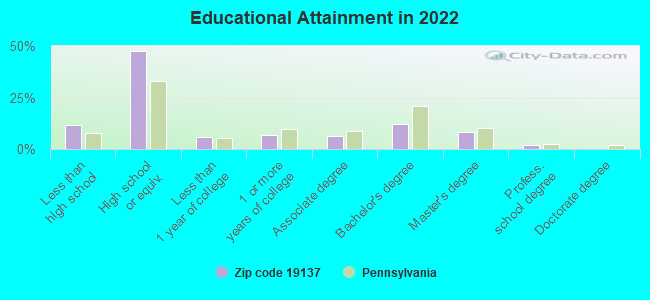
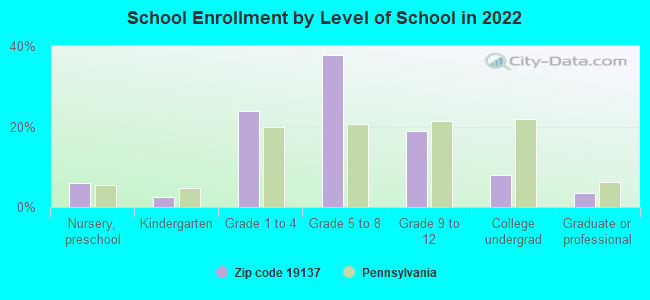
Private vs. public school enrollment:
Students in private schools in grades 1 to 8 (elementary and middle school): 214
Here:
21.3%
Pennsylvania:
15.7%
Students in private schools in grades 9 to 12 (high school): 40
Here:
12.9%
Pennsylvania:
13.4%
Students in private undergraduate colleges: 41
Here:
32.2%
Pennsylvania:
39.8%
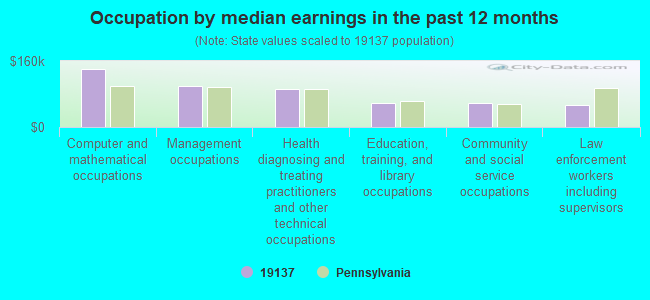
Occupation by median earnings in the past 12 months ($)
140,648Computer and mathematical occupations
99,635Management occupations
93,187Health diagnosing and treating practitioners and other technical occupations
58,969Education, training, and library occupations
58,910Community and social service occupations
53,291Law enforcement workers including supervisors
Companies with federal contracts located in this zip code:
ARCO SALES CO (2205 WAKELING ST in PHILADELPHIA, PA; small business) : $6,953,184 in 108 contractsfrom 2000 to 2006
Contracts for Aircraft Landing Equipment, Aircraft Launching Equipment, Nuts and Washers, Guns, over 30 mm up to 75 mm, and moreby Navy, Defense Logistics Agency, Army Signed by year:2000: $38,181; 2001: $803,625; 2002: $893,020; 2003: $2,300,283; 2004: $2,382,513; 2005: $352,251; 2006: $183,311.
Biggest contracts:
$1,560,839 with Navy for Aircraft Landing Equipment. Signed on 2003-06-04. Completion date: 2004-11-06.
$963,368 with Navy for Aircraft Launching Equipment. Signed on 2004-10-22. Completion date: 2006-03-25.
$855,433, same as above.Signed on 2002-05-07. Completion date: 2003-12-07.
$772,048 with Navy for Aircraft Landing Equipment. Signed on 2001-05-18. Completion date: 2002-09-30.
FAIRWAY ELEVATOR COMPANY INC (ARSENAL BUSINESS CENTER in PHILA, PA; small business) : $426,899 in 47 contractsfrom 2000 to 2006
Contracts for Maintenance, Repair and Rebuilding of Equipment -- Electrical and Electronic Equipment Components, Construction of Structures and Facilities -- Office Buildings, Maintenance, Repair or Alteration of Real Property -- Office Buildings, Maintenance, Repair and Rebuilding of Equipment -- Special Industry Machinery, and moreby Bureau of Prisoners/Federal Prison System, Navy, National Park Service Signed by year:2000: $82,000; 2001: $72,000; 2002: $88,214; 2003: $41,193; 2004: $88,828; 2005: $46,716; 2006: $7,948.
Biggest contracts:
$82,000 with Bureau of Prisoners/Federal Prison System for Maintenance, Repair and Rebuilding of Equipment -- Electrical and Electronic Equipment Components. Signed on 2000-12-15. Completion date: 2001-12-15.
$71,500 with Navy for Construction of Structures and Facilities -- Office Buildings. Signed on 2004-09-07. Completion date: 2004-10-17.
$42,000 with National Park Service for Maintenance, Repair or Alteration of Real Property -- Office Buildings. Signed on 2001-03-15. Completion date: 2001-06-15.
$39,000 with Bureau of Prisoners/Federal Prison System for Maintenance, Repair and Rebuilding of Equipment -- Electrical and Electronic Equipment Components. Signed on 2002-12-15. Completion date: 2003-01-15.
JORDON SCIENTIFIC DIV OF FOGEL (2200 KENNEDY STREET in PHILADELPHIA, PA; small business) : $85,787 in 4 contractsfrom 2000 to 2005
$50,909 with Army for Hospital Furniture, Equipment, Utensils, and Supplies. Signed on 2001-08-23. Completion date: 2002-01-01.
$30,000 with Public Buildings Service for Laboratory Equipment and Supplies. Taking place in GA. Signed on 2000-07-15. Completion date: 2000-08-15.
$4,842 with Army for Laboratory Equipment and Supplies. Signed on 2002-05-17. Completion date: 2002-06-27.
$36 with Department of Veterans Affairs for Medical and Surgical Instruments, Equipment, and Supplies. Taking place in MO. Signed on 2005-07-01. Completion date: 2005-07-31.
THOMAS / MARTIN, INC (3725 in PHILADELPHIA, PA; small business) : $61,693 in 4 contractsfrom 2000 to 2001
$26,306 with Navy for Construction of Structures and Facilities -- Miscellaneous Buildings. Signed on 2001-01-23. Completion date: 2001-06-07.
$22,943 with Navy for Construction of Structures and Facilities -- Other Non-Building Facilities. Signed on 2000-06-16. Completion date: 2000-10-14.
$10,796 with Navy for Maintenance, Repair or Alteration of Real Property -- Other Non-Building Facilities. Signed on 2000-11-20. Completion date: 2001-01-04.
$1,648, same as above.Signed on 2001-02-22. Completion date: 2001-03-16.
JORDON/FLEETWOOD/FOGEL LLC (2200 KENNEDY ST in PHILADELPHIA, MD; small business) : $38,382 in 4 contractsfrom 2000 to 2002
$26,689 with Navy for Optical Instruments, Test Equipment, Components and Accessories. Taking place in DC. Signed on 2000-10-01. Completion date: 2000-10-20.
$4,472 with Army for Medical and Surgical Instruments, Equipment, and Supplies. Taking place in GA. Signed on 2002-09-30. Completion date: 2002-10-31.
$3,923 with Army for Medical and Surgical Instruments, Equipment, and Supplies. Taking place in VA. Signed on 2002-05-15. Completion date: 2002-07-01.
$3,298 with Army for Refrigeration Equipment. Taking place in AL. Signed on 2002-12-16. Completion date: 2003-02-10.
JORDON COMMERCIAL REFRIGERATOR (2200 KENNEDY ST in PHILADELPHIA, MD; small business)
$36,036 with Defense Logistics Agency for Refrigeration Equipment. Signed on 2000-03-20. Completion date: 2000-10-20.
BELGRADE PARTS & SERVICE INC (2748 E BUTLER ST in PHILADELPHIA, PA; small business)
$12,937 with Defense Logistics Agency for Packing and Gasket Materials. Signed on 2004-12-21. Completion date: 2004-12-29.
FORMAN SIGN CO (4601 BATH ST STE 2 in PHILADELPHIA, PA; small business) : $3,591 in 2 contractsin 2003
$3,050 with Army for Signs, Advertising Displays, and Identification Plates. Signed on 2003-06-18. Completion date: 2003-08-15.
$541, same as above.Signed on 2003-09-12. Completion date: 2003-08-15.
Top industries in this zip code by the number of employees in 2005:
Real Estate and Rental and Leasing: Residential Property Managers (100-249 employees: 1 establishment, 5-9 employees: 1 establishment, 1-4 employees: 1 establishment)
Wholesale Trade: Other Grocery and Related Products Merchant Wholesalers (100-249: 1)
Administrative and Support and Waste Management and Remediation Services: Security Guards and Patrol Services (100-249: 1)
Accommodation and Food Services: Limited-Service Restaurants (50-99: 1, 5-9: 2)
Other Services (except Public Administration): Labor Unions and Similar Labor Organizations (20-49: 2, 5-9: 2)
Administrative and Support and Waste Management and Remediation Services: Solid Waste Collection (50-99: 1, 1-4: 1)
People in group quarters in 2010:
37 people in residential treatment centers for adults
11 people in maritime/merchant vessels
3 people in group homes intended for adults
3 people in other noninstitutional facilities
People in group quarters in 2000:
9 people in homes or halfway houses for drug/alcohol abuse
8 people in religious group quarters
8 people in other nonhousehold living situations
3 people in other noninstitutional group quarters
Fatal accident statistics in 2014:
Fatal accident count: 2
Vehicles involved in fatal accidents: 2
Fatal accidents caused by drunken drivers: 2
Fatalities: 2
Persons involved in fatal accidents: 2
Pedestrians involved in fatal accidents: 0
Fatal accident statistics in 2013:
Fatal accident count: 3
Vehicles involved in fatal accidents: 3
Fatal accidents caused by drunken drivers: 0
Fatalities: 3
Persons involved in fatal accidents: 3
Pedestrians involved in fatal accidents: 3
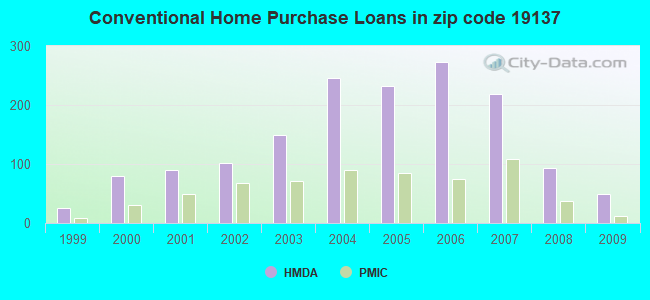
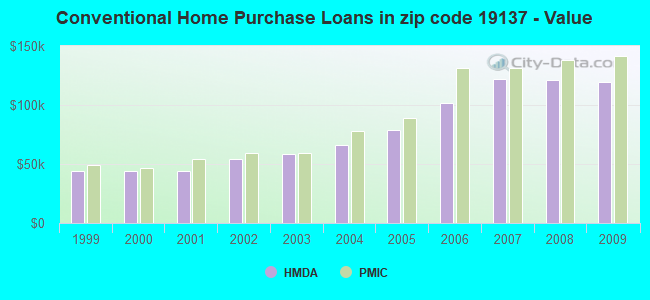
Home Mortgage Disclosure Act Aggregated Statistics For Year 2009 (Based on 16 partial tracts)
A) FHA, FSA/RHS & VA Home Purchase Loans
B) Conventional Home Purchase Loans
C) Refinancings
D) Home Improvement Loans
F) Non-occupant Loans on < 5 Family Dwellings (A B C & D)
Number
Average Value
Number
Average Value
Number
Average Value
Number
Average Value
Number
Average Value
LOANS ORIGINATED
104
$140,614
50
$119,086
240
$108,179
51
$21,907
20
$98,318
APPLICATIONS APPROVED, NOT ACCEPTED
2
$160,220
9
$108,817
21
$127,777
7
$32,987
5
$89,714
APPLICATIONS DENIED
10
$98,813
7
$156,099
120
$117,824
55
$32,495
12
$60,705
APPLICATIONS WITHDRAWN
10
$139,398
14
$141,858
81
$126,363
3
$83,460
4
$127,790
FILES CLOSED FOR INCOMPLETENESS
4
$183,382
2
$143,455
11
$168,609
7
$135,296
2
$143,455
Aggregated Statistics For Year 2008 (Based on 16 partial tracts)
A) FHA, FSA/RHS & VA Home Purchase Loans
B) Conventional Home Purchase Loans
C) Refinancings
D) Home Improvement Loans
E) Loans on Dwellings For 5+ Families
F) Non-occupant Loans on < 5 Family Dwellings (A B C & D)
Number
Average Value
Number
Average Value
Number
Average Value
Number
Average Value
Number
Average Value
Number
Average Value
LOANS ORIGINATED
65
$136,986
93
$121,048
241
$90,972
75
$26,994
0
$0
41
$81,185
APPLICATIONS APPROVED, NOT ACCEPTED
5
$110,198
3
$169,007
21
$126,015
5
$17,612
0
$0
11
$106,564
APPLICATIONS DENIED
15
$97,235
24
$96,547
164
$116,372
117
$54,689
2
$46,880
28
$77,560
APPLICATIONS WITHDRAWN
4
$120,612
8
$145,344
77
$133,489
3
$34,803
0
$0
8
$93,182
FILES CLOSED FOR INCOMPLETENESS
3
$97,640
6
$121,513
9
$115,696
1
$29,360
0
$0
0
$0
Aggregated Statistics For Year 2007 (Based on 16 partial tracts)
A) FHA, FSA/RHS & VA Home Purchase Loans
B) Conventional Home Purchase Loans
C) Refinancings
D) Home Improvement Loans
F) Non-occupant Loans on < 5 Family Dwellings (A B C & D)
G) Loans On Manufactured Home Dwelling (A B C & D)
Number
Average Value
Number
Average Value
Number
Average Value
Number
Average Value
Number
Average Value
Number
Average Value
LOANS ORIGINATED
23
$123,015
219
$121,749
325
$98,572
114
$38,805
68
$96,973
1
$44,630
APPLICATIONS APPROVED, NOT ACCEPTED
0
$0
25
$125,353
46
$96,061
23
$48,223
10
$56,848
0
$0
APPLICATIONS DENIED
0
$0
56
$99,277
201
$102,396
106
$37,033
39
$69,251
2
$80,385
APPLICATIONS WITHDRAWN
8
$132,244
33
$104,494
107
$110,349
2
$77,525
6
$133,697
2
$38,775
FILES CLOSED FOR INCOMPLETENESS
0
$0
19
$120,511
35
$116,460
3
$50,047
3
$93,700
0
$0
Aggregated Statistics For Year 2006 (Based on 16 partial tracts)
A) FHA, FSA/RHS & VA Home Purchase Loans
B) Conventional Home Purchase Loans
C) Refinancings
D) Home Improvement Loans
F) Non-occupant Loans on < 5 Family Dwellings (A B C & D)
G) Loans On Manufactured Home Dwelling (A B C & D)
Number
Average Value
Number
Average Value
Number
Average Value
Number
Average Value
Number
Average Value
Number
Average Value
LOANS ORIGINATED
27
$115,417
273
$101,855
382
$82,929
150
$36,375
78
$75,678
0
$0
APPLICATIONS APPROVED, NOT ACCEPTED
2
$48,320
43
$121,282
57
$91,207
14
$54,827
11
$94,204
0
$0
APPLICATIONS DENIED
0
$0
70
$78,295
237
$95,280
132
$27,823
37
$75,072
2
$4,690
APPLICATIONS WITHDRAWN
3
$96,873
22
$74,827
170
$93,029
15
$61,749
12
$81,922
0
$0
FILES CLOSED FOR INCOMPLETENESS
0
$0
19
$89,830
36
$96,299
4
$52,318
5
$62,128
0
$0
Aggregated Statistics For Year 2005 (Based on 16 partial tracts)
A) FHA, FSA/RHS & VA Home Purchase Loans
B) Conventional Home Purchase Loans
C) Refinancings
D) Home Improvement Loans
E) Loans on Dwellings For 5+ Families
F) Non-occupant Loans on < 5 Family Dwellings (A B C & D)
Number
Average Value
Number
Average Value
Number
Average Value
Number
Average Value
Number
Average Value
Number
Average Value
LOANS ORIGINATED
21
$108,835
233
$79,191
378
$73,892
156
$32,973
2
$82,510
96
$65,855
APPLICATIONS APPROVED, NOT ACCEPTED
2
$91,870
32
$80,211
68
$67,129
6
$28,797
0
$0
15
$49,053
APPLICATIONS DENIED
2
$144,620
58
$93,681
246
$74,144
141
$28,479
0
$0
61
$44,440
APPLICATIONS WITHDRAWN
0
$0
29
$84,136
153
$81,092
22
$80,548
0
$0
18
$61,990
FILES CLOSED FOR INCOMPLETENESS
1
$259,540
5
$121,968
39
$80,896
2
$12,945
0
$0
0
$0
Aggregated Statistics For Year 2004 (Based on 16 partial tracts)
A) FHA, FSA/RHS & VA Home Purchase Loans
B) Conventional Home Purchase Loans
C) Refinancings
D) Home Improvement Loans
F) Non-occupant Loans on < 5 Family Dwellings (A B C & D)
G) Loans On Manufactured Home Dwelling (A B C & D)
Number
Average Value
Number
Average Value
Number
Average Value
Number
Average Value
Number
Average Value
Number
Average Value
LOANS ORIGINATED
24
$77,467
245
$66,157
299
$61,490
124
$31,399
104
$58,408
2
$51,775
APPLICATIONS APPROVED, NOT ACCEPTED
7
$66,889
25
$81,988
66
$67,672
14
$51,587
21
$62,024
0
$0
APPLICATIONS DENIED
2
$79,110
33
$56,716
257
$65,530
128
$24,687
30
$36,436
0
$0
APPLICATIONS WITHDRAWN
2
$56,220
29
$76,389
137
$73,323
26
$48,541
22
$56,473
0
$0
FILES CLOSED FOR INCOMPLETENESS
2
$139,235
11
$76,383
41
$74,839
2
$30,200
2
$53,795
0
$0
Aggregated Statistics For Year 2003 (Based on 16 partial tracts)
A) FHA, FSA/RHS & VA Home Purchase Loans
B) Conventional Home Purchase Loans
C) Refinancings
D) Home Improvement Loans
E) Loans on Dwellings For 5+ Families
F) Non-occupant Loans on < 5 Family Dwellings (A B C & D)
Number
Average Value
Number
Average Value
Number
Average Value
Number
Average Value
Number
Average Value
Number
Average Value
LOANS ORIGINATED
43
$67,950
149
$58,834
323
$52,454
115
$24,921
2
$102,760
73
$45,096
APPLICATIONS APPROVED, NOT ACCEPTED
7
$56,937
15
$46,608
86
$54,000
23
$38,786
0
$0
17
$51,499
APPLICATIONS DENIED
11
$60,625
39
$65,955
240
$57,885
106
$25,800
0
$0
28
$41,298
APPLICATIONS WITHDRAWN
3
$92,020
22
$46,368
102
$56,950
15
$33,049
0
$0
8
$41,324
FILES CLOSED FOR INCOMPLETENESS
1
$70,530
3
$53,970
18
$53,666
6
$33,085
0
$0
3
$53,787
Aggregated Statistics For Year 2002 (Based on 16 partial tracts)
A) FHA, FSA/RHS & VA Home Purchase Loans
B) Conventional Home Purchase Loans
C) Refinancings
D) Home Improvement Loans
F) Non-occupant Loans on < 5 Family Dwellings (A B C & D)
Number
Average Value
Number
Average Value
Number
Average Value
Number
Average Value
Number
Average Value
LOANS ORIGINATED
55
$57,626
101
$53,866
209
$375,538
62
$26,750
41
$46,847
APPLICATIONS APPROVED, NOT ACCEPTED
2
$40,555
9
$37,769
63
$49,955
11
$23,131
2
$16,435
APPLICATIONS DENIED
2
$66,985
10
$43,396
190
$51,678
55
$16,025
15
$44,405
APPLICATIONS WITHDRAWN
4
$15,559,860
8
$52,095
101
$53,035
9
$46,756
5
$12,448,700
FILES CLOSED FOR INCOMPLETENESS
0
$0
5
$65,140
25
$64,904
2
$32,790
2
$60,475
Aggregated Statistics For Year 2001 (Based on 16 partial tracts)
A) FHA, FSA/RHS & VA Home Purchase Loans
B) Conventional Home Purchase Loans
C) Refinancings
D) Home Improvement Loans
F) Non-occupant Loans on < 5 Family Dwellings (A B C & D)
Number
Average Value
Number
Average Value
Number
Average Value
Number
Average Value
Number
Average Value
LOANS ORIGINATED
59
$47,256
89
$44,363
128
$45,605
65
$20,304
30
$35,224
APPLICATIONS APPROVED, NOT ACCEPTED
3
$46,130
10
$74,234
33
$52,795
10
$16,138
5
$59,046
APPLICATIONS DENIED
8
$50,998
16
$44,801
144
$46,539
51
$12,755
8
$30,359
APPLICATIONS WITHDRAWN
4
$61,798
14
$67,923
67
$42,682
12
$18,877
1
$30,150
FILES CLOSED FOR INCOMPLETENESS
3
$54,047
3
$28,610
13
$44,455
2
$9,490
0
$0
Aggregated Statistics For Year 2000 (Based on 16 partial tracts)
A) FHA, FSA/RHS & VA Home Purchase Loans
B) Conventional Home Purchase Loans
C) Refinancings
D) Home Improvement Loans
F) Non-occupant Loans on < 5 Family Dwellings (A B C & D)
Number
Average Value
Number
Average Value
Number
Average Value
Number
Average Value
Number
Average Value
LOANS ORIGINATED
65
$54,183
80
$44,218
89
$43,508
64
$16,334
17
$41,901
APPLICATIONS APPROVED, NOT ACCEPTED
4
$65,252
1
$44,210
26
$59,723
18
$17,632
4
$128,425
APPLICATIONS DENIED
2
$48,615
39
$53,942
124
$43,949
90
$14,415
5
$41,740
APPLICATIONS WITHDRAWN
1
$51,670
20
$46,942
80
$43,254
16
$16,377
8
$66,739
FILES CLOSED FOR INCOMPLETENESS
0
$0
6
$47,755
6
$51,158
3
$53,280
0
$0
Aggregated Statistics For Year 1999 (Based on 7 partial tracts)
A) FHA, FSA/RHS & VA Home Purchase Loans
B) Conventional Home Purchase Loans
C) Refinancings
D) Home Improvement Loans
F) Non-occupant Loans on < 5 Family Dwellings (A B C & D)
2010 - 2018 National Fire Incident Reporting System (NFIRS) incidents
According to the data from the years 2010 - 2018 the average number of fire incidents per year is 72. The highest number of reported fires - 96 took place in 2011, and the least - 0 in 2016. The data has a rising trend.
When looking into fire subcategories, the most incidents belonged to: Outside Fires (56.1%), and Mobile Property/Vehicle Fires (25.2%).
Fire incident types reported to NFIRS in Zip Code 19137

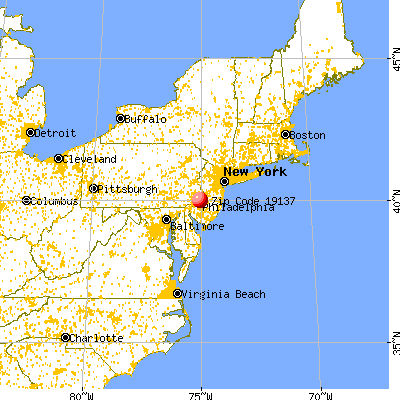


 Nearest zip codes: 08110, 19124, 19134, 19135, 08065, 19149.


 According to the data from the years 2010 - 2018 the average number of fire incidents per year is 72. The highest number of reported fires - 96 took place in 2011, and the least - 0 in 2016. The data has a rising trend.
 When looking into fire subcategories, the most incidents belonged to: Outside Fires (56.1%), and Mobile Property/Vehicle Fires (25.2%).