Estimated zip code population in 2022: 35,056 Zip code population in 2010: 33,207 Zip code population in 2000: 31,853
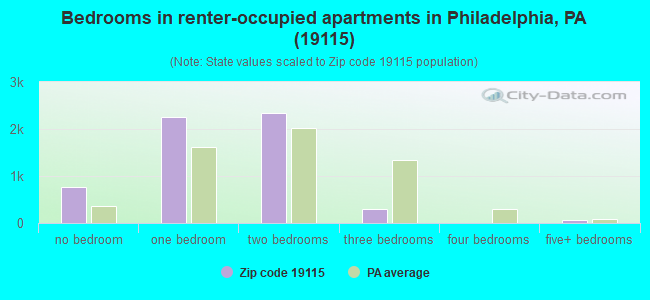
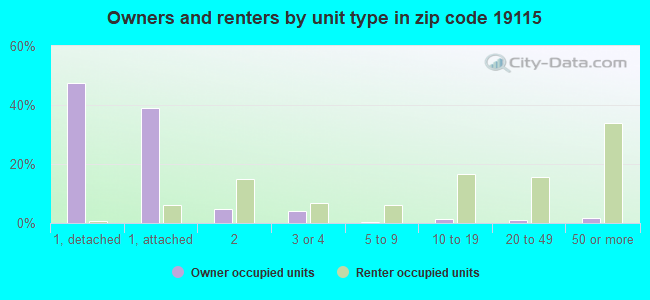
Houses and condos: 15,294 Renter-occupied apartments: 5,607
% of renters here:
38%
State:
31%
March 2022 cost of living index in zip code 19115: 104.9 (near average, U.S. average is 100)
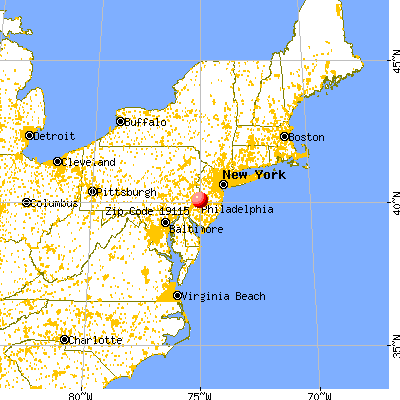
Land area: 5.6 sq. mi. Water area: 0.1 sq. mi.
Population density: 6,244 people per square mile
(high).
OSM Map
General Map
Google Map
MSN Map
OSM Map
General Map
Google Map
MSN Map
OSM Map
General Map
Google Map
MSN Map
OSM Map
General Map
Google Map
MSN Map
Please wait while loading the map...
Real estate property taxes paid for housing units in 2022:
This zip code:
0.9% ($3,010)
Pennsylvania:
1.3% ($3,094)
Median real estate property taxes paid for housing units with mortgages in 2022: $3,109 (0.9%) Median real estate property taxes paid for housing units with no mortgage in 2022: $2,895 (0.9%)
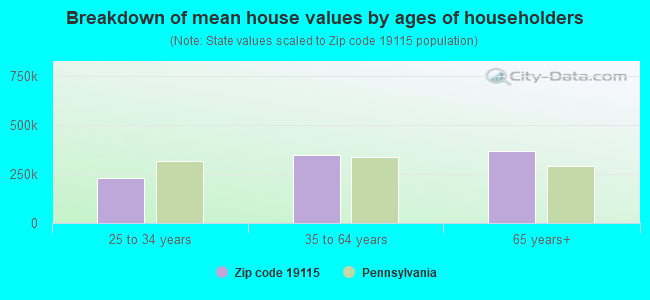
Estimated median house/condo value in 2022: $324,729
19115:
$324,729
Pennsylvania:
$245,500
According to our research of Pennsylvania and other state lists, there were 7 registered sex offenders living in 19115 zip code as of April 27, 2024. The ratio of all residents to sex offenders in zip code 19115 is 4,721 to 1. The ratio of registered sex offenders to all residents in this zip code is much lower than the state average.
Median resident age:
This zip code:
44.8 years
Pennsylvania median age:
40.9 years
Average household size:
This zip code:
2.3 people
Pennsylvania:
2.4 people
Averages for the 2020 tax year for zip code 19115, filed in 2021:
Average Adjusted Gross Income (AGI) in 2020: $59,932 (Individual Income Tax Returns)
Here:
$59,932
State:
$75,707
Salary/wage: $56,306 (reported on 73.8% of returns)
Here:
$56,306
State:
$62,806
(% of AGI for various income ranges: 938.4% for AGIs below $25k, 3282.2% for AGIs $25k-50k, 6451.5% for AGIs $50k-75k, 9792.3% for AGIs $75k-100k, 19120.1% for AGIs $100k-200k, 59400.0% for AGIs over 200k)
Taxable interest for individuals: $1,482 (reported on 35.5% of returns)
This zip code:
$1,482
Pennsylvania:
$1,633
(% of AGI for various income ranges: 35.8% for AGIs below $25k, 42.3% for AGIs $25k-50k, 62.8% for AGIs $50k-75k, 123.9% for AGIs $75k-100k, 164.8% for AGIs $100k-200k, 1243.8% for AGIs over 200k)
Ordinary dividends: $4,359 (reported on 16.2% of returns)
Here:
$4,359
State:
$7,382
(% of AGI for various income ranges: 30.6% for AGIs below $25k, 40.6% for AGIs $25k-50k, 69.9% for AGIs $50k-75k, 127.1% for AGIs $75k-100k, 226.2% for AGIs $100k-200k, 2922.3% for AGIs over 200k)
Net capital gain/loss in AGI: +$9,309 (reported on 15.5% of returns)
Here:
+$9,309
State:
+$23,522
(% of AGI for various income ranges: 21.1% for AGIs below $25k, 34.9% for AGIs $25k-50k, 72.0% for AGIs $50k-75k, 166.0% for AGIs $75k-100k, 449.1% for AGIs $100k-200k, 9952.3% for AGIs over 200k)
Profit/loss from business: +$11,361 (reported on 18.7% of returns)
Here:
+$11,361
State:
+$16,274
(% of AGI for various income ranges: 271.5% for AGIs below $25k, 361.3% for AGIs $25k-50k, 374.6% for AGIs $50k-75k, 279.9% for AGIs $75k-100k, 272.2% for AGIs $100k-200k, 1879.2% for AGIs over 200k)
Taxable individual retirement arrangement distribution: $14,507 (reported on 9.2% of returns)
19115:
$14,507
Pennsylvania:
$18,583
(% of AGI for various income ranges: 77.3% for AGIs below $25k, 93.6% for AGIs $25k-50k, 150.2% for AGIs $50k-75k, 332.5% for AGIs $75k-100k, 478.2% for AGIs $100k-200k, 3083.1% for AGIs over 200k)
Self-employed (Keogh) retirement plans: $33,050 (reported on 0.1% of returns)
19115:
$33,050
Pennsylvania:
$25,407
(% of AGI for various income ranges: 36.5% for AGIs $50k-75k)
Total itemized deductions: $27,260 (reported on 7.6% of returns)
Here:
$27,260
State:
$34,850
(% of AGI for various income ranges: 55.7% for AGIs below $25k, 108.6% for AGIs $25k-50k, 297.6% for AGIs $50k-75k, 587.5% for AGIs $75k-100k, 935.3% for AGIs $100k-200k, 3782.3% for AGIs over 200k)
Charity contributions: $6,370 (reported on 6.2% of returns)
Here:
$6,370
State:
$12,392
(% of AGI for various income ranges: 1.0% for AGIs below $25k, 14.6% for AGIs $25k-50k, 42.0% for AGIs $50k-75k, 111.5% for AGIs $75k-100k, 209.2% for AGIs $100k-200k, 942.3% for AGIs over 200k)
Taxes paid: $8,270 (reported on 7.6% of returns)
19115:
$8,270
State:
$8,200
(% of AGI for various income ranges: 5.9% for AGIs below $25k, 25.8% for AGIs $25k-50k, 95.7% for AGIs $50k-75k, 193.6% for AGIs $75k-100k, 319.8% for AGIs $100k-200k, 929.2% for AGIs over 200k)
Earned income credit: $2,135 (reported on 14.8% of returns)
Here:
$2,135
State:
$2,100
(% of AGI for various income ranges: 86.4% for AGIs below $25k, 82.5% for AGIs $25k-50k, 1.2% for AGIs $50k-75k)
Percentage of individuals using paid preparers for their 2020 taxes: 90.0%
Here:
90%
State:
92%
(% for various income ranges: 88.8% for AGIs below $25k, 91.6% for AGIs $25k-50k, 90.0% for AGIs $50k-75k, 89.8% for AGIs $75k-100k, 90.2% for AGIs $100k-200k, 90.9% for AGIs over 200k)
Averages for the 2012 tax year for zip code 19115, filed in 2013:
Average Adjusted Gross Income (AGI) in 2012: $51,279 (Individual Income Tax Returns)
Here:
$51,279
State:
$61,346
Salary/wage: $49,653 (reported on 77.3% of returns)
Here:
$49,653
State:
$51,902
(% of AGI for various income ranges: 58.8% for AGIs below $25k, 73.7% for AGIs $25k-50k, 77.3% for AGIs $50k-75k, 77.1% for AGIs $75k-100k, 80.8% for AGIs $100k-200k, 58.4% for AGIs over 200k)
Taxable interest for individuals: $1,446 (reported on 42.9% of returns)
This zip code:
$1,446
Pennsylvania:
$1,588
(% of AGI for various income ranges: 2.8% for AGIs below $25k, 1.4% for AGIs $25k-50k, 1.0% for AGIs $50k-75k, 1.0% for AGIs $75k-100k, 0.8% for AGIs $100k-200k, 1.8% for AGIs over 200k)
Ordinary dividends: $3,274 (reported on 19.7% of returns)
Here:
$3,274
State:
$5,827
(% of AGI for various income ranges: 2.4% for AGIs below $25k, 1.2% for AGIs $25k-50k, 1.1% for AGIs $50k-75k, 1.0% for AGIs $75k-100k, 0.9% for AGIs $100k-200k, 2.5% for AGIs over 200k)
Net capital gain/loss in AGI: +$2,750 (reported on 14.3% of returns)
Here:
+$2,750
State:
+$14,495
(% of AGI for various income ranges: 0.2% for AGIs $25k-50k, 0.2% for AGIs $50k-75k, 0.4% for AGIs $75k-100k, 0.8% for AGIs $100k-200k, 6.0% for AGIs over 200k)
Profit/loss from business: +$11,438 (reported on 12.9% of returns)
Here:
+$11,438
State:
+$16,268
(% of AGI for various income ranges: 11.8% for AGIs below $25k, 3.9% for AGIs $25k-50k, 1.5% for AGIs $50k-75k, 1.5% for AGIs $75k-100k, 1.6% for AGIs $100k-200k, 2.3% for AGIs over 200k)
Taxable individual retirement arrangement distribution: $10,725 (reported on 12.8% of returns)
19115:
$10,725
Pennsylvania:
$14,550
(% of AGI for various income ranges: 5.3% for AGIs below $25k, 3.0% for AGIs $25k-50k, 2.0% for AGIs $50k-75k, 2.4% for AGIs $75k-100k, 2.0% for AGIs $100k-200k, 4.0% for AGIs over 200k)
Self-employment retirement plans: $9,150 (reported on 0.3% of returns)
19115:
$9,150
Pennsylvania:
$20,922
Total itemized deductions: $20,473 (24% of AGI, reported on 36.7% of returns)
Here:
$20,473
State:
$23,538
Here:
23.5% of AGI
State:
18.4% of AGI
(% of AGI for various income ranges: 12.0% for AGIs below $25k, 11.2% for AGIs $25k-50k, 14.3% for AGIs $50k-75k, 16.0% for AGIs $75k-100k, 17.0% for AGIs $100k-200k, 13.6% for AGIs over 200k)
Charity contributions: $2,499 (reported on 31.2% of returns)
Here:
$2,499
State:
$4,025
(% of AGI for various income ranges: 0.7% for AGIs below $25k, 1.0% for AGIs $25k-50k, 1.4% for AGIs $50k-75k, 1.7% for AGIs $75k-100k, 2.0% for AGIs $100k-200k, 1.7% for AGIs over 200k)
Taxes paid: $8,605 (reported on 36.6% of returns)
19115:
$8,605
State:
$9,982
(% of AGI for various income ranges: 2.7% for AGIs below $25k, 3.4% for AGIs $25k-50k, 5.6% for AGIs $50k-75k, 6.8% for AGIs $75k-100k, 8.3% for AGIs $100k-200k, 7.3% for AGIs over 200k)
Earned income credit: $2,014 (reported on 14.1% of returns)
Here:
$2,014
State:
$2,106
(% of AGI for various income ranges: 4.8% for AGIs below $25k, 0.8% for AGIs $25k-50k)
Percentage of individuals using paid preparers for their 2012 taxes: 61.0%
Here:
61%
State:
53%
(% for various income ranges: 59.5% for AGIs below $25k, 58.1% for AGIs $25k-50k, 61.5% for AGIs $50k-75k, 63.4% for AGIs $75k-100k, 67.5% for AGIs $100k-200k, 70.0% for AGIs over 200k)
Averages for the 2004 tax year for zip code 19115, filed in 2005:
Average Adjusted Gross Income (AGI) in 2004: $44,425 (Individual Income Tax Returns)
Here:
$44,425
State:
$48,049
Salary/wage: $43,086 (reported on 77.1% of returns)
Here:
$43,086
State:
$42,646
(% of AGI for various income ranges: 90.2% for AGIs below $10k, 59.8% for AGIs $10k-25k, 75.8% for AGIs $25k-50k, 78.6% for AGIs $50k-75k, 80.8% for AGIs $75k-100k, 71.4% for AGIs over 100k)
Taxable interest for individuals: $2,314 (reported on 60.6% of returns)
This zip code:
$2,314
Pennsylvania:
$1,657
(% of AGI for various income ranges: 12.4% for AGIs below $10k, 6.8% for AGIs $10k-25k, 3.4% for AGIs $25k-50k, 3.0% for AGIs $50k-75k, 2.1% for AGIs $75k-100k, 2.3% for AGIs over 100k)
Taxable dividends: $2,400 (reported on 28.5% of returns)
Here:
$2,400
State:
$3,566
(% of AGI for various income ranges: 7.5% for AGIs below $10k, 3.0% for AGIs $10k-25k, 1.5% for AGIs $25k-50k, 1.3% for AGIs $50k-75k, 1.2% for AGIs $75k-100k, 1.2% for AGIs over 100k)
Net capital gain/loss: +$5,613 (reported on 21.4% of returns)
Here:
+$5,613
State:
+$9,716
(% of AGI for various income ranges: -3.6% for AGIs below $10k, -0.1% for AGIs $10k-25k, 0.3% for AGIs $25k-50k, 0.7% for AGIs $50k-75k, 1.4% for AGIs $75k-100k, 7.4% for AGIs over 100k)
Profit/loss from business: +$10,747 (reported on 11.2% of returns)
Here:
+$10,747
State:
+$14,267
(% of AGI for various income ranges: 13.3% for AGIs below $10k, 6.8% for AGIs $10k-25k, 2.6% for AGIs $25k-50k, 1.1% for AGIs $50k-75k, 1.7% for AGIs $75k-100k, 2.8% for AGIs over 100k)
IRA payment deduction: $3,332 (reported on 3.6% of returns)
19115:
$3,332
Pennsylvania:
$2,903
(% of AGI for various income ranges: 0.5% for AGIs below $10k, 0.4% for AGIs $10k-25k, 0.5% for AGIs $25k-50k, 0.3% for AGIs $50k-75k, 0.2% for AGIs $75k-100k, 0.1% for AGIs over 100k)
Self-employed pension: $11,829 (reported on 0.5% of returns)
Here:
$11,829
Pennsylvania:
$14,674
Total itemized deductions: $17,732 (24% of AGI, reported on 39.7% of returns)
Here:
$17,732
State:
$18,804
Here:
23.7% of AGI
State:
19.5% of AGI
(% of AGI for various income ranges: 15.8% for AGIs below $10k, 12.0% for AGIs $10k-25k, 13.3% for AGIs $25k-50k, 16.9% for AGIs $50k-75k, 18.0% for AGIs $75k-100k, 16.7% for AGIs over 100k)
Charity contributions deductions: $2,401 (3% of AGI, reported on 36.4% of returns)
Here:
$2,401
State:
$3,337
Here:
3.1% of AGI
State:
3.3% of AGI
(% of AGI for various income ranges: 0.7% for AGIs below $10k, 1.1% for AGIs $10k-25k, 1.6% for AGIs $25k-50k, 2.2% for AGIs $50k-75k, 2.3% for AGIs $75k-100k, 2.2% for AGIs over 100k)
Total tax: $5,931 (reported on 77.8% of returns)
19115:
$5,931
State:
$8,008
(% of AGI for various income ranges: 3.4% for AGIs below $10k, 4.3% for AGIs $10k-25k, 7.4% for AGIs $25k-50k, 9.2% for AGIs $50k-75k, 9.9% for AGIs $75k-100k, 15.5% for AGIs over 100k)
Earned income credit: $1,453 (reported on 9.3% of returns)
Here:
$1,453
State:
$1,643
Percentage of individuals using paid preparers for their 2004 taxes: 60.3%
Here:
60%
State:
56%
(% for various income ranges: 56.8% for AGIs below $10k, 62.4% for AGIs $10k-25k, 59.0% for AGIs $25k-50k, 59.9% for AGIs $50k-75k, 60.4% for AGIs $75k-100k, 66.5% for AGIs over 100k)
Likely homosexual households (counted as self-reported same-sex unmarried-partner households)
Lesbian couples: 0.2% of all households
Gay men: 0.0% of all households
Household received Food Stamps/SNAP in the past 12 months: 2,182 Household did not receive Food Stamps/SNAP in the past 12 months: 12,754
Women who had a birth in the past 12 months: 679 (543 now married, 146 unmarried) Women who did not have a birth in the past 12 months: 6,765 (2,900 now married, 3,857 unmarried)
Housing units in zip code 19115 with a mortgage: 5,046 (1,042 second mortgage, 116 home equity loan, 856 both second mortgage and home equity loan) Houses without a mortgage: 312
Median monthly owner costs for units with a mortgage: $1,873 Median monthly owner costs for units without a mortgage: $631
Residents with income below the poverty level in 2022:
This zip code:
10.7%
Whole state:
11.8%
Residents with income below 50% of the poverty level in 2022:
This zip code:
6.5%
Whole state:
6.1%
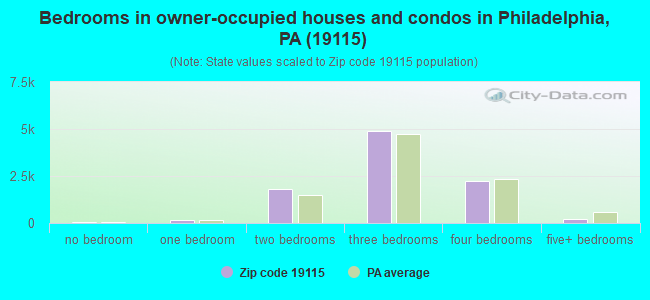
Median number of rooms in houses and condos:
Here:
6.4
State:
6.8
Median number of rooms in apartments:
Here:
3.7
State:
4.3
Notable locations in this zip code not listed on our city pages
Notable locations in zip code 19115: Presidential Plaza (A), Harpers (B), Bustleton Avenue Branch Library Free Library of Philadelphia (C), Philadelphia Fire Department Engine 62 (D), Philadelphia District 7 Police Station (E), Welsh Road Branch Library Free Library of Philadelphia (F). Display/hide their locations on the map
Churches in zip code 19115 include: Greater Northeast Congregation (A), Lehigh Church (B), Pennypack Baptist Church (C), Shaare Shamayim-Beth Judah (D), Bustleton United Methodist (E), Temple Beth-Torah (F), Bethesda Church (G). Display/hide their locations on the map
3,881 married couples with children.
1,572 single-parent households (409 men, 1,163 women).
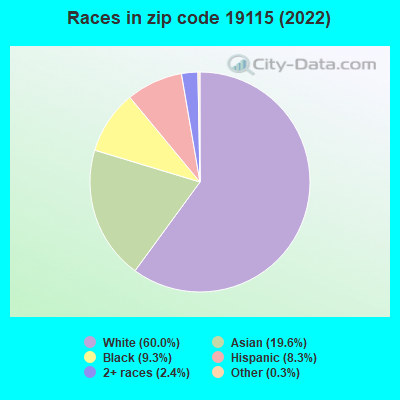
59.5% of residents of 19115 zip code speak English at home.
5.2% of residents speak Spanish at home (56% very well, 28% well, 14% not well, 2% not at all).
21.3% of residents speak other Indo-European language at home (38% very well, 32% well, 24% not well, 5% not at all).
11.7% of residents speak Asian or Pacific Island language at home (42% very well, 28% well, 26% not well, 4% not at all).
3.2% of residents speak other language at home (72% very well, 20% well, 6% not well, 2% not at all).
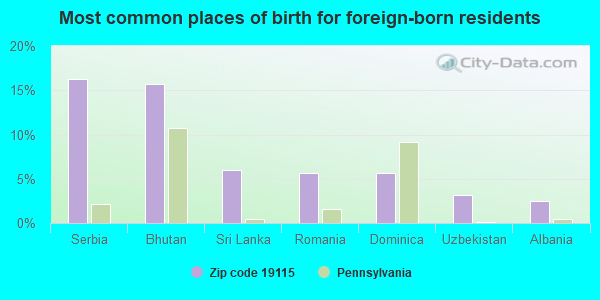
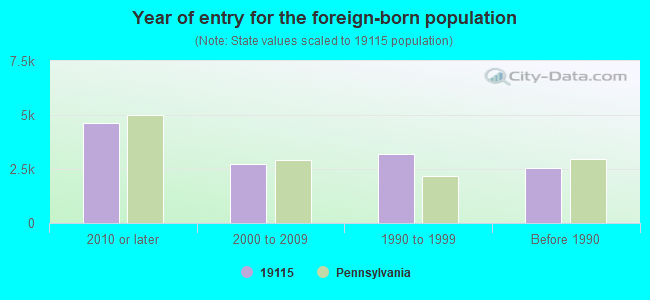
Foreign born population: 12,326 (35.2%) (68.4% of them are naturalized citizens)
Facilities with environmental interests located in this zip code:
BALDI C C A MID (VERREE RD & ALBURGER AVE in PHILADELPHIA, PA)
STATE MASTER (Pennsylvania database) - RCRIS-PAD122818537, HAZARDOUS WASTE PROGRAM Conditionally Exempt Small Quantity Generators, less than 100 kg/month of hazardous waste (Resource Conservation and Recovery Act (tracking hazardous waste)) - notification Organizations: OPERNAME (CONTACT/OPERATOR)
, SCHOOL DIST OF PHILA (CONTACT/OWNER)
Alternative names: BALDI C C A MIDDLE
BALDI C C A MS (8801 VERREE RD in PHILADELPHIA, PA)
(National Center for Education Statistics) - STATE ID-6824 Organizations: PHILADELPHIA CITY SD (SCHOOL DISTRICT)
AMOCO SUPER CAR WASH (1914 GRANT AVE. in PHILADELPHIA, PA)
(Integrated Compliance Information System) - ICIS-03-1989-0135, FORMAL ENFORCEMENT ACTION
7-ELEVEN #25394 (KREWSTOWN ROAD AT SURREY ROAD in PHILADELPHIA, PA)
STATE MASTER (Pennsylvania database) (Resource Conservation and Recovery Act (tracking hazardous waste)) Organizations: OPERNAME (CONTACT/OPERATOR)
, 7 ELEVEN INC (CONTACT/OWNER)
Alternative names: 7 ELEVEN 25394
BETTY BRITE 1 HOUR CLEANER SERVICE (8915 KREWSTOWN ROAD in PHILADELPHIA, PA)
AIR MINOR (AIRS/AFS) Conditionally Exempt Small Quantity Generators, less than 100 kg/month of hazardous waste (Resource Conservation and Recovery Act (tracking hazardous waste)) Business SIC classification: DRYCLEANING PLANTS, EXCEPT RUG CLEANING Organizations: OPERNAME (CONTACT/OPERATOR)
, PARK, CHUNG (CONTACT/OWNER)
Alternative names: BETTY BRITE ONE HOUR, BETTY BRITE ONE HOUR CLEANERS
BAUM PRINTING (9985 GANTRY RD in PHILADELPHIA, PA)
AIR SYNTHETIC MINOR (AIRS/AFS) CRITERIA AND HAZARDOUS AIR POLLUTANT INVENTORY (Inventory of air pollution sources) Small Quantity Generators, between 100 kg and 1000 kg of hazardous waste/month (Resource Conservation and Recovery Act (tracking hazardous waste)) - notification Business SIC classification: PERIODICALS: PUBLISHING, OR PUBLISHING AND PRINTING; COMMERCIAL PRINTING, LITHOGRAPHIC Business NAICS classification: COMMERCIAL LITHOGRAPHIC PRINTING.; OTHER COMMERCIAL PRINTING.; TRADEBINDING AND RELATED WORK.; PREPRESS SERVICES. Organizations: OPERNAME (CONTACT/OPERATOR)
, LANSON, JOHN (CONTACT/OWNER)
Alternative names: BAUM PRINTING INCORPORATED MANUFACTURING
ACTION TRANSMISSION (9855 BUSTLETON AVE in PHILADELPHIA, PA)
Small Quantity Generators, between 100 kg and 1000 kg of hazardous waste/month (Resource Conservation and Recovery Act (tracking hazardous waste)) - notification Business NAICS classification: AUTOMOTIVE TRANSMISSION REPAIR. Organizations: OPERNAME (CONTACT/OPERATOR)
, REVERE TRANSMISSIONS (CONTACT/OWNER)
Alternative names: ACTION TRANS SVC
ADVANTAGE AUTO BODY (9851 NORTHEAST AVENUE in PHILADELPHIA, PA)
Conditionally Exempt Small Quantity Generators, less than 100 kg/month of hazardous waste (Resource Conservation and Recovery Act (tracking hazardous waste)) - notification Organizations: WILSON RUDY (CONTACT/OWNER)
ALBERTS AUTO (1909 GRANT AVE in PHILADELPHIA, PA)
Conditionally Exempt Small Quantity Generators, less than 100 kg/month of hazardous waste (Resource Conservation and Recovery Act (tracking hazardous waste)) - notification
AMOCO 602 TANKS (1914 GRANT AVE TANKS in PHILADELPHIA, PA)
Small Quantity Generators, between 100 kg and 1000 kg of hazardous waste/month (Resource Conservation and Recovery Act (tracking hazardous waste)) - notification Organizations: AMOCO OIL COMPANY (CONTACT/OWNER)
Housing units lacking complete plumbing facilities: 0.5% Housing units lacking complete kitchen facilities: 1.2%
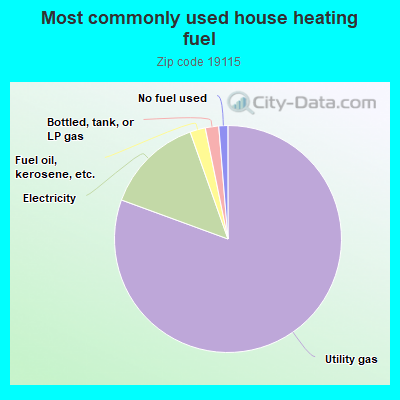
80.6%Utility gas
14.0%Electricity
2.2%Fuel oil, kerosene, etc.
1.9%Bottled, tank, or LP gas
1.3%No fuel used
Population in 1990: 31,339. Population change in the 1990s: +514 (+1.6%).
Place of birth for U.S.-born residents:
This state: 18,678
Northeast: 1,977
Midwest: 532
South: 903
West: 49
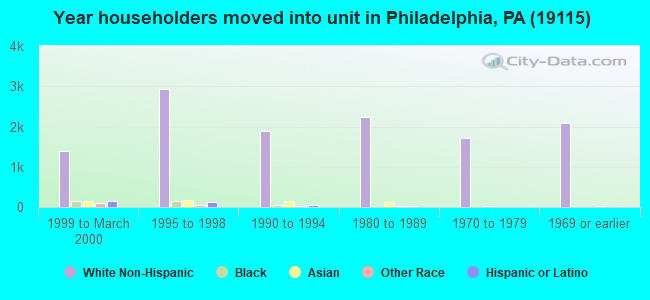
68% of the 19115 zip code residents lived in the same house 5 years ago. Out of people who lived in different houses, 81% lived in this county. Out of people who lived in different counties, 50% lived in Pennsylvania.
90% of the 19115 zip code residents lived in the same house 1 year ago. Out of people who lived in different houses, 59% moved from this county. Out of people who lived in different houses, 5% moved from different county within same state. Out of people who lived in different houses, 25% moved from different state. Out of people who lived in different houses, 12% moved from abroad.
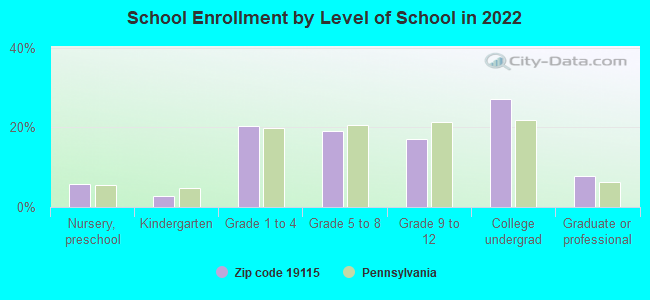
Private vs. public school enrollment:
Students in private schools in grades 1 to 8 (elementary and middle school): 759
Here:
27.0%
Pennsylvania:
15.7%
Students in private schools in grades 9 to 12 (high school): 463
Here:
38.1%
Pennsylvania:
13.4%
Students in private undergraduate colleges: 1,223
Here:
63.4%
Pennsylvania:
39.8%
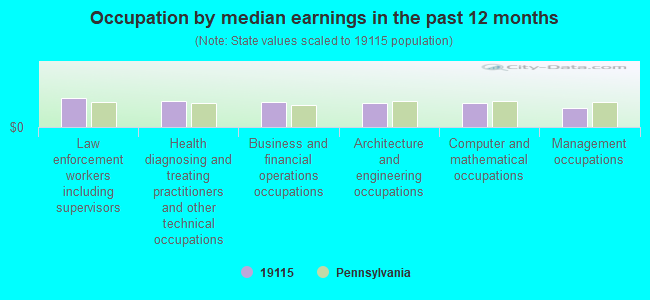
Occupation by median earnings in the past 12 months ($)
103,154Law enforcement workers including supervisors
90,715Health diagnosing and treating practitioners and other technical occupations
88,586Business and financial operations occupations
84,613Architecture and engineering occupations
83,915Computer and mathematical occupations
65,695Management occupations
Companies with federal contracts located in this zip code (PHILADELPHIA, PA):
J M T MACHINE COMPANY (9986 GANTRY RD; small business) : $873,418 in 23 contractsfrom 2000 to 2006
Contracts for Hardware, Commercial, Fittings for Rope, Cable, and Chain, Nuts and Washers, Vehicular Furniture and Accessories, and moreby Defense Logistics Agency, Navy, Army Signed by year:2000: $31,231; 2001: $145,937; 2002: $12,550; 2003: $209,969; 2004: $357,012; 2005: $94,409; 2006: $22,310.
Biggest contracts:
$217,938 with Defense Logistics Agency for Hardware, Commercial. Signed on 2004-04-06. Completion date: 2004-12-04.
$122,130 with Navy for Fittings for Rope, Cable, and Chain. Taking place in NY. Signed on 2003-04-17. Completion date: 2004-05-11.
$110,937, same as above.Signed on 2001-12-03. Completion date: 2002-05-03.
$87,839, same as above.Signed on 2003-05-20. Completion date: 2004-01-15.
SUNSHINE SCIENTIFIC INSTRUMENT (1810 GRANT AVENUE; small business) : $151,702 in 4 contractsfrom 2000 to 2002
$46,226 with Defense Logistics Agency for Electrical and Electronic Properties Measuring and Testing Instruments. Signed on 2000-07-05. Completion date: 2001-07-06.
$42,776, same as above.Signed on 2000-09-29. Completion date: 2000-10-19.
$36,100 with Air Force for Pressure, Temperature, and Humidity Measuring and Controlling Instruments. Signed on 2001-02-21. Completion date: 2001-06-15.
$26,600 with Defense Logistics Agency for Pressure, Temperature, and Humidity Measuring and Controlling Instruments. Signed on 2002-03-01. Completion date: 2002-07-08.
GENERAL ASPHALT PAVING CO (9301 KREWSTOWN ROAD) : $78,764 in 7 contractsfrom 2004 to 2006
Contracts for Maintenance, Repair and Rebuilding of Equipment -- Electrical and Electronic Equipment Components, Air Conditioning Equipment, Space and Water Heating Equipment by Navy Signed by year:2000: $0; 2001: $0; 2002: $0; 2003: $0; 2004: $15,280; 2005: $53,027; 2006: $10,457.
Biggest contracts:
$39,280 with Navy for Maintenance, Repair and Rebuilding of Equipment -- Electrical and Electronic Equipment Components. Signed on 2005-03-31. Completion date: 2005-04-30.
$10,457, same as above.Signed on 2006-02-28. Completion date: 2006-03-10.
$10,000, same as above.Signed on 2004-05-26. Completion date: 2005-06-14.
$7,629 with Navy for Air Conditioning Equipment. Signed on 2005-03-25. Completion date: 2005-04-11.
PAULA ETKIN (9825; small business) : $69,938 in 2 contractsin 2000
$69,938 with Navy for Cost Benefit AnalyseS. Signed on 2000-05-12. Completion date: 2000-05-12.
$0, same as above.Signed on 2000-05-12. Completion date: 2000-05-12.
ARMAMENT SERVICE INTERNATIONAL (101 GEIGER RD; small business)
$18,780 with Army for Weapons Maintenance and Repair Shop Specialized Equipment. Taking place in CA. Signed on 2005-08-22. Completion date: 2005-12-01.
Top industries in this zip code by the number of employees in 2005:
2010 - 2018 National Fire Incident Reporting System (NFIRS) incidents
According to the data from the years 2010 - 2018 the average number of fire incidents per year is 82. The highest number of reported fires - 133 took place in 2010, and the least - 0 in 2016. The data has a dropping trend.
When looking into fire subcategories, the most reports belonged to: Outside Fires (48.7%), and Structure Fires (41.0%).
Fire incident types reported to NFIRS in Zip Code 19115


 Nearest zip codes: 19152, 19116, 19114, 19111, 19009, 19136.
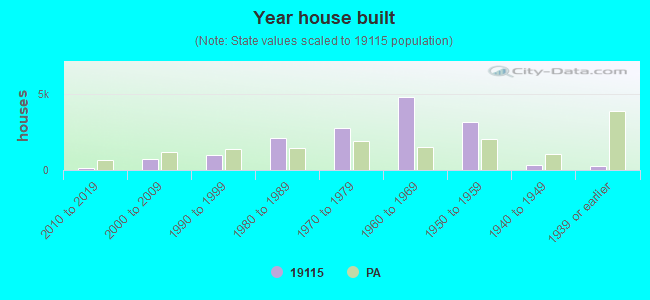


 According to the data from the years 2010 - 2018 the average number of fire incidents per year is 82. The highest number of reported fires - 133 took place in 2010, and the least - 0 in 2016. The data has a dropping trend.
 When looking into fire subcategories, the most reports belonged to: Outside Fires (48.7%), and Structure Fires (41.0%).