Estimated zip code population in 2022: 31,509 Zip code population in 2010: 30,907 Zip code population in 2000: 31,083
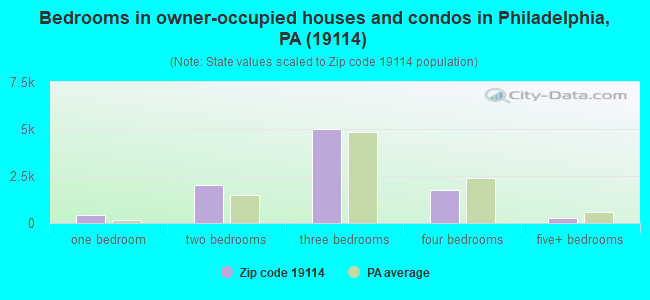
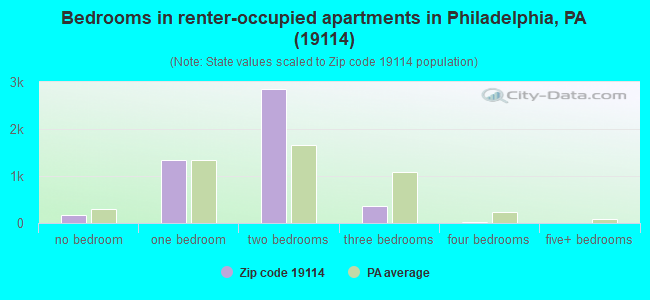
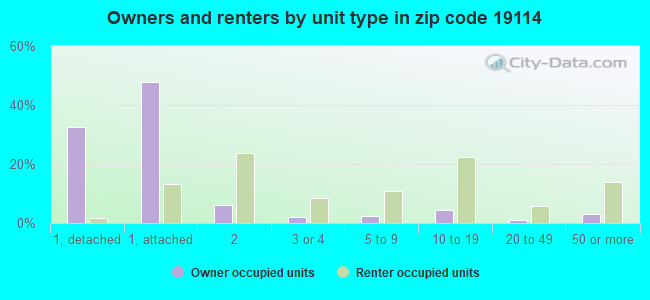
Houses and condos: 14,889 Renter-occupied apartments: 4,680
% of renters here:
33%
State:
31%
March 2022 cost of living index in zip code 19114: 104.0 (near average, U.S. average is 100)
Land area: 5.6 sq. mi. Water area: 0.3 sq. mi.
Population density: 5,627 people per square mile
(average).
OSM Map
General Map
Google Map
MSN Map
OSM Map
General Map
Google Map
MSN Map
OSM Map
General Map
Google Map
MSN Map
OSM Map
General Map
Google Map
MSN Map
Please wait while loading the map...
Real estate property taxes paid for housing units in 2022:
This zip code:
0.9% ($2,625)
Pennsylvania:
1.3% ($3,094)
Median real estate property taxes paid for housing units with mortgages in 2022: $2,578 (0.9%) Median real estate property taxes paid for housing units with no mortgage in 2022: $2,689 (0.9%)
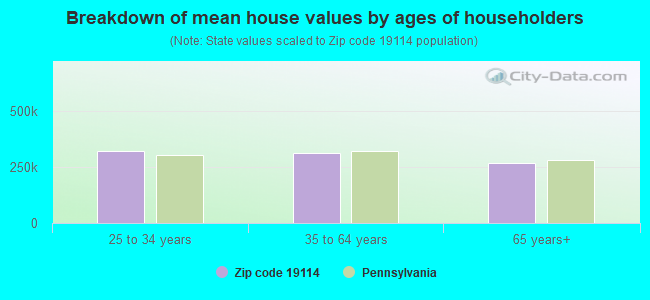
Estimated median house/condo value in 2022: $284,897
19114:
$284,897
Pennsylvania:
$245,500
According to our research of Pennsylvania and other state lists, there were 37 registered sex offenders living in 19114 zip code as of April 27, 2024. The ratio of all residents to sex offenders in zip code 19114 is 840 to 1. The ratio of registered sex offenders to all residents in this zip code is lower than the state average.
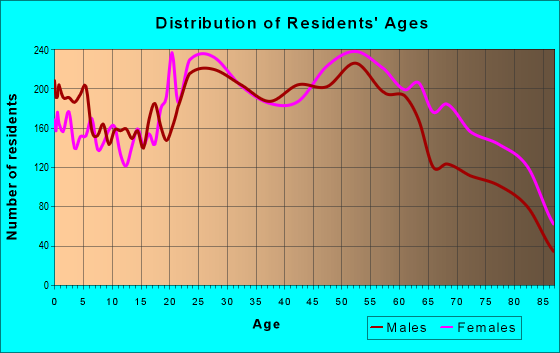
Median resident age:
This zip code:
41.7 years
Pennsylvania median age:
40.9 years
Average household size:
This zip code:
2.2 people
Pennsylvania:
2.4 people
Averages for the 2020 tax year for zip code 19114, filed in 2021:
Average Adjusted Gross Income (AGI) in 2020: $57,305 (Individual Income Tax Returns)
Here:
$57,305
State:
$75,707
Salary/wage: $53,299 (reported on 77.9% of returns)
Here:
$53,299
State:
$62,806
(% of AGI for various income ranges: 899.6% for AGIs below $25k, 3344.2% for AGIs $25k-50k, 6096.1% for AGIs $50k-75k, 8765.6% for AGIs $75k-100k, 15601.8% for AGIs $100k-200k, 47818.3% for AGIs over 200k)
Taxable interest for individuals: $1,025 (reported on 34.8% of returns)
This zip code:
$1,025
Pennsylvania:
$1,633
(% of AGI for various income ranges: 24.2% for AGIs below $25k, 29.7% for AGIs $25k-50k, 46.2% for AGIs $50k-75k, 68.9% for AGIs $75k-100k, 91.8% for AGIs $100k-200k, 620.0% for AGIs over 200k)
Ordinary dividends: $2,673 (reported on 13.6% of returns)
Here:
$2,673
State:
$7,382
(% of AGI for various income ranges: 21.9% for AGIs below $25k, 24.8% for AGIs $25k-50k, 41.4% for AGIs $50k-75k, 64.9% for AGIs $75k-100k, 115.7% for AGIs $100k-200k, 762.5% for AGIs over 200k)
Net capital gain/loss in AGI: +$8,092 (reported on 11.0% of returns)
Here:
+$8,092
State:
+$23,522
(% of AGI for various income ranges: 4.3% for AGIs below $25k, 16.1% for AGIs $25k-50k, 38.4% for AGIs $50k-75k, 110.2% for AGIs $75k-100k, 204.0% for AGIs $100k-200k, 7180.0% for AGIs over 200k)
Profit/loss from business: +$9,916 (reported on 12.0% of returns)
Here:
+$9,916
State:
+$16,274
(% of AGI for various income ranges: 105.7% for AGIs below $25k, 138.6% for AGIs $25k-50k, 136.9% for AGIs $50k-75k, 212.0% for AGIs $75k-100k, 198.4% for AGIs $100k-200k, 2014.2% for AGIs over 200k)
Taxable individual retirement arrangement distribution: $13,578 (reported on 9.8% of returns)
19114:
$13,578
Pennsylvania:
$18,583
(% of AGI for various income ranges: 70.5% for AGIs below $25k, 89.4% for AGIs $25k-50k, 166.6% for AGIs $50k-75k, 266.0% for AGIs $75k-100k, 443.5% for AGIs $100k-200k, 2167.5% for AGIs over 200k)
Total itemized deductions: $24,827 (reported on 8.0% of returns)
Here:
$24,827
State:
$34,850
(% of AGI for various income ranges: 25.5% for AGIs below $25k, 101.2% for AGIs $25k-50k, 351.4% for AGIs $50k-75k, 468.4% for AGIs $75k-100k, 753.0% for AGIs $100k-200k, 2897.5% for AGIs over 200k)
Charity contributions: $5,217 (reported on 6.3% of returns)
Here:
$5,217
State:
$12,392
(% of AGI for various income ranges: 1.3% for AGIs below $25k, 15.8% for AGIs $25k-50k, 58.3% for AGIs $50k-75k, 65.9% for AGIs $75k-100k, 135.2% for AGIs $100k-200k, 530.0% for AGIs over 200k)
Taxes paid: $7,746 (reported on 8.0% of returns)
19114:
$7,746
State:
$8,200
(% of AGI for various income ranges: 3.9% for AGIs below $25k, 23.9% for AGIs $25k-50k, 100.1% for AGIs $50k-75k, 185.8% for AGIs $75k-100k, 257.1% for AGIs $100k-200k, 648.3% for AGIs over 200k)
Earned income credit: $1,943 (reported on 12.7% of returns)
Here:
$1,943
State:
$2,100
(% of AGI for various income ranges: 68.3% for AGIs below $25k, 50.2% for AGIs $25k-50k, 0.6% for AGIs $50k-75k)
Percentage of individuals using paid preparers for their 2020 taxes: 90.8%
Here:
91%
State:
92%
(% for various income ranges: 89.6% for AGIs below $25k, 92.2% for AGIs $25k-50k, 90.8% for AGIs $50k-75k, 90.3% for AGIs $75k-100k, 91.0% for AGIs $100k-200k, 90.3% for AGIs over 200k)
Averages for the 2012 tax year for zip code 19114, filed in 2013:
Average Adjusted Gross Income (AGI) in 2012: $49,096 (Individual Income Tax Returns)
Here:
$49,096
State:
$61,346
Salary/wage: $46,960 (reported on 80.2% of returns)
Here:
$46,960
State:
$51,902
(% of AGI for various income ranges: 62.5% for AGIs below $25k, 76.3% for AGIs $25k-50k, 77.6% for AGIs $50k-75k, 78.7% for AGIs $75k-100k, 83.3% for AGIs $100k-200k, 58.0% for AGIs over 200k)
Taxable interest for individuals: $1,147 (reported on 37.8% of returns)
This zip code:
$1,147
Pennsylvania:
$1,588
(% of AGI for various income ranges: 2.0% for AGIs below $25k, 0.7% for AGIs $25k-50k, 0.8% for AGIs $50k-75k, 0.7% for AGIs $75k-100k, 0.7% for AGIs $100k-200k, 1.6% for AGIs over 200k)
Ordinary dividends: $2,299 (reported on 16.8% of returns)
Here:
$2,299
State:
$5,827
(% of AGI for various income ranges: 1.7% for AGIs below $25k, 0.8% for AGIs $25k-50k, 0.6% for AGIs $50k-75k, 0.6% for AGIs $75k-100k, 0.6% for AGIs $100k-200k, 1.5% for AGIs over 200k)
Net capital gain/loss in AGI: +$1,937 (reported on 11.0% of returns)
Here:
+$1,937
State:
+$14,495
(% of AGI for various income ranges: 0.1% for AGIs $25k-50k, 0.3% for AGIs $50k-75k, 0.3% for AGIs $75k-100k, 0.8% for AGIs $100k-200k, 2.1% for AGIs over 200k)
Profit/loss from business: +$11,964 (reported on 8.6% of returns)
Here:
+$11,964
State:
+$16,268
(% of AGI for various income ranges: 6.9% for AGIs below $25k, 1.8% for AGIs $25k-50k, 1.1% for AGIs $50k-75k, 1.0% for AGIs $75k-100k, 1.5% for AGIs $100k-200k, 6.2% for AGIs over 200k)
Taxable individual retirement arrangement distribution: $11,018 (reported on 11.8% of returns)
19114:
$11,018
Pennsylvania:
$14,550
(% of AGI for various income ranges: 4.7% for AGIs below $25k, 2.3% for AGIs $25k-50k, 2.4% for AGIs $50k-75k, 2.5% for AGIs $75k-100k, 2.2% for AGIs $100k-200k, 4.5% for AGIs over 200k)
Self-employment retirement plans: $18,900 (reported on 0.1% of returns)
19114:
$18,900
Pennsylvania:
$20,922
Total itemized deductions: $18,570 (23% of AGI, reported on 36.0% of returns)
Here:
$18,570
State:
$23,538
Here:
23.0% of AGI
State:
18.4% of AGI
(% of AGI for various income ranges: 8.3% for AGIs below $25k, 10.2% for AGIs $25k-50k, 13.7% for AGIs $50k-75k, 15.3% for AGIs $75k-100k, 16.5% for AGIs $100k-200k, 14.0% for AGIs over 200k)
Charity contributions: $2,112 (reported on 30.6% of returns)
Here:
$2,112
State:
$4,025
(% of AGI for various income ranges: 0.7% for AGIs below $25k, 1.0% for AGIs $25k-50k, 1.4% for AGIs $50k-75k, 1.4% for AGIs $75k-100k, 1.6% for AGIs $100k-200k, 1.4% for AGIs over 200k)
Taxes paid: $7,492 (reported on 35.9% of returns)
19114:
$7,492
State:
$9,982
(% of AGI for various income ranges: 1.9% for AGIs below $25k, 3.0% for AGIs $25k-50k, 5.1% for AGIs $50k-75k, 6.6% for AGIs $75k-100k, 7.8% for AGIs $100k-200k, 6.2% for AGIs over 200k)
Earned income credit: $1,988 (reported on 14.2% of returns)
Here:
$1,988
State:
$2,106
(% of AGI for various income ranges: 4.9% for AGIs below $25k, 0.8% for AGIs $25k-50k)
Percentage of individuals using paid preparers for their 2012 taxes: 54.3%
Here:
54%
State:
53%
(% for various income ranges: 51.4% for AGIs below $25k, 52.1% for AGIs $25k-50k, 55.4% for AGIs $50k-75k, 59.9% for AGIs $75k-100k, 60.1% for AGIs $100k-200k, 84.6% for AGIs over 200k)
Averages for the 2004 tax year for zip code 19114, filed in 2005:
Average Adjusted Gross Income (AGI) in 2004: $41,409 (Individual Income Tax Returns)
Here:
$41,409
State:
$48,049
Salary/wage: $40,382 (reported on 81.7% of returns)
Here:
$40,382
State:
$42,646
(% of AGI for various income ranges: 71.5% for AGIs below $10k, 64.4% for AGIs $10k-25k, 80.1% for AGIs $25k-50k, 82.3% for AGIs $50k-75k, 87.0% for AGIs $75k-100k, 77.1% for AGIs over 100k)
Taxable interest for individuals: $1,408 (reported on 53.9% of returns)
This zip code:
$1,408
Pennsylvania:
$1,657
(% of AGI for various income ranges: 7.3% for AGIs below $10k, 3.8% for AGIs $10k-25k, 1.8% for AGIs $25k-50k, 1.6% for AGIs $50k-75k, 0.9% for AGIs $75k-100k, 1.6% for AGIs over 100k)
Taxable dividends: $1,741 (reported on 21.9% of returns)
Here:
$1,741
State:
$3,566
(% of AGI for various income ranges: 3.5% for AGIs below $10k, 1.8% for AGIs $10k-25k, 0.9% for AGIs $25k-50k, 0.7% for AGIs $50k-75k, 0.5% for AGIs $75k-100k, 0.9% for AGIs over 100k)
Net capital gain/loss: +$3,689 (reported on 15.3% of returns)
Here:
+$3,689
State:
+$9,716
(% of AGI for various income ranges: -3.0% for AGIs below $10k, -0.4% for AGIs $10k-25k, 0.3% for AGIs $25k-50k, 0.5% for AGIs $50k-75k, 0.7% for AGIs $75k-100k, 5.7% for AGIs over 100k)
Profit/loss from business: +$9,997 (reported on 7.8% of returns)
Here:
+$9,997
State:
+$14,267
(% of AGI for various income ranges: 6.4% for AGIs below $10k, 4.0% for AGIs $10k-25k, 1.7% for AGIs $25k-50k, 1.1% for AGIs $50k-75k, 1.2% for AGIs $75k-100k, 2.2% for AGIs over 100k)
IRA payment deduction: $2,939 (reported on 3.0% of returns)
19114:
$2,939
Pennsylvania:
$2,903
(% of AGI for various income ranges: 0.2% for AGIs below $10k, 0.3% for AGIs $10k-25k, 0.3% for AGIs $25k-50k, 0.2% for AGIs $50k-75k, 0.1% for AGIs $75k-100k, 0.1% for AGIs over 100k)
Self-employed pension: $7,204 (reported on 0.3% of returns)
Here:
$7,204
Pennsylvania:
$14,674
Total itemized deductions: $15,562 (23% of AGI, reported on 39.1% of returns)
Here:
$15,562
State:
$18,804
Here:
23.5% of AGI
State:
19.5% of AGI
(% of AGI for various income ranges: 6.3% for AGIs below $10k, 9.7% for AGIs $10k-25k, 12.6% for AGIs $25k-50k, 16.5% for AGIs $50k-75k, 17.3% for AGIs $75k-100k, 15.8% for AGIs over 100k)
Charity contributions deductions: $2,127 (3% of AGI, reported on 36.2% of returns)
Here:
$2,127
State:
$3,337
Here:
3.1% of AGI
State:
3.3% of AGI
(% of AGI for various income ranges: 0.4% for AGIs below $10k, 1.1% for AGIs $10k-25k, 1.6% for AGIs $25k-50k, 2.1% for AGIs $50k-75k, 2.2% for AGIs $75k-100k, 2.1% for AGIs over 100k)
Total tax: $5,016 (reported on 78.9% of returns)
19114:
$5,016
State:
$8,008
(% of AGI for various income ranges: 1.9% for AGIs below $10k, 4.0% for AGIs $10k-25k, 7.7% for AGIs $25k-50k, 9.4% for AGIs $50k-75k, 10.3% for AGIs $75k-100k, 14.9% for AGIs over 100k)
Earned income credit: $1,533 (reported on 10.2% of returns)
Here:
$1,533
State:
$1,643
Percentage of individuals using paid preparers for their 2004 taxes: 53.0%
Here:
53%
State:
56%
(% for various income ranges: 46.1% for AGIs below $10k, 54.7% for AGIs $10k-25k, 50.8% for AGIs $25k-50k, 56.4% for AGIs $50k-75k, 55.2% for AGIs $75k-100k, 63.4% for AGIs over 100k)
Likely homosexual households (counted as self-reported same-sex unmarried-partner households)
Lesbian couples: 0.2% of all households
Gay men: 0.3% of all households
Household received Food Stamps/SNAP in the past 12 months: 1,856 Household did not receive Food Stamps/SNAP in the past 12 months: 12,312
Women who had a birth in the past 12 months: 333 (208 now married, 118 unmarried) Women who did not have a birth in the past 12 months: 6,768 (3,042 now married, 3,713 unmarried)
Housing units in zip code 19114 with a mortgage: 5,471 (692 second mortgage, 6 home equity loan, 557 both second mortgage and home equity loan) Houses without a mortgage: 260
Median monthly owner costs for units with a mortgage: $1,635 Median monthly owner costs for units without a mortgage: $687
Residents with income below the poverty level in 2022:
This zip code:
8.1%
Whole state:
11.8%
Residents with income below 50% of the poverty level in 2022:
This zip code:
4.9%
Whole state:
6.1%
Median number of rooms in houses and condos:
Here:
6.7
State:
6.8
Median number of rooms in apartments:
Here:
4.2
State:
4.3
Notable locations in this zip code not listed on our city pages
Notable locations in zip code 19114: Academy Gardens (A), John F Byrne Golf Course (B), Academy Gardens Golf Course (C), John F Byrne Golf Course (D), Torresdale-Frankford Country Club (E), Torresdale Station (F), Philadelphia Fire Department Engine 46 (G). Display/hide their locations on the map
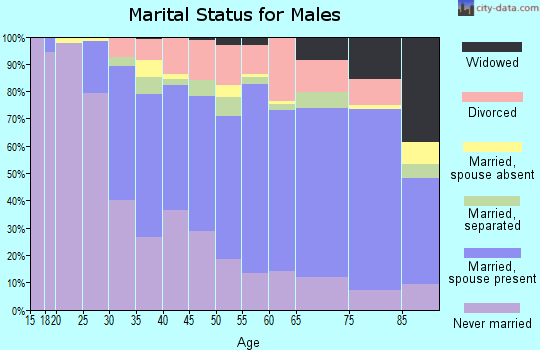
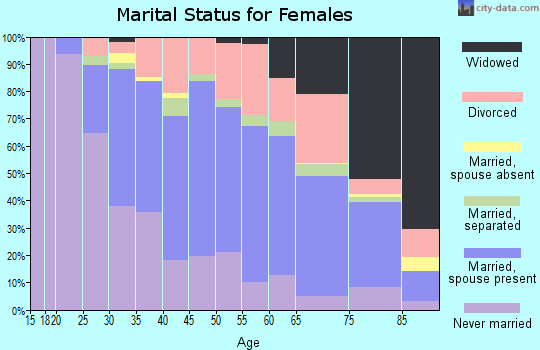
3,162 married couples with children.
1,413 single-parent households (267 men, 1,146 women).
83.0% of residents of 19114 zip code speak English at home.
6.3% of residents speak Spanish at home (46% very well, 33% well, 17% not well, 4% not at all).
5.7% of residents speak other Indo-European language at home (54% very well, 25% well, 20% not well, 1% not at all).
3.3% of residents speak Asian or Pacific Island language at home (58% very well, 23% well, 19% not well, 1% not at all).
1.8% of residents speak other language at home (80% very well, 13% not well, 8% not at all).
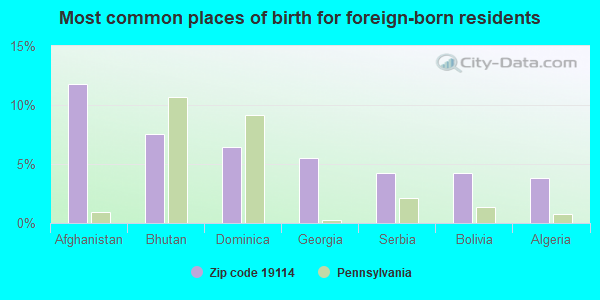
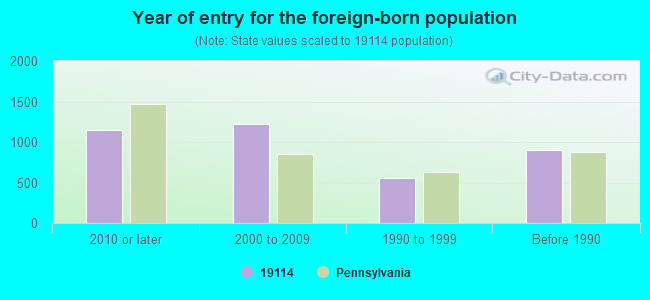
Foreign born population: 3,197 (10.1%) (67.9% of them are naturalized citizens)
Facilities with environmental interests located in this zip code:
AMER PKG (2910 GRANT AVENUE in PHILADELPHIA, PA)
AIR MINOR (AIRS/AFS) COMPLIANCE ACTIVITY (Tracking inspections of insecticide, fungicide, and rodenticide, and toxic substances) STATE MASTER (Pennsylvania database) - RCRIS-PAD071616551, HAZARDOUS WASTE PROGRAM AIR MAJOR ("Best Available" air pollution technologies tracking) Small Quantity Generators, between 100 kg and 1000 kg of hazardous waste/month (Resource Conservation and Recovery Act (tracking hazardous waste)) - notification Organizations: OPERNAME (CONTACT/OPERATOR)
, AMERICAN PACKAGING CORP (CONTACT/OWNER)
Alternative names: AMERICAN PACKAGING CORP.
AECO, INC (4923-25 ARENDELL ST in PHILADELPHIA, PA)
AIR MINOR (AIRS/AFS) HAZARDOUS WASTE BIENNIAL REPORTER (Resource Conservation and Recovery Act (tracking hazardous waste)) (Resource Conservation and Recovery Act (tracking hazardous waste)) Business SIC classification: MANUFACTURING INDUSTRIES Organizations: OPERNAME (CONTACT/OPERATOR)
, FARREN, WAYNE A PRESIDENT (CONTACT/OWNER)
BETTY BRITE ONE HOUR (9910 FRANKFORD AVE in PHILADELPHIA, PA)
AIR MINOR (AIRS/AFS) Small Quantity Generators, between 100 kg and 1000 kg of hazardous waste/month (Resource Conservation and Recovery Act (tracking hazardous waste)) - notification Business SIC classification: DRYCLEANING PLANTS, EXCEPT RUG CLEANING Organizations: OPERNAME (CONTACT/OPERATOR)
, CHOI, YOUNG (CONTACT/OWNER)
Alternative names: BETTY BRITE ONE HOUR CLEANERS, BETTY BRITE CLEANERS-PHILADELPHIA
BETTY BRITE ONE HOUR CLEANER (3236 RED LION ROAD in PHILADELPHIA, PA)
AIR MINOR (AIRS/AFS) Conditionally Exempt Small Quantity Generators, less than 100 kg/month of hazardous waste (Resource Conservation and Recovery Act (tracking hazardous waste)) Business SIC classification: COIN-OPERATED LAUNDRIES AND DRYCLEANING Organizations: OPERNAME (CONTACT/OPERATOR)
Alternative names: BETTY BRITE CLEANERS, BETTY BRITE CLNR SVC
BICKLEY FURNACES INC (550 STATE RD in BENSALEM, PA)
AGUSTA AEROSPACE CORPORATION (3050 RED LION ROAD in PHILADELPHIA, PA)
Small Quantity Generators, between 100 kg and 1000 kg of hazardous waste/month (Resource Conservation and Recovery Act (tracking hazardous waste)) - notification Organizations: OPERNAME (CONTACT/OPERATOR)
AUTO TECH COLLISION (9253 KEYSTONE STREET in PHILADELPHIA, PA)
Conditionally Exempt Small Quantity Generators, less than 100 kg/month of hazardous waste (Resource Conservation and Recovery Act (tracking hazardous waste)) Organizations: OPERNAME (CONTACT/OPERATOR)
, GABRIELI, JOSEPH (CONTACT/OWNER)
AMOCO 791 TANKS (10000 FRANKFORD AVE TANKS in PHILADELPHIA, PA)
Small Quantity Generators, between 100 kg and 1000 kg of hazardous waste/month (Resource Conservation and Recovery Act (tracking hazardous waste)) - notification Organizations: AMOCO OIL COMPANY (CONTACT/OWNER)
AMOCO NO 60939 TANKS (4004-46 WOODHAVEN BLVD in PHILADELPHIA, PA)
Small Quantity Generators, between 100 kg and 1000 kg of hazardous waste/month (Resource Conservation and Recovery Act (tracking hazardous waste)) - notification Organizations: AMOCO OIL CO (CONTACT/OWNER)
Housing units lacking complete plumbing facilities: 0.3% Housing units lacking complete kitchen facilities: 0.2%
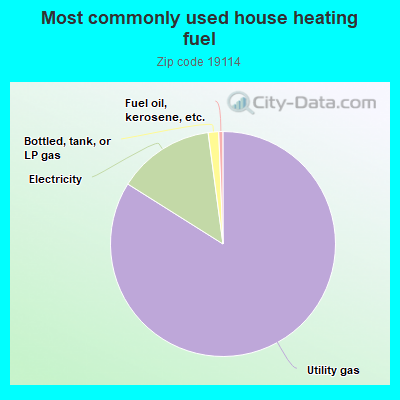
83.7%Utility gas
13.9%Electricity
1.5%Bottled, tank, or LP gas
0.6%Fuel oil, kerosene, etc.
Population in 1990: 31,199.
Place of birth for U.S.-born residents:
This state: 24,551
Northeast: 1,780
Midwest: 260
South: 849
West: 57
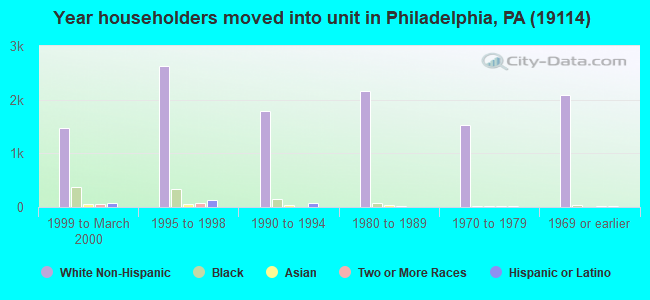
67% of the 19114 zip code residents lived in the same house 5 years ago. Out of people who lived in different houses, 75% lived in this county. Out of people who lived in different counties, 50% lived in Pennsylvania.
91% of the 19114 zip code residents lived in the same house 1 year ago. Out of people who lived in different houses, 73% moved from this county. Out of people who lived in different houses, 17% moved from different county within same state. Out of people who lived in different houses, 5% moved from different state. Out of people who lived in different houses, 4% moved from abroad.
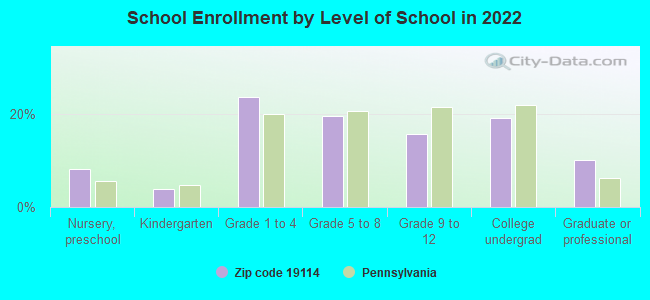
Private vs. public school enrollment:
Students in private schools in grades 1 to 8 (elementary and middle school): 1,338
Here:
45.8%
Pennsylvania:
15.7%
Students in private schools in grades 9 to 12 (high school): 274
Here:
26.4%
Pennsylvania:
13.4%
Students in private undergraduate colleges: 629
Here:
49.6%
Pennsylvania:
39.8%
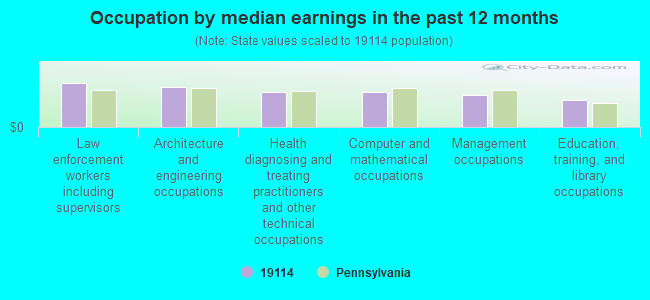
Occupation by median earnings in the past 12 months ($)
108,411Law enforcement workers including supervisors
99,182Architecture and engineering occupations
86,552Health diagnosing and treating practitioners and other technical occupations
85,122Computer and mathematical occupations
77,684Management occupations
66,543Education, training, and library occupations
Companies with federal contracts located in this zip code (PHILADELPHIA, PA):
INTERSTATE BRANDS CORPORATION (9801 BLUE GRASS RD) : $3,730,211 in 8 contractsfrom 2002 to 2006
Contracts for Food Items For Resale, Bakery and Cereal Products by Defense Commissary Agency, Bureau of Prisoners/Federal Prison System, Defense Logistics Agency Signed by year:2000: $0; 2001: $0; 2002: $39,000; 2003: $0; 2004: $738,073; 2005: $2,093,013; 2006: $860,125.
Biggest contracts:
$942,838 with Defense Commissary Agency for Food Items For Resale. Signed on 2005-04-01. Completion date: 2005-08-31.
$860,125, same as above.Signed on 2006-01-01. Completion date: 2006-03-31.
$738,073, same as above.Signed on 2004-10-01. Completion date: 2005-02-28.
$546,912, same as above.Signed on 2005-10-01. Completion date: 2005-12-31.
JAMES D MORRISSEY INC (9119 FRANKFORD AVE) : $2,690,511 in 2 contractsfrom 2004 to 2005
$2,673,011 with Navy for Maintenance, Repair or Alteration of Real Property -- Airport Service Roads. Signed on 2005-07-29. Completion date: 2006-07-28.
$17,500 with Navy for Construction of Structures and Facilities -- Maintenance Buildings. Signed on 2004-04-16. Completion date: 2004-05-31.
LIBERTY GRAPHICS, INC (9205 JAMES STREET; small business) : $629,241 in 17 contractsfrom 2000 to 2005
Contracts for Maps, Atlases, Charts, and Globes, Armament Training Devices, Training Aids, Operation Training Devices, and moreby Navy, Army, Air Force, Department of Veterans Affairs, and others Signed by year:2000: $147,207; 2001: $0; 2002: $127,250; 2003: $190,000; 2004: $48,450; 2005: $116,334; 2006: $0.
Biggest contracts:
$95,730 with Navy for Maps, Atlases, Charts, and Globes. Signed on 2003-09-13. Completion date: 2003-12-30.
$81,710 with Navy for Armament Training Devices. Signed on 2000-05-19. Completion date: 2000-10-19.
$66,599 with Army for Training Aids. Signed on 2005-07-15. Completion date: 2005-11-18.
$48,450 with Air Force for Operation Training Devices. Taking place in WA. Signed on 2004-09-30. Completion date: 2005-02-27.
INTERSTATE BRANDS CORPORATION (9801 BLUE GRASS ROAD) : $206,807 in 7 contractsfrom 2004 to 2005
Contracts for Food Items For Resale by Defense Commissary Agency Signed by year:2000: $0; 2001: $0; 2002: $0; 2003: $0; 2004: $42,354; 2005: $164,453; 2006: $0.
Biggest contracts:
$61,257 with Defense Commissary Agency for Food Items For Resale. Taking place in NY. Signed on 2005-01-01. Completion date: 2005-03-31.
$42,354, same as above.Signed on 2004-10-01. Completion date: 2005-02-28.
$31,473 with Defense Commissary Agency for Food Items For Resale. Signed on 2005-10-01. Completion date: 2005-12-31.
$25,870 with Defense Commissary Agency for Food Items For Resale. Taking place in NY. Signed on 2005-08-01. Completion date: 2005-09-30.
HORTMAN AVIATION SERVICES INC (9800 ASHTON RD; small business) : $51,138 in 3 contractsfrom 2003 to 2004
$88,290 with Navy for Aircraft, Fixed Wing. Signed on 2003-10-24. Completion date: 2004-09-30.
$0, same as above.Signed on 2003-04-10. Completion date: 2003-09-30.
-$37,152, same as above.Signed on 2004-07-29. Completion date: 2004-09-30.
SANDWICH CAT INC (9224 ASHTON ROAD; small business) : $32,741 in 8 contractsfrom 2004 to 2005
Contracts for Services -- Basic Research (R&D), Food Services by Navy Signed by year:2000: $0; 2001: $0; 2002: $0; 2003: $0; 2004: $14,711; 2005: $18,030; 2006: $0.
Biggest contracts:
$5,467 with Navy for Services -- Basic Research (R&D). Taking place in NJ. Signed on 2004-12-01. Completion date: 2004-10-24.
$5,467, same as above.Signed on 2004-11-16. Completion date: 2004-10-03.
$4,302 with Navy for Food Services. Signed on 2005-05-24. Completion date: 2005-05-15.
$4,266, same as above.Signed on 2005-08-05. Completion date: 2005-08-06.
B&J MACHINE INC (4957 PEARSON AVE; small business) : $16,406 in 2 contractsfrom 2004 to 2005
$14,600 with Army for Coil, Flat, Leaf, and Wire Springs. Taking place in MD. Signed on 2005-09-28. Completion date: 2005-10-07.
$1,806 with Army for Nails, Machine Keys, and Pins. Signed on 2004-02-10. Completion date: 2004-03-31.
JOWITT & RODGERS COMPANY (9400 STATE RD; small business) : $13,032 in 2 contractsfrom 2004 to 2006
$8,316 with Army for Disks and Stones, Abrasive. Signed on 2006-01-03. Completion date: 2006-02-09.
$4,716, same as above.Signed on 2004-02-03. Completion date: 2004-03-15.
FLUIDICS INCORPORATED (9815 ROOSEVELT BOULEVARD, SUITE A) 350 employees, $50000000 revenue.
$5,495 with Public Buildings Service for Maintenance, Repair and Rebuilding of Equipment -- Refrigeration, Air Conditioning, and Air Circulating Equipment. Taking place in DE. Signed on 2004-08-04. Completion date: 2004-09-30.
FORD RENTAL SYSTEM INC (9371 ROOSEVELT BLVD; small business) : $4,625 in 2 contractsin 2004
$3,351 with Army for Motor Passenger Services. Signed on 2004-05-25. Completion date: 2004-06-16.
$1,274, same as above.Signed on 2004-08-02. Completion date: 2004-09-30.
Top industries in this zip code by the number of employees in 2005:
Health Care and Social Assistance: General Medical and Surgical Hospitals (over 1000 employees: 1 establishment)
Administrative and Support and Waste Management and Remediation Services: Packaging and Labeling Services (over 1000: 1)
Health Care and Social Assistance: Offices of Physicians (except Mental Health Specialists) (250-499: 1, 20-49: 5, 10-19: 9, 5-9: 10, 1-4: 9)
Educational Services: Colleges, Universities, and Professional Schools (500-999: 1)
Construction: Plumbing, Heating, and Air-Conditioning Contractors (250-499: 1, 1-4: 1)
2010 - 2018 National Fire Incident Reporting System (NFIRS) incidents
According to the data from the years 2010 - 2018 the average number of fire incidents per year is 89. The highest number of reported fires - 126 took place in 2013, and the least - 0 in 2016. The data has a dropping trend.
When looking into fire subcategories, the most reports belonged to: Outside Fires (53.4%), and Structure Fires (29.5%).
Fire incident types reported to NFIRS in Zip Code 19114
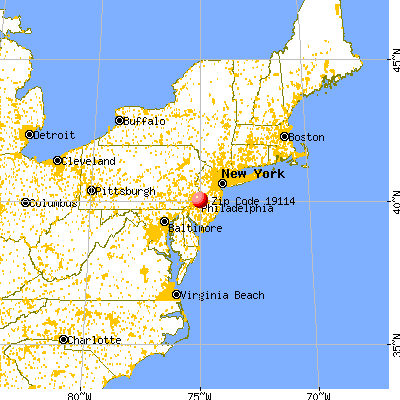


 Nearest zip codes: 19154, 19136, 19152, 19115, 19116, 08075.


 According to the data from the years 2010 - 2018 the average number of fire incidents per year is 89. The highest number of reported fires - 126 took place in 2013, and the least - 0 in 2016. The data has a dropping trend.
 When looking into fire subcategories, the most reports belonged to: Outside Fires (53.4%), and Structure Fires (29.5%).