Delaware County, Pennsylvania (PA)
County owner-occupied free and clear houses and condos in 2010: 41,501
County owner-occupied houses and condos in 2000: 148,293
Renter-occupied apartments: 61,488 (it was 58,027 in 2000)
| % of renters here: | 28% |
| State: | 30% |
Land area: 184 sq. mi.
Water area: 6.5 sq. mi.
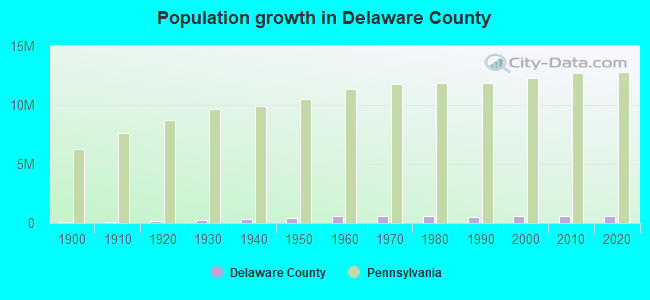
Population density: 3122 people per square mile (very high).
Industries providing employment: Educational, health and social services (29.3%), Professional, scientific, management, administrative, and waste management services (12.7%), Retail trade (10.6%).
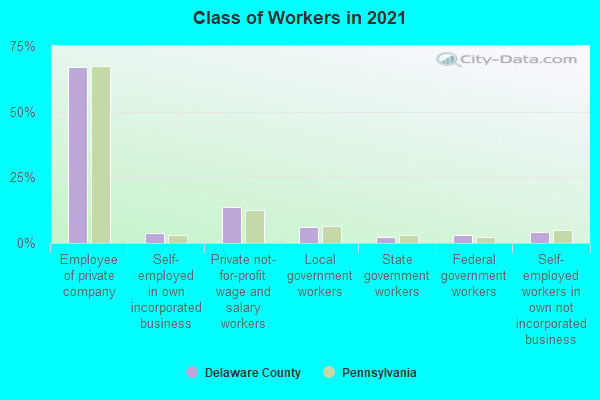
Type of workers:
- Private wage or salary: 86%
- Government: 10%
- Self-employed, not incorporated: 4%
- Unpaid family work: 0%
- OSM Map
- General Map
- Google Map
- MSN Map

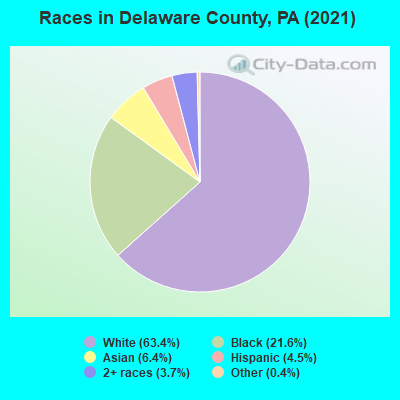
- 360,15162.6%White Non-Hispanic Alone
- 124,14121.6%Black Non-Hispanic Alone
- 36,6916.4%Asian alone
- 26,8814.7%Hispanic or Latino
- 25,9584.5%Two or more races
- 1,2240.2%Some other race alone
- 1360.02%American Indian and Alaska Native alone
| Median resident age: | 39.4 years |
| Pennsylvania median age: | 40.9 years |
| Males: 278,828 | |
| Females: 296,354 |

 | Property Tax Reassessments Starting to Roll In In Delaware County Pa (2 replies) |
| Looking for areas in or around Delaware County (4 replies) |
| What are the chances of Trump winning Pennsylvania again in 2020 Election? (267 replies) |
| Why Philly has so many bad schools? (78 replies) |
| 13,002,700 (47 replies) |
| One Pennsylvania (127 replies) |
| Delaware County: | 2.0 people |
| Pennsylvania: | 2 people |
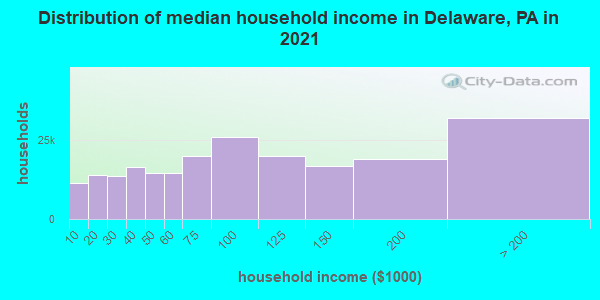
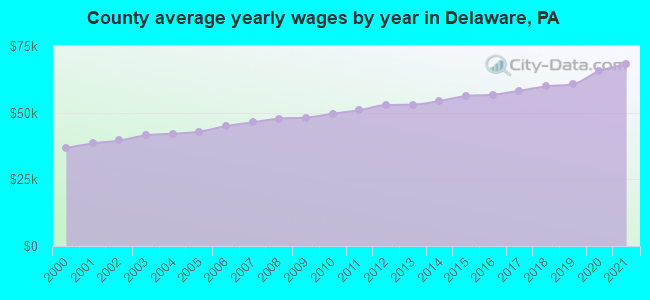
Estimated median household income in 2022: $83,960 ($50,092 in 1999)
| This county: | $83,960 |
| Pennsylvania: | $71,798 |
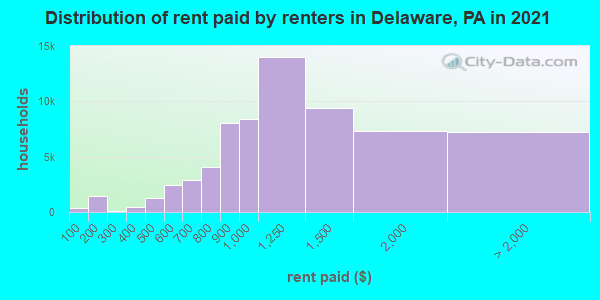
Median contract rent in 2022 for apartments: $1,088 (lower quartile is $869, upper quartile is $1,443)
| This county: | $1088 |
| State: | $922 |
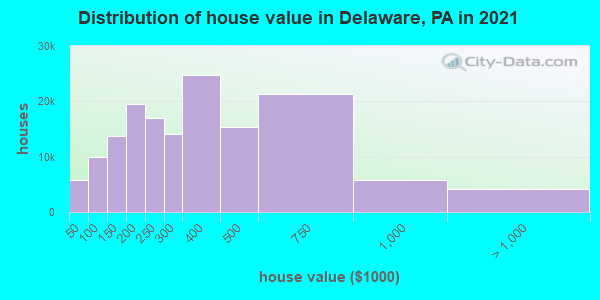
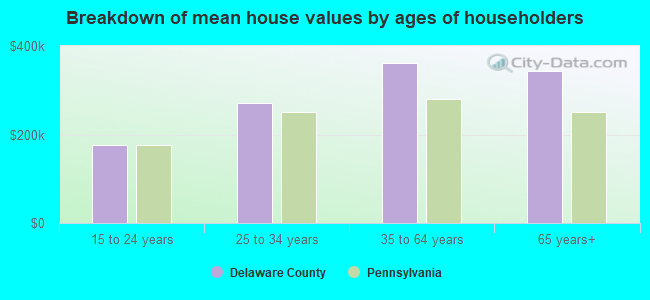
Estimated median house or condo value in 2022: $316,200 (it was $127,000 in 2000)
| Delaware: | $316,200 |
| Pennsylvania: | $245,500 |
Mean price in 2022:
Median monthly housing costs for homes and condos with a mortgage: $1,959Detached houses: $472,005
Here: $472,005 State: $317,202 Townhouses or other attached units: $221,007
Here: $221,007 State: $254,369 In 2-unit structures: $266,124
Here: $266,124 State: $249,182 In 3-to-4-unit structures: $339,250
Here: $339,250 State: $297,446 In 5-or-more-unit structures: $227,575
Here: $227,575 State: $320,068 Mobile homes: $163,857
Here: $163,857 State: $92,414 Occupied boats, RVs, vans, etc.: $163,590
Here: $163,590 State: $563,750
Median monthly housing costs for units without a mortgage: $846
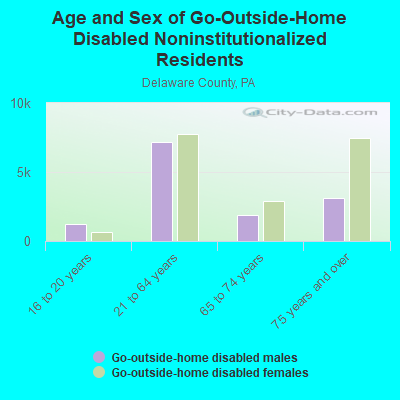
Institutionalized population: 7,828
Health of residents in Delaware County based on CDC Behavioral Risk Factor Surveillance System Survey Questionnaires from 2003 to 2012:
General health status score of residents in this county from 1 (poor) to 5 (excellent) is 3.5. This is about average.74.6% of residents exercised in the past month. This is about average.
50.8% of residents smoked 100+ cigarettes in their lives. This is about average.
99.2% of adult residents drank alcohol in the past 30 days. This is more than average.
66.7% of residents visited a dentist within the past year. This is less than average.
Average weight of males is 195 pounds. This is about average.
Average weight of females is 159 pounds. This is about average.
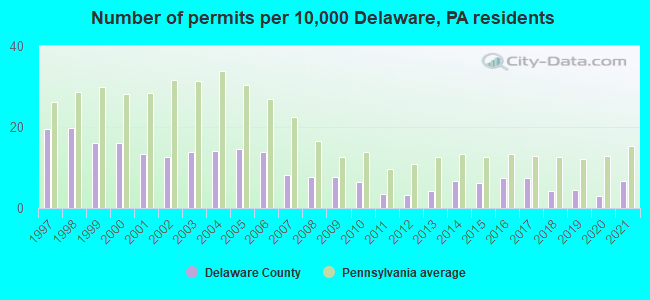
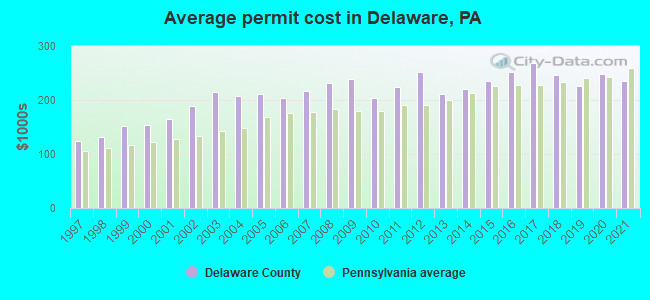
Single-family new house construction building permits:
- 2022: 290 buildings, average cost: $273,600
- 2021: 366 buildings, average cost: $235,700
- 2020: 161 buildings, average cost: $248,500
- 2019: 243 buildings, average cost: $225,700
- 2018: 232 buildings, average cost: $245,800
- 2017: 411 buildings, average cost: $267,500
- 2016: 406 buildings, average cost: $250,900
- 2015: 341 buildings, average cost: $235,500
- 2014: 363 buildings, average cost: $220,800
- 2013: 227 buildings, average cost: $212,100
- 2012: 175 buildings, average cost: $251,800
- 2011: 190 buildings, average cost: $224,200
- 2010: 354 buildings, average cost: $203,300
- 2009: 426 buildings, average cost: $238,100
- 2008: 428 buildings, average cost: $231,900
- 2007: 454 buildings, average cost: $215,800
- 2006: 761 buildings, average cost: $203,100
- 2005: 796 buildings, average cost: $212,100
- 2004: 780 buildings, average cost: $207,700
- 2003: 759 buildings, average cost: $214,000
- 2002: 688 buildings, average cost: $189,400
- 2001: 733 buildings, average cost: $165,200
- 2000: 886 buildings, average cost: $153,300
- 1999: 879 buildings, average cost: $151,500
- 1998: 1092 buildings, average cost: $131,300
- 1997: 1078 buildings, average cost: $123,700
Median real estate property taxes paid for housing units with mortgages in 2022: $6,167 (1.9%)
Median real estate property taxes paid for housing units with no mortgage in 2022: $5,590 (1.9%)
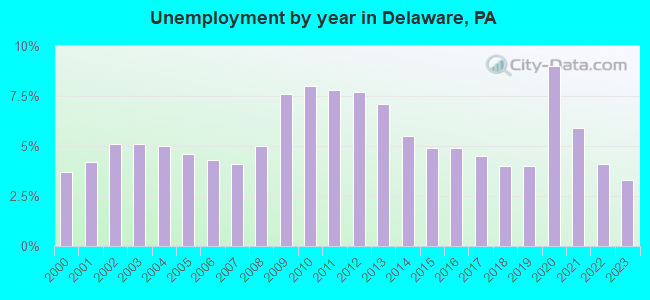
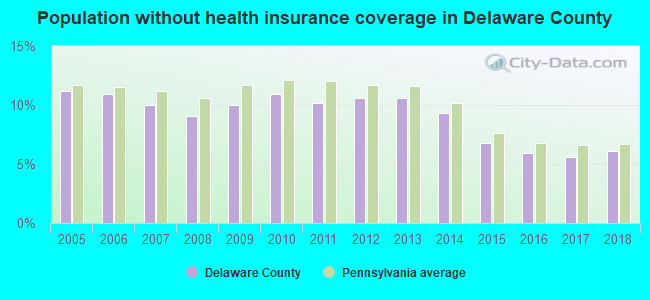
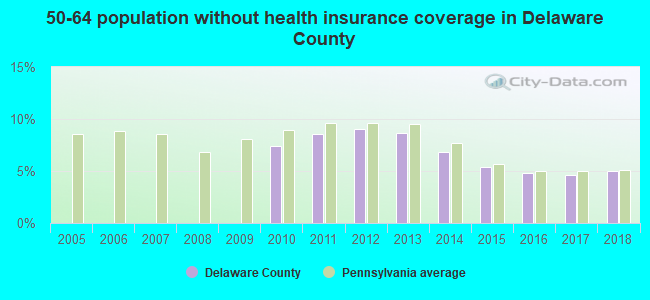
| Delaware County: | 9.7% |
| Pennsylvania: | 11.8% |
Median age of residents in 2022: 39.4 years old
(Males: 38.3 years old, Females: 40.6 years old)
(Median age for: White residents: 44.4 years old, Black residents: 34.0 years old, American Indian residents: 50.1 years old, Asian residents: 38.6 years old, Hispanic or Latino residents: 26.4 years old, Other race residents: 30.7 years old)
Area name: Philadelphia-Camden-Wilmington, PA-NJ-DE-MD MSA
Fair market rent in 2006 for a 1-bedroom apartment in Delaware County is $742 a month.
Fair market rent for a 2-bedroom apartment is $886 a month.
Fair market rent for a 3-bedroom apartment is $1061 a month.
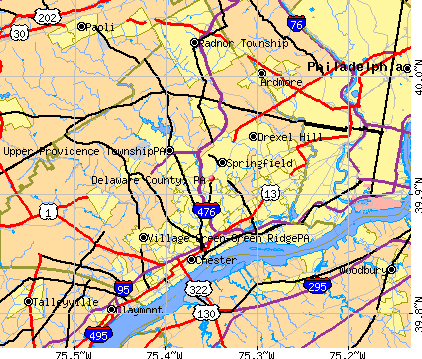
Cities in this county include: Chester, Radnor Township, Drexel Hill, Springfield, Nether Providence Township, Yeadon, Broomall, Lansdowne, Upper Providence Township, Darby.
2023 air pollution in Delaware County:
Nitrogen Dioxide: 0.01 ppm (standard limit: 0.053 ppm). Above U.S. average.
Ozone (1-hour): 0.038 ppm (standard limit: 0.12 ppm). Near U.S. average.
Particulate Matter (PM2.5) Annual: 13.6 µg/m3(standard limit: 15.0 µg/m3). Above U.S. average.
Neighboring counties: New Castle County, Delaware  , Camden County, New Jersey
  , Bedford County
  , Glenn County, California , De Witt County, Illinois , Hocking County, Ohio , Schuyler County, Illinois .
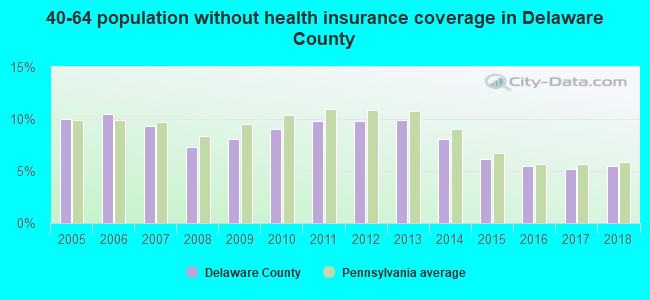
| Here: | 2.7% |
| Pennsylvania: | 2.9% |
Current college students: 39,670
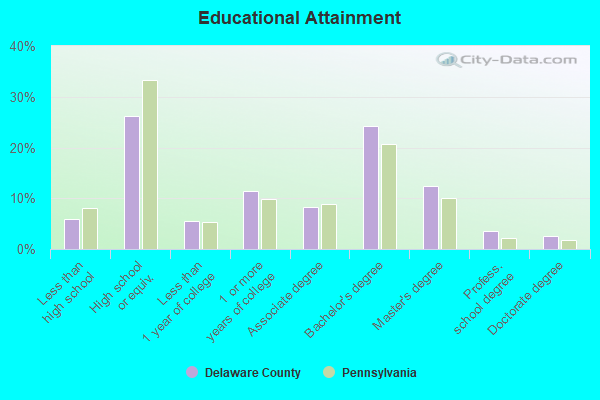
People 25 years of age or older with a high school degree or higher: 93.7%
People 25 years of age or older with a bachelor's degree or higher: 41.8%
Number of foreign born residents: 57,651 (62.3% naturalized citizens)
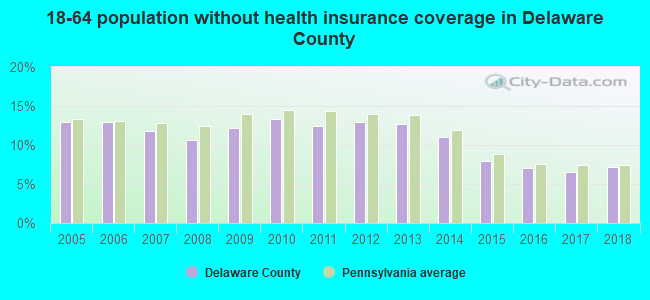
| Delaware County: | 10.0% |
| Whole state: | 7.5% |
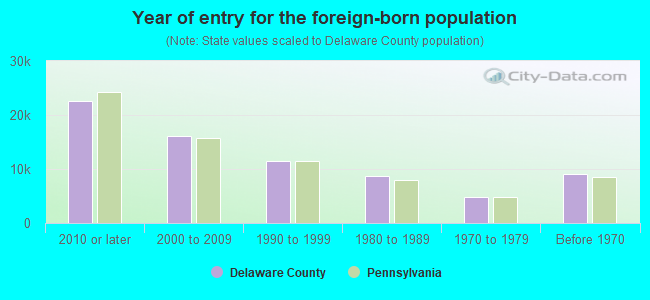
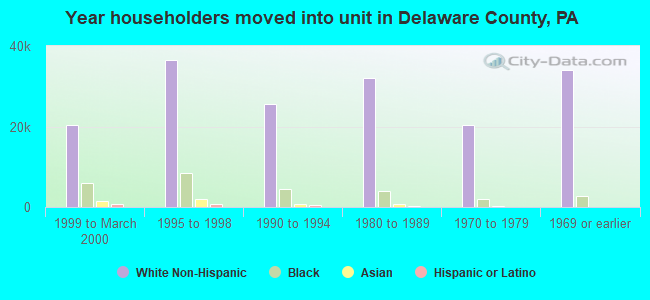
- Year of entry for the foreign-born population
- 22,0792010 or later
- 12,0762000 to 2009
- 9,5841990 to 1999
- 8,6841980 to 1989
- 4,8161970 to 1979
- 9,149Before 1970
Mean travel time to work (commute): minutes
Percentage of county residents living and working in this county: 93.7%
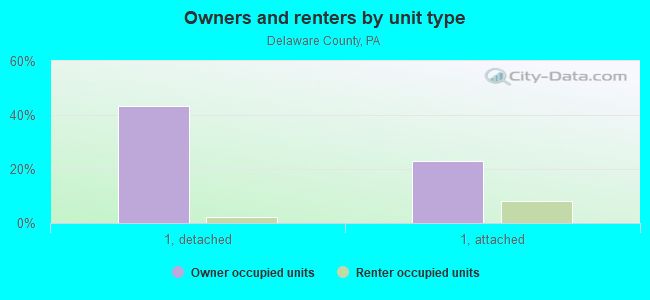
Housing units in structures:
- One, detached: 102,150
- One, attached: 70,933
- Two: 10,782
- 3 or 4: 10,910
- 5 to 9: 6,294
- 10 to 19: 7,926
- 20 to 49: 8,368
- 50 or more: 11,975
- Mobile homes: 415
- Boats, RVs, vans, etc.: 62
Housing units in Delaware County with a mortgage: 96,229 (12,061 second mortgage, 251 home equity loan, 11,022 both second mortgage and home equity loan)
Houses without a mortgage: 4,734
| Here: | 96.0% with mortgage |
| State: | 93.8% with mortgage |
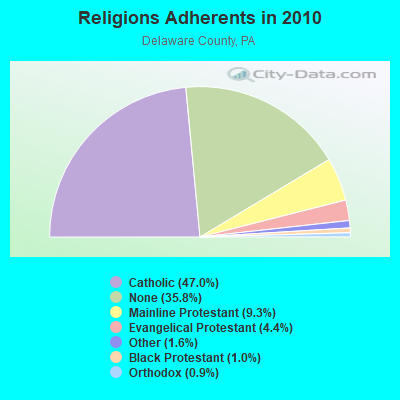
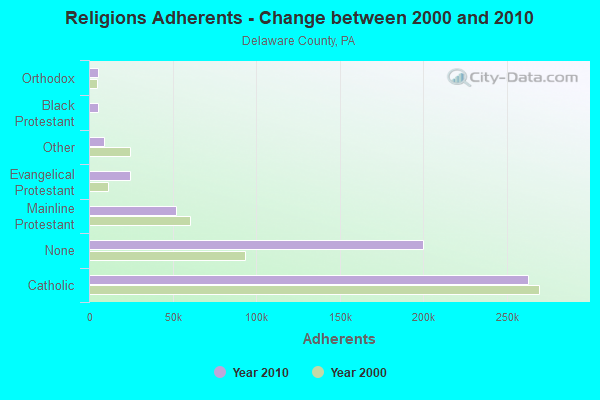
Religion statistics for Delaware County
| Religion | Adherents | Congregations |
|---|---|---|
| Catholic | 262,506 | 50 |
| Mainline Protestant | 52,224 | 169 |
| Evangelical Protestant | 24,456 | 136 |
| Other | 9,009 | 27 |
| Black Protestant | 5,617 | 39 |
| Orthodox | 5,096 | 8 |
| None | 200,071 | - |
Source: Clifford Grammich, Kirk Hadaway, Richard Houseal, Dale E.Jones, Alexei Krindatch, Richie Stanley and Richard H.Taylor. 2012. 2010 U.S.Religion Census: Religious Congregations & Membership Study. Association of Statisticians of American Religious Bodies. Jones, Dale E., et al. 2002. Congregations and Membership in the United States 2000. Nashville, TN: Glenmary Research Center.
Food Environment Statistics:
| Delaware County: | 1.86 / 10,000 pop. |
| State: | 2.04 / 10,000 pop. |
| Here: | 0.02 / 10,000 pop. |
| Pennsylvania: | 0.09 / 10,000 pop. |
| This county: | 1.50 / 10,000 pop. |
| Pennsylvania: | 0.88 / 10,000 pop. |
| Delaware County: | 1.14 / 10,000 pop. |
| Pennsylvania: | 2.52 / 10,000 pop. |
| This county: | 5.66 / 10,000 pop. |
| State: | 7.12 / 10,000 pop. |
| Delaware County: | 8.5% |
| Pennsylvania: | 9.1% |
| Delaware County: | 25.7% |
| State: | 27.2% |
| Here: | 11.1% |
| State: | 11.5% |
Agriculture in Delaware County:
Average value of agricultural products sold per farm: $94,131Average value of crops sold per acre for harvested cropland: $12634.18
The value of nursery, greenhouse, floriculture, and sod as a percentage of the total market value of agricultural products sold: 93.72%
The value of livestock, poultry, and their products as a percentage of the total market value of agricultural products sold: 1.28%
Average total farm production expenses per farm: $71,379
Irrigated harvested cropland as a percentage of land in farms: 11.27%
Average market value of all machinery and equipment per farm: $30,887
The percentage of farms operated by a family or individual: 77.63%
Average age of principal farm operators: 61 years
Land in orchards: 103 acres
Earthquake activity:
Delaware County-area historical earthquake activity is significantly above Pennsylvania state average. It is 65% smaller than the overall U.S. average.On 8/23/2011 at 17:51:04, a magnitude 5.8 (5.8 MW, Depth: 3.7 mi, Class: Moderate, Intensity: VI - VII) earthquake occurred 196.4 miles away from Delaware County center
On 1/16/1994 at 01:49:16, a magnitude 4.6 (4.6 MB, 4.6 LG, Depth: 3.1 mi, Class: Light, Intensity: IV - V) earthquake occurred 46.4 miles away from the county center
On 1/16/1994 at 00:42:43, a magnitude 4.2 (4.2 MB, 4.0 LG, Depth: 3.1 mi) earthquake occurred 45.0 miles away from the county center
On 10/7/1983 at 10:18:46, a magnitude 5.3 (5.1 MB, 5.3 LG, 5.1 ML) earthquake occurred 284.2 miles away from the county center
On 11/30/2017 at 21:47:31, a magnitude 4.1 (4.1 MW, Depth: 6.1 mi) earthquake occurred 49.7 miles away from Delaware County center
On 9/25/1998 at 19:52:52, a magnitude 5.2 (4.8 MB, 4.3 MS, 5.2 LG, 4.5 MW, Depth: 3.1 mi) earthquake occurred 286.1 miles away from the county center
Magnitude types: regional Lg-wave magnitude (LG), body-wave magnitude (MB), local magnitude (ML), surface-wave magnitude (MS), moment magnitude (MW)
Most recent natural disasters:
- Pennsylvania Covid-19 Pandemic, Incident Period: January 20, 2020, Major Disaster (Presidential) Declared DR-4506-PA: March 30, 2020, FEMA Id: 4506, Natural disaster type: Other
- Pennsylvania Severe Winter Storm, Incident Period: February 04, 2014 to February 20, 2014, Emergency Declared EM-3367: February 06, 2014, FEMA Id: 3367, Natural disaster type: Winter Storm
- Pennsylvania Hurricane Sandy, Incident Period: October 26, 2012 to November 08, 2012, Emergency Declared EM-3356: October 29, 2012, FEMA Id: 3356, Natural disaster type: Hurricane
- Pennsylvania Remnants of Tropical Storm Lee, Incident Period: September 03, 2011 to October 15, 2011, Major Disaster (Presidential) Declared EM-3340: September 08, 2011, FEMA Id: 3340, Natural disaster type: Tropical Storm
- Pennsylvania Tropical Storm Lee, Incident Period: September 03, 2011 to October 15, 2011, Major Disaster (Presidential) Declared DR-4030: September 12, 2011, FEMA Id: 4030, Natural disaster type: Tropical Storm
- Pennsylvania Hurricane Irene, Incident Period: August 26, 2011 to September 14, 2011, Emergency Declared EM-3339: August 29, 2011, FEMA Id: 3339, Natural disaster type: Hurricane
- Pennsylvania Hurricane Irene, Incident Period: August 26, 2011 to August 30, 2011, Major Disaster (Presidential) Declared DR-4025: September 03, 2011, FEMA Id: 4025, Natural disaster type: Hurricane
- Pennsylvania Severe Winter Storms and Snowstorms, Incident Period: February 05, 2010 to February 11, 2010, Major Disaster (Presidential) Declared DR-1898: April 16, 2010, FEMA Id: 1898, Natural disaster type: Snowstorm, Winter Storm
- Pennsylvania Hurricane Katrina Evacuation, Incident Period: August 29, 2005 to October 01, 2005, Emergency Declared EM-3235: September 10, 2005, FEMA Id: 3235, Natural disaster type: Hurricane
- Pennsylvania Tropical Depression Ivan, Incident Period: September 17, 2004 to October 01, 2004, Major Disaster (Presidential) Declared DR-1557: September 19, 2004, FEMA Id: 1557, Natural disaster type: Tropical Depression
- 11 other natural disasters have been reported since 1953.
The number of natural disasters in Delaware County (21) is greater than the US average (15).
Major Disasters (Presidential) Declared: 15
Emergencies Declared: 6
Causes of natural disasters: Hurricanes: 5, Floods: 4, Winter Storms: 4, Storms: 3, Tropical Storms: 3, Snowstorms: 2, Blizzard: 1, Snowfall: 1, Tropical Depression: 1, Water Shortage: 1, Other: 1 (Note: some incidents may be assigned to more than one category).
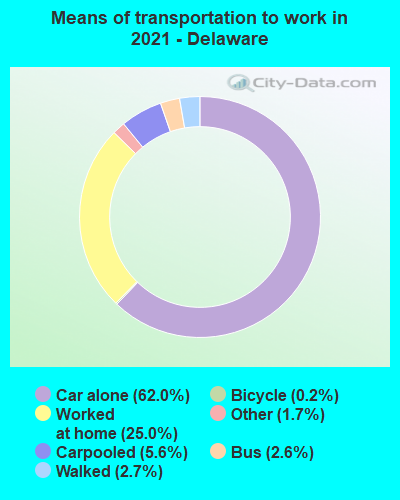
Means of transportation to work:
- Drove a car alone: 152,343 (64.8%)
- Carpooled: 15,042 (6.4%)
- Bus: 4,427 (1.9%)
- Subway or elevated rail: 879 (0.4%)
- Long-distance train or commuter rail: 587 (0.2%)
- Light rail, streetcar or trolley: 310 (0.1%)
- Taxicab, motorcycle, or other means: 4,574 (1.9%)
- Bicycle: 369 (0.2%)
- Walked: 9,123 (3.9%)
- Worked at home: 47,529 (20.2%)

- Health care and social assistance (29%)
- Educational services (14%)
- Retail trade (10%)
- Professional, scientific, and technical services (7%)
- Finance and insurance (7%)
- Accommodation and food services (5%)
- Other services, except public administration (5%)
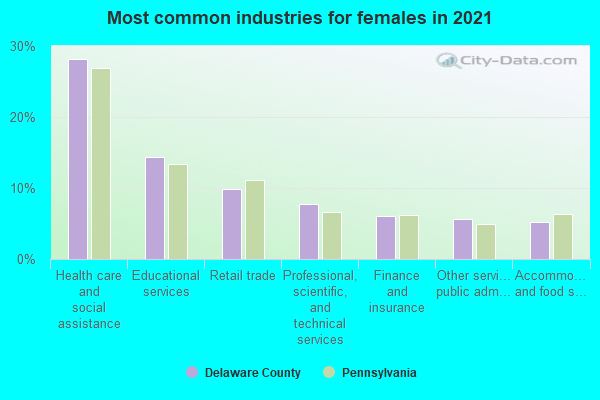
- Health care and social assistance (30%)
- Educational services (15%)
- Retail trade (10%)
- Professional, scientific, and technical services (8%)
- Finance and insurance (7%)
- Accommodation and food services (6%)
- Other services, except public administration (5%)
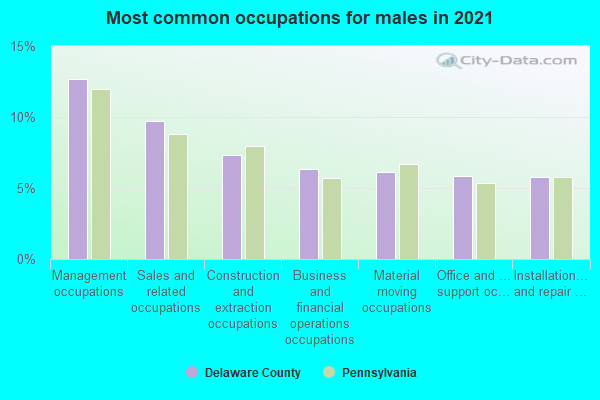
- Management occupations (11%)
- Sales and related occupations (9%)
- Business and financial operations occupations (9%)
- Office and administrative support occupations (8%)
- Construction and extraction occupations (7%)
- Computer and mathematical occupations (7%)
- Material moving occupations (6%)
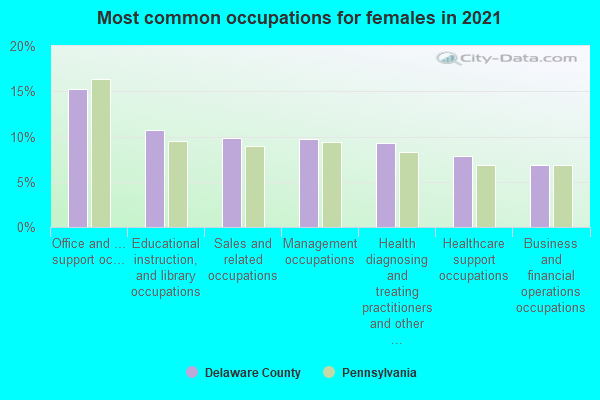
- Office and administrative support occupations (17%)
- Management occupations (11%)
- Educational instruction, and library occupations (10%)
- Healthcare support occupations (10%)
- Health diagnosing and treating practitioners and other technical occupations (8%)
- Sales and related occupations (8%)
- Business and financial operations occupations (7%)
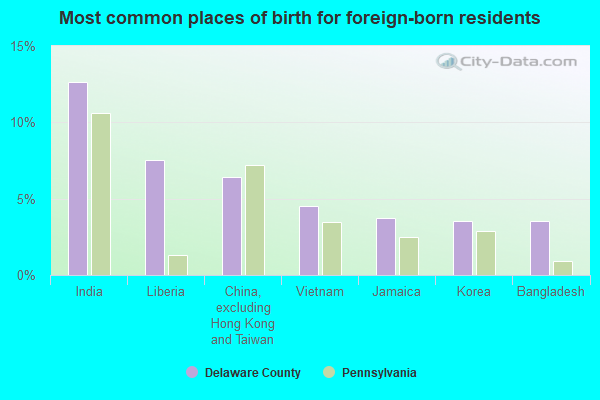
- India (9%)
- China, excluding Hong Kong and Taiwan (7%)
- Liberia (7%)
- Bangladesh (5%)
- Vietnam (4%)
- Jamaica (4%)
- Korea (3%)
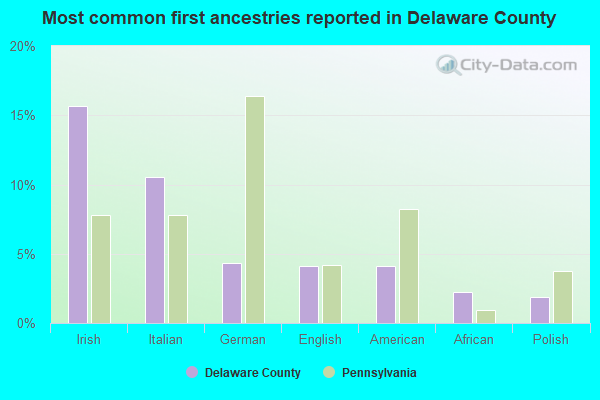
- Irish (16%)
- Italian (10%)
- German (4%)
- English (4%)
- American (4%)
- African (2%)
- Polish (2%)
People in group quarters in Delaware County, Pennsylvania in 2010:
- 12,718 people in college/university student housing
- 4,131 people in nursing facilities/skilled-nursing facilities
- 1,589 people in local jails and other municipal confinement facilities
- 1,185 people in state prisons
- 977 people in group homes intended for adults
- 769 people in correctional facilities intended for juveniles
- 638 people in other noninstitutional facilities
- 404 people in residential treatment centers for adults
- 338 people in emergency and transitional shelters (with sleeping facilities) for people experiencing homelessness
- 152 people in workers' group living quarters and job corps centers
- 96 people in residential treatment centers for juveniles (non-correctional)
- 48 people in group homes for juveniles (non-correctional)
- 10 people in in-patient hospice facilities
People in group quarters in Delaware County, Pennsylvania in 2000:
- 9,370 people in college dormitories (includes college quarters off campus)
- 5,389 people in nursing homes
- 1,497 people in other noninstitutional group quarters
- 1,306 people in local jails and other confinement facilities (including police lockups)
- 967 people in state prisons
- 743 people in religious group quarters
- 718 people in schools, hospitals, or wards for the intellectually disabled
- 690 people in homes for the mentally retarded
- 291 people in other nonhousehold living situations
- 252 people in training schools for juvenile delinquents
- 128 people in other group homes
- 90 people in homes for the mentally ill
- 65 people in homes or halfway houses for drug/alcohol abuse
- 59 people in short-term care, detention or diagnostic centers for delinquent children
- 57 people in agriculture workers' dormitories on farms
- 56 people in homes for abused, dependent, and neglected children
- 37 people in unknown juvenile institutions
- 14 people in other types of correctional institutions
- 8 people in hospitals/wards and hospices for chronically ill
- 8 people in hospices or homes for chronically ill
- 2 people in institutions for the blind
- 2 people in homes for the physically handicapped
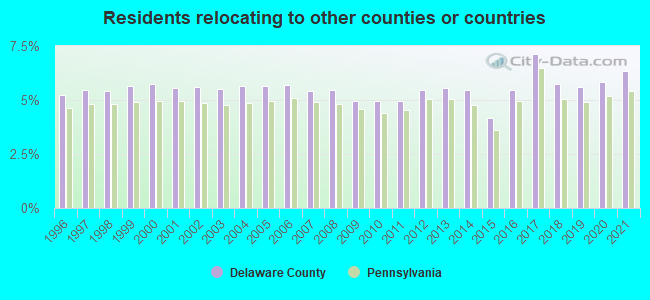
5.79% of this county's 2021 resident taxpayers lived in other counties in 2020 ($87,801 average adjusted gross income)
| Here: | 5.79% |
| Pennsylvania average: | 5.27% |
0.01% of residents moved from foreign countries ($122 average AGI)
Delaware County: 0.01% Pennsylvania average: 0.01%
3.77% relocated from other counties in Pennsylvania ($52,528 average AGI)
2.00% relocated from other states ($35,152 average AGI)
Delaware County: 2.00% Pennsylvania average: 2.30%

Top counties from which taxpayers relocated into this county between 2020 and 2021:
| from Philadelphia County, PA | |
| from Montgomery County, PA | |
| from Chester County, PA | |
| from New Castle County, DE | |
| from Bucks County, PA | |
| from New York County, NY | |
| from Camden County, NJ |
6.34% of this county's 2020 resident taxpayers moved to other counties in 2021 ($87,816 average adjusted gross income)
| Here: | 6.34% |
| Pennsylvania average: | 5.44% |
0.01% of residents moved to foreign countries ($90 average AGI)
Delaware County: 0.01% Pennsylvania average: 0.01%
3.49% relocated to other counties in Pennsylvania ($41,002 average AGI)
2.84% relocated to other states ($46,724 average AGI)
Delaware County: 2.84% Pennsylvania average: 2.47%
Top counties to which taxpayers relocated from this county between 2020 and 2021:
| to Philadelphia County, PA | |
| to Chester County, PA | |
| to Montgomery County, PA | |
| to New Castle County, DE | |
| to Bucks County, PA | |
| to Gloucester County, NJ | |
| to Camden County, NJ |
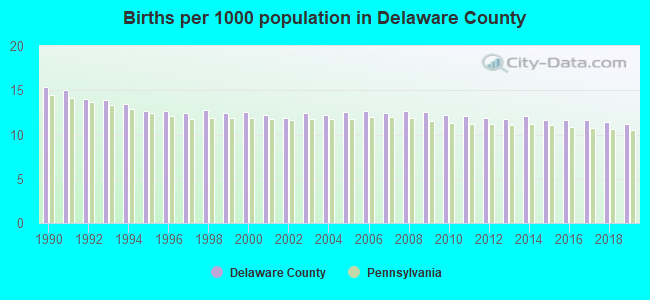
Births per 1000 population from 1990 to 1999: 13.5
Births per 1000 population from 2000 to 2009: 12.4
Births per 1000 population from 2010 to 2022: 9.9
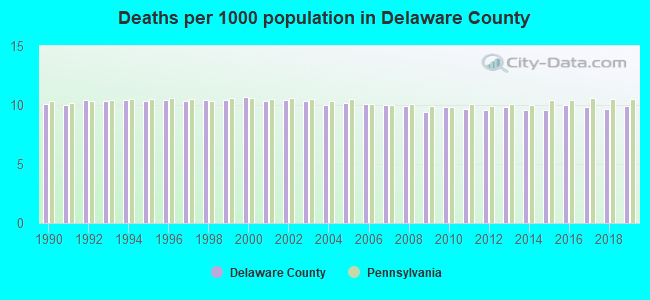
Deaths per 1000 population from 1990 to 1999: 10.3
Deaths per 1000 population from 2000 to 2009: 10.1
Deaths per 1000 population from 2010 to 2020: 9.9
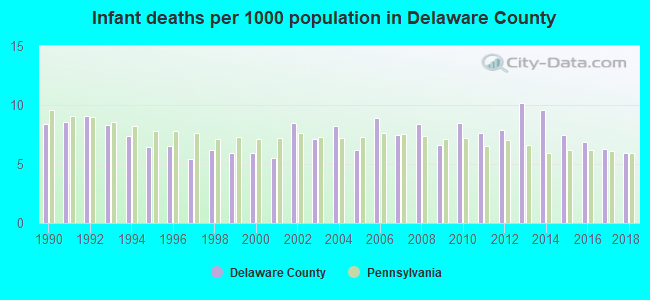
Infant deaths per 1000 live births from 1990 to 1999: 7.2
Infant deaths per 1000 live births from 2000 to 2009: 7.3
Infant deaths per 1000 live births from 2010 to 2021: 7.4
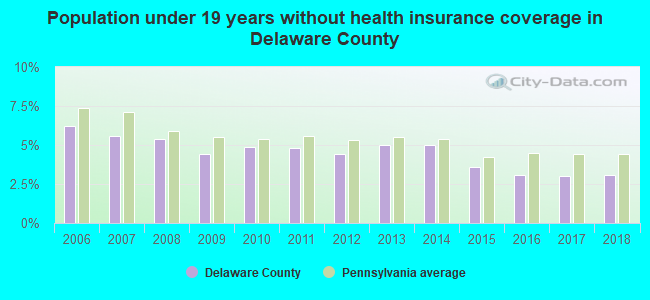
Persons under 19 years old without health insurance coverage in 2018: 3.1%
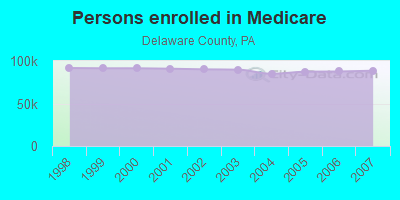
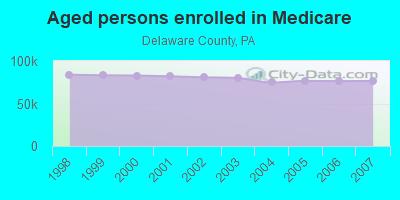
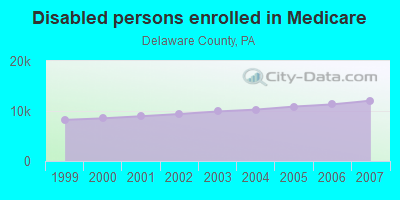
Persons enrolled in hospital insurance and/or supplemental medical insurance (Medicare) in July 1, 2007: 88,593 (76,501 aged, 12,092 disabled)
Children under 18 without health insurance coverage in 2007: 7,279 (5%)
Most common underlying causes of death in Delaware County, Pennsylvania in 1999 - 2019:
- Bronchus or lung, unspecified - Malignant neoplasms (7,263)
- Atherosclerotic heart disease (7,207)
- Acute myocardial infarction, unspecified (6,225)
- Atherosclerotic cardiovascular disease, so described (5,098)
- Unspecified dementia (4,568)
- Chronic obstructive pulmonary disease, unspecified (4,452)
- Stroke, not specified as haemorrhage or infarction (3,961)
- Congestive heart failure (2,947)
- Pneumonia, unspecified (2,535)
- Colon, unspecified - Malignant neoplasms (2,263)
Population without health insurance coverage in 2000: 8%
Children under 18 without health insurance coverage in 2000: 7%
Short term general hospital admissions per 100,000 population in 2004: 13,315
Short term general hospital beds per 100,000 population in 2004: 266
Emergency room visits per 100,000 population in 2004: 39,919
General practice office based MDs per 100,000 population in 2005: 1,232
Medical specialist MDs per 100,000 population in 2005: 970
Dentists per 100,000 population in 1998: 13
Total births per 100,000 population, July 2005 - July 2006 : 70
Total deaths per 100,000 population, July 2005 - July 2006: 79
Limited-service eating places per 100,000 population in 2005 : 17
Beer, wine & liquor stores per 100,000 population in 2005: 1
Fitness & recreation sports centers per 100,000 population in 2005: 3,592
Homicides per 1,000,000 population from 2000 to 2006: 64.9. This is more than state average.
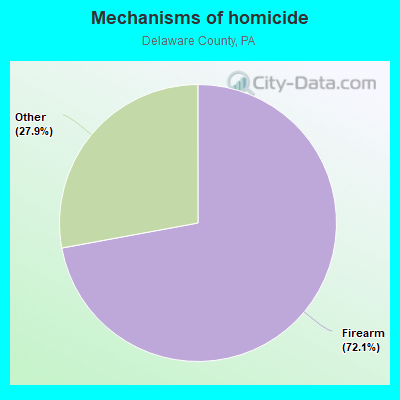
- Firearm - 46.8
- Other - 18.1
Suicides per 1,000,000 population from 2000 to 2006: 95.7. This is less than state average.
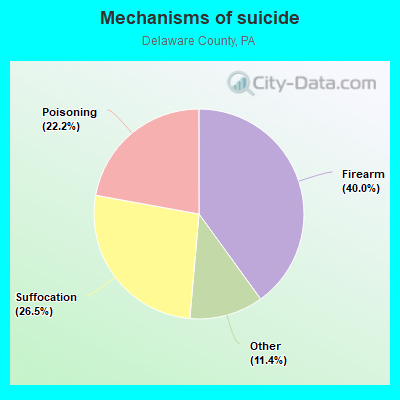
- Firearm - 38.3
- Suffocation - 25.3
- Poisoning - 21.2
- Other - 10.9
Household type by relationship:
Households: 575,182- Male householders: 101,495 (28,912 living alone), Female householders: 115,184 (37,107 living alone)
99,813 spouses (98,930 opposite-sex spouses), 12,025 unmarried partners, (11,489 opposite-sex unmarried partners), 177,318 children (171,318 natural, 2,502 adopted, 3,498 stepchildren), 14,815 grandchildren, 6,284 brothers or sisters, 7,684 parents, 291 foster children, 7,542 other relatives, 10,759 non-relatives
- In group quarters: 21,972
Size of family households: 59,275 2-persons, 32,377 3-persons, 28,238 4-persons, 14,463 5-persons, 4,247 6-persons, 1,573 7-or-more-persons.
Size of nonfamily households: 66,019 1-person, 9,085 2-persons, 1,238 3-persons, 128 4-persons, 36 6-persons.
77,436 married couples with children.
33,812 single-parent households (4,975 men, 28,837 women).
87.5% of residents of Delaware speak English at home.
2.8% of residents speak Spanish at home (56% speak English very well, 28% speak English well, 9% speak English not well, 7% don't speak English at all).
4.4% of residents speak other Indo-European language at home (66% speak English very well, 24% speak English well, 8% speak English not well, 3% don't speak English at all).
3.8% of residents speak Asian or Pacific Island language at home (66% speak English very well, 17% speak English well, 15% speak English not well, 2% don't speak English at all).
1.5% of residents speak other language at home (58% speak English very well, 29% speak English well, 11% speak English not well, 1% don't speak English at all).
In fiscal year 2004:
Federal Government expenditure: $4,218,386,000 ($7,600 per capita)
Department of Defense expenditure: $1,166,112,000
Federal direct payments to individuals for retirement and disability: $1,416,999,000
Federal other direct payments to individuals: $965,740,000
Federal direct payments not to individuals: $8,411,000
Federal grants: $423,227,000
Federal procurement contracts: $1,223,113,000 ($1,096,645,000 Department of Defense)
Federal salaries and wages: $180,897,000 ($35,689,000 Department of Defense)
Federal Government direct loans: $12,588,000
Federal guaranteed/insured loans: $261,666,000
Federal Government insurance: $258,056,000
Population change from April 1, 2000 to July 1, 2005:
Births: 35,907| Here: | 65 per 1000 residents |
| State: | 61 per 1000 residents |
Deaths: 29,780
| Here: | 54 per 1000 residents |
| State: | 54 per 1000 residents |
Net international migration: +6,807
| Here: | +12 per 1000 residents |
| State: | +8 per 1000 residents |
Net internal migration: -8,507
| Here: | |
| State: |
Total withdrawal of fresh water for public supply: 28.36 millions of gallons per day (0% from ground, 100% from surface)
| Here: | 7.0 |
| State: | 6.8 |
| Here: | 4.1 |
| State: | 4.3 |
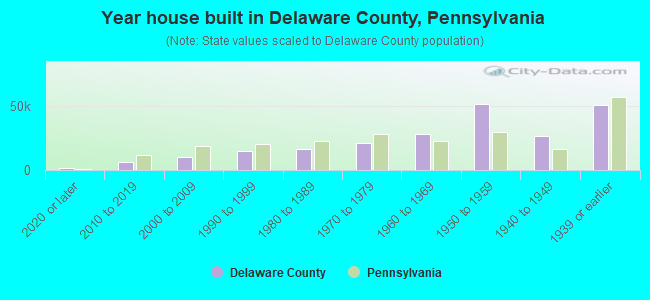
- Year house built in Delaware County, Pennsylvania
- 6932020 or later
- 8,5682010 to 2019
- 10,7652000 to 2009
- 13,4401990 to 1999
- 15,4451980 to 1989
- 22,2661970 to 1979
- 26,4581960 to 1969
- 57,3371950 to 1959
- 27,9871940 to 1949
- 46,8561939 or earlier
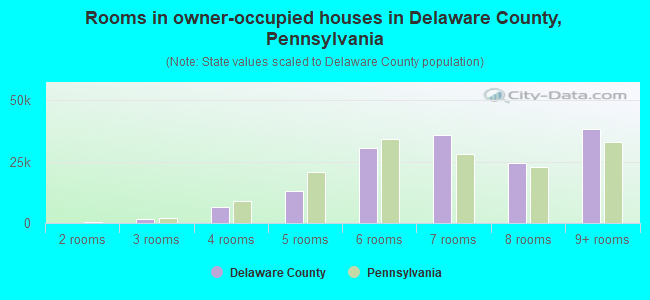
- Rooms in owner-occupied houses in Delaware County, Pennsylvania
- 4001 room
- 2922 rooms
- 1,2453 rooms
- 5,0684 rooms
- 14,3795 rooms
- 38,7626 rooms
- 31,7027 rooms
- 22,8468 rooms
- 36,9129+ rooms
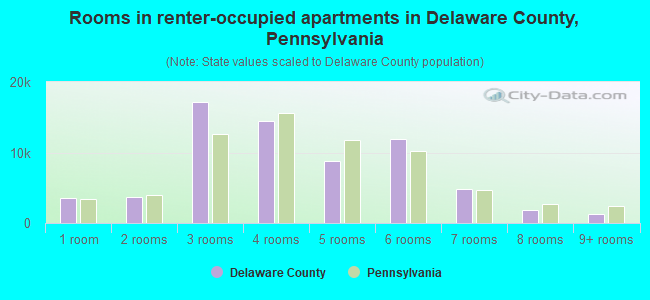
- Rooms in renter-occupied apartments in Delaware County, Pennsylvania
- 2,4921 room
- 3,1862 rooms
- 14,4993 rooms
- 19,8414 rooms
- 7,8065 rooms
- 10,2086 rooms
- 3,6587 rooms
- 1,0098 rooms
- 2,3749+ rooms
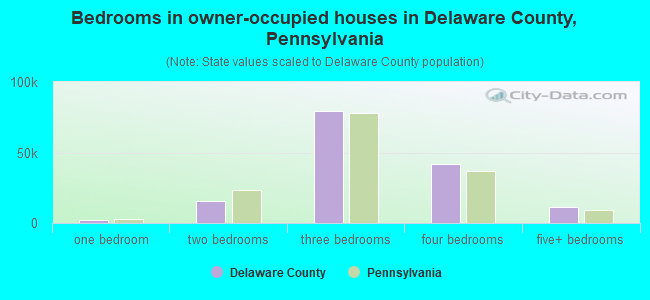
- Bedrooms in owner-occupied houses in Delaware County, Pennsylvania
- 400no bedroom
- 1,9661 bedroom
- 13,3242 bedrooms
- 84,2733 bedrooms
- 41,4194 bedrooms
- 10,2245+ bedrooms
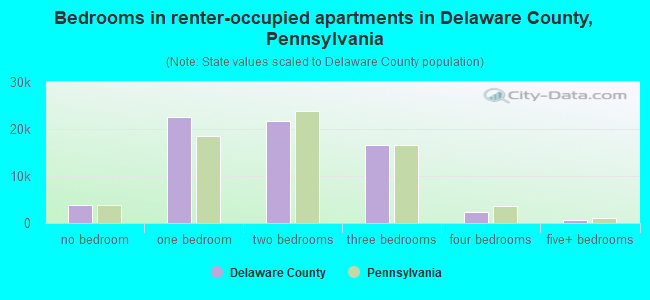
- Bedrooms in renter-occupied apartments in Delaware County, Pennsylvania
- 2,682no bedroom
- 22,1031 bedroom
- 23,2842 bedrooms
- 13,9343 bedrooms
- 1,9844 bedrooms
- 1,0865+ bedrooms
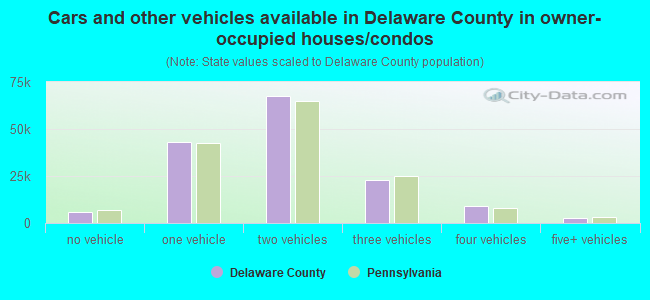
- Cars and other vehicles available in Delaware County in owner-occupied houses/condos
- 5,047no vehicle
- 47,9601 vehicle
- 66,2982 vehicles
- 22,7573 vehicles
- 7,3904 vehicles
- 2,1545+ vehicles
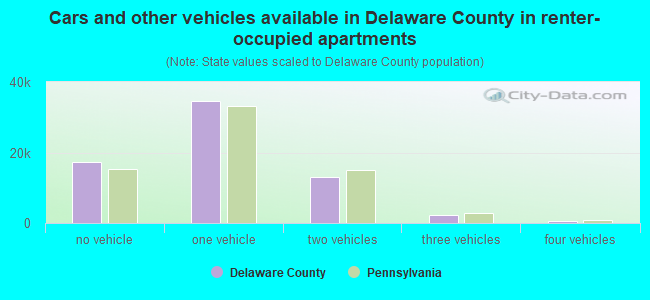
- Cars and other vehicles available in Delaware County in renter-occupied apartments
- 13,485no vehicle
- 39,2771 vehicle
- 10,4672 vehicles
- 1,4083 vehicles
- 3794 vehicles
- 575+ vehicles
91.5% of Delaware County residents lived in the same house 1 years ago.
Out of people who lived in different houses, 35% lived in this county.
Out of people who lived in different counties, 61% lived in Pennsylvania.
| Delaware County: | 91.5% |
| State average: | 89.3% |
Place of birth for U.S.-born residents:
- This state: 404,301
- Other state: 105,700
- Northeast: 44,953
- Midwest: 14,005
- South: 36,628
- West: 10,114
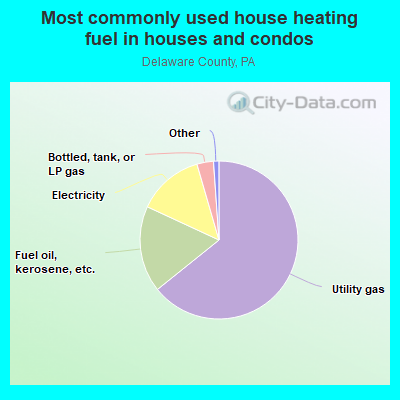
- 66.0%Utility gas
- 15.6%Fuel oil, kerosene, etc.
- 14.0%Electricity
- 2.9%Bottled, tank, or LP gas
- 0.6%Other fuel
- 0.3%Wood
- 0.3%No fuel used
- 0.2%Solar energy
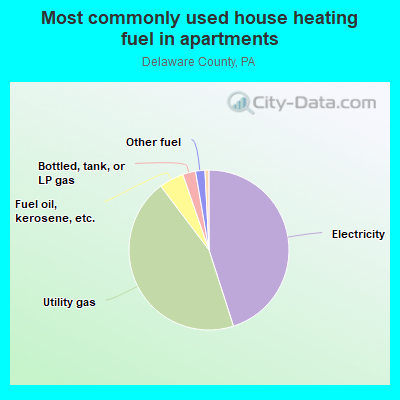
- 46.9%Utility gas
- 44.0%Electricity
- 4.9%Fuel oil, kerosene, etc.
- 2.3%Bottled, tank, or LP gas
- 1.2%No fuel used
- 0.7%Other fuel
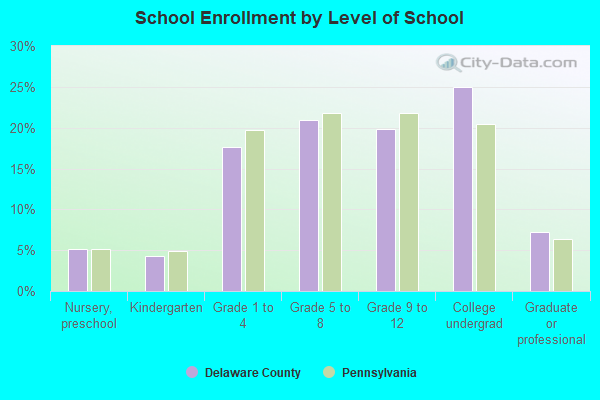
Private vs. public school enrollment:
| Here: | 16.1% |
| Pennsylvania: | 15.7% |
| Here: | 12.7% |
| Pennsylvania: | 13.4% |
| Here: | 57.7% |
| Pennsylvania: | 39.8% |
Delaware County government finances - Expenditure in 2018:
- Bond Funds - Cash and Securities: $62,613,000
Cash and Securities: $34,456,000
- Charges - Other: $92,592,000
Other: $92,545,000
- Construction - General Public Buildings: $9,525,000
General Public Buildings: $8,634,000
- Current Operations - Public Welfare - Other: $298,453,000
Public Welfare - Other: $275,126,000
General - Other: $110,918,000
General - Other: $99,833,000
Public Welfare Institutions: $76,475,000
Public Welfare Institutions: $71,509,000
Correctional Institutions: $71,274,000
Health - Other: $56,599,000
Correctional Institutions: $54,544,000
Judicial and Legal Services: $46,893,000
Judicial and Legal Services: $46,055,000
Central Staff Services: $24,563,000
Central Staff Services: $24,554,000
Police Protection: $22,000,000
Corrections - Other: $15,499,000
Corrections - Other: $15,481,000
General Public Buildings: $13,738,000
General Public Buildings: $9,525,000
Solid Waste Management: $9,000,000
Solid Waste Management: $8,990,000
Regular Highways: $4,924,000
Housing and Community Development: $4,746,000
Financial Administration: $4,395,000
Financial Administration: $3,800,000
Regular Highways: $2,527,000
Police Protection: $2,517,000
Libraries: $2,405,000
Libraries: $2,365,000
Parks and Recreation: $1,700,000
Parks and Recreation: $1,462,000
Natural Resources - Other: $350,000
Health - Other: $335,000
- General - Interest on Debt: $6,418,000
Interest on Debt: $6,390,000
- Intergovernmental to Local - Other - Transit Utilities: $8,162,000
Other - Transit Utilities: $7,723,000
- Long Term Debt - Beginning Outstanding - Unspecified Public Purpose: $310,062,000
Beginning Outstanding - Unspecified Public Purpose: $305,389,000
Outstanding Unspecified Public Purpose: $288,022,000
Outstanding Unspecified Public Purpose: $282,756,000
Retired Unspecified Public Purpose: $22,633,000
Retired Unspecified Public Purpose: $22,040,000
- Miscellaneous - General Revenue - Other: $13,158,000
General Revenue - Other: $10,093,000
Interest Earnings: $2,235,000
Interest Earnings: $916,000
- Other Funds - Cash and Securities: $309,745,000
Cash and Securities: $300,980,000
- State Intergovernmental - Public Welfare: $279,823,000
Public Welfare: $268,203,000
Other: $52,965,000
Health and Hospitals: $49,999,000
Health and Hospitals: $48,262,000
Other: $45,139,000
General Local Government Support: $24,136,000
General Local Government Support: $22,884,000
Housing and Community Development: $3,967,000
Housing and Community Development: $3,847,000
Highways: $2,160,000
Highways: $1,102,000
- Tax - Property: $179,420,000
Property: $175,190,000
Other Selective Sales: $1,991,000
Other License: $47,000
Other License: $26,000
- Total Salaries and Wages: $138,657,000
: $135,366,000
Delaware County government finances - Revenue in 2018:
- Bond Funds - Cash and Securities: $62,613,000
Cash and Securities: $34,456,000
- Charges - Other: $92,592,000
Other: $92,545,000
- Construction - General Public Buildings: $9,525,000
General Public Buildings: $8,634,000
- Current Operations - Public Welfare - Other: $298,453,000
Public Welfare - Other: $275,126,000
General - Other: $110,918,000
General - Other: $99,833,000
Public Welfare Institutions: $76,475,000
Public Welfare Institutions: $71,509,000
Correctional Institutions: $71,274,000
Health - Other: $56,599,000
Correctional Institutions: $54,544,000
Judicial and Legal Services: $46,893,000
Judicial and Legal Services: $46,055,000
Central Staff Services: $24,563,000
Central Staff Services: $24,554,000
Police Protection: $22,000,000
Corrections - Other: $15,499,000
Corrections - Other: $15,481,000
General Public Buildings: $13,738,000
General Public Buildings: $9,525,000
Solid Waste Management: $9,000,000
Solid Waste Management: $8,990,000
Regular Highways: $4,924,000
Housing and Community Development: $4,746,000
Financial Administration: $4,395,000
Financial Administration: $3,800,000
Regular Highways: $2,527,000
Police Protection: $2,517,000
Libraries: $2,405,000
Libraries: $2,365,000
Parks and Recreation: $1,700,000
Parks and Recreation: $1,462,000
Natural Resources - Other: $350,000
Health - Other: $335,000
- General - Interest on Debt: $6,418,000
Interest on Debt: $6,390,000
- Intergovernmental to Local - Other - Transit Utilities: $8,162,000
Other - Transit Utilities: $7,723,000
- Long Term Debt - Beginning Outstanding - Unspecified Public Purpose: $310,062,000
Beginning Outstanding - Unspecified Public Purpose: $305,389,000
Outstanding Unspecified Public Purpose: $288,022,000
Outstanding Unspecified Public Purpose: $282,756,000
Retired Unspecified Public Purpose: $22,633,000
Retired Unspecified Public Purpose: $22,040,000
- Miscellaneous - General Revenue - Other: $13,158,000
General Revenue - Other: $10,093,000
Interest Earnings: $2,235,000
Interest Earnings: $916,000
- Other Funds - Cash and Securities: $309,745,000
Cash and Securities: $300,980,000
- State Intergovernmental - Public Welfare: $279,823,000
Public Welfare: $268,203,000
Other: $52,965,000
Health and Hospitals: $49,999,000
Health and Hospitals: $48,262,000
Other: $45,139,000
General Local Government Support: $24,136,000
General Local Government Support: $22,884,000
Housing and Community Development: $3,967,000
Housing and Community Development: $3,847,000
Highways: $2,160,000
Highways: $1,102,000
- Tax - Property: $179,420,000
Property: $175,190,000
Other Selective Sales: $1,991,000
Other License: $47,000
Other License: $26,000
- Total Salaries and Wages: $138,657,000
: $135,366,000
Delaware County government finances - Debt in 2018:
- Bond Funds - Cash and Securities: $62,613,000
Cash and Securities: $34,456,000
- Charges - Other: $92,592,000
Other: $92,545,000
- Construction - General Public Buildings: $9,525,000
General Public Buildings: $8,634,000
- Current Operations - Public Welfare - Other: $298,453,000
Public Welfare - Other: $275,126,000
General - Other: $110,918,000
General - Other: $99,833,000
Public Welfare Institutions: $76,475,000
Public Welfare Institutions: $71,509,000
Correctional Institutions: $71,274,000
Health - Other: $56,599,000
Correctional Institutions: $54,544,000
Judicial and Legal Services: $46,893,000
Judicial and Legal Services: $46,055,000
Central Staff Services: $24,563,000
Central Staff Services: $24,554,000
Police Protection: $22,000,000
Corrections - Other: $15,499,000
Corrections - Other: $15,481,000
General Public Buildings: $13,738,000
General Public Buildings: $9,525,000
Solid Waste Management: $9,000,000
Solid Waste Management: $8,990,000
Regular Highways: $4,924,000
Housing and Community Development: $4,746,000
Financial Administration: $4,395,000
Financial Administration: $3,800,000
Regular Highways: $2,527,000
Police Protection: $2,517,000
Libraries: $2,405,000
Libraries: $2,365,000
Parks and Recreation: $1,700,000
Parks and Recreation: $1,462,000
Natural Resources - Other: $350,000
Health - Other: $335,000
- General - Interest on Debt: $6,418,000
Interest on Debt: $6,390,000
- Intergovernmental to Local - Other - Transit Utilities: $8,162,000
Other - Transit Utilities: $7,723,000
- Long Term Debt - Beginning Outstanding - Unspecified Public Purpose: $310,062,000
Beginning Outstanding - Unspecified Public Purpose: $305,389,000
Outstanding Unspecified Public Purpose: $288,022,000
Outstanding Unspecified Public Purpose: $282,756,000
Retired Unspecified Public Purpose: $22,633,000
Retired Unspecified Public Purpose: $22,040,000
- Miscellaneous - General Revenue - Other: $13,158,000
General Revenue - Other: $10,093,000
Interest Earnings: $2,235,000
Interest Earnings: $916,000
- Other Funds - Cash and Securities: $309,745,000
Cash and Securities: $300,980,000
- State Intergovernmental - Public Welfare: $279,823,000
Public Welfare: $268,203,000
Other: $52,965,000
Health and Hospitals: $49,999,000
Health and Hospitals: $48,262,000
Other: $45,139,000
General Local Government Support: $24,136,000
General Local Government Support: $22,884,000
Housing and Community Development: $3,967,000
Housing and Community Development: $3,847,000
Highways: $2,160,000
Highways: $1,102,000
- Tax - Property: $179,420,000
Property: $175,190,000
Other Selective Sales: $1,991,000
Other License: $47,000
Other License: $26,000
- Total Salaries and Wages: $138,657,000
: $135,366,000
Delaware County government finances - Cash and Securities in 2018:
- Bond Funds - Cash and Securities: $62,613,000
Cash and Securities: $34,456,000
- Charges - Other: $92,592,000
Other: $92,545,000
- Construction - General Public Buildings: $9,525,000
General Public Buildings: $8,634,000
- Current Operations - Public Welfare - Other: $298,453,000
Public Welfare - Other: $275,126,000
General - Other: $110,918,000
General - Other: $99,833,000
Public Welfare Institutions: $76,475,000
Public Welfare Institutions: $71,509,000
Correctional Institutions: $71,274,000
Health - Other: $56,599,000
Correctional Institutions: $54,544,000
Judicial and Legal Services: $46,893,000
Judicial and Legal Services: $46,055,000
Central Staff Services: $24,563,000
Central Staff Services: $24,554,000
Police Protection: $22,000,000
Corrections - Other: $15,499,000
Corrections - Other: $15,481,000
General Public Buildings: $13,738,000
General Public Buildings: $9,525,000
Solid Waste Management: $9,000,000
Solid Waste Management: $8,990,000
Regular Highways: $4,924,000
Housing and Community Development: $4,746,000
Financial Administration: $4,395,000
Financial Administration: $3,800,000
Regular Highways: $2,527,000
Police Protection: $2,517,000
Libraries: $2,405,000
Libraries: $2,365,000
Parks and Recreation: $1,700,000
Parks and Recreation: $1,462,000
Natural Resources - Other: $350,000
Health - Other: $335,000
- General - Interest on Debt: $6,418,000
Interest on Debt: $6,390,000
- Intergovernmental to Local - Other - Transit Utilities: $8,162,000
Other - Transit Utilities: $7,723,000
- Long Term Debt - Beginning Outstanding - Unspecified Public Purpose: $310,062,000
Beginning Outstanding - Unspecified Public Purpose: $305,389,000
Outstanding Unspecified Public Purpose: $288,022,000
Outstanding Unspecified Public Purpose: $282,756,000
Retired Unspecified Public Purpose: $22,633,000
Retired Unspecified Public Purpose: $22,040,000
- Miscellaneous - General Revenue - Other: $13,158,000
General Revenue - Other: $10,093,000
Interest Earnings: $2,235,000
Interest Earnings: $916,000
- Other Funds - Cash and Securities: $309,745,000
Cash and Securities: $300,980,000
- State Intergovernmental - Public Welfare: $279,823,000
Public Welfare: $268,203,000
Other: $52,965,000
Health and Hospitals: $49,999,000
Health and Hospitals: $48,262,000
Other: $45,139,000
General Local Government Support: $24,136,000
General Local Government Support: $22,884,000
Housing and Community Development: $3,967,000
Housing and Community Development: $3,847,000
Highways: $2,160,000
Highways: $1,102,000
- Tax - Property: $179,420,000
Property: $175,190,000
Other Selective Sales: $1,991,000
Other License: $47,000
Other License: $26,000
- Total Salaries and Wages: $138,657,000
: $135,366,000
Supplemental Security Income (SSI) in 2006:
- Total number of recipients: 9,972
- Number of aged recipients: 1,143
- Number of blind and disabled recipients: 8,829
- Number of recipients under 18: 1,982
- Number of recipients between 18 and 64: 6,057
- Number of recipients older than 64: 1,933
- Number of recipients also receiving OASDI: 2,719
- Amount of payments (thousands of dollars): 4,665
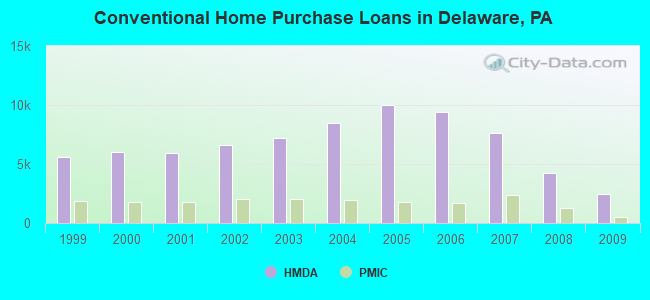
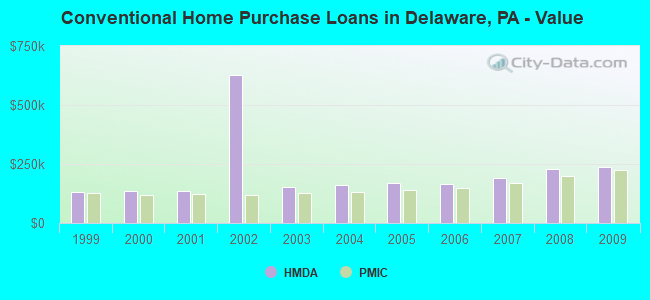
| Home Mortgage Disclosure Act Aggregated Statistics For Year 2009 (Based on 146 full tracts) | ||||||||||||||
| A) FHA, FSA/RHS & VA Home Purchase Loans | B) Conventional Home Purchase Loans | C) Refinancings | D) Home Improvement Loans | E) Loans on Dwellings For 5+ Families | F) Non-occupant Loans on < 5 Family Dwellings (A B C & D) | G) Loans On Manufactured Home Dwelling (A B C & D) | ||||||||
|---|---|---|---|---|---|---|---|---|---|---|---|---|---|---|
| Number | Average Value | Number | Average Value | Number | Average Value | Number | Average Value | Number | Average Value | Number | Average Value | Number | Average Value | |
| LOANS ORIGINATED | 2,248 | $175,472 | 2,490 | $237,077 | 12,132 | $214,146 | 1,100 | $82,387 | 27 | $886,074 | 497 | $134,801 | 1 | $28,000 |
| APPLICATIONS APPROVED, NOT ACCEPTED | 92 | $162,043 | 186 | $278,602 | 1,190 | $206,474 | 183 | $56,568 | 1 | $1,200,000 | 42 | $128,071 | 1 | $25,000 |
| APPLICATIONS DENIED | 272 | $151,908 | 416 | $212,195 | 4,195 | $195,215 | 1,066 | $39,614 | 8 | $1,102,000 | 299 | $101,896 | 9 | $38,444 |
| APPLICATIONS WITHDRAWN | 200 | $168,380 | 303 | $241,043 | 2,911 | $203,354 | 216 | $90,894 | 2 | $1,450,000 | 109 | $127,596 | 1 | $50,000 |
| FILES CLOSED FOR INCOMPLETENESS | 67 | $169,657 | 76 | $265,039 | 804 | $199,437 | 84 | $109,714 | 0 | $0 | 28 | $142,679 | 0 | $0 |
| Private Mortgage Insurance Companies Aggregated Statistics For Year 2009 (Based on 131 full tracts) | ||||||
| A) Conventional Home Purchase Loans | B) Refinancings | C) Non-occupant Loans on < 5 Family Dwellings (A & B) | ||||
|---|---|---|---|---|---|---|
| Number | Average Value | Number | Average Value | Number | Average Value | |
| LOANS ORIGINATED | 522 | $224,165 | 296 | $239,943 | 6 | $262,833 |
| APPLICATIONS APPROVED, NOT ACCEPTED | 108 | $200,528 | 103 | $225,806 | 6 | $98,000 |
| APPLICATIONS DENIED | 69 | $212,348 | 51 | $223,157 | 2 | $204,000 |
| APPLICATIONS WITHDRAWN | 15 | $193,733 | 32 | $214,344 | 1 | $73,000 |
| FILES CLOSED FOR INCOMPLETENESS | 8 | $202,000 | 3 | $218,000 | 0 | $0 |
| Most common first names in Delaware County, PA among deceased individuals | ||
| Name | Count | Lived (average) |
|---|---|---|
| John | 5,041 | 73.4 years |
| Mary | 4,708 | 80.4 years |
| William | 3,893 | 73.7 years |
| Joseph | 2,971 | 73.5 years |
| James | 2,859 | 71.9 years |
| Margaret | 2,421 | 79.1 years |
| Anna | 2,170 | 81.5 years |
| Charles | 2,097 | 74.2 years |
| Helen | 2,072 | 79.9 years |
| Robert | 2,049 | 70.9 years |
| Most common last names in Delaware County, PA among deceased individuals | ||
| Last name | Count | Lived (average) |
|---|---|---|
| Smith | 1,088 | 75.3 years |
| Johnson | 720 | 73.5 years |
| Brown | 604 | 74.9 years |
| Jones | 603 | 74.7 years |
| Miller | 556 | 76.2 years |
| Davis | 491 | 74.2 years |
| Williams | 473 | 73.9 years |
| Wilson | 397 | 73.8 years |
| Kelly | 375 | 75.2 years |
| Thomas | 364 | 74.5 years |
| Businesses in Delaware County, PA | ||||
| Name | Count | Name | Count | |
|---|---|---|---|---|
| 7-Eleven | 13 | Kroger | 2 | |
| ALDI | 1 | LA Fitness | 2 | |
| AMF Bowling | 1 | La-Z-Boy | 4 | |
| AT&T | 7 | Lane Bryant | 2 | |
| Ace Hardware | 2 | Lane Furniture | 3 | |
| Advance Auto Parts | 3 | LensCrafters | 2 | |
| Aeropostale | 2 | Little Caesars Pizza | 1 | |
| American Eagle Outfitters | 2 | Macy's | 1 | |
| Ann Taylor | 3 | Marriott | 3 | |
| Applebee's | 2 | Marshalls | 3 | |
| Arby's | 4 | MasterBrand Cabinets | 39 | |
| AutoZone | 4 | McDonald's | 16 | |
| Avenue | 1 | Men's Wearhouse | 2 | |
| Bakers | 1 | Motel 6 | 1 | |
| Bally Total Fitness | 1 | Motherhood Maternity | 5 | |
| Banana Republic | 1 | New Balance | 5 | |
| Barnes & Noble | 1 | New York & Co | 1 | |
| Baskin-Robbins | 2 | Nike | 31 | |
| Bath & Body Works | 3 | Nissan | 2 | |
| Bed Bath & Beyond | 2 | Office Depot | 1 | |
| Best Western | 1 | Old Country Buffet | 1 | |
| Blockbuster | 3 | Old Navy | 1 | |
| Budget Car Rental | 1 | Olive Garden | 1 | |
| Burger King | 6 | Outback | 3 | |
| CVS | 22 | Outback Steakhouse | 3 | |
| Casual Male XL | 1 | Pac Sun | 1 | |
| Catherines | 1 | Panda Express | 1 | |
| Charlotte Russe | 2 | Panera Bread | 3 | |
| Chevrolet | 2 | Papa John's Pizza | 2 | |
| Chick-Fil-A | 4 | Pathmark | 5 | |
| Chipotle | 1 | Payless | 6 | |
| Chuck E. Cheese's | 1 | Penske | 3 | |
| Church's Chicken | 1 | PetSmart | 4 | |
| Cold Stone Creamery | 1 | Pier 1 Imports | 2 | |
| Coldwater Creek | 1 | Pizza Hut | 4 | |
| ColorTyme | 1 | Plato's Closet | 1 | |
| Comfort Inn | 1 | Popeyes | 3 | |
| Cricket Wireless | 11 | Pottery Barn | 1 | |
| Curves | 2 | Qdoba Mexican Grill | 1 | |
| DHL | 4 | Quality | 2 | |
| Dairy Queen | 4 | Quiznos | 2 | |
| Days Inn | 2 | RadioShack | 6 | |
| Deb | 1 | Ramada | 1 | |
| Decora Cabinetry | 8 | Raymour & Flanigan | 2 | |
| Dennys | 3 | Red Lobster | 1 | |
| Domino's Pizza | 3 | Red Roof Inn | 1 | |
| DressBarn | 5 | Rite Aid | 23 | |
| Dressbarn | 3 | Rodeway Inn | 1 | |
| Dunkin Donuts | 23 | Ruby Tuesday | 2 | |
| Econo Lodge | 1 | SAS Shoes | 2 | |
| Eddie Bauer | 1 | Safeway | 2 | |
| Express | 1 | Sears | 5 | |
| Famous Footwear | 2 | Spencer Gifts | 1 | |
| Fashion Bug | 3 | Sprint Nextel | 8 | |
| FedEx | 79 | Staples | 4 | |
| Finish Line | 1 | Starbucks | 10 | |
| Foot Locker | 3 | Subway | 10 | |
| GNC | 11 | T-Mobile | 13 | |
| GameStop | 12 | T.J.Maxx | 2 | |
| Gap | 3 | Taco Bell | 6 | |
| Giant | 5 | Talbots | 2 | |
| Gymboree | 2 | Target | 3 | |
| H&R Block | 11 | The Limited | 1 | |
| Hilton | 2 | The Room Place | 1 | |
| Holiday Inn | 2 | Toyota | 2 | |
| Home Depot | 4 | Toys"R"Us | 6 | |
| Honda | 1 | Trader Joe's | 2 | |
| Hot Topic | 1 | True Value | 6 | |
| Hyundai | 1 | U-Haul | 12 | |
| IHOP | 1 | UPS | 92 | |
| J.Crew | 1 | Vans | 2 | |
| JCPenney | 1 | Verizon Wireless | 3 | |
| JoS. A. Bank | 2 | Victoria's Secret | 3 | |
| Jones New York | 4 | Vons | 2 | |
| Journeys | 2 | Walgreens | 7 | |
| Just Tires | 1 | Walmart | 3 | |
| Justice | 3 | Wendy's | 8 | |
| KFC | 5 | Wet Seal | 2 | |
| Kmart | 3 | Whole Foods Market | 1 | |
| Kohl's | 2 | YMCA | 4 | |
Delaware County on our top lists:
- #14 on the list of "Top 101 counties with the lowest ground withdrawal of fresh water for public supply (pop. 50,000+)"
- #16 on the list of "Top 101 counties with the largest increase in the number of infant deaths per 1000 residents 2000-2006 to 2007-2013 (pop. 50,000+)"
- #20 on the list of "Top 101 counties with the highest Particulate Matter (PM2.5) Annual air pollution readings in 2012 (µg/m3)"
- #40 on the list of "Top 101 counties with the most Mainline Protestant congregations"
- #40 on the list of "Top 101 counties with the most Mainline Protestant congregations (pop. 50,000+)"
- #46 on the list of "Top 101 counties with the highest number of infant deaths per 1000 residents 2007-2013 (pop. 50,000+)"
- #48 on the list of "Top 101 counties with the most Catholic adherents"
- #48 on the list of "Top 101 counties with the most Catholic adherents (pop. 50,000+)"
- #56 on the list of "Top 101 counties with the most Orthodox adherents"
- #56 on the list of "Top 101 counties with the most Orthodox adherents (pop. 50,000+)"
- #61 on the list of "Top 101 counties with the highest percentage of residents that drank alcohol in the past 30 days"
- #67 on the list of "Top 101 counties with the lowest percentage of residents that visited a dentist within the past year"
- #67 on the list of "Top 101 counties with the most Catholic congregations (pop. 50,000+)"
- #69 on the list of "Top 101 counties with the highest percentage of residents that smoked 100+ cigarettes in their lives"
- #70 on the list of "Top 101 counties with the most Catholic congregations"
- #70 on the list of "Top 101 counties with the most Mainline Protestant adherents"
- #70 on the list of "Top 101 counties with the most Mainline Protestant adherents (pop. 50,000+)"
- #72 on the list of "Top 101 counties with the largest increase in the number of births per 1000 residents 2000-2006 to 2007-2013 (pop 50,000+)"
- #80 on the list of "Top 101 counties with the lowest percentage of residents relocating from foreign countries between 2010 and 2011 (pop. 50,000+)"
- #81 on the list of "Top 101 counties with the lowest Particulate Matter (PM10) Annual air pollution readings in 2012 (µg/m3)"