Nether Providence Township, Pennsylvania
Submit your own pictures of this place and show them to the world
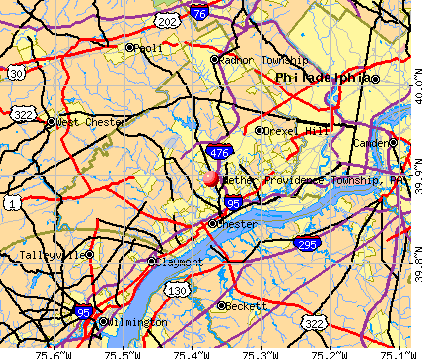
- OSM Map
- General Map
- Google Map
- MSN Map
| Males: 6,437 | |
| Females: 7,090 |
| Median resident age: | 41.6 years |
| Pennsylvania median age: | 38.0 years |
Zip codes: 19086.
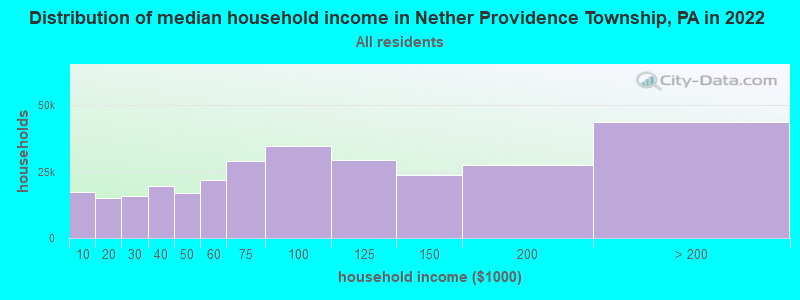
| Nether Providence Township: | $114,075 |
| PA: | $71,798 |
Estimated per capita income in 2022: $62,054 (it was $32,946 in 2000)
Nether Providence Township CDP income, earnings, and wages data
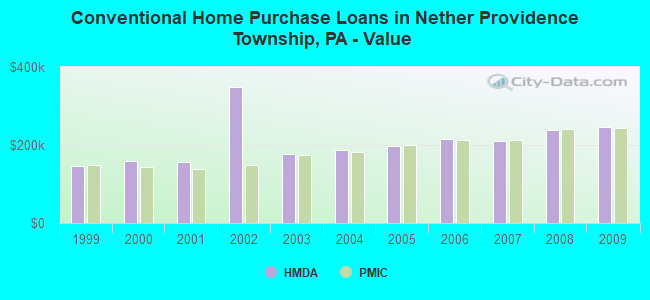
Estimated median house or condo value in 2022: $445,170 (it was $178,800 in 2000)
| Nether Providence Township: | $445,170 |
| PA: | $245,500 |
Mean prices in 2022: all housing units: $378,775; detached houses: $472,005; townhouses or other attached units: $221,007; in 2-unit structures: $266,124; in 3-to-4-unit structures: $339,250; in 5-or-more-unit structures: $227,575; mobile homes: $163,857; occupied boats, rvs, vans, etc.: $163,590
Nether Providence Township, PA residents, houses, and apartments details
Detailed information about poverty and poor residents in Nether Providence Township, PA
Compare current foreclosures near Nether Providence Township, PA:


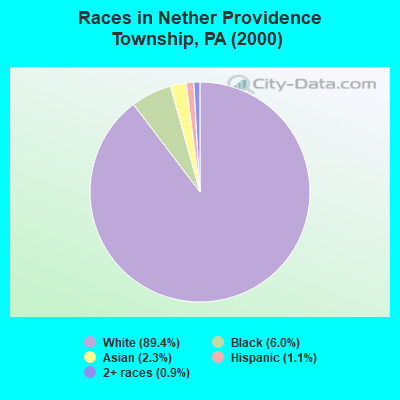
- 12,02889.4%White alone
- 8116.0%Black alone
- 3152.3%Asian alone
- 1521.1%Hispanic
- 1270.9%Two or more races
- 100.07%American Indian alone
- 80.06%Other race alone
- 50.04%Native Hawaiian and Other
Pacific Islander alone
Type |
2009 |
2010 |
2011 |
2012 |
2013 |
2014 |
2015 |
2016 |
2017 |
2018 |
2019 |
2020 |
2022 |
|---|---|---|---|---|---|---|---|---|---|---|---|---|---|
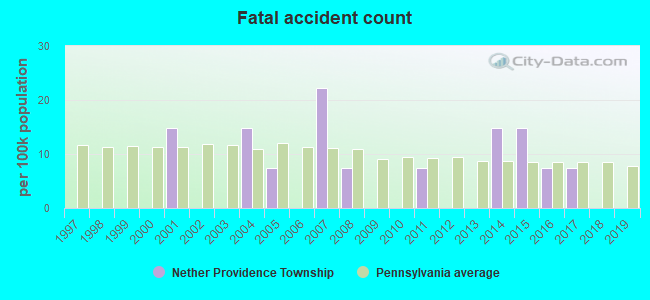
| Murders (per 100,000) | 0 (0.0) | 0 (0.0) | 0 (0.0) | 1 (7.3) | 2 (14.5) | 0 (0.0) | 0 (0.0) | 0 (0.0) | 1 (7.3) | 0 (0.0) | 0 (0.0) | 0 (0.0) | 0 (0.0) |
| Rapes (per 100,000) | 1 (7.6) | 3 (21.9) | 2 (14.5) | 0 (0.0) | 0 (0.0) | 1 (7.2) | 2 (14.5) | 0 (0.0) | 0 (0.0) | 2 (14.5) | 5 (36.4) | 0 (0.0) | 0 (0.0) |
| Robberies (per 100,000) | 0 (0.0) | 3 (21.9) | 3 (21.8) | 4 (29.1) | 2 (14.5) | 1 (7.2) | 2 (14.5) | 0 (0.0) | 1 (7.3) | 0 (0.0) | 1 (7.3) | 3 (21.8) | 1 (7.0) |
| Assaults (per 100,000) | 20 (152.4) | 23 (167.8) | 20 (145.5) | 16 (116.5) | 7 (50.9) | 19 (137.7) | 9 (65.1) | 15 (108.5) | 8 (58.0) | 10 (72.6) | 11 (80.0) | 10 (72.5) | 0 (0.0) |
| Burglaries (per 100,000) | 32 (243.8) | 25 (182.4) | 32 (232.7) | 44 (320.3) | 30 (218.1) | 14 (101.5) | 13 (94.0) | 14 (101.3) | 18 (130.5) | 9 (65.4) | 3 (21.8) | 7 (50.8) | 0 (0.0) |
| Thefts (per 100,000) | 119 (906.8) | 207 (1,510) | 150 (1,091) | 154 (1,121) | 108 (785.0) | 114 (826.4) | 229 (1,656) | 142 (1,027) | 116 (841.2) | 124 (900.5) | 74 (538.3) | 90 (652.7) | 24 (167.1) |
| Auto thefts (per 100,000) | 3 (22.9) | 2 (14.6) | 7 (50.9) | 2 (14.6) | 5 (36.3) | 3 (21.7) | 2 (14.5) | 9 (65.1) | 1 (7.3) | 2 (14.5) | 5 (36.4) | 2 (14.5) | 0 (0.0) |
| Arson (per 100,000) | 0 (0.0) | 0 (0.0) | 0 (0.0) | 1 (7.3) | 0 (0.0) | 2 (14.5) | 0 (0.0) | 0 (0.0) | 0 (0.0) | 0 (0.0) | 0 (0.0) | 0 (0.0) | 0 (0.0) |
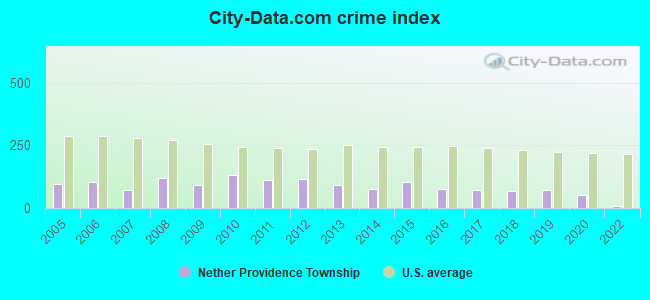
| City-Data.com crime index | 91.7 | 132.0 | 111.3 | 115.0 | 93.2 | 77.4 | 102.9 | 75.1 | 71.6 | 67.9 | 73.3 | 51.9 | 8.8 |
The City-Data.com crime index weighs serious crimes and violent crimes more heavily. Higher means more crime, U.S. average is 246.1. It adjusts for the number of visitors and daily workers commuting into cities.
Crime rate in Nether Providence Township detailed stats: murders, rapes, robberies, assaults, burglaries, thefts, arson
Full-time law enforcement employees in 2021, including police officers: 17 (16 officers - 16 male; 0 female).
| Officers per 1,000 residents here: | 1.16 |
| Pennsylvania average: | 2.55 |
 Recent articles from our blog. Our writers, many of them Ph.D. graduates or candidates, create easy-to-read articles on a wide variety of topics.

 | Best suburbs for easy commute (via train) + great schools? (26 replies) |
| Would Wallingford be a bad fit for me? (9 replies) |
| Moving to PA w/in 11 Months (15 replies) |
| House hunt for good school district (33 replies) |
| Chester vs North Philly (46 replies) |
| Where to live in southeast Pennsylvania suburbs? (11 replies) |
Latest news from Nether Providence Township, PA collected exclusively by city-data.com from local newspapers, TV, and radio stations
Ancestries: Irish (24.0%), German (18.8%), Italian (16.6%), English (14.2%), United States (3.9%), Polish (3.8%).
Current Local Time: EST time zone
Incorporated on about 1900
Land area: 4.71 square miles.
Population density: 2,873 people per square mile (average).
917 residents are foreign born (2.9% Europe, 2.3% Asia, 0.8% Latin America).
| This place: | 6.8% |
| Pennsylvania: | 4.1% |
| Nether Providence Township CDP: | 2.6% ($4,685) |
| Pennsylvania: | 1.6% ($1,552) |
Nearest city with pop. 50,000+: Brandywine, DE (9.7 miles  , pop. 78,620).
Nearest city with pop. 200,000+: Philadelphia, PA (14.1 miles , pop. 1,517,550).
Nearest cities:
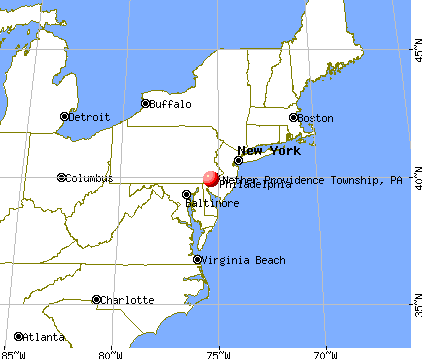
), ), ), ), ), )Latitude: 39.89 N, Longitude: 75.37 W
Daytime population change due to commuting: -3,224 (-24.0%)
Workers who live and work in this place: 779 (12.3%)
| Here: | 2.7% |
| Pennsylvania: | 2.9% |
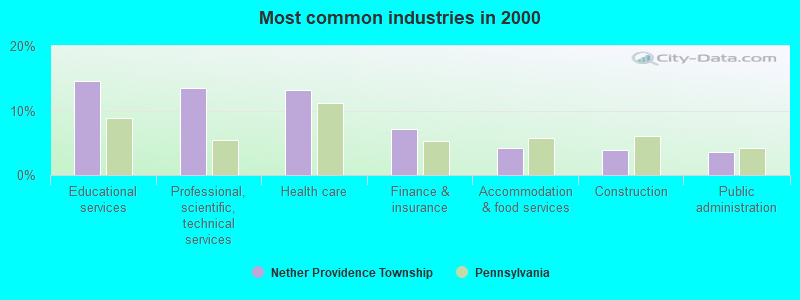
- Educational services (14.6%)
- Professional, scientific, technical services (13.4%)
- Health care (13.2%)
- Finance & insurance (7.2%)
- Accommodation & food services (4.1%)
- Construction (3.9%)
- Public administration (3.5%)
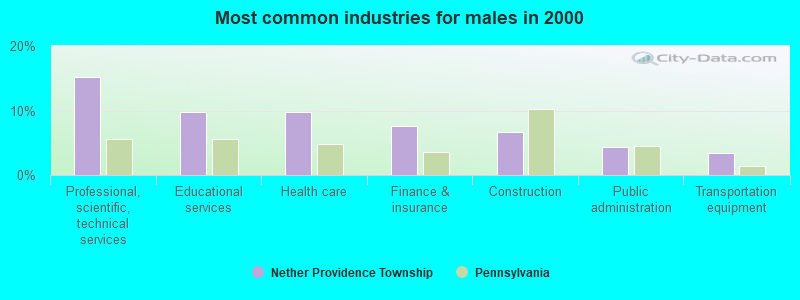
- Professional, scientific, technical services (15.1%)
- Educational services (9.8%)
- Health care (9.8%)
- Finance & insurance (7.6%)
- Construction (6.6%)
- Public administration (4.4%)
- Transportation equipment (3.4%)
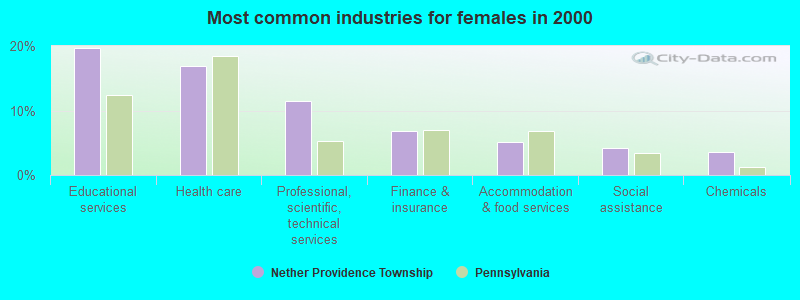
- Educational services (19.8%)
- Health care (16.9%)
- Professional, scientific, technical services (11.5%)
- Finance & insurance (6.8%)
- Accommodation & food services (5.1%)
- Social assistance (4.1%)
- Chemicals (3.5%)
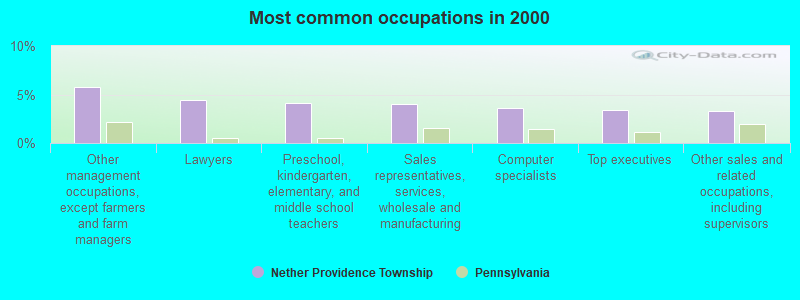
- Other management occupations, except farmers and farm managers (5.7%)
- Lawyers (4.4%)
- Preschool, kindergarten, elementary, and middle school teachers (4.2%)
- Sales representatives, services, wholesale and manufacturing (4.0%)
- Computer specialists (3.6%)
- Top executives (3.4%)
- Other sales and related occupations, including supervisors (3.3%)
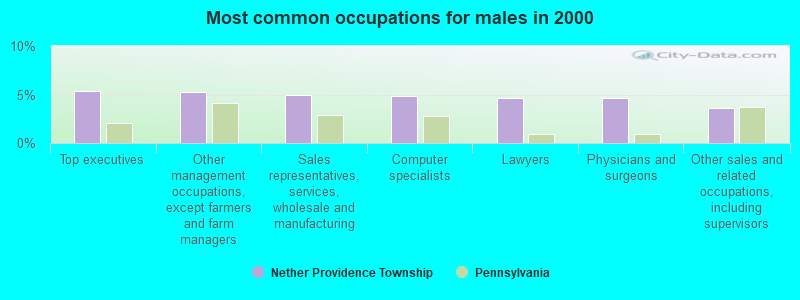
- Top executives (5.4%)
- Other management occupations, except farmers and farm managers (5.3%)
- Sales representatives, services, wholesale and manufacturing (5.0%)
- Computer specialists (4.8%)
- Lawyers (4.6%)
- Physicians and surgeons (4.6%)
- Other sales and related occupations, including supervisors (3.6%)
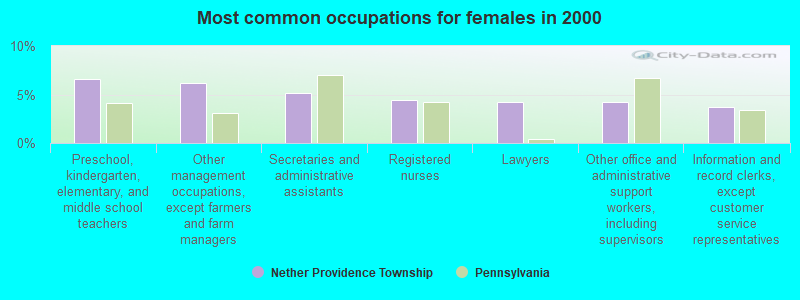
- Preschool, kindergarten, elementary, and middle school teachers (6.6%)
- Other management occupations, except farmers and farm managers (6.2%)
- Secretaries and administrative assistants (5.1%)
- Registered nurses (4.5%)
- Lawyers (4.3%)
- Other office and administrative support workers, including supervisors (4.2%)
- Information and record clerks, except customer service representatives (3.7%)
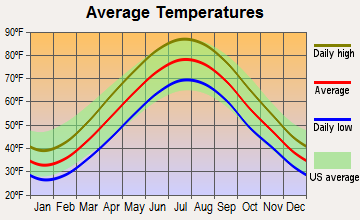
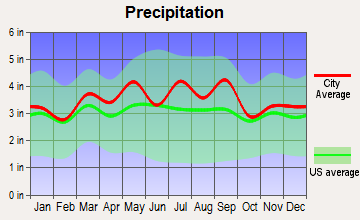
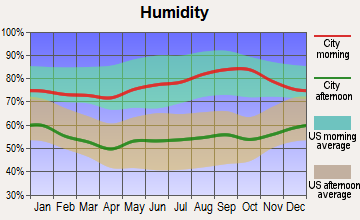
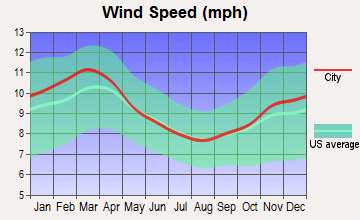
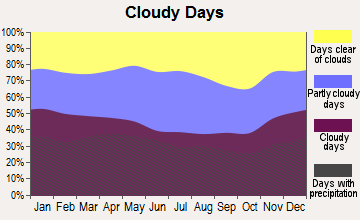
Average climate in Nether Providence Township, Pennsylvania
Based on data reported by over 4,000 weather stations
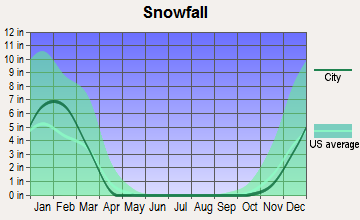
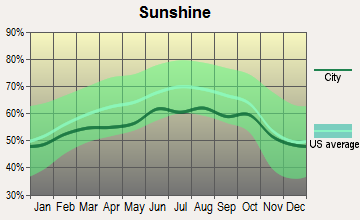
(lower is better)
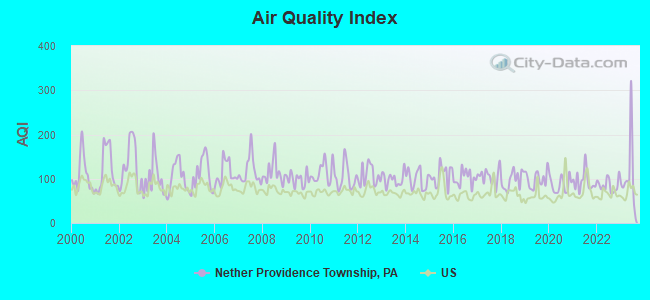
Air Quality Index (AQI) level in 2023 was 110. This is significantly worse than average.
| City: | 110 |
| U.S.: | 73 |
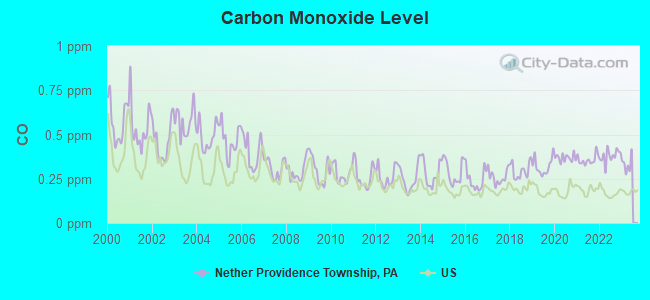
Carbon Monoxide (CO) [ppm] level in 2022 was 0.379. This is significantly worse than average. Closest monitor was 4.1 miles away from the city center.
| City: | 0.379 |
| U.S.: | 0.251 |
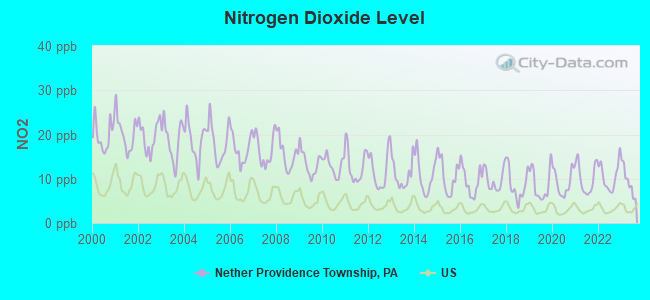
Nitrogen Dioxide (NO2) [ppb] level in 2023 was 9.44. This is significantly worse than average. Closest monitor was 4.1 miles away from the city center.
| City: | 9.44 |
| U.S.: | 5.11 |
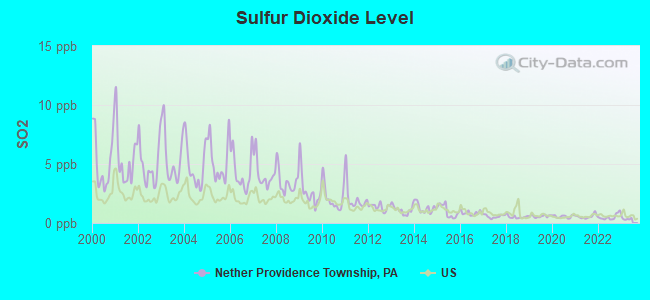
Sulfur Dioxide (SO2) [ppb] level in 2022 was 0.512. This is significantly better than average. Closest monitor was 5.2 miles away from the city center.
| City: | 0.512 |
| U.S.: | 1.515 |
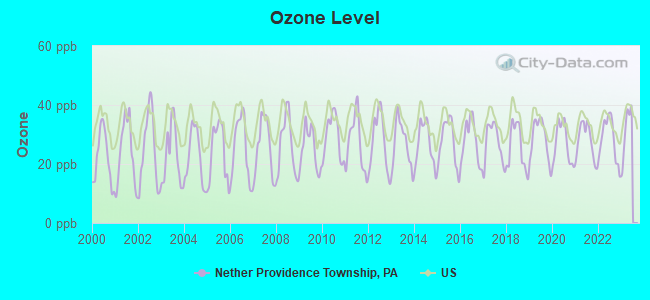
Ozone [ppb] level in 2022 was 28.3. This is about average. Closest monitor was 4.1 miles away from the city center.
| City: | 28.3 |
| U.S.: | 33.3 |
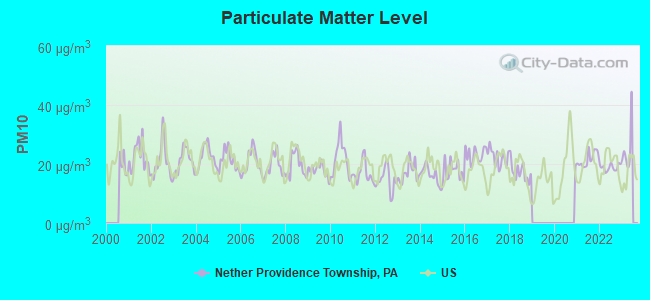
Particulate Matter (PM10) [µg/m3] level in 2022 was 18.9. This is about average. Closest monitor was 4.1 miles away from the city center.
| City: | 18.9 |
| U.S.: | 19.2 |
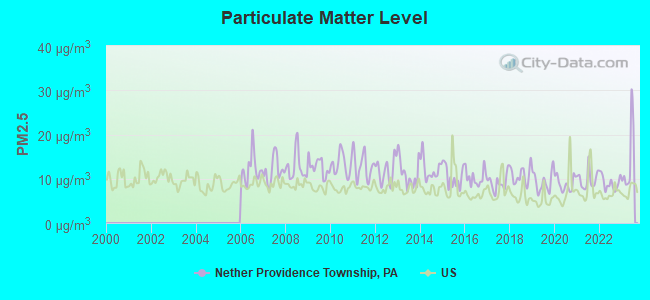
Particulate Matter (PM2.5) [µg/m3] level in 2023 was 14.2. This is significantly worse than average. Closest monitor was 4.1 miles away from the city center.
| City: | 14.2 |
| U.S.: | 8.1 |
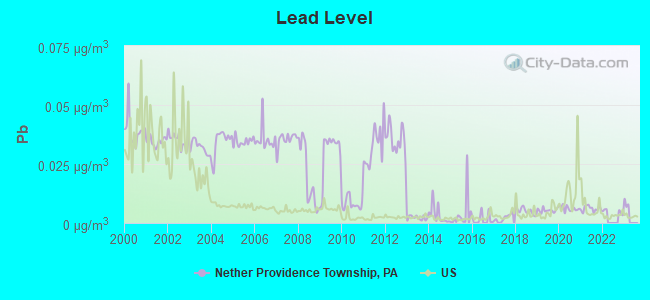
Lead (Pb) [µg/m3] level in 2021 was 0.00608. This is significantly better than average. Closest monitor was 1.1 miles away from the city center.
| City: | 0.00608 |
| U.S.: | 0.00931 |
Tornado activity:
Nether Providence Township-area historical tornado activity is slightly above Pennsylvania state average. It is 4% greater than the overall U.S. average.
On 3/22/1955, a category F3 (max. wind speeds 158-206 mph) tornado 11.9 miles away from the Nether Providence Township place center killed one person and caused between $50,000 and $500,000 in damages.
On 4/28/1961, a category F3 tornado 18.7 miles away from the place center caused between $5000 and $50,000 in damages.
Earthquake activity:
Nether Providence Township-area historical earthquake activity is significantly above Pennsylvania state average. It is 65% smaller than the overall U.S. average.On 8/23/2011 at 17:51:04, a magnitude 5.8 (5.8 MW, Depth: 3.7 mi, Class: Moderate, Intensity: VI - VII) earthquake occurred 194.6 miles away from the city center
On 1/16/1994 at 01:49:16, a magnitude 4.6 (4.6 MB, 4.6 LG, Depth: 3.1 mi, Class: Light, Intensity: IV - V) earthquake occurred 46.2 miles away from Nether Providence Township center
On 1/16/1994 at 00:42:43, a magnitude 4.2 (4.2 MB, 4.0 LG, Depth: 3.1 mi) earthquake occurred 44.9 miles away from the city center
On 10/7/1983 at 10:18:46, a magnitude 5.3 (5.1 MB, 5.3 LG, 5.1 ML) earthquake occurred 285.7 miles away from Nether Providence Township center
On 11/30/2017 at 21:47:31, a magnitude 4.1 (4.1 MW, Depth: 6.1 mi) earthquake occurred 48.3 miles away from the city center
On 9/25/1998 at 19:52:52, a magnitude 5.2 (4.8 MB, 4.3 MS, 5.2 LG, 4.5 MW, Depth: 3.1 mi) earthquake occurred 285.5 miles away from Nether Providence Township center
Magnitude types: regional Lg-wave magnitude (LG), body-wave magnitude (MB), local magnitude (ML), surface-wave magnitude (MS), moment magnitude (MW)
Natural disasters:
The number of natural disasters in Delaware County (21) is greater than the US average (15).Major Disasters (Presidential) Declared: 15
Emergencies Declared: 6
Causes of natural disasters: Hurricanes: 5, Floods: 4, Winter Storms: 4, Storms: 3, Tropical Storms: 3, Snowstorms: 2, Blizzard: 1, Snowfall: 1, Tropical Depression: 1, Water Shortage: 1, Other: 1 (Note: some incidents may be assigned to more than one category).
Hospitals and medical centers near Nether Providence Township:
- WALLINGFORD NURSING AND REHAB (Nursing Home, about 1 miles away; WALLINGFORD, PA)
- WALLINGFORD,THE (Nursing Home, about 1 miles away; WALLINGFORD, PA)
- FRESENIUS MEDICAL CARE SWARTHMORE (Dialysis Facility, about 2 miles away; SWARTHMORE, PA)
- MANCHESTER HOUSE NURSING AND C (Nursing Home, about 2 miles away; MEDIA, PA)
- ELWYN NETHER PROVIDENCE (Hospital, about 2 miles away; WALLINGFORD, PA)
- THE BELVEDERE CENTER, GENESIS HEALTHCARE (Nursing Home, about 2 miles away; CHESTER, PA)
- ELWYN INC/WOODLYN (Hospital, about 2 miles away; WOODLYN, PA)
Amtrak stations near Nether Providence Township:
- 9 miles: ARDMORE (STATION RD. & LANCASTER AVE.) . Services: enclosed waiting area, public restrooms, public payphones, paid short-term parking, call for car rental service, call for taxi service, public transit connection.
- 11 miles: PHILADELPHIA (30TH & MARKET STS.) . Services: ticket office, fully wheelchair accessible, enclosed waiting area, public restrooms, public payphones, snack bar, ATM, paid short-term parking, paid long-term parking, car rental agency, taxi stand, public transit connection.
- 12 miles: PAOLI (LANCASTER PIKE & S. VALLEY RD.) . Services: ticket office, enclosed waiting area, public restrooms, public payphones, ATM, paid short-term parking, paid long-term parking, call for car rental service, call for taxi service, public transit connection.
Colleges/universities with over 2000 students nearest to Nether Providence Township:
- Widener University-Main Campus (about 3 miles; Chester, PA; Full-time enrollment: 4,051)
- Neumann University (about 4 miles; Aston, PA; FT enrollment: 2,622)
- Delaware County Community College (about 6 miles; Media, PA; FT enrollment: 8,419)
- University of the Sciences (about 10 miles; Philadelphia, PA; FT enrollment: 2,464)
- Saint Joseph's University (about 10 miles; Philadelphia, PA; FT enrollment: 7,329)
- Villanova University (about 11 miles; Villanova, PA; FT enrollment: 9,350)
- University of Pennsylvania (about 11 miles; Philadelphia, PA; FT enrollment: 25,693)
Points of interest:
Notable locations in Nether Providence Township: Wallingford Mills (A), Hinkson Cors (B), Strath Haven (C), Walling Ford Mills (D), Todmorden Mills (E), Crosbyville (F), Hinksons Corners (G), Briggsville (H), Springhaven Country Club (I), Beatty Road Station (J), Nether Providence Township Building (K), Pine Ridge Station (L), Wallingford Station (M), Helen Kate Furness Library (N), Garden City Fire Company Station 65 (O), Nether Providence Township Police Department (P), South Media Fire Company Station 51 (Q). Display/hide their locations on the map
Churches in Nether Providence Township include: Holy Trinity Church (A), Grace Church (B), Temple Ohev Sholom (C). Display/hide their locations on the map
Reservoir: Crum Creek Reservoir (A). Display/hide its location on the map
Streams, rivers, and creeks: Dicks Run (A), Mudpuppy Run (B). Display/hide their locations on the map
Park in Nether Providence Township: Taylor Arboretum (1). Display/hide its location on the map
| This place: | 2.6 people |
| Pennsylvania: | 2.5 people |
| This place: | 75.0% |
| Whole state: | 67.5% |
| This place: | 3.0% |
| Whole state: | 5.0% |
Likely homosexual households (counted as self-reported same-sex unmarried-partner households)
- Lesbian couples: 0.3% of all households
- Gay men: 0.2% of all households
| This place: | 3.4% |
| Whole state: | 11.0% |
| This place: | 1.3% |
| Whole state: | 5.1% |
People in group quarters in Nether Providence Township in 2000:
- 201 people in nursing homes
- 53 people in homes for the mentally retarded
- 33 people in college dormitories (includes college quarters off campus)
- 16 people in other nonhousehold living situations
- 9 people in religious group quarters
- 8 people in schools, hospitals, or wards for the intellectually disabled
For population 15 years and over in Nether Providence Township:
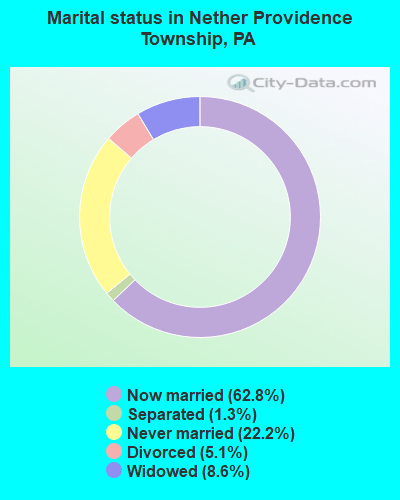
- Never married: 22.2%
- Now married: 62.8%
- Separated: 1.3%
- Widowed: 8.6%
- Divorced: 5.1%
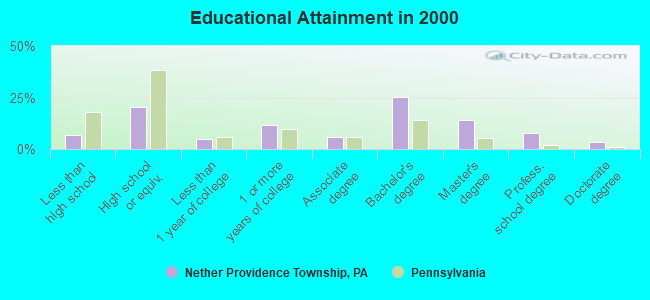
For population 25 years and over in Nether Providence Township:
- High school or higher: 93.2%
- Bachelor's degree or higher: 50.5%
- Graduate or professional degree: 25.1%
- Unemployed: 3.5%
- Mean travel time to work (commute): 26.2 minutes
| Here: | 11.6 |
| Pennsylvania average: | 11.8 |
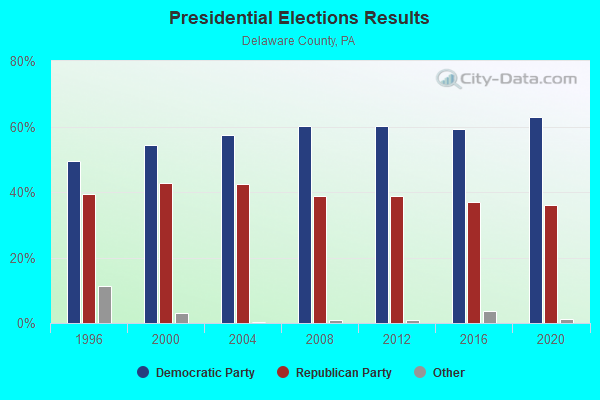
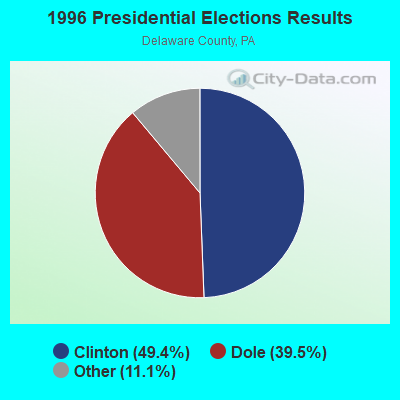
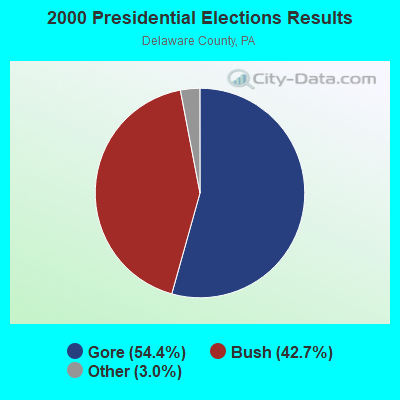
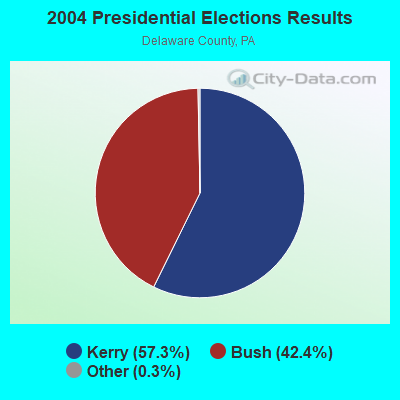
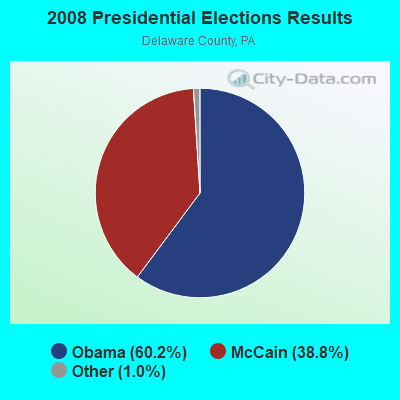
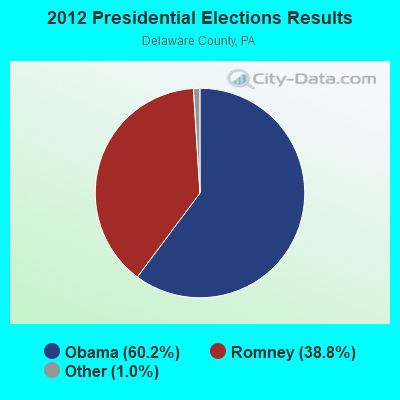
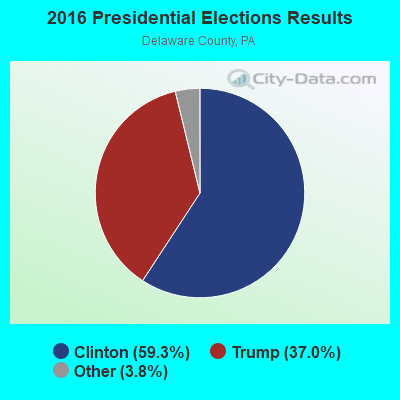
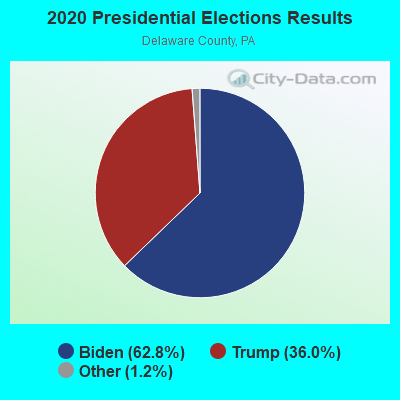
Graphs represent county-level data. Detailed 2008 Election Results
Political contributions by individuals in Nether Providence Township, PA
Religion statistics for Nether Providence Township, PA (based on Delaware County data)
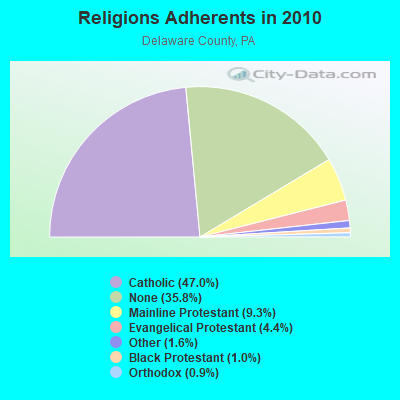
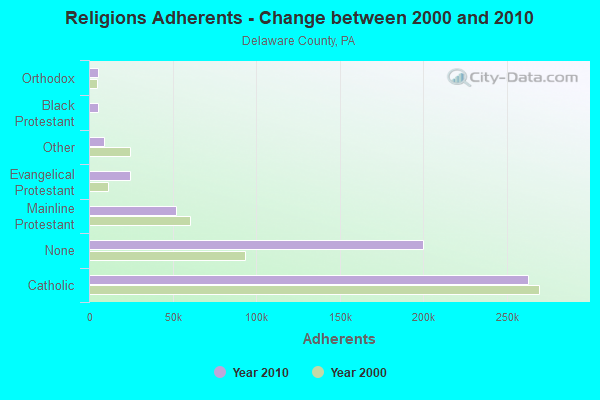
| Religion | Adherents | Congregations |
|---|---|---|
| Catholic | 262,506 | 50 |
| Mainline Protestant | 52,224 | 169 |
| Evangelical Protestant | 24,456 | 136 |
| Other | 9,009 | 27 |
| Black Protestant | 5,617 | 39 |
| Orthodox | 5,096 | 8 |
| None | 200,071 | - |
Food Environment Statistics:
| This county: | 1.86 / 10,000 pop. |
| State: | 2.04 / 10,000 pop. |
| Delaware County: | 0.02 / 10,000 pop. |
| State: | 0.09 / 10,000 pop. |
| Delaware County: | 1.50 / 10,000 pop. |
| Pennsylvania: | 0.88 / 10,000 pop. |
| This county: | 1.14 / 10,000 pop. |
| State: | 2.52 / 10,000 pop. |
| Delaware County: | 5.66 / 10,000 pop. |
| Pennsylvania: | 7.12 / 10,000 pop. |
| Here: | 8.5% |
| State: | 9.1% |
| Delaware County: | 25.7% |
| Pennsylvania: | 27.2% |
| This county: | 11.1% |
| Pennsylvania: | 11.5% |
5.79% of this county's 2021 resident taxpayers lived in other counties in 2020 ($87,801 average adjusted gross income)
| Here: | 5.79% |
| Pennsylvania average: | 5.27% |
0.01% of residents moved from foreign countries ($122 average AGI)
Delaware County: 0.01% Pennsylvania average: 0.01%
Top counties from which taxpayers relocated into this county between 2020 and 2021:
| from Philadelphia County, PA | |
| from Montgomery County, PA | |
| from Chester County, PA |
6.34% of this county's 2020 resident taxpayers moved to other counties in 2021 ($87,816 average adjusted gross income)
| Here: | 6.34% |
| Pennsylvania average: | 5.44% |
0.01% of residents moved to foreign countries ($90 average AGI)
Delaware County: 0.01% Pennsylvania average: 0.01%
Top counties to which taxpayers relocated from this county between 2020 and 2021:
| to Philadelphia County, PA | |
| to Chester County, PA | |
| to Montgomery County, PA |
Strongest AM radio stations in Nether Providence Township:
- WVCH (740 AM; 50 kW; CHESTER, PA; Owner: WVCH COMMUNICATIONS, INC.)
- WPEN (950 AM; 50 kW; PHILADELPHIA, PA; Owner: GREATER PHILADELPHIA RADIO, INC.)
- WZZD (990 AM; 50 kW; PHILADELPHIA, PA; Owner: PENNSYLVANIA MEDIA ASSOCIATES, INC.)
- WNWR (1540 AM; 50 kW; PHILADELPHIA, PA)
- KYW (1060 AM; 50 kW; PHILADELPHIA, PA; Owner: INFINITY BROADCASTING OPERATIONS, INC.)
- WPHT (1210 AM; 50 kW; PHILADELPHIA, PA; Owner: INFINITY BROADCASTING OPERATIONS, INC.)
- WPWA (1590 AM; 2 kW; CHESTER, PA; Owner: MOUNT OCEAN MEDIA, L.L.C.)
- WWJZ (640 AM; 50 kW; MOUNT HOLLY, NJ; Owner: ABC, INC.)
- WDEL (1150 AM; 5 kW; WILMINGTON, DE; Owner: DELMARVA BROADCASTING COMPANY)
- WIP (610 AM; 5 kW; PHILADELPHIA, PA; Owner: INFINITY BROADCASTING CORPORATION OF PHILADELPHIA)
- WFIL (560 AM; 5 kW; PHILADELPHIA, PA; Owner: PENNSYLVANIA MEDIA ASSOCIATES, INC.)
- WWDB (860 AM; daytime; 10 kW; PHILADELPHIA, PA)
- WTMR (800 AM; 5 kW; CAMDEN, NJ; Owner: WTMR LICENSE LIMITED PARTNERSHIP)
Strongest FM radio stations in Nether Providence Township:
- WSRN-FM (91.5 FM; SWARTHMORE, PA; Owner: SWARTHMORE COLLEGE)
- WPLY (100.3 FM; MEDIA, PA; Owner: RADIO ONE LICENSES, LLC)
- WMGK (102.9 FM; PHILADELPHIA, PA; Owner: GREATER PHILADELPHIA RADIO, INC.)
- WMWX (95.7 FM; PHILADELPHIA, PA; Owner: GREATER PHILADELPHIA RADIO, INC.)
- WOGL (98.1 FM; PHILADELPHIA, PA; Owner: INFINITY BROADCASTING OPERATIONS, INC.)
- WBEB (101.1 FM; PHILADELPHIA, PA; Owner: WEAZ-FM RADIO, INC.)
- WRTI (90.1 FM; PHILADELPHIA, PA; Owner: TEMPLE UNIV. OF THE COMMONWEALTH, ET)
- WSNI-FM (104.5 FM; PHILADELPHIA, PA; Owner: AMFM RADIO LICENSES, L.L.C.)
- WPHI-FM (103.9 FM; JENKINTOWN, PA; Owner: RADIO ONE LICENSES, LLC)
- WMMR (93.3 FM; PHILADELPHIA, PA; Owner: GREATER BOSTON RADIO, INC.)
- WHYY-FM (90.9 FM; PHILADELPHIA, PA; Owner: WHYY, INC.)
- WXPN (88.5 FM; PHILADELPHIA, PA; Owner: TRUSTEES OF THE UNIVERSITY OF PENNA.)
- WXTU (92.5 FM; PHILADELPHIA, PA; Owner: WXTU LICENSE LIMITED PARTNERSHIP)
- W278AK (103.5 FM; VILLAGE GREEN, PA; Owner: PRIORITY RADIO, INC.)
- WDAS-FM (105.3 FM; PHILADELPHIA, PA; Owner: AMFM RADIO LICENSES, L.L.C.)
- WPTP (96.5 FM; PHILADELPHIA, PA; Owner: WDAS LICENSE LIMITED PARTNERSHIP)
- WUSL (98.9 FM; PHILADELPHIA, PA; Owner: AMFM RADIO LICENSES, L.L.C.)
- WYSP (94.1 FM; PHILADELPHIA, PA; Owner: INFINITY BROADCASTING OPERATIONS, INC.)
- WJBR-FM (99.5 FM; WILMINGTON, DE; Owner: NM LICENSING, LLC)
- WDNR (89.5 FM; CHESTER, PA; Owner: WIDENER COLLEGE)
TV broadcast stations around Nether Providence Township:
- KYW-TV (Channel 3; PHILADELPHIA, PA; Owner: CBS BROADCASTING INC.)
- WPHL-TV (Channel 17; PHILADELPHIA, PA; Owner: TRIBUNE TELEVISION COMPANY)
- WPVI-TV (Channel 6; PHILADELPHIA, PA; Owner: ABC, INC.)
- WPPX (Channel 61; WILMINGTON, DE; Owner: PAXSON PHILADELPHIA LICENSE, INC.)
- WPSG (Channel 57; PHILADELPHIA, PA; Owner: VIACOM STATIONS GROUP OF PHILADELPHIA INC.)
- WCAU (Channel 10; PHILADELPHIA, PA; Owner: NBC SUBSIDIARY (WCAU-TV), L.P.)
- WWJT-LP (Channel 7; PHILADELPHIA, PA; Owner: PHILADELPHIA TELEVISION NETWORK, INC)
- WGTW (Channel 48; BURLINGTON, NJ; Owner: BRUNSON COMMUNICATIONS, INC.)
- WYBE (Channel 35; PHILADELPHIA, PA; Owner: INDEPENDENCE PUBLIC MEDIA OF PHILADELPHIA, INC.)
- WHYY-TV (Channel 12; WILMINGTON, DE; Owner: WHYY, INC.)
- WTXF-TV (Channel 29; PHILADELPHIA, PA; Owner: FOX TV STATIONS OF PHILADELPHIA)
- WELL-LP (Channel 8; WILLOW GROVE, ETC., PA; Owner: WORD OF GOD FELLOWSHIP, INC.)
- W40AZ (Channel 40; WILMINGTON, DE; Owner: NATIONAL MINORITY T.V., INC.)
- W55BT (Channel 55; TALLEYVILLE, DE; Owner: MEDIACASTING LLC)
- WFPA-CA (Channel 28; PHILADELPHIA, PA; Owner: WXTV LICENSE PARTNERSHIP, G.P.)
- WPHA-LP (Channel 63; PHILADELPHIA, PA; Owner: COMMERCIAL BROADCASTING CORP.)
- WUVP (Channel 65; VINELAND, NJ; Owner: UNIVISION PHILADELPHIA LLC)
- WTSD-CA (Channel 14; WILMINGTON, DE; Owner: PRIORITY COMMUNICATIONS MINISTRIES, INC.)
- WMCN-TV (Channel 53; ATLANTIC CITY, NJ; Owner: LENFEST BROADCASTING, LLC)
- WNJS (Channel 23; CAMDEN, NJ; Owner: NEW JERSEY PUBLIC BROADCASTING AUTHORITY)
- WPSJ-LP (Channel 8; HAMMONTON, ETC., NJ; Owner: ENGLE BROADCASTING)
- W33BT (Channel 33; CAMDEN, NJ; Owner: MEDIACASTING LLC)
- National Bridge Inventory (NBI) Statistics
- 29Number of bridges
- 512ft / 156mTotal length
- $1,206,000Total costs
- 608,181Total average daily traffic
- 51,287Total average daily truck traffic
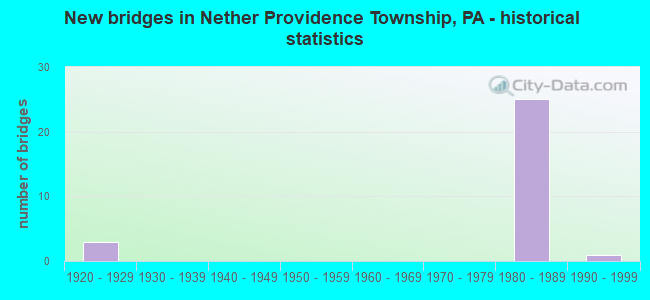
- New bridges - historical statistics
- 31920-1929
- 251980-1989
- 11990-1999
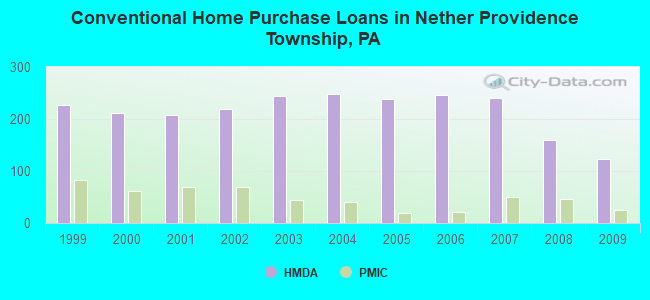
| Home Mortgage Disclosure Act Aggregated Statistics For Year 2009 (Based on 3 full tracts) | ||||||||||
| A) FHA, FSA/RHS & VA Home Purchase Loans | B) Conventional Home Purchase Loans | C) Refinancings | D) Home Improvement Loans | F) Non-occupant Loans on < 5 Family Dwellings (A B C & D) | ||||||
|---|---|---|---|---|---|---|---|---|---|---|
| Number | Average Value | Number | Average Value | Number | Average Value | Number | Average Value | Number | Average Value | |
| LOANS ORIGINATED | 27 | $228,111 | 123 | $245,366 | 477 | $231,453 | 33 | $113,788 | 10 | $137,100 |
| APPLICATIONS APPROVED, NOT ACCEPTED | 2 | $91,500 | 8 | $306,250 | 41 | $253,366 | 3 | $165,667 | 2 | $46,000 |
| APPLICATIONS DENIED | 1 | $97,000 | 14 | $193,000 | 139 | $238,144 | 13 | $42,462 | 3 | $127,667 |
| APPLICATIONS WITHDRAWN | 2 | $163,000 | 13 | $265,462 | 96 | $242,312 | 6 | $208,333 | 5 | $274,800 |
| FILES CLOSED FOR INCOMPLETENESS | 0 | $0 | 2 | $251,000 | 39 | $213,000 | 2 | $225,000 | 0 | $0 |
Detailed HMDA statistics for the following Tracts: 4074.01 , 4074.03, 4074.04
| Private Mortgage Insurance Companies Aggregated Statistics For Year 2009 (Based on 3 full tracts) | ||||
| A) Conventional Home Purchase Loans | B) Refinancings | |||
|---|---|---|---|---|
| Number | Average Value | Number | Average Value | |
| LOANS ORIGINATED | 25 | $243,120 | 13 | $297,692 |
| APPLICATIONS APPROVED, NOT ACCEPTED | 3 | $285,000 | 5 | $241,400 |
| APPLICATIONS DENIED | 2 | $117,500 | 3 | $300,000 |
| APPLICATIONS WITHDRAWN | 0 | $0 | 3 | $238,000 |
| FILES CLOSED FOR INCOMPLETENESS | 1 | $122,000 | 0 | $0 |
Detailed PMIC statistics for the following Tracts: 4074.01 , 4074.03, 4074.04
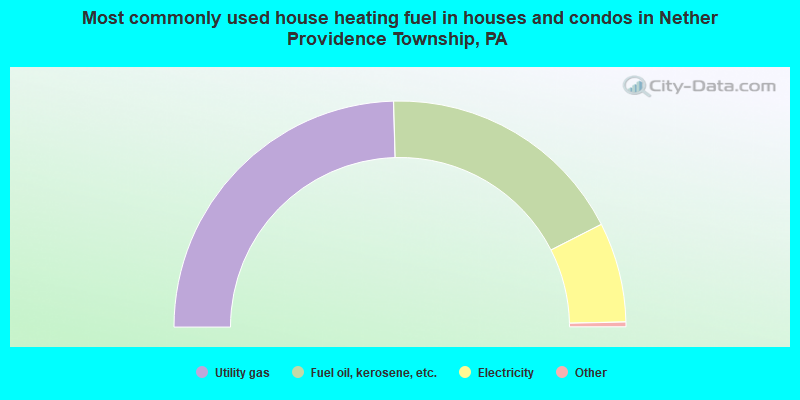
- 49.1%Utility gas
- 35.9%Fuel oil, kerosene, etc.
- 14.3%Electricity
- 0.5%Bottled, tank, or LP gas
- 0.2%Coal or coke
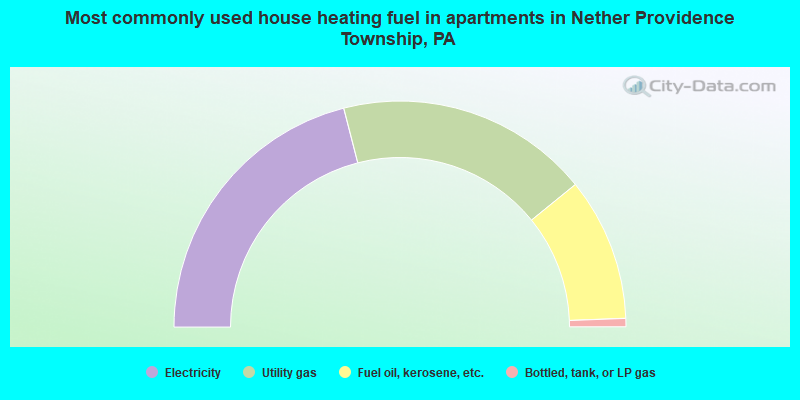
- 42.0%Electricity
- 36.3%Utility gas
- 20.5%Fuel oil, kerosene, etc.
- 1.2%Bottled, tank, or LP gas
Nether Providence Township compared to Pennsylvania state average:
- Median household income above state average.
- Median house value above state average.
- Unemployed percentage significantly below state average.
- Hispanic race population percentage significantly below state average.
- Renting percentage significantly below state average.
- Length of stay since moving in significantly above state average.
- Number of rooms per house significantly below state average.
- House age significantly below state average.
- Institutionalized population percentage significantly above state average.
- Percentage of population with a bachelor's degree or higher above state average.
Nether Providence Township on our top lists:
- #5 on the list of "Top 101 cities with largest percentage of females in occupations: lawyers (population 5,000+)"
- #15 on the list of "Top 101 cities with the most residents born in Born at sea (population 500+)"
- #22 on the list of "Top 101 cities with largest percentage of males in occupations: physicians and surgeons (population 5,000+)"
- #25 on the list of "Top 101 cities with largest percentage of males in industries: health care (population 5,000+)"
- #31 on the list of "Top 101 cities with largest percentage of females in occupations: media and communication equipment workers (population 5,000+)"
- #32 on the list of "Top 101 cities with largest percentage of males in occupations: other health diagnosing and treating practitioners and technical occupations (population 5,000+)"
- #32 on the list of "Top 101 cities with largest percentage of females in industries: chemicals (population 5,000+)"
- #32 on the list of "Top 101 cities with largest percentage of males in industries: electronic shopping and mail-order houses (population 5,000+)"
- #33 on the list of "Top 101 cities with largest percentage of females in occupations: judges, magistrates, and other judicial workers (population 5,000+)"
- #33 on the list of "Top 101 cities with largest percentage of males in occupations: lawyers (population 5,000+)"
- #37 on the list of "Top 101 cities with largest percentage of males in industries: office supplies and stationery stores (population 5,000+)"
- #60 on the list of "Top 101 cities with largest percentage of males in industries: social assistance (population 5,000+)"
- #74 on the list of "Top 101 cities with largest percentage of males in industries: petroleum and coal products (population 5,000+)"
- #101 on the list of "Top 101 cities with largest percentage of males in industries: chemicals (population 5,000+)"
- #14 on the list of "Top 101 counties with the lowest ground withdrawal of fresh water for public supply (pop. 50,000+)"
- #16 on the list of "Top 101 counties with the largest increase in the number of infant deaths per 1000 residents 2000-2006 to 2007-2013 (pop. 50,000+)"
- #20 on the list of "Top 101 counties with the highest Particulate Matter (PM2.5) Annual air pollution readings in 2012 (µg/m3)"
- #40 on the list of "Top 101 counties with the most Mainline Protestant congregations"
- #46 on the list of "Top 101 counties with the highest number of infant deaths per 1000 residents 2007-2013 (pop. 50,000+)"