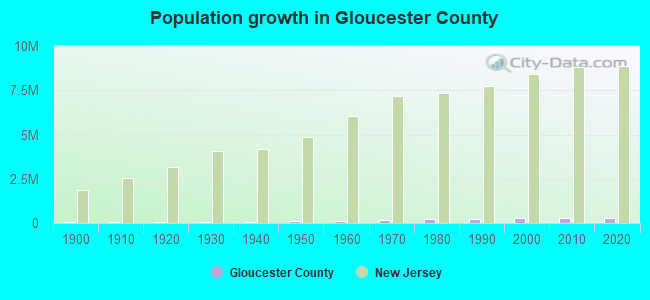
Gloucester County, New Jersey (NJ)
County owner-occupied free and clear houses and condos in 2010: 20,101
County owner-occupied houses and condos in 2000: 72,482
Renter-occupied apartments: 20,746 (it was 18,235 in 2000)
| % of renters here: | 20% |
| State: | 35% |
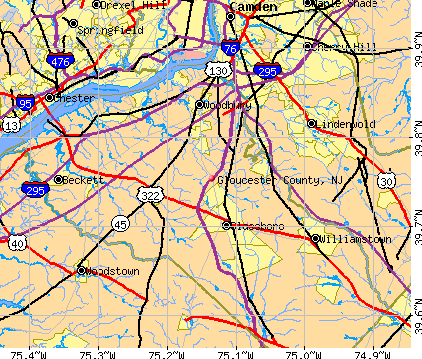
Land area: 325 sq. mi.
Water area: 12.2 sq. mi.
Population density: 944 people per square mile (very high).
Industries providing employment: Educational, health and social services (27.6%), Retail trade (11.1%), Professional, scientific, management, administrative, and waste management services (10.9%).
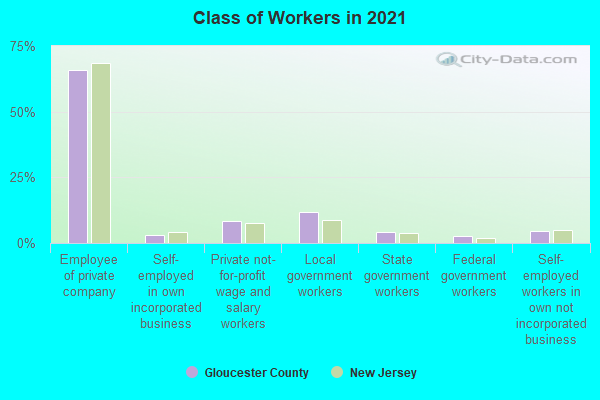
Type of workers:
- Private wage or salary: 78%
- Government: 17%
- Self-employed, not incorporated: 5%
- Unpaid family work: 0%
- OSM Map
- General Map
- Google Map
- MSN Map

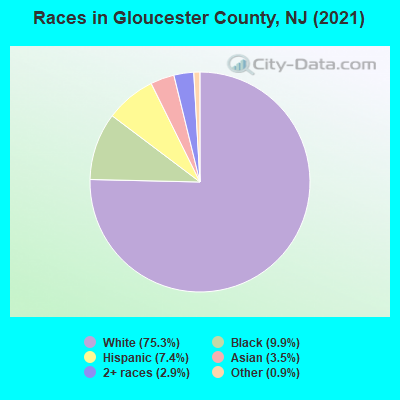
- 227,88974.3%White Non-Hispanic Alone
- 29,2079.5%Black Non-Hispanic Alone
- 24,2337.9%Hispanic or Latino
- 14,7104.8%Two or more races
- 9,0172.9%Asian alone
- 1,0930.4%Some other race alone
- 4520.1%American Indian and Alaska Native alone
| Median resident age: | 40.6 years |
| New Jersey median age: | 40.4 years |
| Males: 150,910 | |
| Females: 155,691 |

 | Moving from NE Philly (5 replies) |
| Why Is South/Central Jersey So Relatively Undeveloped? (83 replies) |
| New Jersey Move (4 replies) |
| What web site for finding house/duplex rentals Gloucester County (2 replies) |
| Keeping South Jersey on my Radar for Now.... (41 replies) |
| Affordable and family friendly South Jersey area with good schools (24 replies) |
| Gloucester County: | 2.0 people |
| New Jersey: | 3 people |
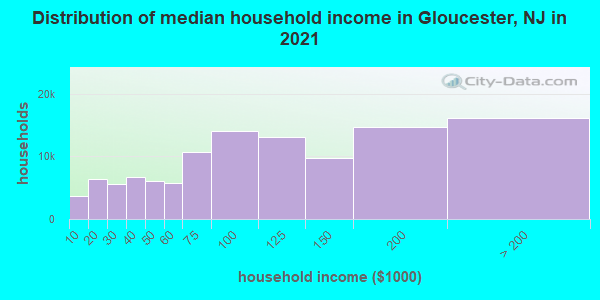
Estimated median household income in 2022: $98,301 ($54,273 in 1999)
| This county: | $98,301 |
| New Jersey: | $96,346 |
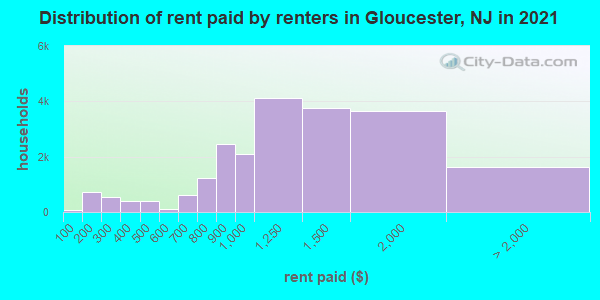
Median contract rent in 2022 for apartments: $1,192 (lower quartile is $783, upper quartile is $1,635)
| This county: | $1192 |
| State: | $1399 |
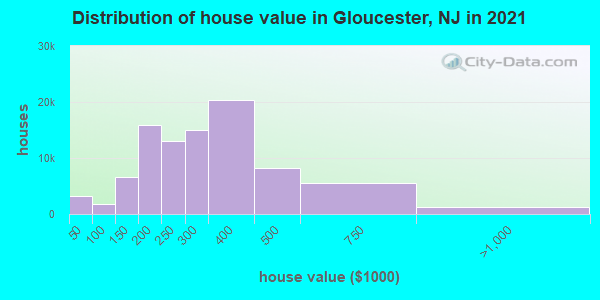
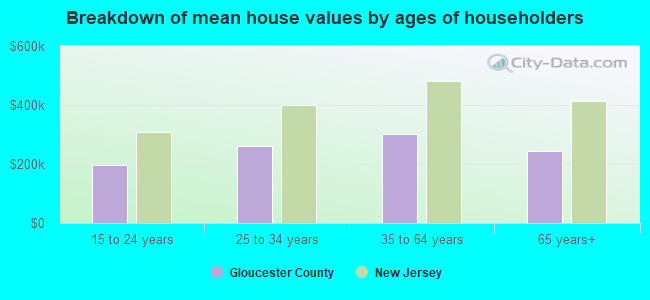
Estimated median house or condo value in 2022: $290,300 (it was $118,200 in 2000)
| Gloucester: | $290,300 |
| New Jersey: | $428,900 |
Mean price in 2022:
Median monthly housing costs for homes and condos with a mortgage: $2,060Detached houses: $298,763
Here: $298,763 State: $537,591 Townhouses or other attached units: $229,901
Here: $229,901 State: $381,113 In 2-unit structures: $223,171
Here: $223,171 State: $444,476 In 3-to-4-unit structures: $164,860
Here: $164,860 State: $457,463 In 5-or-more-unit structures: $165,710
Here: $165,710 State: $368,745 Mobile homes: $51,011
Here: $51,011 State: $119,788
Median monthly housing costs for units without a mortgage: $978
Institutionalized population: 1,594
Crime in 2020 (reported by the sheriff's office or county police, not the county total):
- Murders: 0
- Rapes: 0
- Robberies: 0
- Assaults: 0
- Burglaries: 0
- Thefts: 0
- Auto thefts: 0
Crime in 2019 (reported by the sheriff's office or county police, not the county total):
- Murders: 0
- Rapes: 0
- Robberies: 0
- Assaults: 0
- Burglaries: 0
- Thefts: 0
- Auto thefts: 0
Health of residents in Gloucester County based on CDC Behavioral Risk Factor Surveillance System Survey Questionnaires from 2003 to 2012:
General health status score of residents in this county from 1 (poor) to 5 (excellent) is 3.5. This is about average.70.8% of residents exercised in the past month. This is about average.
49.2% of residents smoked 100+ cigarettes in their lives. This is about average.
76.1% of adult residents drank alcohol in the past 30 days. This is about average.
74.1% of residents visited a dentist within the past year. This is about average.
Average weight of males is 198 pounds. This is about average.
Average weight of females is 163 pounds. This is about average.
15.9% of residents keep firearms around their homes. This is less than average.
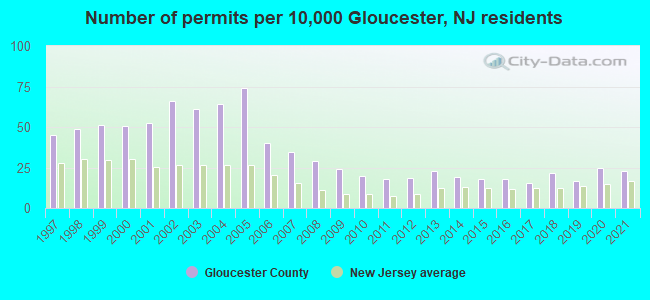
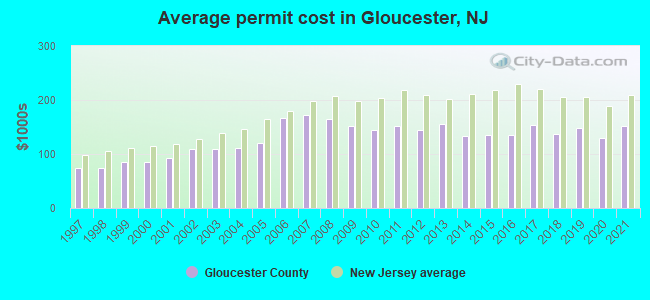
Single-family new house construction building permits:
- 2022: 779 buildings, average cost: $146,700
- 2021: 583 buildings, average cost: $151,300
- 2020: 634 buildings, average cost: $129,300
- 2019: 427 buildings, average cost: $147,500
- 2018: 543 buildings, average cost: $136,600
- 2017: 387 buildings, average cost: $153,200
- 2016: 461 buildings, average cost: $135,000
- 2015: 452 buildings, average cost: $135,700
- 2014: 487 buildings, average cost: $133,600
- 2013: 578 buildings, average cost: $156,000
- 2012: 475 buildings, average cost: $143,800
- 2011: 463 buildings, average cost: $150,800
- 2010: 498 buildings, average cost: $145,300
- 2009: 612 buildings, average cost: $151,400
- 2008: 739 buildings, average cost: $164,800
- 2007: 882 buildings, average cost: $173,200
- 2006: 1021 buildings, average cost: $166,100
- 2005: 1882 buildings, average cost: $120,500
- 2004: 1638 buildings, average cost: $112,100
- 2003: 1560 buildings, average cost: $109,400
- 2002: 1689 buildings, average cost: $108,900
- 2001: 1338 buildings, average cost: $92,900
- 2000: 1294 buildings, average cost: $84,500
- 1999: 1310 buildings, average cost: $86,100
- 1998: 1238 buildings, average cost: $73,900
- 1997: 1151 buildings, average cost: $73,800
Median real estate property taxes paid for housing units with mortgages in 2022: $7,643 (2.5%)
Median real estate property taxes paid for housing units with no mortgage in 2022: $6,906 (2.7%)
| Gloucester County: | 7.6% |
| New Jersey: | 9.7% |
Median age of residents in 2022: 40.6 years old
(Males: 39.6 years old, Females: 41.4 years old)
(Median age for: White residents: 43.2 years old, Black residents: 35.7 years old, American Indian residents: 25.0 years old, Asian residents: 38.3 years old, Hispanic or Latino residents: 26.8 years old, Other race residents: 32.5 years old)
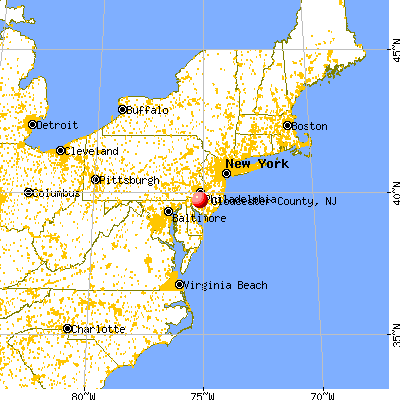
Area name: Philadelphia-Camden-Wilmington, PA-NJ-DE-MD MSA
Fair market rent in 2006 for a 1-bedroom apartment in Gloucester County is $742 a month.
Fair market rent for a 2-bedroom apartment is $886 a month.
Fair market rent for a 3-bedroom apartment is $1061 a month.
Cities in this county include: Glassboro, Williamstown, Woodbury, Pitman, Clayton, Paulsboro, Beckett, Westville, Turnersville, Gibbstown.
2023 air pollution in Gloucester County:
Ozone (1-hour): 0.035 ppm (standard limit: 0.12 ppm). Near U.S. average.
Neighboring counties: Butte County, California  , Jefferson County, West Virginia , Edgar County, Illinois , Tipton County, Indiana , Union County, Ohio , Ralls County, Missouri , Randolph County, Missouri .
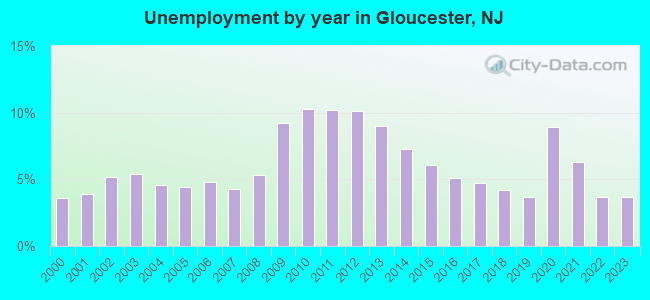
| Here: | 4.5% |
| New Jersey: | 4.5% |
Current college students: 17,149
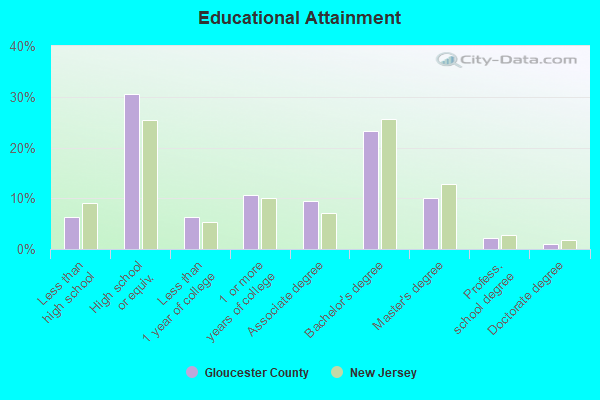
People 25 years of age or older with a high school degree or higher: 94.2%
People 25 years of age or older with a bachelor's degree or higher: 37.1%
Number of foreign born residents: 19,252 (63.9% naturalized citizens)
| Gloucester County: | 6.3% |
| Whole state: | 23.5% |
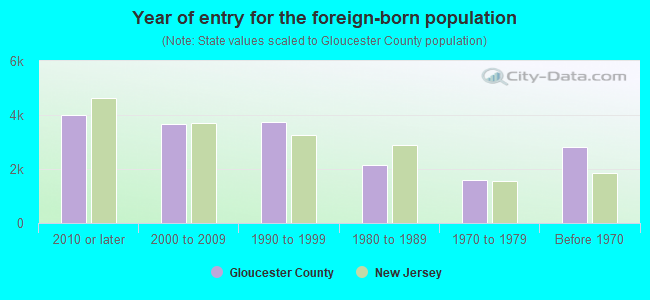
- Year of entry for the foreign-born population
- 4,8192010 or later
- 4,2462000 to 2009
- 3,6461990 to 1999
- 2,1421980 to 1989
- 1,5751970 to 1979
- 2,805Before 1970
Mean travel time to work (commute): minutes
Percentage of county residents living and working in this county: 83.8%
Housing units in structures:
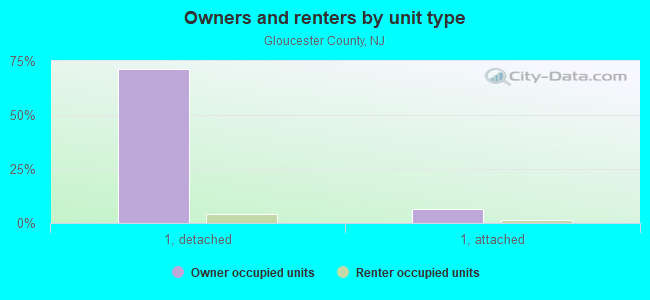
- One, detached: 85,768
- One, attached: 9,318
- Two: 3,074
- 3 or 4: 3,701
- 5 to 9: 4,180
- 10 to 19: 2,559
- 20 to 49: 2,173
- 50 or more: 3,950
- Mobile homes: 3,031
- Boats, RVs, vans, etc.: 53
Housing units in Gloucester County with a mortgage: 62,142 (6,374 second mortgage, 288 home equity loan, 5,724 both second mortgage and home equity loan)
Houses without a mortgage: 3,411
| Here: | 95.4% with mortgage |
| State: | 95.9% with mortgage |
Religion statistics for Gloucester County
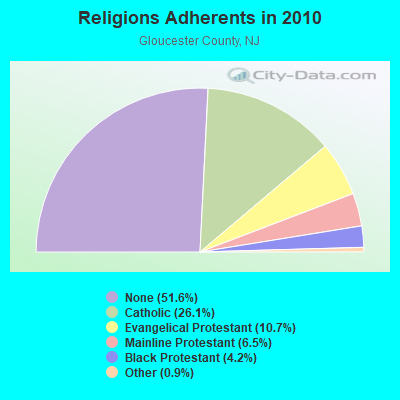
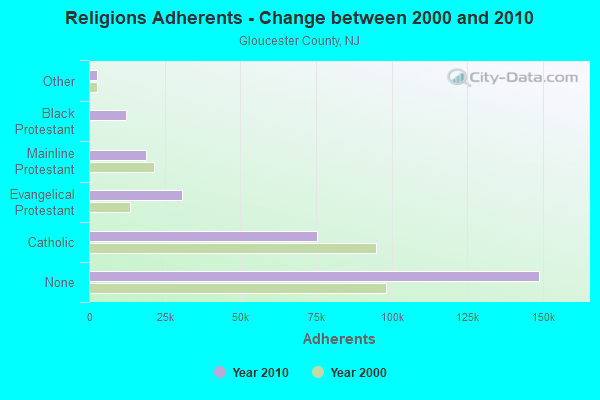
| Religion | Adherents | Congregations |
|---|---|---|
| Catholic | 75,218 | 21 |
| Evangelical Protestant | 30,715 | 83 |
| Mainline Protestant | 18,855 | 84 |
| Black Protestant | 12,099 | 16 |
| Other | 2,511 | 12 |
| None | 148,890 | - |
Source: Clifford Grammich, Kirk Hadaway, Richard Houseal, Dale E.Jones, Alexei Krindatch, Richie Stanley and Richard H.Taylor. 2012. 2010 U.S.Religion Census: Religious Congregations & Membership Study. Association of Statisticians of American Religious Bodies. Jones, Dale E., et al. 2002. Congregations and Membership in the United States 2000. Nashville, TN: Glenmary Research Center.
Food Environment Statistics:
| Gloucester County: | 1.86 / 10,000 pop. |
| State: | 2.90 / 10,000 pop. |
| Here: | 0.11 / 10,000 pop. |
| New Jersey: | 0.06 / 10,000 pop. |
| This county: | 2.52 / 10,000 pop. |
| New Jersey: | 1.76 / 10,000 pop. |
| Gloucester County: | 0.95 / 10,000 pop. |
| New Jersey: | 0.81 / 10,000 pop. |
| This county: | 4.59 / 10,000 pop. |
| State: | 7.15 / 10,000 pop. |
| Gloucester County: | 9.8% |
| New Jersey: | 8.3% |
| Gloucester County: | 24.9% |
| State: | 23.3% |
| Here: | 14.9% |
| State: | 18.0% |
Agriculture in Gloucester County:
Average size of farms: 73 acresAverage value of agricultural products sold per farm: $95,389
Average value of crops sold per acre for harvested cropland: $1883.68
The value of nursery, greenhouse, floriculture, and sod as a percentage of the total market value of agricultural products sold: 33.28%
The value of livestock, poultry, and their products as a percentage of the total market value of agricultural products sold: 6.14%
Average total farm production expenses per farm: $80,702
Harvested cropland as a percentage of land in farms: 64.81%
Irrigated harvested cropland as a percentage of land in farms: 34.50%
Average market value of all machinery and equipment per farm: $55,112
The percentage of farms operated by a family or individual: 89.16%
Average age of principal farm operators: 54 years
Average number of cattle and calves per 100 acres of all land in farms: 5.06
Milk cows as a percentage of all cattle and calves: 37.63%
Corn for grain: 2063 harvested acres
All wheat for grain: 2867 harvested acres
Soybeans for beans: 8165 harvested acres
Vegetables: 7,248 harvested acres
Land in orchards: 4,809 acres
Earthquake activity:
Gloucester County-area historical earthquake activity is significantly above New Jersey state average. It is 66% smaller than the overall U.S. average.On 8/23/2011 at 17:51:04, a magnitude 5.8 (5.8 MW, Depth: 3.7 mi, Class: Moderate, Intensity: VI - VII) earthquake occurred 197.5 miles away from Gloucester County center
On 1/16/1994 at 01:49:16, a magnitude 4.6 (4.6 MB, 4.6 LG, Depth: 3.1 mi, Class: Light, Intensity: IV - V) earthquake occurred 62.2 miles away from the county center
On 1/16/1994 at 00:42:43, a magnitude 4.2 (4.2 MB, 4.0 LG, Depth: 3.1 mi) earthquake occurred 60.9 miles away from the county center
On 11/30/2017 at 21:47:31, a magnitude 4.1 (4.1 MW, Depth: 6.1 mi) earthquake occurred 41.5 miles away from the county center
On 10/7/1983 at 10:18:46, a magnitude 5.3 (5.1 MB, 5.3 LG, 5.1 ML) earthquake occurred 293.4 miles away from Gloucester County center
On 9/25/1998 at 19:52:52, a magnitude 5.2 (4.8 MB, 4.3 MS, 5.2 LG, 4.5 MW, Depth: 3.1 mi) earthquake occurred 301.1 miles away from the county center
Magnitude types: regional Lg-wave magnitude (LG), body-wave magnitude (MB), local magnitude (ML), surface-wave magnitude (MS), moment magnitude (MW)
Most recent natural disasters:
- New Jersey Tropical Storm Isaias, Incident Period: August 4, 2020, Major Disaster (Presidential) Declared DR-4574-NJ: December 11, 2020, FEMA Id: 4574, Natural disaster type: Tropical Storm
- New Jersey Covid-19 Pandemic, Incident Period: January 20, 2020, Major Disaster (Presidential) Declared DR-4488-NJ: March 25, 2020, FEMA Id: 4488, Natural disaster type: Other
- New Jersey Severe Storm, Incident Period: June 23, 2015, Major Disaster (Presidential) Declared DR-4231: July 22, 2015, FEMA Id: 4231, Natural disaster type: Storm
- New Jersey Hurricane Sandy, Incident Period: October 26, 2012 to November 08, 2012, Emergency Declared EM-3354: October 28, 2012, FEMA Id: 3354, Natural disaster type: Hurricane
- New Jersey Hurricane Sandy, Incident Period: October 26, 2012 to November 08, 2012, Major Disaster (Presidential) Declared DR-4086: October 30, 2012, FEMA Id: 4086, Natural disaster type: Hurricane
- New Jersey Hurricane Irene, Incident Period: August 27, 2011 to September 05, 2011, Major Disaster (Presidential) Declared DR-4021: August 31, 2011, FEMA Id: 4021, Natural disaster type: Hurricane
- New Jersey Hurricane Irene, Incident Period: August 26, 2011 to September 05, 2011, Emergency Declared EM-3332: August 27, 2011, FEMA Id: 3332, Natural disaster type: Hurricane
- New Jersey Severe Storms and Flooding, Incident Period: August 13, 2011 to August 15, 2011, Major Disaster (Presidential) Declared DR-4033: September 15, 2011, FEMA Id: 4033, Natural disaster type: Storm, Flood
- New Jersey Severe Storms and Flooding, Incident Period: March 12, 2010 to April 15, 2010, Major Disaster (Presidential) Declared DR-1897: April 02, 2010, FEMA Id: 1897, Natural disaster type: Storm, Flood
- New Jersey Severe Winter Storm and Snowstorm, Incident Period: February 05, 2010 to February 06, 2010, Major Disaster (Presidential) Declared DR-1889: March 23, 2010, FEMA Id: 1889, Natural disaster type: Snowstorm, Winter Storm
- 14 other natural disasters have been reported since 1953.
The number of natural disasters in Gloucester County (24) is greater than the US average (15).
Major Disasters (Presidential) Declared: 15
Emergencies Declared: 9
Causes of natural disasters: Hurricanes: 6, Floods: 5, Storms: 5, Snowstorms: 3, Blizzards: 2, Heavy Rains: 2, Water Shortages: 2, Tornado: 1, Tropical Storm: 1, Wind: 1, Winter Storm: 1, Other: 3 (Note: some incidents may be assigned to more than one category).
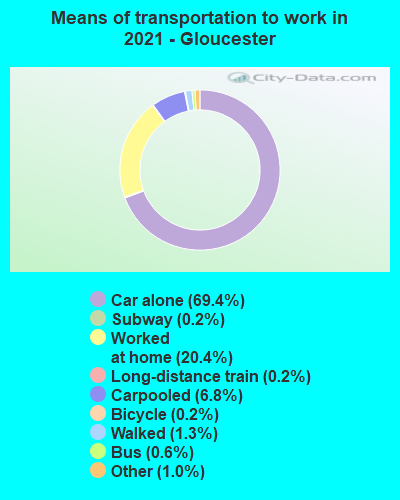
Means of transportation to work:
- Drove a car alone: 92,028 (69.8%)
- Carpooled: 13,176 (10.0%)
- Bus: 449 (0.3%)
- Long-distance train or commuter rail: 303 (0.2%)
- Ferryboat: 22 (0.0%)
- Taxicab, motorcycle, or other means: 2,091 (1.6%)
- Bicycle: 98 (0.1%)
- Walked: 3,012 (2.3%)
- Worked at home: 20,737 (15.7%)
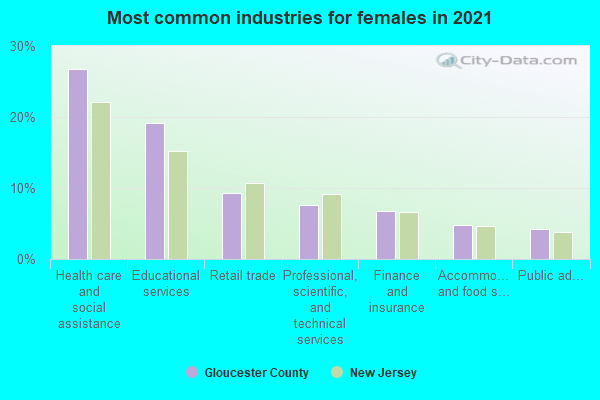
- Health care and social assistance (21%)
- Educational services (17%)
- Retail trade (10%)
- Professional, scientific, and technical services (6%)
- Finance and insurance (5%)
- Public administration (5%)
- Other services, except public administration (4%)
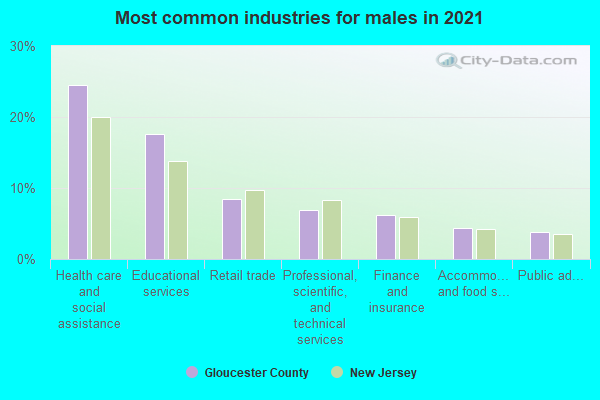
- Health care and social assistance (24%)
- Educational services (19%)
- Retail trade (11%)
- Professional, scientific, and technical services (7%)
- Finance and insurance (6%)
- Public administration (6%)
- Other services, except public administration (5%)
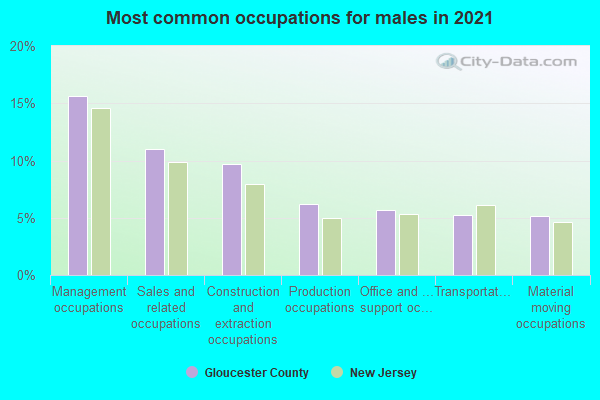
- Management occupations (14%)
- Sales and related occupations (11%)
- Construction and extraction occupations (9%)
- Installation, maintenance, and repair occupations (7%)
- Transportation occupations (6%)
- Office and administrative support occupations (6%)
- Material moving occupations (5%)
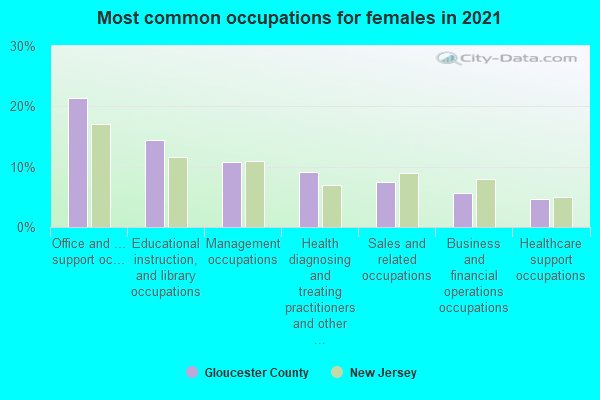
- Office and administrative support occupations (17%)
- Educational instruction, and library occupations (13%)
- Management occupations (12%)
- Health diagnosing and treating practitioners and other technical occupations (10%)
- Sales and related occupations (8%)
- Business and financial operations occupations (7%)
- Food preparation and serving related occupations (4%)
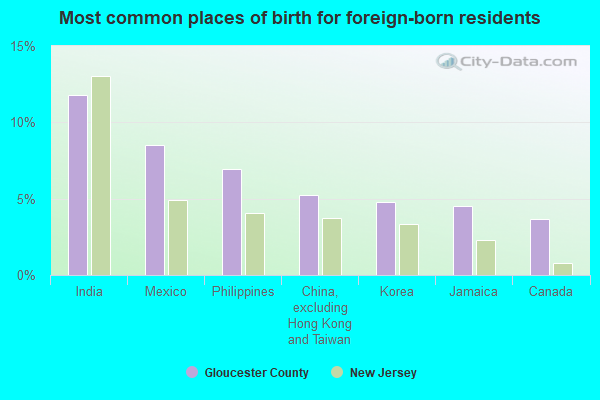
- India (12%)
- Philippines (8%)
- Mexico (7%)
- Korea (4%)
- Jamaica (4%)
- Italy (4%)
- Canada (3%)
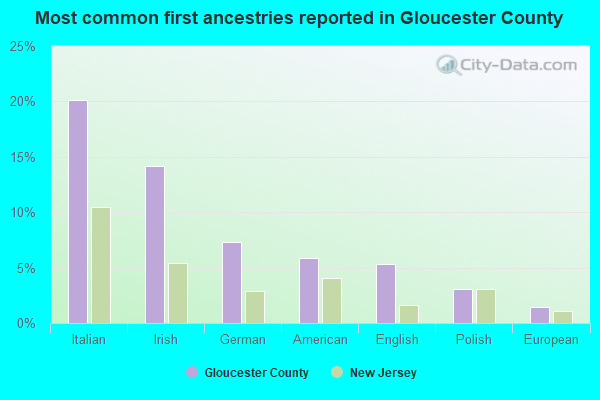
- Italian (20%)
- Irish (13%)
- German (7%)
- American (6%)
- English (5%)
- Polish (3%)
- European (1%)
People in group quarters in Gloucester County, New Jersey in 2010:
- 2,001 people in college/university student housing
- 948 people in nursing facilities/skilled-nursing facilities
- 417 people in local jails and other municipal confinement facilities
- 264 people in group homes intended for adults
- 161 people in in-patient hospice facilities
- 111 people in residential treatment centers for adults
- 100 people in emergency and transitional shelters (with sleeping facilities) for people experiencing homelessness
- 93 people in workers' group living quarters and job corps centers
- 60 people in other noninstitutional facilities
- 31 people in group homes for juveniles (non-correctional)
- 21 people in correctional facilities intended for juveniles
- 10 people in correctional residential facilities
- 6 people in residential treatment centers for juveniles (non-correctional)
People in group quarters in Gloucester County, New Jersey in 2000:
- 2,329 people in college dormitories (includes college quarters off campus)
- 1,209 people in nursing homes
- 648 people in other noninstitutional group quarters
- 257 people in local jails and other confinement facilities (including police lockups)
- 185 people in homes for the mentally retarded
- 182 people in agriculture workers' dormitories on farms
- 128 people in religious group quarters
- 79 people in other nonhousehold living situations
- 51 people in other group homes
- 40 people in schools, hospitals, or wards for the intellectually disabled
- 38 people in homes or halfway houses for drug/alcohol abuse
- 23 people in homes for the mentally ill
- 10 people in short-term care, detention or diagnostic centers for delinquent children
- 10 people in unknown juvenile institutions
- 6 people in homes for the physically handicapped
- 3 people in other workers' dormitories
- 3 people in crews of maritime vessels
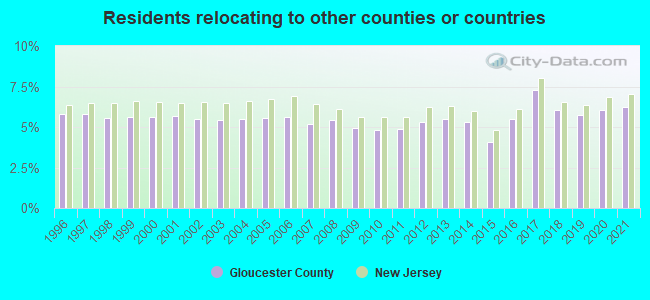
6.67% of this county's 2021 resident taxpayers lived in other counties in 2020 ($66,650 average adjusted gross income)
| Here: | 6.67% |
| New Jersey average: | 6.70% |
10 or fewer of this county's residents moved from foreign countries.
4.21% relocated from other counties in New Jersey ($40,865 average AGI)
2.46% relocated from other states ($25,785 average AGI)
Gloucester County: 2.46% New Jersey average: 2.98%

Top counties from which taxpayers relocated into this county between 2020 and 2021:
| from Camden County, NJ | |
| from Philadelphia County, PA | |
| from Burlington County, NJ | |
| from Cumberland County, NJ | |
| from Salem County, NJ | |
| from Atlantic County, NJ | |
| from Delaware County, PA |
6.21% of this county's 2020 resident taxpayers moved to other counties in 2021 ($73,670 average adjusted gross income)
| Here: | 6.21% |
| New Jersey average: | 7.02% |
0.02% of residents moved to foreign countries ($171 average AGI)
Gloucester County: 0.02% New Jersey average: 0.02%
3.60% relocated to other counties in New Jersey ($38,637 average AGI)
2.60% relocated to other states ($34,862 average AGI)
Gloucester County: 2.60% New Jersey average: 3.32%
Top counties to which taxpayers relocated from this county between 2020 and 2021:
| to Camden County, NJ | |
| to Salem County, NJ | |
| to Philadelphia County, PA | |
| to Burlington County, NJ | |
| to Cumberland County, NJ | |
| to Atlantic County, NJ | |
| to Cape May County, NJ |
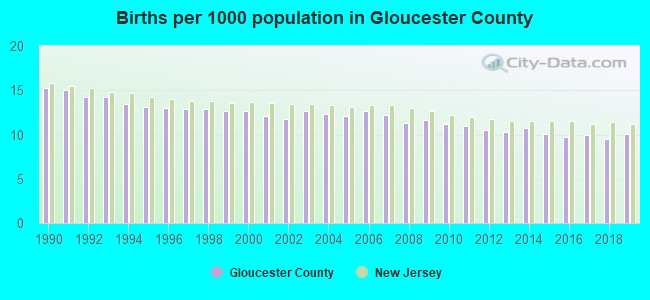
Births per 1000 population from 1990 to 1999: 13.7
Births per 1000 population from 2000 to 2009: 12.1
Births per 1000 population from 2010 to 2022: 8.6
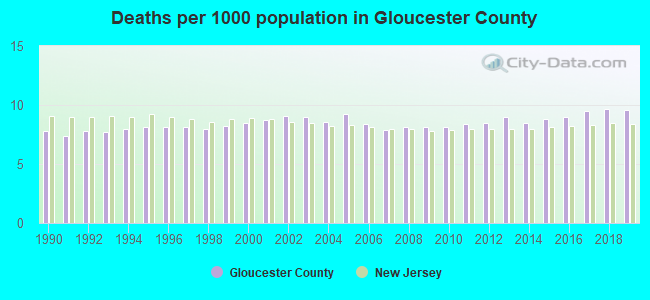
Deaths per 1000 population from 1990 to 1999: 7.9
Deaths per 1000 population from 2000 to 2009: 8.6
Deaths per 1000 population from 2010 to 2020: 9.1
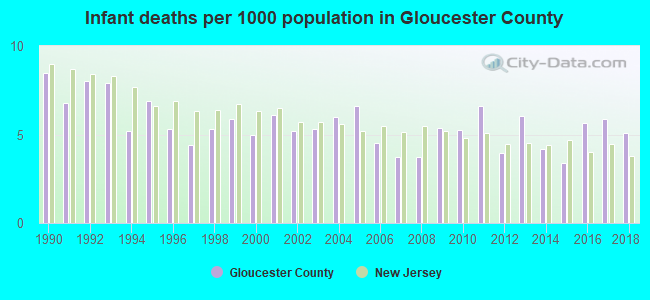
Infant deaths per 1000 live births from 1990 to 1999: 6.4
Infant deaths per 1000 live births from 2000 to 2009: 5.2
Infant deaths per 1000 live births from 2010 to 2021: 4.8
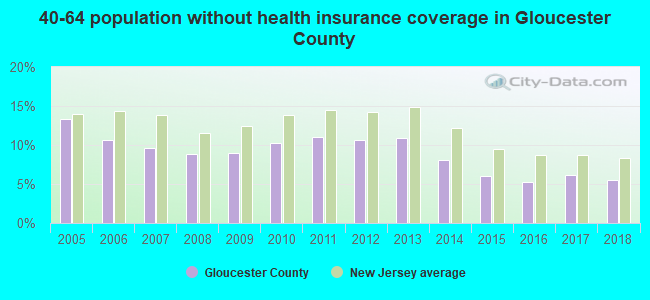
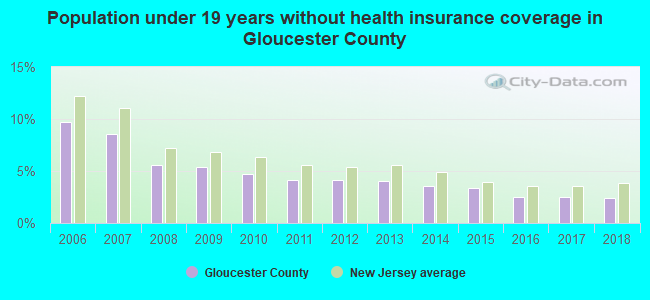
Persons under 19 years old without health insurance coverage in 2018: 2.4%
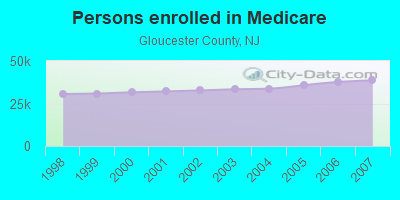
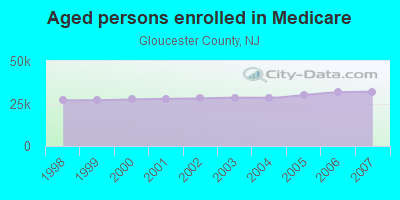
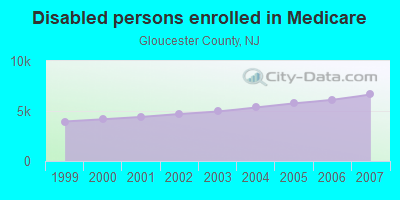
Persons enrolled in hospital insurance and/or supplemental medical insurance (Medicare) in July 1, 2007: 38,607 (31,946 aged, 6,661 disabled)
Children under 18 without health insurance coverage in 2007: 4,891 (7%)
Most common underlying causes of death in Gloucester County, New Jersey in 1999 - 2019:
- Bronchus or lung, unspecified - Malignant neoplasms (3,492)
- Atherosclerotic heart disease (3,353)
- Atherosclerotic cardiovascular disease, so described (2,739)
- Chronic obstructive pulmonary disease, unspecified (2,140)
- Acute myocardial infarction, unspecified (2,018)
- Unspecified dementia (1,640)
- Alzheimer disease, unspecified (1,229)
- Stroke, not specified as haemorrhage or infarction (1,170)
- Septicaemia, unspecified (1,060)
- Congestive heart failure (1,045)
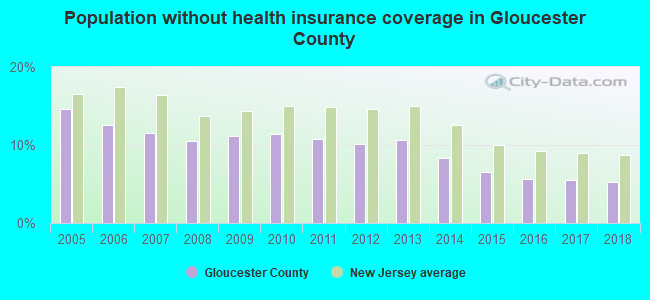
Population without health insurance coverage in 2000: 11%
Children under 18 without health insurance coverage in 2000: 9%
Short term general hospital admissions per 100,000 population in 2004: 4,881
Short term general hospital beds per 100,000 population in 2004: 88
Emergency room visits per 100,000 population in 2004: 19,570
General practice office based MDs per 100,000 population in 2005: 1,070
Medical specialist MDs per 100,000 population in 2005: 858
Dentists per 100,000 population in 1998: 10
Total births per 100,000 population, July 2005 - July 2006 : 35
Total deaths per 100,000 population, July 2005 - July 2006: 79
Limited-service eating places per 100,000 population in 2005 : 14
Beer, wine & liquor stores per 100,000 population in 2005: 1
Homicides per 1,000,000 population from 2000 to 2006: 28.2. This is less than state average.
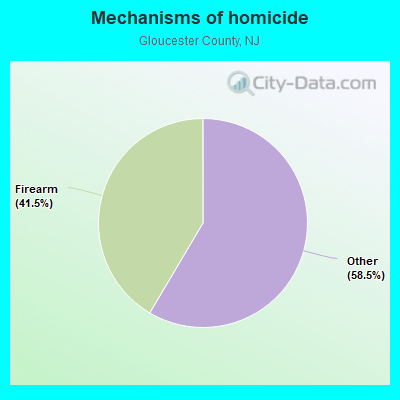
- Firearm - 11.7
- Other - 16.5
Suicides per 1,000,000 population from 2000 to 2006: 85.2. This is more than state average.
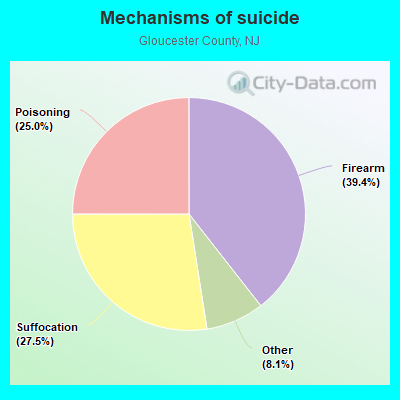
- Firearm - 33.6
- Suffocation - 23.4
- Poisoning - 21.3
- Other - 6.9
Household type by relationship:
Households: 306,601- Male householders: 54,235 (11,041 living alone), Female householders: 57,546 (16,250 living alone)
58,933 spouses (58,379 opposite-sex spouses), 8,826 unmarried partners, (8,591 opposite-sex unmarried partners), 94,199 children (87,496 natural, 3,279 adopted, 3,424 stepchildren), 5,864 grandchildren, 3,378 brothers or sisters, 4,740 parents, 95 foster children, 4,682 other relatives, 7,054 non-relatives
- In group quarters: 7,049
Size of family households: 30,542 2-persons, 19,276 3-persons, 16,836 4-persons, 7,591 5-persons, 3,117 6-persons, 1,050 7-or-more-persons.
Size of nonfamily households: 27,291 1-person, 5,395 2-persons, 63 3-persons, 191 4-persons, 121 5-persons, 308 7-or-more-persons.
44,541 married couples with children.
12,457 single-parent households (2,368 men, 10,089 women).
89.9% of residents of Gloucester speak English at home.
4.7% of residents speak Spanish at home (62% speak English very well, 20% speak English well, 12% speak English not well, 6% don't speak English at all).
2.9% of residents speak other Indo-European language at home (75% speak English very well, 15% speak English well, 9% speak English not well, 1% don't speak English at all).
1.6% of residents speak Asian or Pacific Island language at home (58% speak English very well, 30% speak English well, 11% speak English not well, 1% don't speak English at all).
0.6% of residents speak other language at home (63% speak English very well, 24% speak English well, 9% speak English not well, 5% don't speak English at all).
In fiscal year 2004:
Federal Government expenditure: $1,154,764,000 ($4,248 per capita)
Department of Defense expenditure: $32,067,000
Federal direct payments to individuals for retirement and disability: $562,667,000
Federal other direct payments to individuals: $290,085,000
Federal direct payments not to individuals: $1,411,000
Federal grants: $156,717,000
Federal procurement contracts: $42,372,000 ($12,792,000 Department of Defense)
Federal salaries and wages: $101,512,000 ($3,044,000 Department of Defense)
Federal Government direct loans: $52,370,000
Federal guaranteed/insured loans: $208,602,000
Federal Government insurance: $156,365,000
Population change from April 1, 2000 to July 1, 2005:
Births: 16,483| Here: | 60 per 1000 residents |
| State: | 69 per 1000 residents |
Deaths: 12,147
| Here: | 44 per 1000 residents |
| State: | 44 per 1000 residents |
Net international migration: +815
| Here: | +3 per 1000 residents |
| State: | +33 per 1000 residents |
Net internal migration: +16,586
| Here: | |
| State: |
Total withdrawal of fresh water for public supply: 21.00 millions of gallons per day (all from ground)
| Here: | 7.2 |
| State: | 6.8 |
| Here: | 4.2 |
| State: | 3.9 |
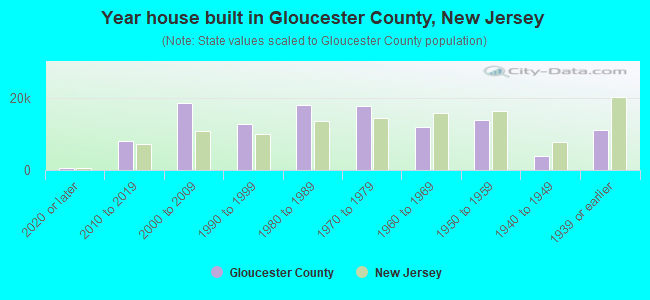
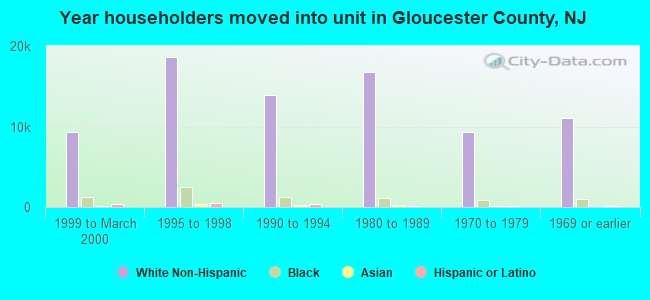
- Year house built in Gloucester County, New Jersey
- 1,1392020 or later
- 9,3682010 to 2019
- 18,8322000 to 2009
- 14,5931990 to 1999
- 14,9191980 to 1989
- 17,1291970 to 1979
- 13,6241960 to 1969
- 11,4701950 to 1959
- 5,0921940 to 1949
- 11,6411939 or earlier
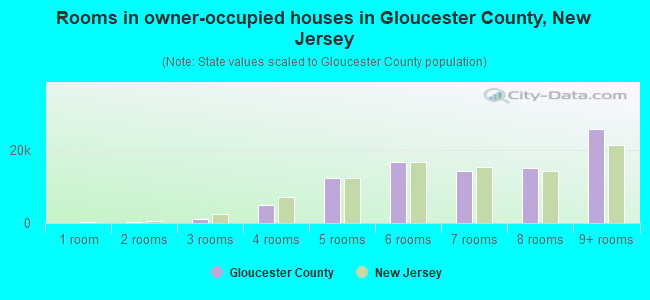
- Rooms in owner-occupied houses in Gloucester County, New Jersey
- 01 room
- 2682 rooms
- 1,9973 rooms
- 3,5124 rooms
- 12,5645 rooms
- 16,5756 rooms
- 15,0437 rooms
- 14,1058 rooms
- 26,2919+ rooms
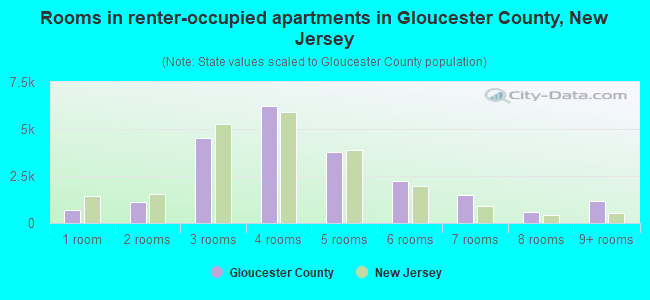
- Rooms in renter-occupied apartments in Gloucester County, New Jersey
- 2391 room
- 5392 rooms
- 4,9783 rooms
- 7,0144 rooms
- 4,3665 rooms
- 2,3276 rooms
- 9017 rooms
- 4018 rooms
- 6619+ rooms
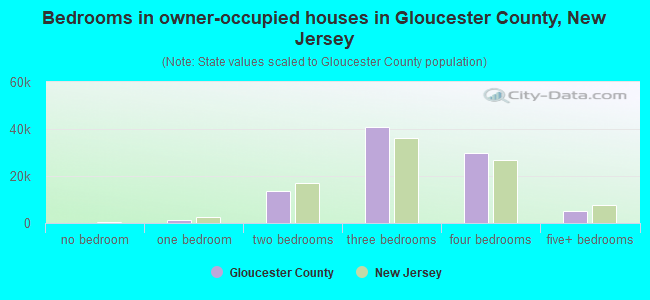
- Bedrooms in owner-occupied houses in Gloucester County, New Jersey
- 265no bedroom
- 1,5261 bedroom
- 12,8392 bedrooms
- 40,8363 bedrooms
- 27,6854 bedrooms
- 7,2045+ bedrooms
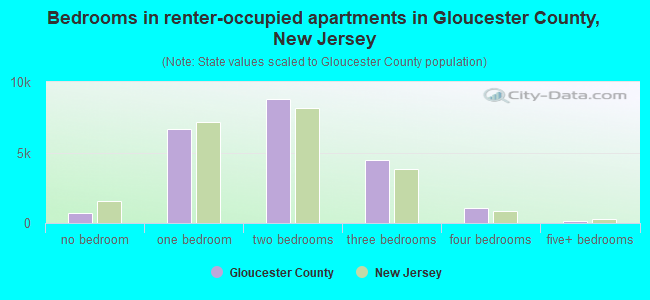
- Bedrooms in renter-occupied apartments in Gloucester County, New Jersey
- 239no bedroom
- 8,3711 bedroom
- 8,1652 bedrooms
- 3,3193 bedrooms
- 1,1884 bedrooms
- 1445+ bedrooms
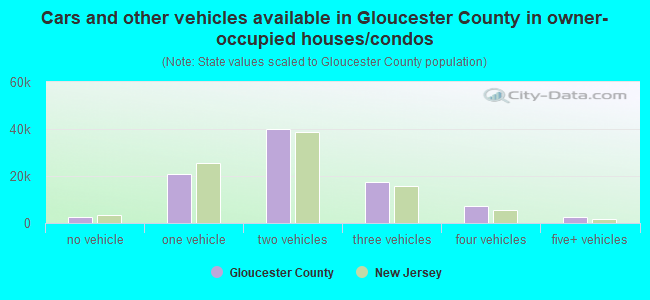
- Cars and other vehicles available in Gloucester County in owner-occupied houses/condos
- 2,461no vehicle
- 21,6071 vehicle
- 41,7952 vehicles
- 15,9023 vehicles
- 5,4564 vehicles
- 3,1345+ vehicles
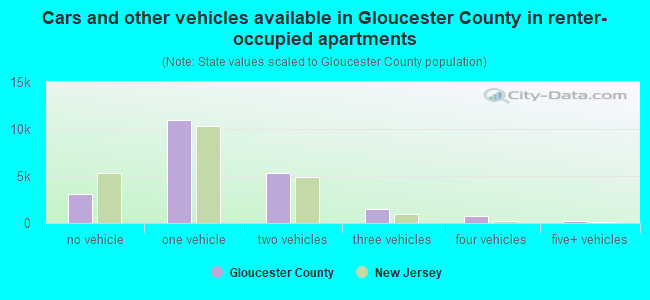
- Cars and other vehicles available in Gloucester County in renter-occupied apartments
- 3,479no vehicle
- 9,7351 vehicle
- 6,2552 vehicles
- 1,4173 vehicles
- 1534 vehicles
- 3875+ vehicles
89.9% of Gloucester County residents lived in the same house 1 years ago.
Out of people who lived in different houses, 33% lived in this county.
Out of people who lived in different counties, 67% lived in New Jersey.
| Gloucester County: | 89.9% |
| State average: | 90.4% |
Place of birth for U.S.-born residents:
- This state: 180,564
- Other state: 101,538
- Northeast: 81,297
- Midwest: 3,708
- South: 14,266
- West: 2,267
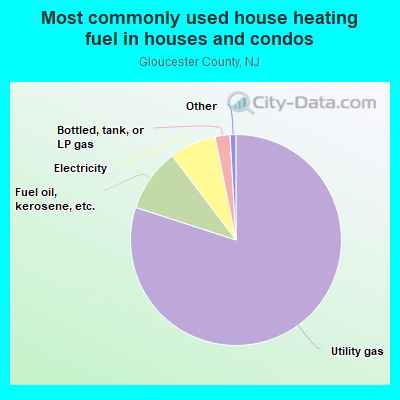
- 83.7%Utility gas
- 8.1%Fuel oil, kerosene, etc.
- 5.4%Electricity
- 1.3%Bottled, tank, or LP gas
- 0.6%Wood
- 0.4%No fuel used
- 0.3%Solar energy
- 0.2%Other fuel
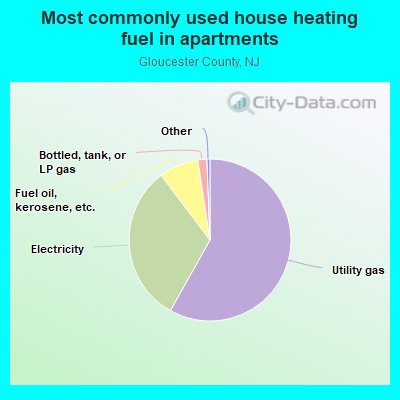
- 53.9%Utility gas
- 37.9%Electricity
- 6.0%Fuel oil, kerosene, etc.
- 1.1%Bottled, tank, or LP gas
- 0.9%No fuel used
- 0.3%Other fuel
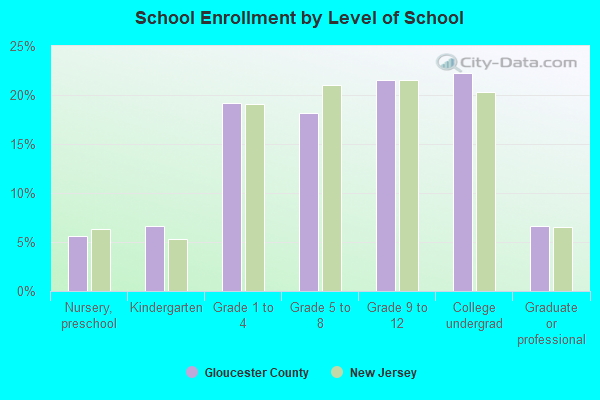
Private vs. public school enrollment:
| Here: | 7.6% |
| New Jersey: | 12.3% |
| Here: | 11.5% |
| New Jersey: | 13.1% |
| Here: | 22.7% |
| New Jersey: | 33.2% |
Gloucester County government finances - Expenditure in 2020:
- Assistance and Subsidies - Public Welfare, Federal Categorical Assistance Programs: $4,605,000
Public Welfare, Federal Categorical Assistance Programs: $4,311,000
Public Welfare, Cash Assistance Programs - Other: $3,547,000
Public Welfare, Cash Assistance Programs - Other: $3,320,000
- Bond Funds - Cash and Securities: $45,468,000
Cash and Securities: $43,953,000
- Charges - Elementary and Secondary Education - Other: $29,377,000
Elementary and Secondary Education - Other: $27,249,000
Higher Education - Other: $21,793,000
Higher Education - Other: $20,628,000
Solid Waste Management: $15,749,000
Solid Waste Management: $14,609,000
Other: $12,421,000
Other: $11,522,000
Elementary and Secondary Education School Tuition and Transportation: $3,030,000
Elementary and Secondary Education School Tuition and Transportation: $2,811,000
Parks and Recreation: $1,805,000
Parks and Recreation: $1,675,000
Housing and Community Development: $1,491,000
Housing and Community Development: $1,383,000
Higher Education Auxiliary Enterprises: $786,000
Higher Education Auxiliary Enterprises: $730,000
Elementary and Secondary Education School Lunch: $625,000
Elementary and Secondary Education School Lunch: $580,000
- Construction - Other Higher Education: $15,645,000
Elementary and Secondary Education: $6,581,000
Other Higher Education: $3,557,000
General - Other: $3,287,000
General - Other: $2,113,000
Elementary and Secondary Education: $678,000
Housing and Community Development: $158,000
Housing and Community Development: $102,000
General Public Buildings: $58,000
General Public Buildings: $37,000
Corrections - Other: $32,000
Corrections - Other: $20,000
- Current Operations - Elementary and Secondary Education: $73,106,000
Elementary and Secondary Education: $71,659,000
General - Other: $63,076,000
General - Other: $56,757,000
Other Higher Education: $50,356,000
Other Higher Education: $50,016,000
Housing and Community Development: $16,779,000
Solid Waste Management: $15,882,000
Housing and Community Development: $15,098,000
Correctional Institutions: $14,835,000
Solid Waste Management: $14,291,000
Correctional Institutions: $13,348,000
Public Welfare - Other: $9,611,000
Public Welfare - Other: $8,648,000
Police Protection: $8,185,000
Judicial and Legal Services: $7,968,000
Police Protection: $7,365,000
Health - Other: $7,296,000
Judicial and Legal Services: $7,170,000
Public Welfare Institutions: $6,676,000
Health - Other: $6,565,000
Public Welfare Institutions: $6,007,000
Financial Administration: $3,772,000
Central Staff Services: $3,634,000
Financial Administration: $3,394,000
Central Staff Services: $3,270,000
General Public Buildings: $3,155,000
General Public Buildings: $2,839,000
Regular Highways: $2,719,000
Regular Highways: $2,446,000
Parks and Recreation: $1,377,000
Parks and Recreation: $1,239,000
Natural Resources - Other: $497,000
Corrections - Other: $484,000
Natural Resources - Other: $447,000
Corrections - Other: $435,000
Protective Inspection and Regulation - Other: $357,000
Protective Inspection and Regulation - Other: $321,000
Higher Education Auxiliary Enterprises: $148,000
Higher Education Auxiliary Enterprises: $24,000
- Federal Intergovernmental - Housing and Community Development: $14,376,000
Housing and Community Development: $14,128,000
Education: $2,724,000
Education: $932,000
Other: $377,000
Other: $370,000
- General - Interest on Debt: $15,479,000
Interest on Debt: $5,120,000
- Intergovernmental to Local - Other - Other Higher Education: $44,000
Other - Other Higher Education: $27,000
Other - Solid Waste Management: $14,000
Other - Solid Waste Management: $8,000
- Intergovernmental to State - Hospitals: $313,000
Hospitals: $191,000
Elementary and Secondary Education: $63,000
Elementary and Secondary Education: $63,000
- Local Intergovernmental - Education: $43,187,000
Education: $42,412,000
Other: $1,483,000
Other: $1,456,000
Housing and Community Development: $126,000
Housing and Community Development: $124,000
Highways: $114,000
Highways: $112,000
- Long Term Debt - Beginning Outstanding - Unspecified Public Purpose: $218,853,000
Outstanding Unspecified Public Purpose: $167,858,000
Beginning Outstanding - Unspecified Public Purpose: $116,863,000
Outstanding Unspecified Public Purpose: $65,868,000
Retired Unspecified Public Purpose: $50,995,000
Retired Unspecified Public Purpose: $50,995,000
Beginning Outstanding - Public Debt for Private Purpose: $12,876,000
Outstanding Nonguaranteed - Industrial Revenue: $12,008,000
Beginning Outstanding - Public Debt for Private Purpose: $11,140,000
Outstanding Nonguaranteed - Industrial Revenue: $10,272,000
Retired Nonguaranteed - Public Debt for Private Purpose: $868,000
Retired Nonguaranteed - Public Debt for Private Purpose: $868,000
- Miscellaneous - General Revenue - Other: $5,403,000
General Revenue - Other: $4,264,000
Fines and Forfeits: $3,501,000
Fines and Forfeits: $2,763,000
Interest Earnings: $2,755,000
Interest Earnings: $2,174,000
Rents: $35,000
Rents: $28,000
- Other Capital Outlay - Elementary and Secondary Education: $2,429,000
Elementary and Secondary Education: $1,331,000
Other Higher Education: $633,000
Other Higher Education: $323,000
- Other Funds - Cash and Securities: $94,270,000
Cash and Securities: $91,129,000
- Sinking Funds - Cash and Securities: $72,026,000
Cash and Securities: $69,627,000
- State Intergovernmental - Education: $21,626,000
Education: $12,981,000
Other: $9,989,000
Other: $9,945,000
Public Welfare: $8,950,000
Public Welfare: $8,911,000
Health and Hospitals: $1,346,000
Health and Hospitals: $1,340,000
Housing and Community Development: $87,000
Housing and Community Development: $87,000
- Tax - Property: $156,646,000
Property: $153,336,000
Other License: $99,000
Other License: $97,000
- Total Salaries and Wages: $69,508,000
: $67,108,000
Gloucester County government finances - Revenue in 2020:
- Assistance and Subsidies - Public Welfare, Federal Categorical Assistance Programs: $4,605,000
Public Welfare, Federal Categorical Assistance Programs: $4,311,000
Public Welfare, Cash Assistance Programs - Other: $3,547,000
Public Welfare, Cash Assistance Programs - Other: $3,320,000
- Bond Funds - Cash and Securities: $45,468,000
Cash and Securities: $43,953,000
- Charges - Elementary and Secondary Education - Other: $29,377,000
Elementary and Secondary Education - Other: $27,249,000
Higher Education - Other: $21,793,000
Higher Education - Other: $20,628,000
Solid Waste Management: $15,749,000
Solid Waste Management: $14,609,000
Other: $12,421,000
Other: $11,522,000
Elementary and Secondary Education School Tuition and Transportation: $3,030,000
Elementary and Secondary Education School Tuition and Transportation: $2,811,000
Parks and Recreation: $1,805,000
Parks and Recreation: $1,675,000
Housing and Community Development: $1,491,000
Housing and Community Development: $1,383,000
Higher Education Auxiliary Enterprises: $786,000
Higher Education Auxiliary Enterprises: $730,000
Elementary and Secondary Education School Lunch: $625,000
Elementary and Secondary Education School Lunch: $580,000
- Construction - Other Higher Education: $15,645,000
Elementary and Secondary Education: $6,581,000
Other Higher Education: $3,557,000
General - Other: $3,287,000
General - Other: $2,113,000
Elementary and Secondary Education: $678,000
Housing and Community Development: $158,000
Housing and Community Development: $102,000
General Public Buildings: $58,000
General Public Buildings: $37,000
Corrections - Other: $32,000
Corrections - Other: $20,000
- Current Operations - Elementary and Secondary Education: $73,106,000
Elementary and Secondary Education: $71,659,000
General - Other: $63,076,000
General - Other: $56,757,000
Other Higher Education: $50,356,000
Other Higher Education: $50,016,000
Housing and Community Development: $16,779,000
Solid Waste Management: $15,882,000
Housing and Community Development: $15,098,000
Correctional Institutions: $14,835,000
Solid Waste Management: $14,291,000
Correctional Institutions: $13,348,000
Public Welfare - Other: $9,611,000
Public Welfare - Other: $8,648,000
Police Protection: $8,185,000
Judicial and Legal Services: $7,968,000
Police Protection: $7,365,000
Health - Other: $7,296,000
Judicial and Legal Services: $7,170,000
Public Welfare Institutions: $6,676,000
Health - Other: $6,565,000
Public Welfare Institutions: $6,007,000
Financial Administration: $3,772,000
Central Staff Services: $3,634,000
Financial Administration: $3,394,000
Central Staff Services: $3,270,000
General Public Buildings: $3,155,000
General Public Buildings: $2,839,000
Regular Highways: $2,719,000
Regular Highways: $2,446,000
Parks and Recreation: $1,377,000
Parks and Recreation: $1,239,000
Natural Resources - Other: $497,000
Corrections - Other: $484,000
Natural Resources - Other: $447,000
Corrections - Other: $435,000
Protective Inspection and Regulation - Other: $357,000
Protective Inspection and Regulation - Other: $321,000
Higher Education Auxiliary Enterprises: $148,000
Higher Education Auxiliary Enterprises: $24,000
- Federal Intergovernmental - Housing and Community Development: $14,376,000
Housing and Community Development: $14,128,000
Education: $2,724,000
Education: $932,000
Other: $377,000
Other: $370,000
- General - Interest on Debt: $15,479,000
Interest on Debt: $5,120,000
- Intergovernmental to Local - Other - Other Higher Education: $44,000
Other - Other Higher Education: $27,000
Other - Solid Waste Management: $14,000
Other - Solid Waste Management: $8,000
- Intergovernmental to State - Hospitals: $313,000
Hospitals: $191,000
Elementary and Secondary Education: $63,000
Elementary and Secondary Education: $63,000
- Local Intergovernmental - Education: $43,187,000
Education: $42,412,000
Other: $1,483,000
Other: $1,456,000
Housing and Community Development: $126,000
Housing and Community Development: $124,000
Highways: $114,000
Highways: $112,000
- Long Term Debt - Beginning Outstanding - Unspecified Public Purpose: $218,853,000
Outstanding Unspecified Public Purpose: $167,858,000
Beginning Outstanding - Unspecified Public Purpose: $116,863,000
Outstanding Unspecified Public Purpose: $65,868,000
Retired Unspecified Public Purpose: $50,995,000
Retired Unspecified Public Purpose: $50,995,000
Beginning Outstanding - Public Debt for Private Purpose: $12,876,000
Outstanding Nonguaranteed - Industrial Revenue: $12,008,000
Beginning Outstanding - Public Debt for Private Purpose: $11,140,000
Outstanding Nonguaranteed - Industrial Revenue: $10,272,000
Retired Nonguaranteed - Public Debt for Private Purpose: $868,000
Retired Nonguaranteed - Public Debt for Private Purpose: $868,000
- Miscellaneous - General Revenue - Other: $5,403,000
General Revenue - Other: $4,264,000
Fines and Forfeits: $3,501,000
Fines and Forfeits: $2,763,000
Interest Earnings: $2,755,000
Interest Earnings: $2,174,000
Rents: $35,000
Rents: $28,000
- Other Capital Outlay - Elementary and Secondary Education: $2,429,000
Elementary and Secondary Education: $1,331,000
Other Higher Education: $633,000
Other Higher Education: $323,000
- Other Funds - Cash and Securities: $94,270,000
Cash and Securities: $91,129,000
- Sinking Funds - Cash and Securities: $72,026,000
Cash and Securities: $69,627,000
- State Intergovernmental - Education: $21,626,000
Education: $12,981,000
Other: $9,989,000
Other: $9,945,000
Public Welfare: $8,950,000
Public Welfare: $8,911,000
Health and Hospitals: $1,346,000
Health and Hospitals: $1,340,000
Housing and Community Development: $87,000
Housing and Community Development: $87,000
- Tax - Property: $156,646,000
Property: $153,336,000
Other License: $99,000
Other License: $97,000
- Total Salaries and Wages: $69,508,000
: $67,108,000
Gloucester County government finances - Debt in 2020:
- Assistance and Subsidies - Public Welfare, Federal Categorical Assistance Programs: $4,605,000
Public Welfare, Federal Categorical Assistance Programs: $4,311,000
Public Welfare, Cash Assistance Programs - Other: $3,547,000
Public Welfare, Cash Assistance Programs - Other: $3,320,000
- Bond Funds - Cash and Securities: $45,468,000
Cash and Securities: $43,953,000
- Charges - Elementary and Secondary Education - Other: $29,377,000
Elementary and Secondary Education - Other: $27,249,000
Higher Education - Other: $21,793,000
Higher Education - Other: $20,628,000
Solid Waste Management: $15,749,000
Solid Waste Management: $14,609,000
Other: $12,421,000
Other: $11,522,000
Elementary and Secondary Education School Tuition and Transportation: $3,030,000
Elementary and Secondary Education School Tuition and Transportation: $2,811,000
Parks and Recreation: $1,805,000
Parks and Recreation: $1,675,000
Housing and Community Development: $1,491,000
Housing and Community Development: $1,383,000
Higher Education Auxiliary Enterprises: $786,000
Higher Education Auxiliary Enterprises: $730,000
Elementary and Secondary Education School Lunch: $625,000
Elementary and Secondary Education School Lunch: $580,000
- Construction - Other Higher Education: $15,645,000
Elementary and Secondary Education: $6,581,000
Other Higher Education: $3,557,000
General - Other: $3,287,000
General - Other: $2,113,000
Elementary and Secondary Education: $678,000
Housing and Community Development: $158,000
Housing and Community Development: $102,000
General Public Buildings: $58,000
General Public Buildings: $37,000
Corrections - Other: $32,000
Corrections - Other: $20,000
- Current Operations - Elementary and Secondary Education: $73,106,000
Elementary and Secondary Education: $71,659,000
General - Other: $63,076,000
General - Other: $56,757,000
Other Higher Education: $50,356,000
Other Higher Education: $50,016,000
Housing and Community Development: $16,779,000
Solid Waste Management: $15,882,000
Housing and Community Development: $15,098,000
Correctional Institutions: $14,835,000
Solid Waste Management: $14,291,000
Correctional Institutions: $13,348,000
Public Welfare - Other: $9,611,000
Public Welfare - Other: $8,648,000
Police Protection: $8,185,000
Judicial and Legal Services: $7,968,000
Police Protection: $7,365,000
Health - Other: $7,296,000
Judicial and Legal Services: $7,170,000
Public Welfare Institutions: $6,676,000
Health - Other: $6,565,000
Public Welfare Institutions: $6,007,000
Financial Administration: $3,772,000
Central Staff Services: $3,634,000
Financial Administration: $3,394,000
Central Staff Services: $3,270,000
General Public Buildings: $3,155,000
General Public Buildings: $2,839,000
Regular Highways: $2,719,000
Regular Highways: $2,446,000
Parks and Recreation: $1,377,000
Parks and Recreation: $1,239,000
Natural Resources - Other: $497,000
Corrections - Other: $484,000
Natural Resources - Other: $447,000
Corrections - Other: $435,000
Protective Inspection and Regulation - Other: $357,000
Protective Inspection and Regulation - Other: $321,000
Higher Education Auxiliary Enterprises: $148,000
Higher Education Auxiliary Enterprises: $24,000
- Federal Intergovernmental - Housing and Community Development: $14,376,000
Housing and Community Development: $14,128,000
Education: $2,724,000
Education: $932,000
Other: $377,000
Other: $370,000
- General - Interest on Debt: $15,479,000
Interest on Debt: $5,120,000
- Intergovernmental to Local - Other - Other Higher Education: $44,000
Other - Other Higher Education: $27,000
Other - Solid Waste Management: $14,000
Other - Solid Waste Management: $8,000
- Intergovernmental to State - Hospitals: $313,000
Hospitals: $191,000
Elementary and Secondary Education: $63,000
Elementary and Secondary Education: $63,000
- Local Intergovernmental - Education: $43,187,000
Education: $42,412,000
Other: $1,483,000
Other: $1,456,000
Housing and Community Development: $126,000
Housing and Community Development: $124,000
Highways: $114,000
Highways: $112,000
- Long Term Debt - Beginning Outstanding - Unspecified Public Purpose: $218,853,000
Outstanding Unspecified Public Purpose: $167,858,000
Beginning Outstanding - Unspecified Public Purpose: $116,863,000
Outstanding Unspecified Public Purpose: $65,868,000
Retired Unspecified Public Purpose: $50,995,000
Retired Unspecified Public Purpose: $50,995,000
Beginning Outstanding - Public Debt for Private Purpose: $12,876,000
Outstanding Nonguaranteed - Industrial Revenue: $12,008,000
Beginning Outstanding - Public Debt for Private Purpose: $11,140,000
Outstanding Nonguaranteed - Industrial Revenue: $10,272,000
Retired Nonguaranteed - Public Debt for Private Purpose: $868,000
Retired Nonguaranteed - Public Debt for Private Purpose: $868,000
- Miscellaneous - General Revenue - Other: $5,403,000
General Revenue - Other: $4,264,000
Fines and Forfeits: $3,501,000
Fines and Forfeits: $2,763,000
Interest Earnings: $2,755,000
Interest Earnings: $2,174,000
Rents: $35,000
Rents: $28,000
- Other Capital Outlay - Elementary and Secondary Education: $2,429,000
Elementary and Secondary Education: $1,331,000
Other Higher Education: $633,000
Other Higher Education: $323,000
- Other Funds - Cash and Securities: $94,270,000
Cash and Securities: $91,129,000
- Sinking Funds - Cash and Securities: $72,026,000
Cash and Securities: $69,627,000
- State Intergovernmental - Education: $21,626,000
Education: $12,981,000
Other: $9,989,000
Other: $9,945,000
Public Welfare: $8,950,000
Public Welfare: $8,911,000
Health and Hospitals: $1,346,000
Health and Hospitals: $1,340,000
Housing and Community Development: $87,000
Housing and Community Development: $87,000
- Tax - Property: $156,646,000
Property: $153,336,000
Other License: $99,000
Other License: $97,000
- Total Salaries and Wages: $69,508,000
: $67,108,000
Gloucester County government finances - Cash and Securities in 2020:
- Assistance and Subsidies - Public Welfare, Federal Categorical Assistance Programs: $4,605,000
Public Welfare, Federal Categorical Assistance Programs: $4,311,000
Public Welfare, Cash Assistance Programs - Other: $3,547,000
Public Welfare, Cash Assistance Programs - Other: $3,320,000
- Bond Funds - Cash and Securities: $45,468,000
Cash and Securities: $43,953,000
- Charges - Elementary and Secondary Education - Other: $29,377,000
Elementary and Secondary Education - Other: $27,249,000
Higher Education - Other: $21,793,000
Higher Education - Other: $20,628,000
Solid Waste Management: $15,749,000
Solid Waste Management: $14,609,000
Other: $12,421,000
Other: $11,522,000
Elementary and Secondary Education School Tuition and Transportation: $3,030,000
Elementary and Secondary Education School Tuition and Transportation: $2,811,000
Parks and Recreation: $1,805,000
Parks and Recreation: $1,675,000
Housing and Community Development: $1,491,000
Housing and Community Development: $1,383,000
Higher Education Auxiliary Enterprises: $786,000
Higher Education Auxiliary Enterprises: $730,000
Elementary and Secondary Education School Lunch: $625,000
Elementary and Secondary Education School Lunch: $580,000
- Construction - Other Higher Education: $15,645,000
Elementary and Secondary Education: $6,581,000
Other Higher Education: $3,557,000
General - Other: $3,287,000
General - Other: $2,113,000
Elementary and Secondary Education: $678,000
Housing and Community Development: $158,000
Housing and Community Development: $102,000
General Public Buildings: $58,000
General Public Buildings: $37,000
Corrections - Other: $32,000
Corrections - Other: $20,000
- Current Operations - Elementary and Secondary Education: $73,106,000
Elementary and Secondary Education: $71,659,000
General - Other: $63,076,000
General - Other: $56,757,000
Other Higher Education: $50,356,000
Other Higher Education: $50,016,000
Housing and Community Development: $16,779,000
Solid Waste Management: $15,882,000
Housing and Community Development: $15,098,000
Correctional Institutions: $14,835,000
Solid Waste Management: $14,291,000
Correctional Institutions: $13,348,000
Public Welfare - Other: $9,611,000
Public Welfare - Other: $8,648,000
Police Protection: $8,185,000
Judicial and Legal Services: $7,968,000
Police Protection: $7,365,000
Health - Other: $7,296,000
Judicial and Legal Services: $7,170,000
Public Welfare Institutions: $6,676,000
Health - Other: $6,565,000
Public Welfare Institutions: $6,007,000
Financial Administration: $3,772,000
Central Staff Services: $3,634,000
Financial Administration: $3,394,000
Central Staff Services: $3,270,000
General Public Buildings: $3,155,000
General Public Buildings: $2,839,000
Regular Highways: $2,719,000
Regular Highways: $2,446,000
Parks and Recreation: $1,377,000
Parks and Recreation: $1,239,000
Natural Resources - Other: $497,000
Corrections - Other: $484,000
Natural Resources - Other: $447,000
Corrections - Other: $435,000
Protective Inspection and Regulation - Other: $357,000
Protective Inspection and Regulation - Other: $321,000
Higher Education Auxiliary Enterprises: $148,000
Higher Education Auxiliary Enterprises: $24,000
- Federal Intergovernmental - Housing and Community Development: $14,376,000
Housing and Community Development: $14,128,000
Education: $2,724,000
Education: $932,000
Other: $377,000
Other: $370,000
- General - Interest on Debt: $15,479,000
Interest on Debt: $5,120,000
- Intergovernmental to Local - Other - Other Higher Education: $44,000
Other - Other Higher Education: $27,000
Other - Solid Waste Management: $14,000
Other - Solid Waste Management: $8,000
- Intergovernmental to State - Hospitals: $313,000
Hospitals: $191,000
Elementary and Secondary Education: $63,000
Elementary and Secondary Education: $63,000
- Local Intergovernmental - Education: $43,187,000
Education: $42,412,000
Other: $1,483,000
Other: $1,456,000
Housing and Community Development: $126,000
Housing and Community Development: $124,000
Highways: $114,000
Highways: $112,000
- Long Term Debt - Beginning Outstanding - Unspecified Public Purpose: $218,853,000
Outstanding Unspecified Public Purpose: $167,858,000
Beginning Outstanding - Unspecified Public Purpose: $116,863,000
Outstanding Unspecified Public Purpose: $65,868,000
Retired Unspecified Public Purpose: $50,995,000
Retired Unspecified Public Purpose: $50,995,000
Beginning Outstanding - Public Debt for Private Purpose: $12,876,000
Outstanding Nonguaranteed - Industrial Revenue: $12,008,000
Beginning Outstanding - Public Debt for Private Purpose: $11,140,000
Outstanding Nonguaranteed - Industrial Revenue: $10,272,000
Retired Nonguaranteed - Public Debt for Private Purpose: $868,000
Retired Nonguaranteed - Public Debt for Private Purpose: $868,000
- Miscellaneous - General Revenue - Other: $5,403,000
General Revenue - Other: $4,264,000
Fines and Forfeits: $3,501,000
Fines and Forfeits: $2,763,000
Interest Earnings: $2,755,000
Interest Earnings: $2,174,000
Rents: $35,000
Rents: $28,000
- Other Capital Outlay - Elementary and Secondary Education: $2,429,000
Elementary and Secondary Education: $1,331,000
Other Higher Education: $633,000
Other Higher Education: $323,000
- Other Funds - Cash and Securities: $94,270,000
Cash and Securities: $91,129,000
- Sinking Funds - Cash and Securities: $72,026,000
Cash and Securities: $69,627,000
- State Intergovernmental - Education: $21,626,000
Education: $12,981,000
Other: $9,989,000
Other: $9,945,000
Public Welfare: $8,950,000
Public Welfare: $8,911,000
Health and Hospitals: $1,346,000
Health and Hospitals: $1,340,000
Housing and Community Development: $87,000
Housing and Community Development: $87,000
- Tax - Property: $156,646,000
Property: $153,336,000
Other License: $99,000
Other License: $97,000
- Total Salaries and Wages: $69,508,000
: $67,108,000
Supplemental Security Income (SSI) in 2006:
- Total number of recipients: 3,655
- Number of aged recipients: 384
- Number of blind and disabled recipients: 3,271
- Number of recipients under 18: 556
- Number of recipients between 18 and 64: 2,402
- Number of recipients older than 64: 697
- Number of recipients also receiving OASDI: 1,318
- Amount of payments (thousands of dollars): 1,752
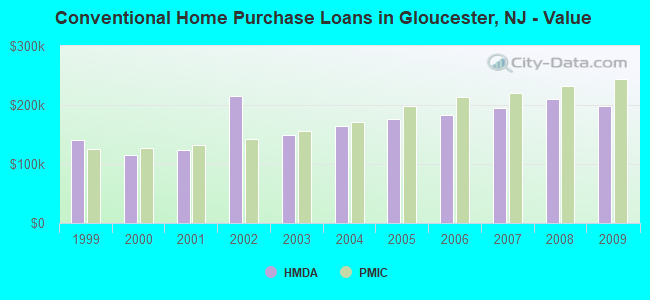
| Home Mortgage Disclosure Act Aggregated Statistics For Year 2009 (Based on 59 full tracts) | ||||||||||||||
| A) FHA, FSA/RHS & VA Home Purchase Loans | B) Conventional Home Purchase Loans | C) Refinancings | D) Home Improvement Loans | E) Loans on Dwellings For 5+ Families | F) Non-occupant Loans on < 5 Family Dwellings (A B C & D) | G) Loans On Manufactured Home Dwelling (A B C & D) | ||||||||
|---|---|---|---|---|---|---|---|---|---|---|---|---|---|---|
| Number | Average Value | Number | Average Value | Number | Average Value | Number | Average Value | Number | Average Value | Number | Average Value | Number | Average Value | |
| LOANS ORIGINATED | 1,458 | $199,062 | 1,122 | $198,315 | 7,303 | $194,873 | 698 | $63,155 | 9 | $1,671,556 | 198 | $136,990 | 30 | $70,233 |
| APPLICATIONS APPROVED, NOT ACCEPTED | 67 | $201,507 | 102 | $218,637 | 620 | $190,385 | 85 | $41,176 | 0 | $0 | 18 | $118,667 | 4 | $46,500 |
| APPLICATIONS DENIED | 223 | $209,184 | 228 | $193,158 | 2,913 | $206,499 | 567 | $42,705 | 3 | $9,409,000 | 116 | $114,276 | 28 | $60,179 |
| APPLICATIONS WITHDRAWN | 201 | $208,055 | 202 | $212,876 | 1,813 | $207,853 | 123 | $95,187 | 0 | $0 | 53 | $112,113 | 6 | $107,500 |
| FILES CLOSED FOR INCOMPLETENESS | 66 | $195,364 | 36 | $182,556 | 507 | $205,903 | 44 | $91,795 | 0 | $0 | 7 | $144,714 | 1 | $68,000 |
| Private Mortgage Insurance Companies Aggregated Statistics For Year 2009 (Based on 57 full tracts) | ||||||
| A) Conventional Home Purchase Loans | B) Refinancings | C) Non-occupant Loans on < 5 Family Dwellings (A & B) | ||||
|---|---|---|---|---|---|---|
| Number | Average Value | Number | Average Value | Number | Average Value | |
| LOANS ORIGINATED | 183 | $244,268 | 177 | $253,028 | 1 | $376,000 |
| APPLICATIONS APPROVED, NOT ACCEPTED | 93 | $271,656 | 86 | $242,140 | 1 | $297,000 |
| APPLICATIONS DENIED | 46 | $223,761 | 59 | $238,627 | 0 | $0 |
| APPLICATIONS WITHDRAWN | 14 | $220,857 | 25 | $261,160 | 0 | $0 |
| FILES CLOSED FOR INCOMPLETENESS | 7 | $213,143 | 6 | $239,833 | 0 | $0 |
| Most common first names in Gloucester County, NJ among deceased individuals | ||
| Name | Count | Lived (average) |
|---|---|---|
| John | 1,843 | 72.8 years |
| William | 1,554 | 73.5 years |
| Mary | 1,528 | 79.6 years |
| Joseph | 1,195 | 73.0 years |
| James | 989 | 71.6 years |
| Charles | 945 | 73.9 years |
| Anna | 877 | 80.6 years |
| Robert | 836 | 68.6 years |
| George | 820 | 74.8 years |
| Margaret | 701 | 78.1 years |
| Most common last names in Gloucester County, NJ among deceased individuals | ||
| Last name | Count | Lived (average) |
|---|---|---|
| Smith | 400 | 75.8 years |
| Miller | 266 | 76.2 years |
| Brown | 263 | 75.5 years |
| Jones | 248 | 75.3 years |
| Johnson | 247 | 74.3 years |
| Williams | 232 | 73.8 years |
| Davis | 180 | 76.7 years |
| Moore | 158 | 76.0 years |
| Wilson | 155 | 74.5 years |
| Robinson | 137 | 74.9 years |
| Businesses in Gloucester County, NJ | ||||
| Name | Count | Name | Count | |
|---|---|---|---|---|
| 7-Eleven | 2 | Lane Bryant | 1 | |
| ALDI | 1 | Lane Furniture | 3 | |
| ALDO | 1 | LensCrafters | 1 | |
| AT&T | 3 | Lowe's | 2 | |
| Abercrombie & Fitch | 1 | Macy's | 1 | |
| Advance Auto Parts | 3 | Marriott | 1 | |
| Aeropostale | 2 | Marshalls | 1 | |
| American Eagle Outfitters | 1 | MasterBrand Cabinets | 18 | |
| Ann Taylor | 1 | McDonald's | 9 | |
| Applebee's | 2 | Men's Wearhouse | 1 | |
| Arby's | 3 | Motel 6 | 1 | |
| AutoZone | 3 | Motherhood Maternity | 4 | |
| Bally Total Fitness | 1 | New Balance | 1 | |
| Barnes & Noble | 1 | New York & Co | 1 | |
| Bath & Body Works | 1 | Nike | 4 | |
| Bed Bath & Beyond | 2 | Nissan | 1 | |
| Best Western | 1 | OfficeMax | 1 | |
| Blockbuster | 3 | Old Country Buffet | 1 | |
| Brunswick Bowling & Billiards | 1 | Old Navy | 2 | |
| Budget Car Rental | 1 | Olive Garden | 1 | |
| Burger King | 6 | Outback | 1 | |
| CVS | 10 | Outback Steakhouse | 1 | |
| Casual Male XL | 1 | Pac Sun | 1 | |
| Catherines | 1 | Papa John's Pizza | 2 | |
| Charlotte Russe | 1 | Payless | 3 | |
| Chevrolet | 1 | Penske | 1 | |
| Chick-Fil-A | 2 | PetSmart | 3 | |
| Cinnabon | 1 | Pier 1 Imports | 1 | |
| Cold Stone Creamery | 1 | Pizza Hut | 3 | |
| Cricket Wireless | 6 | Plato's Closet | 1 | |
| DHL | 2 | RadioShack | 3 | |
| Deb | 1 | Raymour & Flanigan | 1 | |
| Decora Cabinetry | 4 | Red Lobster | 1 | |
| Domino's Pizza | 4 | Rite Aid | 12 | |
| DressBarn | 1 | Ruby Tuesday | 1 | |
| Dressbarn | 1 | Ryder Rental & Truck Leasing | 1 | |
| Dunkin Donuts | 15 | Sam's Club | 2 | |
| Express | 1 | Sears | 4 | |
| Famous Footwear | 1 | Sephora | 1 | |
| Fashion Bug | 4 | Spencer Gifts | 1 | |
| FedEx | 24 | Sprint Nextel | 4 | |
| Firestone Complete Auto Care | 2 | Staples | 3 | |
| Foot Locker | 1 | Starbucks | 3 | |
| Ford | 1 | Subway | 14 | |
| Forever 21 | 1 | T-Mobile | 1 | |
| GNC | 11 | T.J.Maxx | 1 | |
| GameStop | 5 | Taco Bell | 4 | |
| Gap | 1 | Target | 2 | |
| Goodwill | 2 | The Athlete's Foot | 1 | |
| Gymboree | 1 | The Limited | 1 | |
| H&R Block | 7 | The Room Place | 2 | |
| Haworth | 1 | Torrid | 1 | |
| Hilton | 1 | Toys"R"Us | 2 | |
| Holiday Inn | 1 | True Value | 3 | |
| Hollister Co. | 1 | U-Haul | 14 | |
| Home Depot | 1 | UPS | 38 | |
| Hot Topic | 1 | Verizon Wireless | 3 | |
| JCPenney | 1 | Victoria's Secret | 1 | |
| Journeys | 1 | Volkswagen | 1 | |
| Justice | 2 | Walgreens | 5 | |
| KFC | 2 | Walmart | 2 | |
| Kmart | 2 | Wendy's | 4 | |
| Kroger | 1 | Wet Seal | 1 | |
| LA Fitness | 2 | YMCA | 1 | |
| La-Z-Boy | 2 | |||
Gloucester County on our top lists:
- #1 on the list of "Top 101 counties with the lowest number of infant deaths per 1000 residents 2007-2013 (pop. 50,000+)"
- #1 on the list of "Top 101 counties with the largest decrease in the number of infant deaths per 1000 residents 2000-2006 to 2007-2013 (pop. 50,000+)"
- #47 on the list of "Top 101 counties with the lowest percentage of residents that keep firearms around their homes"
- #82 on the list of "Top 101 counties with the most Black Protestant adherents"
- #82 on the list of "Top 101 counties with the most Black Protestant adherents (pop. 50,000+)"
- #94 on the list of "Top 101 counties with the highest average weight of females"
- #99 on the list of "Top 101 counties with the lowest percentage of residents that exercised in the past month"