Paulsboro, New Jersey Submit your own pictures of this borough and show them to the world
OSM Map
General Map
Google Map
MSN Map
OSM Map
General Map
Google Map
MSN Map
OSM Map
General Map
Google Map
MSN Map
OSM Map
General Map
Google Map
MSN Map
Please wait while loading the map...
Population in 2022: 6,249 (100% urban, 0% rural). Population change since 2000: +1.4%Males: 2,959 Females: 3,290
March 2022 cost of living index in Paulsboro: 100.8 (near average, U.S. average is 100) Percentage of residents living in poverty in 2022: 8.9%for White Non-Hispanic residents , 10.5% for Black residents , 14.2% for Hispanic or Latino residents , 62.2% for American Indian residents , 3.4% for two or more races residents )
Profiles of local businesses
Business Search - 14 Million verified businesses
Data:
Median household income ($)
Median household income (% change since 2000)
Household income diversity
Ratio of average income to average house value (%)
Ratio of average income to average rent
Median household income ($) - White
Median household income ($) - Black or African American
Median household income ($) - Asian
Median household income ($) - Hispanic or Latino
Median household income ($) - American Indian and Alaska Native
Median household income ($) - Multirace
Median household income ($) - Other Race
Median household income for houses/condos with a mortgage ($)
Median household income for apartments without a mortgage ($)
Races - White alone (%)
Races - White alone (% change since 2000)
Races - Black alone (%)
Races - Black alone (% change since 2000)
Races - American Indian alone (%)
Races - American Indian alone (% change since 2000)
Races - Asian alone (%)
Races - Asian alone (% change since 2000)
Races - Hispanic (%)
Races - Hispanic (% change since 2000)
Races - Native Hawaiian and Other Pacific Islander alone (%)
Races - Native Hawaiian and Other Pacific Islander alone (% change since 2000)
Races - Two or more races (%)
Races - Two or more races (% change since 2000)
Races - Other race alone (%)
Races - Other race alone (% change since 2000)
Racial diversity
Unemployment (%)
Unemployment (% change since 2000)
Unemployment (%) - White
Unemployment (%) - Black or African American
Unemployment (%) - Asian
Unemployment (%) - Hispanic or Latino
Unemployment (%) - American Indian and Alaska Native
Unemployment (%) - Multirace
Unemployment (%) - Other Race
Population density (people per square mile)
Population - Males (%)
Population - Females (%)
Population - Males (%) - White
Population - Males (%) - Black or African American
Population - Males (%) - Asian
Population - Males (%) - Hispanic or Latino
Population - Males (%) - American Indian and Alaska Native
Population - Males (%) - Multirace
Population - Males (%) - Other Race
Population - Females (%) - White
Population - Females (%) - Black or African American
Population - Females (%) - Asian
Population - Females (%) - Hispanic or Latino
Population - Females (%) - American Indian and Alaska Native
Population - Females (%) - Multirace
Population - Females (%) - Other Race
Coronavirus confirmed cases (Apr 28, 2024)
Deaths caused by coronavirus (Apr 28, 2024)
Coronavirus confirmed cases (per 100k population) (Apr 28, 2024)
Deaths caused by coronavirus (per 100k population) (Apr 28, 2024)
Daily increase in number of cases (Apr 28, 2024)
Weekly increase in number of cases (Apr 28, 2024)
Cases doubled (in days) (Apr 28, 2024)
Hospitalized patients (Apr 18, 2022)
Negative test results (Apr 18, 2022)
Total test results (Apr 18, 2022)
COVID Vaccine doses distributed (per 100k population) (Sep 19, 2023)
COVID Vaccine doses administered (per 100k population) (Sep 19, 2023)
COVID Vaccine doses distributed (Sep 19, 2023)
COVID Vaccine doses administered (Sep 19, 2023)
Likely homosexual households (%)
Likely homosexual households (% change since 2000)
Likely homosexual households - Lesbian couples (%)
Likely homosexual households - Lesbian couples (% change since 2000)
Likely homosexual households - Gay men (%)
Likely homosexual households - Gay men (% change since 2000)
Cost of living index
Median gross rent ($)
Median contract rent ($)
Median monthly housing costs ($)
Median house or condo value ($)
Median house or condo value ($ change since 2000)
Mean house or condo value by units in structure - 1, detached ($)
Mean house or condo value by units in structure - 1, attached ($)
Mean house or condo value by units in structure - 2 ($)
Mean house or condo value by units in structure by units in structure - 3 or 4 ($)
Mean house or condo value by units in structure - 5 or more ($)
Mean house or condo value by units in structure - Boat, RV, van, etc. ($)
Mean house or condo value by units in structure - Mobile home ($)
Median house or condo value ($) - White
Median house or condo value ($) - Black or African American
Median house or condo value ($) - Asian
Median house or condo value ($) - Hispanic or Latino
Median house or condo value ($) - American Indian and Alaska Native
Median house or condo value ($) - Multirace
Median house or condo value ($) - Other Race
Median resident age
Resident age diversity
Median resident age - Males
Median resident age - Females
Median resident age - White
Median resident age - Black or African American
Median resident age - Asian
Median resident age - Hispanic or Latino
Median resident age - American Indian and Alaska Native
Median resident age - Multirace
Median resident age - Other Race
Median resident age - Males - White
Median resident age - Males - Black or African American
Median resident age - Males - Asian
Median resident age - Males - Hispanic or Latino
Median resident age - Males - American Indian and Alaska Native
Median resident age - Males - Multirace
Median resident age - Males - Other Race
Median resident age - Females - White
Median resident age - Females - Black or African American
Median resident age - Females - Asian
Median resident age - Females - Hispanic or Latino
Median resident age - Females - American Indian and Alaska Native
Median resident age - Females - Multirace
Median resident age - Females - Other Race
Commute - mean travel time to work (minutes)
Travel time to work - Less than 5 minutes (%)
Travel time to work - Less than 5 minutes (% change since 2000)
Travel time to work - 5 to 9 minutes (%)
Travel time to work - 5 to 9 minutes (% change since 2000)
Travel time to work - 10 to 19 minutes (%)
Travel time to work - 10 to 19 minutes (% change since 2000)
Travel time to work - 20 to 29 minutes (%)
Travel time to work - 20 to 29 minutes (% change since 2000)
Travel time to work - 30 to 39 minutes (%)
Travel time to work - 30 to 39 minutes (% change since 2000)
Travel time to work - 40 to 59 minutes (%)
Travel time to work - 40 to 59 minutes (% change since 2000)
Travel time to work - 60 to 89 minutes (%)
Travel time to work - 60 to 89 minutes (% change since 2000)
Travel time to work - 90 or more minutes (%)
Travel time to work - 90 or more minutes (% change since 2000)
Marital status - Never married (%)
Marital status - Now married (%)
Marital status - Separated (%)
Marital status - Widowed (%)
Marital status - Divorced (%)
Median family income ($)
Median family income (% change since 2000)
Median non-family income ($)
Median non-family income (% change since 2000)
Median per capita income ($)
Median per capita income (% change since 2000)
Median family income ($) - White
Median family income ($) - Black or African American
Median family income ($) - Asian
Median family income ($) - Hispanic or Latino
Median family income ($) - American Indian and Alaska Native
Median family income ($) - Multirace
Median family income ($) - Other Race
Median year house/condo built
Median year apartment built
Year house built - Built 2005 or later (%)
Year house built - Built 2000 to 2004 (%)
Year house built - Built 1990 to 1999 (%)
Year house built - Built 1980 to 1989 (%)
Year house built - Built 1970 to 1979 (%)
Year house built - Built 1960 to 1969 (%)
Year house built - Built 1950 to 1959 (%)
Year house built - Built 1940 to 1949 (%)
Year house built - Built 1939 or earlier (%)
Average household size
Household density (households per square mile)
Average household size - White
Average household size - Black or African American
Average household size - Asian
Average household size - Hispanic or Latino
Average household size - American Indian and Alaska Native
Average household size - Multirace
Average household size - Other Race
Occupied housing units (%)
Vacant housing units (%)
Owner occupied housing units (%)
Renter occupied housing units (%)
Vacancy status - For rent (%)
Vacancy status - For sale only (%)
Vacancy status - Rented or sold, not occupied (%)
Vacancy status - For seasonal, recreational, or occasional use (%)
Vacancy status - For migrant workers (%)
Vacancy status - Other vacant (%)
Residents with income below the poverty level (%)
Residents with income below 50% of the poverty level (%)
Children below poverty level (%)
Poor families by family type - Married-couple family (%)
Poor families by family type - Male, no wife present (%)
Poor families by family type - Female, no husband present (%)
Poverty status for native-born residents (%)
Poverty status for foreign-born residents (%)
Poverty among high school graduates not in families (%)
Poverty among people who did not graduate high school not in families (%)
Residents with income below the poverty level (%) - White
Residents with income below the poverty level (%) - Black or African American
Residents with income below the poverty level (%) - Asian
Residents with income below the poverty level (%) - Hispanic or Latino
Residents with income below the poverty level (%) - American Indian and Alaska Native
Residents with income below the poverty level (%) - Multirace
Residents with income below the poverty level (%) - Other Race
Air pollution - Air Quality Index (AQI)
Air pollution - CO
Air pollution - NO2
Air pollution - SO2
Air pollution - Ozone
Air pollution - PM10
Air pollution - PM25
Air pollution - Pb
Crime - Murders per 100,000 population
Crime - Rapes per 100,000 population
Crime - Robberies per 100,000 population
Crime - Assaults per 100,000 population
Crime - Burglaries per 100,000 population
Crime - Thefts per 100,000 population
Crime - Auto thefts per 100,000 population
Crime - Arson per 100,000 population
Crime - City-data.com crime index
Crime - Violent crime index
Crime - Property crime index
Crime - Murders per 100,000 population (5 year average)
Crime - Rapes per 100,000 population (5 year average)
Crime - Robberies per 100,000 population (5 year average)
Crime - Assaults per 100,000 population (5 year average)
Crime - Burglaries per 100,000 population (5 year average)
Crime - Thefts per 100,000 population (5 year average)
Crime - Auto thefts per 100,000 population (5 year average)
Crime - Arson per 100,000 population (5 year average)
Crime - City-data.com crime index (5 year average)
Crime - Violent crime index (5 year average)
Crime - Property crime index (5 year average)
1996 Presidential Elections Results (%) - Democratic Party (Clinton)
1996 Presidential Elections Results (%) - Republican Party (Dole)
1996 Presidential Elections Results (%) - Other
2000 Presidential Elections Results (%) - Democratic Party (Gore)
2000 Presidential Elections Results (%) - Republican Party (Bush)
2000 Presidential Elections Results (%) - Other
2004 Presidential Elections Results (%) - Democratic Party (Kerry)
2004 Presidential Elections Results (%) - Republican Party (Bush)
2004 Presidential Elections Results (%) - Other
2008 Presidential Elections Results (%) - Democratic Party (Obama)
2008 Presidential Elections Results (%) - Republican Party (McCain)
2008 Presidential Elections Results (%) - Other
2012 Presidential Elections Results (%) - Democratic Party (Obama)
2012 Presidential Elections Results (%) - Republican Party (Romney)
2012 Presidential Elections Results (%) - Other
2016 Presidential Elections Results (%) - Democratic Party (Clinton)
2016 Presidential Elections Results (%) - Republican Party (Trump)
2016 Presidential Elections Results (%) - Other
2020 Presidential Elections Results (%) - Democratic Party (Biden)
2020 Presidential Elections Results (%) - Republican Party (Trump)
2020 Presidential Elections Results (%) - Other
Ancestries Reported - Arab (%)
Ancestries Reported - Czech (%)
Ancestries Reported - Danish (%)
Ancestries Reported - Dutch (%)
Ancestries Reported - English (%)
Ancestries Reported - French (%)
Ancestries Reported - French Canadian (%)
Ancestries Reported - German (%)
Ancestries Reported - Greek (%)
Ancestries Reported - Hungarian (%)
Ancestries Reported - Irish (%)
Ancestries Reported - Italian (%)
Ancestries Reported - Lithuanian (%)
Ancestries Reported - Norwegian (%)
Ancestries Reported - Polish (%)
Ancestries Reported - Portuguese (%)
Ancestries Reported - Russian (%)
Ancestries Reported - Scotch-Irish (%)
Ancestries Reported - Scottish (%)
Ancestries Reported - Slovak (%)
Ancestries Reported - Subsaharan African (%)
Ancestries Reported - Swedish (%)
Ancestries Reported - Swiss (%)
Ancestries Reported - Ukrainian (%)
Ancestries Reported - United States (%)
Ancestries Reported - Welsh (%)
Ancestries Reported - West Indian (%)
Ancestries Reported - Other (%)
Educational Attainment - No schooling completed (%)
Educational Attainment - Less than high school (%)
Educational Attainment - High school or equivalent (%)
Educational Attainment - Less than 1 year of college (%)
Educational Attainment - 1 or more years of college (%)
Educational Attainment - Associate degree (%)
Educational Attainment - Bachelor's degree (%)
Educational Attainment - Master's degree (%)
Educational Attainment - Professional school degree (%)
Educational Attainment - Doctorate degree (%)
School Enrollment - Nursery, preschool (%)
School Enrollment - Kindergarten (%)
School Enrollment - Grade 1 to 4 (%)
School Enrollment - Grade 5 to 8 (%)
School Enrollment - Grade 9 to 12 (%)
School Enrollment - College undergrad (%)
School Enrollment - Graduate or professional (%)
School Enrollment - Not enrolled in school (%)
School enrollment - Public schools (%)
School enrollment - Private schools (%)
School enrollment - Not enrolled (%)
Median number of rooms in houses and condos
Median number of rooms in apartments
Housing units lacking complete plumbing facilities (%)
Housing units lacking complete kitchen facilities (%)
Density of houses
Urban houses (%)
Rural houses (%)
Households with people 60 years and over (%)
Households with people 65 years and over (%)
Households with people 75 years and over (%)
Households with one or more nonrelatives (%)
Households with no nonrelatives (%)
Population in households (%)
Family households (%)
Nonfamily households (%)
Population in families (%)
Family households with own children (%)
Median number of bedrooms in owner occupied houses
Mean number of bedrooms in owner occupied houses
Median number of bedrooms in renter occupied houses
Mean number of bedrooms in renter occupied houses
Median number of vehichles in owner occupied houses
Mean number of vehichles in owner occupied houses
Median number of vehichles in renter occupied houses
Mean number of vehichles in renter occupied houses
Mortgage status - with mortgage (%)
Mortgage status - with second mortgage (%)
Mortgage status - with home equity loan (%)
Mortgage status - with both second mortgage and home equity loan (%)
Mortgage status - without a mortgage (%)
Average family size
Average family size - White
Average family size - Black or African American
Average family size - Asian
Average family size - Hispanic or Latino
Average family size - American Indian and Alaska Native
Average family size - Multirace
Average family size - Other Race
Geographical mobility - Same house 1 year ago (%)
Geographical mobility - Moved within same county (%)
Geographical mobility - Moved from different county within same state (%)
Geographical mobility - Moved from different state (%)
Geographical mobility - Moved from abroad (%)
Place of birth - Born in state of residence (%)
Place of birth - Born in other state (%)
Place of birth - Native, outside of US (%)
Place of birth - Foreign born (%)
Housing units in structures - 1, detached (%)
Housing units in structures - 1, attached (%)
Housing units in structures - 2 (%)
Housing units in structures - 3 or 4 (%)
Housing units in structures - 5 to 9 (%)
Housing units in structures - 10 to 19 (%)
Housing units in structures - 20 to 49 (%)
Housing units in structures - 50 or more (%)
Housing units in structures - Mobile home (%)
Housing units in structures - Boat, RV, van, etc. (%)
House/condo owner moved in on average (years ago)
Renter moved in on average (years ago)
Year householder moved into unit - Moved in 1999 to March 2000 (%)
Year householder moved into unit - Moved in 1995 to 1998 (%)
Year householder moved into unit - Moved in 1990 to 1994 (%)
Year householder moved into unit - Moved in 1980 to 1989 (%)
Year householder moved into unit - Moved in 1970 to 1979 (%)
Year householder moved into unit - Moved in 1969 or earlier (%)
Means of transportation to work - Drove car alone (%)
Means of transportation to work - Carpooled (%)
Means of transportation to work - Public transportation (%)
Means of transportation to work - Bus or trolley bus (%)
Means of transportation to work - Streetcar or trolley car (%)
Means of transportation to work - Subway or elevated (%)
Means of transportation to work - Railroad (%)
Means of transportation to work - Ferryboat (%)
Means of transportation to work - Taxicab (%)
Means of transportation to work - Motorcycle (%)
Means of transportation to work - Bicycle (%)
Means of transportation to work - Walked (%)
Means of transportation to work - Other means (%)
Working at home (%)
Industry diversity
Most Common Industries - Agriculture, forestry, fishing and hunting, and mining (%)
Most Common Industries - Agriculture, forestry, fishing and hunting (%)
Most Common Industries - Mining, quarrying, and oil and gas extraction (%)
Most Common Industries - Construction (%)
Most Common Industries - Manufacturing (%)
Most Common Industries - Wholesale trade (%)
Most Common Industries - Retail trade (%)
Most Common Industries - Transportation and warehousing, and utilities (%)
Most Common Industries - Transportation and warehousing (%)
Most Common Industries - Utilities (%)
Most Common Industries - Information (%)
Most Common Industries - Finance and insurance, and real estate and rental and leasing (%)
Most Common Industries - Finance and insurance (%)
Most Common Industries - Real estate and rental and leasing (%)
Most Common Industries - Professional, scientific, and management, and administrative and waste management services (%)
Most Common Industries - Professional, scientific, and technical services (%)
Most Common Industries - Management of companies and enterprises (%)
Most Common Industries - Administrative and support and waste management services (%)
Most Common Industries - Educational services, and health care and social assistance (%)
Most Common Industries - Educational services (%)
Most Common Industries - Health care and social assistance (%)
Most Common Industries - Arts, entertainment, and recreation, and accommodation and food services (%)
Most Common Industries - Arts, entertainment, and recreation (%)
Most Common Industries - Accommodation and food services (%)
Most Common Industries - Other services, except public administration (%)
Most Common Industries - Public administration (%)
Occupation diversity
Most Common Occupations - Management, business, science, and arts occupations (%)
Most Common Occupations - Management, business, and financial occupations (%)
Most Common Occupations - Management occupations (%)
Most Common Occupations - Business and financial operations occupations (%)
Most Common Occupations - Computer, engineering, and science occupations (%)
Most Common Occupations - Computer and mathematical occupations (%)
Most Common Occupations - Architecture and engineering occupations (%)
Most Common Occupations - Life, physical, and social science occupations (%)
Most Common Occupations - Education, legal, community service, arts, and media occupations (%)
Most Common Occupations - Community and social service occupations (%)
Most Common Occupations - Legal occupations (%)
Most Common Occupations - Education, training, and library occupations (%)
Most Common Occupations - Arts, design, entertainment, sports, and media occupations (%)
Most Common Occupations - Healthcare practitioners and technical occupations (%)
Most Common Occupations - Health diagnosing and treating practitioners and other technical occupations (%)
Most Common Occupations - Health technologists and technicians (%)
Most Common Occupations - Service occupations (%)
Most Common Occupations - Healthcare support occupations (%)
Most Common Occupations - Protective service occupations (%)
Most Common Occupations - Fire fighting and prevention, and other protective service workers including supervisors (%)
Most Common Occupations - Law enforcement workers including supervisors (%)
Most Common Occupations - Food preparation and serving related occupations (%)
Most Common Occupations - Building and grounds cleaning and maintenance occupations (%)
Most Common Occupations - Personal care and service occupations (%)
Most Common Occupations - Sales and office occupations (%)
Most Common Occupations - Sales and related occupations (%)
Most Common Occupations - Office and administrative support occupations (%)
Most Common Occupations - Natural resources, construction, and maintenance occupations (%)
Most Common Occupations - Farming, fishing, and forestry occupations (%)
Most Common Occupations - Construction and extraction occupations (%)
Most Common Occupations - Installation, maintenance, and repair occupations (%)
Most Common Occupations - Production, transportation, and material moving occupations (%)
Most Common Occupations - Production occupations (%)
Most Common Occupations - Transportation occupations (%)
Most Common Occupations - Material moving occupations (%)
People in Group quarters - Institutionalized population (%)
People in Group quarters - Correctional institutions (%)
People in Group quarters - Federal prisons and detention centers (%)
People in Group quarters - Halfway houses (%)
People in Group quarters - Local jails and other confinement facilities (including police lockups) (%)
People in Group quarters - Military disciplinary barracks (%)
People in Group quarters - State prisons (%)
People in Group quarters - Other types of correctional institutions (%)
People in Group quarters - Nursing homes (%)
People in Group quarters - Hospitals/wards, hospices, and schools for the handicapped (%)
People in Group quarters - Hospitals/wards and hospices for chronically ill (%)
People in Group quarters - Hospices or homes for chronically ill (%)
People in Group quarters - Military hospitals or wards for chronically ill (%)
People in Group quarters - Other hospitals or wards for chronically ill (%)
People in Group quarters - Hospitals or wards for drug/alcohol abuse (%)
People in Group quarters - Mental (Psychiatric) hospitals or wards (%)
People in Group quarters - Schools, hospitals, or wards for the mentally retarded (%)
People in Group quarters - Schools, hospitals, or wards for the physically handicapped (%)
People in Group quarters - Institutions for the deaf (%)
People in Group quarters - Institutions for the blind (%)
People in Group quarters - Orthopedic wards and institutions for the physically handicapped (%)
People in Group quarters - Wards in general hospitals for patients who have no usual home elsewhere (%)
People in Group quarters - Wards in military hospitals for patients who have no usual home elsewhere (%)
People in Group quarters - Juvenile institutions (%)
People in Group quarters - Long-term care (%)
People in Group quarters - Homes for abused, dependent, and neglected children (%)
People in Group quarters - Residential treatment centers for emotionally disturbed children (%)
People in Group quarters - Training schools for juvenile delinquents (%)
People in Group quarters - Short-term care, detention or diagnostic centers for delinquent children (%)
People in Group quarters - Type of juvenile institution unknown (%)
People in Group quarters - Noninstitutionalized population (%)
People in Group quarters - College dormitories (includes college quarters off campus) (%)
People in Group quarters - Military quarters (%)
People in Group quarters - On base (%)
People in Group quarters - Barracks, unaccompanied personnel housing (UPH), (Enlisted/Officer), ;and similar group living quarters for military personnel (%)
People in Group quarters - Transient quarters for temporary residents (%)
People in Group quarters - Military ships (%)
People in Group quarters - Group homes (%)
People in Group quarters - Homes or halfway houses for drug/alcohol abuse (%)
People in Group quarters - Homes for the mentally ill (%)
People in Group quarters - Homes for the mentally retarded (%)
People in Group quarters - Homes for the physically handicapped (%)
People in Group quarters - Other group homes (%)
People in Group quarters - Religious group quarters (%)
People in Group quarters - Dormitories (%)
People in Group quarters - Agriculture workers' dormitories on farms (%)
People in Group quarters - Job Corps and vocational training facilities (%)
People in Group quarters - Other workers' dormitories (%)
People in Group quarters - Crews of maritime vessels (%)
People in Group quarters - Other nonhousehold living situations (%)
People in Group quarters - Other noninstitutional group quarters (%)
Residents speaking English at home (%)
Residents speaking English at home - Born in the United States (%)
Residents speaking English at home - Native, born elsewhere (%)
Residents speaking English at home - Foreign born (%)
Residents speaking Spanish at home (%)
Residents speaking Spanish at home - Born in the United States (%)
Residents speaking Spanish at home - Native, born elsewhere (%)
Residents speaking Spanish at home - Foreign born (%)
Residents speaking other language at home (%)
Residents speaking other language at home - Born in the United States (%)
Residents speaking other language at home - Native, born elsewhere (%)
Residents speaking other language at home - Foreign born (%)
Class of Workers - Employee of private company (%)
Class of Workers - Self-employed in own incorporated business (%)
Class of Workers - Private not-for-profit wage and salary workers (%)
Class of Workers - Local government workers (%)
Class of Workers - State government workers (%)
Class of Workers - Federal government workers (%)
Class of Workers - Self-employed workers in own not incorporated business and Unpaid family workers (%)
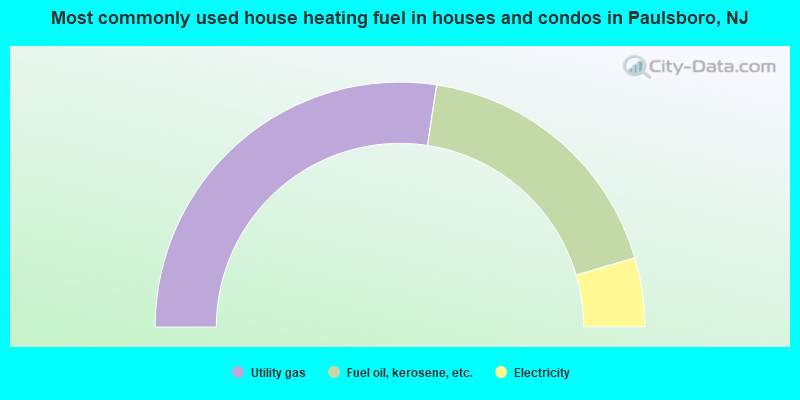
House heating fuel used in houses and condos - Utility gas (%)
House heating fuel used in houses and condos - Bottled, tank, or LP gas (%)
House heating fuel used in houses and condos - Electricity (%)
House heating fuel used in houses and condos - Fuel oil, kerosene, etc. (%)
House heating fuel used in houses and condos - Coal or coke (%)
House heating fuel used in houses and condos - Wood (%)
House heating fuel used in houses and condos - Solar energy (%)
House heating fuel used in houses and condos - Other fuel (%)
House heating fuel used in houses and condos - No fuel used (%)
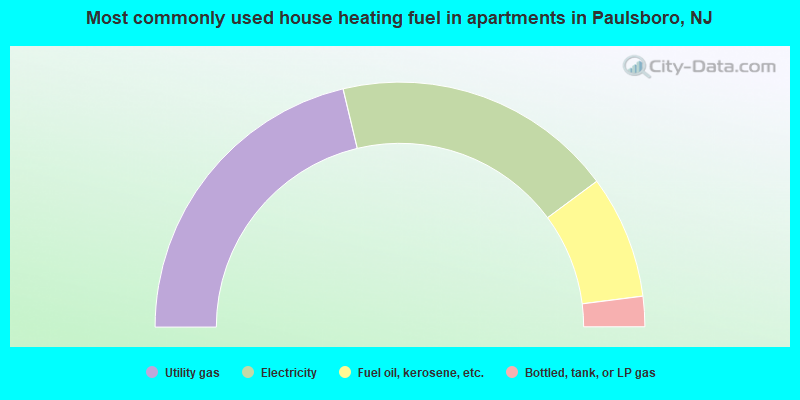
House heating fuel used in apartments - Utility gas (%)
House heating fuel used in apartments - Bottled, tank, or LP gas (%)
House heating fuel used in apartments - Electricity (%)
House heating fuel used in apartments - Fuel oil, kerosene, etc. (%)
House heating fuel used in apartments - Coal or coke (%)
House heating fuel used in apartments - Wood (%)
House heating fuel used in apartments - Solar energy (%)
House heating fuel used in apartments - Other fuel (%)
House heating fuel used in apartments - No fuel used (%)
Armed forces status - In Armed Forces (%)
Armed forces status - Civilian (%)
Armed forces status - Civilian - Veteran (%)
Armed forces status - Civilian - Nonveteran (%)
Fatal accidents locations in years 2005-2021
Fatal accidents locations in 2005
Fatal accidents locations in 2006
Fatal accidents locations in 2007
Fatal accidents locations in 2008
Fatal accidents locations in 2009
Fatal accidents locations in 2010
Fatal accidents locations in 2011
Fatal accidents locations in 2012
Fatal accidents locations in 2013
Fatal accidents locations in 2014
Fatal accidents locations in 2015
Fatal accidents locations in 2016
Fatal accidents locations in 2017
Fatal accidents locations in 2018
Fatal accidents locations in 2019
Fatal accidents locations in 2020
Fatal accidents locations in 2021
Alcohol use - People drinking some alcohol every month (%)
Alcohol use - People not drinking at all (%)
Alcohol use - Average days/month drinking alcohol
Alcohol use - Average drinks/week
Alcohol use - Average days/year people drink much
Audiometry - Average condition of hearing (%)
Audiometry - People that can hear a whisper from across a quiet room (%)
Audiometry - People that can hear normal voice from across a quiet room (%)
Audiometry - Ears ringing, roaring, buzzing (%)
Audiometry - Had a job exposure to loud noise (%)
Audiometry - Had off-work exposure to loud noise (%)
Blood Pressure & Cholesterol - Has high blood pressure (%)
Blood Pressure & Cholesterol - Checking blood pressure at home (%)
Blood Pressure & Cholesterol - Frequently checking blood cholesterol (%)
Blood Pressure & Cholesterol - Has high cholesterol level (%)
Consumer Behavior - Money monthly spent on food at supermarket/grocery store
Consumer Behavior - Money monthly spent on food at other stores
Consumer Behavior - Money monthly spent on eating out
Consumer Behavior - Money monthly spent on carryout/delivered foods
Consumer Behavior - Income spent on food at supermarket/grocery store (%)
Consumer Behavior - Income spent on food at other stores (%)
Consumer Behavior - Income spent on eating out (%)
Consumer Behavior - Income spent on carryout/delivered foods (%)
Current Health Status - General health condition (%)
Current Health Status - Blood donors (%)
Current Health Status - Has blood ever tested for HIV virus (%)
Current Health Status - Left-handed people (%)
Dermatology - People using sunscreen (%)
Diabetes - Diabetics (%)
Diabetes - Had a blood test for high blood sugar (%)
Diabetes - People taking insulin (%)
Diet Behavior & Nutrition - Diet health (%)
Diet Behavior & Nutrition - Milk product consumption (# of products/month)
Diet Behavior & Nutrition - Meals not home prepared (#/week)
Diet Behavior & Nutrition - Meals from fast food or pizza place (#/week)
Diet Behavior & Nutrition - Ready-to-eat foods (#/month)
Diet Behavior & Nutrition - Frozen meals/pizza (#/month)
Drug Use - People that ever used marijuana or hashish (%)
Drug Use - Ever used hard drugs (%)
Drug Use - Ever used any form of cocaine (%)
Drug Use - Ever used heroin (%)
Drug Use - Ever used methamphetamine (%)
Health Insurance - People covered by health insurance (%)
Kidney Conditions-Urology - Avg. # of times urinating at night
Medical Conditions - People with asthma (%)
Medical Conditions - People with anemia (%)
Medical Conditions - People with psoriasis (%)
Medical Conditions - People with overweight (%)
Medical Conditions - Elderly people having difficulties in thinking or remembering (%)
Medical Conditions - People who ever received blood transfusion (%)
Medical Conditions - People having trouble seeing even with glass/contacts (%)
Medical Conditions - People with arthritis (%)
Medical Conditions - People with gout (%)
Medical Conditions - People with congestive heart failure (%)
Medical Conditions - People with coronary heart disease (%)
Medical Conditions - People with angina pectoris (%)
Medical Conditions - People who ever had heart attack (%)
Medical Conditions - People who ever had stroke (%)
Medical Conditions - People with emphysema (%)
Medical Conditions - People with thyroid problem (%)
Medical Conditions - People with chronic bronchitis (%)
Medical Conditions - People with any liver condition (%)
Medical Conditions - People who ever had cancer or malignancy (%)
Mental Health - People who have little interest in doing things (%)
Mental Health - People feeling down, depressed, or hopeless (%)
Mental Health - People who have trouble sleeping or sleeping too much (%)
Mental Health - People feeling tired or having little energy (%)
Mental Health - People with poor appetite or overeating (%)
Mental Health - People feeling bad about themself (%)
Mental Health - People who have trouble concentrating on things (%)
Mental Health - People moving or speaking slowly or too fast (%)
Mental Health - People having thoughts they would be better off dead (%)
Oral Health - Average years since last visit a dentist
Oral Health - People embarrassed because of mouth (%)
Oral Health - People with gum disease (%)
Oral Health - General health of teeth and gums (%)
Oral Health - Average days a week using dental floss/device
Oral Health - Average days a week using mouthwash for dental problem
Oral Health - Average number of teeth
Pesticide Use - Households using pesticides to control insects (%)
Pesticide Use - Households using pesticides to kill weeds (%)
Physical Activity - People doing vigorous-intensity work activities (%)
Physical Activity - People doing moderate-intensity work activities (%)
Physical Activity - People walking or bicycling (%)
Physical Activity - People doing vigorous-intensity recreational activities (%)
Physical Activity - People doing moderate-intensity recreational activities (%)
Physical Activity - Average hours a day doing sedentary activities
Physical Activity - Average hours a day watching TV or videos
Physical Activity - Average hours a day using computer
Physical Functioning - People having limitations keeping them from working (%)
Physical Functioning - People limited in amount of work they can do (%)
Physical Functioning - People that need special equipment to walk (%)
Physical Functioning - People experiencing confusion/memory problems (%)
Physical Functioning - People requiring special healthcare equipment (%)
Prescription Medications - Average number of prescription medicines taking
Preventive Aspirin Use - Adults 40+ taking low-dose aspirin (%)
Reproductive Health - Vaginal deliveries (%)
Reproductive Health - Cesarean deliveries (%)
Reproductive Health - Deliveries resulted in a live birth (%)
Reproductive Health - Pregnancies resulted in a delivery (%)
Reproductive Health - Women breastfeeding newborns (%)
Reproductive Health - Women that had a hysterectomy (%)
Reproductive Health - Women that had both ovaries removed (%)
Reproductive Health - Women that have ever taken birth control pills (%)
Reproductive Health - Women taking birth control pills (%)
Reproductive Health - Women that have ever used Depo-Provera or injectables (%)
Reproductive Health - Women that have ever used female hormones (%)
Sexual Behavior - People 18+ that ever had sex (vaginal, anal, or oral) (%)
Sexual Behavior - Males 18+ that ever had vaginal sex with a woman (%)
Sexual Behavior - Males 18+ that ever performed oral sex on a woman (%)
Sexual Behavior - Males 18+ that ever had anal sex with a woman (%)
Sexual Behavior - Males 18+ that ever had any sex with a man (%)
Sexual Behavior - Females 18+ that ever had vaginal sex with a man (%)
Sexual Behavior - Females 18+ that ever performed oral sex on a man (%)
Sexual Behavior - Females 18+ that ever had anal sex with a man (%)
Sexual Behavior - Females 18+ that ever had any kind of sex with a woman (%)
Sexual Behavior - Average age people first had sex
Sexual Behavior - Average number of female sex partners in lifetime (males 18+)
Sexual Behavior - Average number of female vaginal sex partners in lifetime (males 18+)
Sexual Behavior - Average age people first performed oral sex on a woman (18+)
Sexual Behavior - Average number of woman performed oral sex on in lifetime (18+)
Sexual Behavior - Average number of male sex partners in lifetime (males 18+)
Sexual Behavior - Average number of male anal sex partners in lifetime (males 18+)
Sexual Behavior - Average age people first performed oral sex on a man (18+)
Sexual Behavior - Average number of male oral sex partners in lifetime (18+)
Sexual Behavior - People using protection when performing oral sex (%)
Sexual Behavior - Average number of times people have vaginal or anal sex a year
Sexual Behavior - People having sex without condom (%)
Sexual Behavior - Average number of male sex partners in lifetime (females 18+)
Sexual Behavior - Average number of male vaginal sex partners in lifetime (females 18+)
Sexual Behavior - Average number of female sex partners in lifetime (females 18+)
Sexual Behavior - Circumcised males 18+ (%)
Sleep Disorders - Average hours sleeping at night
Sleep Disorders - People that has trouble sleeping (%)
Smoking-Cigarette Use - People smoking cigarettes (%)
Taste & Smell - People 40+ having problems with smell (%)
Taste & Smell - People 40+ having problems with taste (%)
Taste & Smell - People 40+ that ever had wisdom teeth removed (%)
Taste & Smell - People 40+ that ever had tonsils teeth removed (%)
Taste & Smell - People 40+ that ever had a loss of consciousness because of a head injury (%)
Taste & Smell - People 40+ that ever had a broken nose or other serious injury to face or skull (%)
Taste & Smell - People 40+ that ever had two or more sinus infections (%)
Weight - Average height (inches)
Weight - Average weight (pounds)
Weight - Average BMI
Weight - People that are obese (%)
Weight - People that ever were obese (%)
Weight - People trying to lose weight (%)
Officers per 1,000 residents here:
3.45New Jersey average:
5.53
Latest news from Paulsboro, NJ collected exclusively by city-data.com from local newspapers, TV, and radio stations
Ancestries: Italian (8.8%), Irish (5.8%), English (4.1%), German (3.2%), Jordanian (2.3%), American (1.7%).
Current Local Time:
Land area: 1.96 square miles.
Population density: 3,186 people per square mile (average).
363 residents are foreign born (3.5% Asia , 2.0% Latin America ).
This borough:
5.8%New Jersey:
23.2%
Median real estate property taxes paid for housing units with mortgages in 2022: $5,632 (3.0%)Median real estate property taxes paid for housing units with no mortgage in 2022: $5,079 (3.1%)
Nearest city with pop. 50,000+: Camden, NJ
Nearest city with pop. 200,000+: Philadelphia, PA
Nearest cities:
Latitude: 39.84 N, Longitude: 75.24 W
Unemployment in December 2023:
Most common occupations in Paulsboro, NJ (%)
Both Males Females
Material recording, scheduling, dispatching, and distributing workers (7.1%)
Other production occupations, including supervisors (6.9%)
Laborers and material movers, hand (6.2%)
Building and grounds cleaning and maintenance occupations (4.9%)
Other office and administrative support workers, including supervisors (4.2%)
Other management occupations, except farmers and farm managers (3.6%)
Metal workers and plastic workers (3.4%)
Other production occupations, including supervisors (11.7%)
Building and grounds cleaning and maintenance occupations (8.5%)
Material recording, scheduling, dispatching, and distributing workers (7.9%)
Laborers and material movers, hand (6.8%)
Metal workers and plastic workers (6.4%)
Electrical equipment mechanics and other installation, maintenance, and repair workers, including supervisors (5.3%)
Construction traders workers except carpenters, electricians, painters, plumbers, and construction laborers (4.8%)
Cashiers (6.6%)
Material recording, scheduling, dispatching, and distributing workers (6.2%)
Other office and administrative support workers, including supervisors (5.8%)
Laborers and material movers, hand (5.6%)
Nursing, psychiatric, and home health aides (5.1%)
Secretaries and administrative assistants (4.6%)
Other sales and related occupations, including supervisors (4.5%)
Tornado activity:
Paulsboro-area historical tornado activity is slightly above New Jersey state average. It is 3% smaller than the overall U.S. average.
On 3/22/1955, a category F3 (max. wind speeds 158-206 mph) tornado 19.1 miles away from the Paulsboro borough center killed one person and caused between $50,000 and $500,000 in damages.
On 4/28/1961, a category F3 tornado 20.9 miles away from the borough center caused between $5000 and $50,000 in damages.
Earthquake activity:
Paulsboro-area historical earthquake activity is significantly above New Jersey state average. It is 65% smaller than the overall U.S. average. On 8/23/2011 at 17:51:04, a magnitude 5.8 (5.8 MW, Depth: 3.7 mi, Class: Moderate, Intensity: VI - VII) earthquake occurred 197.0 miles away from Paulsboro center On 1/16/1994 at 01:49:16, a magnitude 4.6 (4.6 MB, 4.6 LG, Depth: 3.1 mi, Class: Light, Intensity: IV - V) earthquake occurred 54.2 miles away from Paulsboro center On 1/16/1994 at 00:42:43, a magnitude 4.2 (4.2 MB, 4.0 LG, Depth: 3.1 mi) earthquake occurred 52.9 miles away from Paulsboro center On 11/30/2017 at 21:47:31, a magnitude 4.1 (4.1 MW, Depth: 6.1 mi) earthquake occurred 45.3 miles away from Paulsboro center On 10/7/1983 at 10:18:46, a magnitude 5.3 (5.1 MB, 5.3 LG, 5.1 ML) earthquake occurred 288.5 miles away from the city center On 9/25/1998 at 19:52:52, a magnitude 5.2 (4.8 MB, 4.3 MS, 5.2 LG, 4.5 MW, Depth: 3.1 mi) earthquake occurred 293.6 miles away from the city center Magnitude types: regional Lg-wave magnitude (LG), body-wave magnitude (MB), local magnitude (ML), surface-wave magnitude (MS), moment magnitude (MW) Natural disasters: The number of natural disasters in Gloucester County (24) is greater than the US average (15).Major Disasters (Presidential) Declared: 15Emergencies Declared: 9Hurricanes: 6, Floods: 5, Storms: 5, Snowstorms: 3, Blizzards: 2, Heavy Rains: 2, Water Shortages: 2, Tornado: 1, Tropical Storm: 1, Wind: 1, Winter Storm: 1, Other: 3 (Note: some incidents may be assigned to more than one category). Hospitals and medical centers near Paulsboro: SHADY LANE GLOUCESTER CO HOME (Nursing Home, about 3 miles away; CLARKSBORO, NJ)
MANORCARE HEALTH SERVICES (Nursing Home, about 4 miles away; WEST DEPTFORD, NJ)
HEARTLAND HOSPICE SERVICES (Hospital, about 4 miles away; THOROFARE, NJ)
PROSPECT PARK HEALTH AND REHAB (Nursing Home, about 5 miles away; PROSPECT PARK, PA)
PROSPECT PARK NSG HOME (Nursing Home, about 5 miles away; PROSPECT PARK, PA)
INSPIRA MEDICAL CENTER WOODBURY (about 5 miles away; WOODBURY, NJ)
UNDERWOOD HOSPITAL TCU (Nursing Home, about 5 miles away; WOODBURY, NJ)
Amtrak stations near Paulsboro: 9 miles: PHILADELPHIA (30TH & MARKET STS.) Services: ticket office, fully wheelchair accessible, enclosed waiting area, public restrooms, public payphones, snack bar, ATM, paid short-term parking, paid long-term parking, car rental agency, taxi stand, public transit connection.
13 miles: NORTH PHILADELPHIA (PHILADELPHIA, 2900 N. BROAD ST.) Services: ticket office, fully wheelchair accessible, enclosed waiting area, public restrooms, public payphones, paid short-term parking, paid long-term parking, call for taxi service, public transit connection.
13 miles: ARDMORE (STATION RD. & LANCASTER AVE.) Services: enclosed waiting area, public restrooms, public payphones, paid short-term parking, call for car rental service, call for taxi service, public transit connection.
Colleges/universities with over 2000 students nearest to Paulsboro:
Widener University-Main Campus (about 7 miles; Chester, PA ; Full-time enrollment: 4,051)
Gloucester County College (about 8 miles; Sewell, NJ ; FT enrollment: 5,490)
University of the Sciences (about 8 miles; Philadelphia, PA ; FT enrollment: 2,464)
University of Pennsylvania (about 9 miles; Philadelphia, PA ; FT enrollment: 25,693)
The University of the Arts (about 9 miles; Philadelphia, PA ; FT enrollment: 2,198)
Drexel University (about 9 miles; Philadelphia, PA ; FT enrollment: 22,969)
The Art Institute of Philadelphia (about 9 miles; Philadelphia, PA ; FT enrollment: 2,432)
Public high school in Paulsboro:
Public elementary/middle schools in Paulsboro:
See full list of schools located in Paulsboro Library in Paulsboro: GILL MEMORIAL LIBRARY Operating income: $195,770; Location: 145 E. BROAD STREET; 24,823 books ; 339 audio materials ; 302 video materials ; 3 local licensed databases ; 22 state licensed databases ; 53 print serial subscriptions )
Birthplace of: Edwin H. Simmons - Military historian and Marine Corps general, Larry Sharpe - Professional wrestler, Isaac F. Hughes - Los Angeles City Council member, Joan Weber - Female singer, Russell Carter - College basketball player (Notre Dame Fighting Irish), Valvin Roane - Singer.
Gloucester County has a predicted average indoor radon screening level between 2 and 4 pCi/L (pico curies per liter) - Moderate Potential Drinking water stations with addresses in Paulsboro and their reported violations in the past:
PAULSBORO WATER DEPARTMENT (Population served: 6,200, Groundwater):
Past health violations:
MCL, Average - Between APR-2014 and JUN-2014, Contaminant: Combined Radium (-226 and -228). Follow-up actions: St Formal NOV issued (MAY-27-2014), St Public Notif requested (MAY-27-2014)
MCL, Average - Between JUL-2013 and SEP-2013, Contaminant: Combined Radium (-226 and -228). Follow-up actions: St Public Notif requested (SEP-18-2013), St Formal NOV issued (SEP-18-2013), St Public Notif received (NOV-01-2013)
MCL, Monthly (TCR) - In DEC-2012, Contaminant: Coliform. Follow-up actions: St Public Notif requested (DEC-18-2012), St Formal NOV issued (DEC-18-2012), St Public Notif received (FEB-01-2013)
MCL, Monthly (TCR) - In AUG-2011, Contaminant: Coliform. Follow-up actions: St Public Notif requested (AUG-31-2011), St Formal NOV issued (AUG-31-2011), St Compliance achieved (SEP-13-2011), St Public Notif received (OCT-13-2011)
MCL, Monthly (TCR) - In APR-2011, Contaminant: Coliform. Follow-up actions: St Public Notif requested (JUN-14-2011), St Formal NOV issued (JUN-14-2011), St Public Notif received (2 times from JUL-18-2011 to SEP-13-2011)
Past monitoring violations:
24 regular monitoring violations
Average household size: This borough:
2.7 peopleNew Jersey:
2.7 people
Percentage of family households: This borough:
69.6%Whole state:
69.3%
Percentage of households with unmarried partners: This borough:
9.1%Whole state:
5.9%
Likely homosexual households (counted as self-reported same-sex unmarried-partner households)
Lesbian couples: 0.3% of all households Gay men: 0.1% of all households
6 people in group homes intended for adults in 2010people in other noninstitutional facilities in 2010people in nursing homes in 2000people in religious group quarters in 2000
Banks with branches in Paulsboro (2011 data):
Fulton Bank of New Jersey: Paulsboro Branch at 653 W. Broad Street, branch established on 1993/06/26. Info updated 2012/02/08: Bank assets: $3,408.9 mil, Deposits: $2,816.1 mil, headquarters in Mount Laurel, NJ, negative income in the last year , Commercial Lending Specialization, 74 total offices , Holding Company: Fulton Financial Corporation
Bank of America, National Association: West Deptford Township Branch at 871 Mantua Avenue, branch established on 1969/12/08. Info updated 2009/11/18: Bank assets: $1,451,969.3 mil, Deposits: $1,077,176.8 mil, headquarters in Charlotte, NC, positive income , 5782 total offices , Holding Company: Bank Of America Corporation
Wells Fargo Bank, National Association: Paulsboro at 117 E Broad St, branch established on 1961/01/03. Info updated 2011/04/05: Bank assets: $1,161,490.0 mil, Deposits: $905,653.0 mil, headquarters in Sioux Falls, SD, positive income , 6395 total offices , Holding Company: Wells Fargo & Company
For population 15 years and over in Paulsboro:
Never married: 34.5%Now married: 39.8%Separated: 5.7%Widowed: 7.2%Divorced: 12.8% For population 25 years and over in Paulsboro:
High school or higher: 87.9%Bachelor's degree or higher: 16.2%Graduate or professional degree: 3.3%Unemployed: 11.1%Mean travel time to work (commute): 20.1 minutes
Education Gini index (Inequality in education) Here:
8.0New Jersey average:
12.8
Religion statistics for Paulsboro, NJ (based on Gloucester County data)
Religion Adherents Congregations Catholic 75,218 21 Evangelical Protestant 30,715 83 Mainline Protestant 18,855 84 Black Protestant 12,099 16 Other 2,511 12 None 148,890 -
Source: Clifford Grammich, Kirk Hadaway, Richard Houseal, Dale E.Jones, Alexei Krindatch, Richie Stanley and Richard H.Taylor. 2012. 2010 U.S.Religion Census: Religious Congregations & Membership Study. Association of Statisticians of American Religious Bodies. Jones, Dale E., et al. 2002. Congregations and Membership in the United States 2000. Nashville, TN: Glenmary Research Center. Graphs represent county-level data
Food Environment Statistics: Number of grocery stores : 53Gloucester County :
1.86 / 10,000 pop.New Jersey :
2.90 / 10,000 pop.
Number of supercenters and club stores : 3Gloucester County :
0.11 / 10,000 pop.New Jersey :
0.06 / 10,000 pop.
Number of convenience stores (no gas) : 72Here :
2.52 / 10,000 pop.New Jersey :
1.76 / 10,000 pop.
Number of convenience stores (with gas) : 27This county :
0.95 / 10,000 pop.State :
0.81 / 10,000 pop.
Number of full-service restaurants : 131Gloucester County :
4.59 / 10,000 pop.State :
7.15 / 10,000 pop.
Adult diabetes rate : This county :
9.8%New Jersey :
8.3%
Adult obesity rate : This county :
24.9%New Jersey :
23.3%
Low-income preschool obesity rate : Gloucester County :
14.9%New Jersey :
18.0%
Health and Nutrition: Healthy diet rate : Paulsboro:
49.0%State:
50.6%
Average overall health of teeth and gums : This city:
46.5%New Jersey:
48.5%
People feeling badly about themselves : This city:
21.1%State:
20.0%
People not drinking alcohol at all : Paulsboro:
11.4%New Jersey:
11.1%
Average hours sleeping at night : Paulsboro:
6.8New Jersey:
6.8
Overweight people : Paulsboro:
36.0%State:
33.6%
General health condition : This city:
55.5%New Jersey:
56.9%
Average condition of hearing : Paulsboro:
79.9%New Jersey:
80.0%
More about Health and Nutrition of Paulsboro, NJ Residents
Local government employment and payroll (March 2022)
Function
Full-time employees
Monthly full-time payroll
Average yearly full-time wage
Part-time employees
Monthly part-time payroll
Police Protection - Officers
18 $142,692 $95,128 0 $0 Other and Unallocable
8 $35,564 $53,346 20 $23,676 Streets and Highways
7 $42,373 $72,639 0 $0 Sewerage
4 $21,538 $64,614 0 $0 Judicial and Legal
2 $6,825 $40,950 4 $7,456 Financial Administration
2 $14,397 $86,382 3 $3,648 Other Government Administration
1 $5,335 $64,020 13 $29,086 Local Libraries
0 $0 3 $9,846
Totals for Government
42 $268,724 $76,778 43 $73,712
Paulsboro government finances - Expenditure in 2017 (per resident):
Construction - Water Utilities: $2,605,000 ($416.87)
Regular Highways: $180,000 ($28.80)Libraries: $11,000 ($1.76)Current Operations - General - Other: $2,627,000 ($420.39)
Police Protection: $1,950,000 ($312.05)Regular Highways: $633,000 ($101.30)Water Utilities: $616,000 ($98.58)Solid Waste Management: $527,000 ($84.33)Sewerage: $385,000 ($61.61)Central Staff Services: $365,000 ($58.41)Judicial and Legal Services: $236,000 ($37.77)Financial Administration: $235,000 ($37.61)Protective Inspection and Regulation - Other: $182,000 ($29.12)Libraries: $159,000 ($25.44)Parks and Recreation: $41,000 ($6.56)Local Fire Protection: $41,000 ($6.56)General Public Buildings: $21,000 ($3.36)Health - Other: $17,000 ($2.72)General - Interest on Debt: $156,000 ($24.96)
Intergovernmental to Local - Other - Sewerage: $368,000 ($58.89)
Other Capital Outlay - General - Other: $588,000 ($94.10)
Solid Waste Management: $45,000 ($7.20)Total Salaries and Wages: $2,986,000 ($477.84)
Water Utilities - Interest on Debt: $27,000 ($4.32)
Paulsboro government finances - Revenue in 2017 (per resident):
Charges - Sewerage: $804,000 ($128.66)
Other: $3,000 ($0.48)Miscellaneous - General Revenue - Other: $553,000 ($88.49)
Interest Earnings: $124,000 ($19.84)Fines and Forfeits: $100,000 ($16.00)Rents: $86,000 ($13.76)Donations From Private Sources: $7,000 ($1.12)Revenue - Water Utilities: $726,000 ($116.18)
State Intergovernmental - General Local Government Support: $540,000 ($86.41)
Highways: $175,000 ($28.00)Other: $55,000 ($8.80)Health and Hospitals: $11,000 ($1.76)Tax - Property: $6,909,000 ($1105.62)
Other License: $180,000 ($28.80)Public Utilities Sales: $19,000 ($3.04)Alcoholic Beverage License: $8,000 ($1.28)
Paulsboro government finances - Debt in 2017 (per resident):
Long Term Debt - Beginning Outstanding - Unspecified Public Purpose: $3,400,000 ($544.09)
Outstanding Unspecified Public Purpose: $3,229,000 ($516.72)Retired Unspecified Public Purpose: $171,000 ($27.36)
Paulsboro government finances - Cash and Securities in 2017 (per resident):
Bond Funds - Cash and Securities: $3,033,000 ($485.36)
Other Funds - Cash and Securities: $3,991,000 ($638.66)
6.21% of this county's 2020 resident taxpayers moved to other counties in 2021 ($73,670 average adjusted gross income )
Here:
6.21%New Jersey average:
7.02%
0.02% of residents moved to foreign countries ($171 average AGI )Gloucester County:
0.02%New Jersey average:
0.02%
Top counties to which taxpayers relocated from this county between 2020 and 2021:
Businesses in Paulsboro, NJ
Name Count Name Count
CVS 1 Rite Aid 1 Dunkin Donuts 1 Taco Bell 1 FedEx 1 True Value 1 KFC 1 UPS 4 McDonald's 1
Strongest AM radio stations in Paulsboro:
WVCH (740 AM; 50 kW; CHESTER, PA; Owner: WVCH COMMUNICATIONS, INC.)
WPEN (950 AM; 50 kW; PHILADELPHIA, PA; Owner: GREATER PHILADELPHIA RADIO, INC.)
WNWR (1540 AM; 50 kW; PHILADELPHIA, PA)
WZZD (990 AM; 50 kW; PHILADELPHIA, PA; Owner: PENNSYLVANIA MEDIA ASSOCIATES, INC.)
WIP (610 AM; 5 kW; PHILADELPHIA, PA; Owner: INFINITY BROADCASTING CORPORATION OF PHILADELPHIA)
WPHT (1210 AM; 50 kW; PHILADELPHIA, PA; Owner: INFINITY BROADCASTING OPERATIONS, INC.)
KYW (1060 AM; 50 kW; PHILADELPHIA, PA; Owner: INFINITY BROADCASTING OPERATIONS, INC.)
WTMR (800 AM; 5 kW; CAMDEN, NJ; Owner: WTMR LICENSE LIMITED PARTNERSHIP)
WWJZ (640 AM; 50 kW; MOUNT HOLLY, NJ; Owner: ABC, INC.)
WURD (900 AM; 1 kW; PHILADELPHIA, PA; Owner: LEVAS COMMUNICATIONS, LLC)
WDAS (1480 AM; 5 kW; PHILADELPHIA, PA; Owner: AMFM RADIO LICENSES, L.L.C.)
WFIL (560 AM; 5 kW; PHILADELPHIA, PA; Owner: PENNSYLVANIA MEDIA ASSOCIATES, INC.)
WWDB (860 AM; daytime; 10 kW; PHILADELPHIA, PA)
Strongest FM radio stations in Paulsboro:
WMMR (93.3 FM; PHILADELPHIA, PA; Owner: GREATER BOSTON RADIO, INC.)
WPLY (100.3 FM; MEDIA, PA; Owner: RADIO ONE LICENSES, LLC)
WMGK (102.9 FM; PHILADELPHIA, PA; Owner: GREATER PHILADELPHIA RADIO, INC.)
WMWX (95.7 FM; PHILADELPHIA, PA; Owner: GREATER PHILADELPHIA RADIO, INC.)
WOGL (98.1 FM; PHILADELPHIA, PA; Owner: INFINITY BROADCASTING OPERATIONS, INC.)
WBEB (101.1 FM; PHILADELPHIA, PA; Owner: WEAZ-FM RADIO, INC.)
WRTI (90.1 FM; PHILADELPHIA, PA; Owner: TEMPLE UNIV. OF THE COMMONWEALTH, ET)
WSNI-FM (104.5 FM; PHILADELPHIA, PA; Owner: AMFM RADIO LICENSES, L.L.C.)
WPHI-FM (103.9 FM; JENKINTOWN, PA; Owner: RADIO ONE LICENSES, LLC)
WKDN (106.9 FM; CAMDEN, NJ; Owner: FAMILY STATIONS, INC.)
WXTU (92.5 FM; PHILADELPHIA, PA; Owner: WXTU LICENSE LIMITED PARTNERSHIP)
WHYY-FM (90.9 FM; PHILADELPHIA, PA; Owner: WHYY, INC.)
WXPN (88.5 FM; PHILADELPHIA, PA; Owner: TRUSTEES OF THE UNIVERSITY OF PENNA.)
WPTP (96.5 FM; PHILADELPHIA, PA; Owner: WDAS LICENSE LIMITED PARTNERSHIP)
WDAS-FM (105.3 FM; PHILADELPHIA, PA; Owner: AMFM RADIO LICENSES, L.L.C.)
WUSL (98.9 FM; PHILADELPHIA, PA; Owner: AMFM RADIO LICENSES, L.L.C.)
WYSP (94.1 FM; PHILADELPHIA, PA; Owner: INFINITY BROADCASTING OPERATIONS, INC.)
WGLS-FM (89.7 FM; GLASSBORO, NJ; Owner: ROWAN UNIVERSITY)
WIOQ (102.1 FM; PHILADELPHIA, PA; Owner: AMFM RADIO LICENSES, L.L.C.)
WJJZ (106.1 FM; PHILADELPHIA, PA; Owner: AMFM RADIO LICENSES, L.L.C.)
TV broadcast stations around Paulsboro:
WWJT-LP (Channel 7; PHILADELPHIA, PA; Owner: PHILADELPHIA TELEVISION NETWORK, INC)
KYW-TV (Channel 3; PHILADELPHIA, PA; Owner: CBS BROADCASTING INC.)
WPSG (Channel 57; PHILADELPHIA, PA; Owner: VIACOM STATIONS GROUP OF PHILADELPHIA INC.)
WPVI-TV (Channel 6; PHILADELPHIA, PA; Owner: ABC, INC.)
WPHL-TV (Channel 17; PHILADELPHIA, PA; Owner: TRIBUNE TELEVISION COMPANY)
WPPX (Channel 61; WILMINGTON, DE; Owner: PAXSON PHILADELPHIA LICENSE, INC.)
WCAU (Channel 10; PHILADELPHIA, PA; Owner: NBC SUBSIDIARY (WCAU-TV), L.P.)
WGTW (Channel 48; BURLINGTON, NJ; Owner: BRUNSON COMMUNICATIONS, INC.)
WYBE (Channel 35; PHILADELPHIA, PA; Owner: INDEPENDENCE PUBLIC MEDIA OF PHILADELPHIA, INC.)
WHYY-TV (Channel 12; WILMINGTON, DE; Owner: WHYY, INC.)
WTXF-TV (Channel 29; PHILADELPHIA, PA; Owner: FOX TV STATIONS OF PHILADELPHIA)
WUVP (Channel 65; VINELAND, NJ; Owner: UNIVISION PHILADELPHIA LLC)
WELL-LP (Channel 8; WILLOW GROVE, ETC., PA; Owner: WORD OF GOD FELLOWSHIP, INC.)
WMCN-TV (Channel 53; ATLANTIC CITY, NJ; Owner: LENFEST BROADCASTING, LLC)
WFPA-CA (Channel 28; PHILADELPHIA, PA; Owner: WXTV LICENSE PARTNERSHIP, G.P.)
WNJS (Channel 23; CAMDEN, NJ; Owner: NEW JERSEY PUBLIC BROADCASTING AUTHORITY)
WPHA-LP (Channel 63; PHILADELPHIA, PA; Owner: COMMERCIAL BROADCASTING CORP.)
WPSJ-LP (Channel 8; HAMMONTON, ETC., NJ; Owner: ENGLE BROADCASTING)
WTSD-CA (Channel 14; WILMINGTON, DE; Owner: PRIORITY COMMUNICATIONS MINISTRIES, INC.)
W40AZ (Channel 40; WILMINGTON, DE; Owner: NATIONAL MINORITY T.V., INC.)
W55BT (Channel 55; TALLEYVILLE, DE; Owner: MEDIACASTING LLC)
W33BT (Channel 33; CAMDEN, NJ; Owner: MEDIACASTING LLC)
WNJT (Channel 52; TRENTON, NJ; Owner: NEW JERSEY PUBLIC BROADCASTING AUTHORITY)
National Bridge Inventory (NBI) Statistics 18 Number of bridges233ft / 70.9m Total length $150,000 Total costs624,093 Total average daily traffic50,693 Total average daily truck traffic
New bridges - historical statistics
2 1930-1939 1 1940-1949 5 1950-1959 6 1990-1999 4 2000-2009
See full National Bridge Inventory statistics for Paulsboro, NJ
Home Mortgage Disclosure Act Aggregated Statistics For Year 2009(Based on 1 full tract) A) FHA, FSA/RHS & VA B) Conventional C) Refinancings D) Home Improvement Loans F) Non-occupant Loans on G) Loans On Manufactured Number Average Value Number Average Value Number Average Value Number Average Value Number Average Value Number Average Value
LOANS ORIGINATED 29 $137,862 10 $88,000 70 $123,757 7 $33,714 9 $83,444 0 $0 APPLICATIONS APPROVED, NOT ACCEPTED 0 $0 0 $0 8 $138,875 1 $20,000 1 $84,000 0 $0 APPLICATIONS DENIED 7 $115,429 6 $70,500 63 $123,635 22 $29,227 13 $83,077 1 $5,000 APPLICATIONS WITHDRAWN 3 $140,333 4 $82,500 27 $137,222 1 $136,000 3 $80,000 0 $0 FILES CLOSED FOR INCOMPLETENESS 10 $145,600 0 $0 6 $126,000 2 $90,000 1 $50,000 0 $0
Aggregated Statistics For Year 2008(Based on 1 full tract) A) FHA, FSA/RHS & VA B) Conventional C) Refinancings D) Home Improvement Loans E) Loans on Dwellings For 5+ Families F) Non-occupant Loans on Number Average Value Number Average Value Number Average Value Number Average Value Number Average Value Number Average Value
LOANS ORIGINATED 38 $134,395 32 $109,000 80 $112,862 19 $36,368 0 $0 36 $92,778 APPLICATIONS APPROVED, NOT ACCEPTED 4 $133,000 3 $95,333 15 $98,733 4 $15,000 0 $0 4 $109,750 APPLICATIONS DENIED 4 $137,000 14 $98,286 82 $119,061 37 $32,000 1 $200,000 15 $80,267 APPLICATIONS WITHDRAWN 7 $126,143 3 $109,333 24 $129,083 4 $45,750 0 $0 1 $50,000 FILES CLOSED FOR INCOMPLETENESS 2 $155,500 0 $0 9 $136,889 0 $0 0 $0 0 $0
Aggregated Statistics For Year 2007(Based on 1 full tract) A) FHA, FSA/RHS & VA B) Conventional C) Refinancings D) Home Improvement Loans F) Non-occupant Loans on G) Loans On Manufactured Number Average Value Number Average Value Number Average Value Number Average Value Number Average Value Number Average Value
LOANS ORIGINATED 12 $136,417 78 $105,218 142 $105,035 49 $55,571 52 $88,154 0 $0 APPLICATIONS APPROVED, NOT ACCEPTED 1 $155,000 7 $110,143 28 $112,536 11 $58,273 14 $101,500 0 $0 APPLICATIONS DENIED 2 $143,000 15 $115,267 125 $117,712 50 $44,500 19 $96,895 2 $37,000 APPLICATIONS WITHDRAWN 2 $158,500 10 $139,200 57 $122,702 6 $93,000 7 $125,143 0 $0 FILES CLOSED FOR INCOMPLETENESS 0 $0 2 $92,500 22 $138,818 1 $100,000 3 $105,333 0 $0
Aggregated Statistics For Year 2006(Based on 1 full tract) A) FHA, FSA/RHS & VA B) Conventional C) Refinancings D) Home Improvement Loans F) Non-occupant Loans on G) Loans On Manufactured Number Average Value Number Average Value Number Average Value Number Average Value Number Average Value Number Average Value
LOANS ORIGINATED 32 $131,625 103 $101,961 181 $104,000 38 $50,184 70 $91,057 1 $45,000 APPLICATIONS APPROVED, NOT ACCEPTED 0 $0 13 $72,385 34 $100,941 6 $12,000 6 $59,333 0 $0 APPLICATIONS DENIED 7 $136,429 40 $95,500 119 $105,538 47 $27,915 31 $84,194 2 $41,500 APPLICATIONS WITHDRAWN 2 $171,500 32 $113,812 91 $103,934 6 $55,000 11 $108,182 0 $0 FILES CLOSED FOR INCOMPLETENESS 1 $163,000 7 $75,857 17 $124,118 1 $50,000 0 $0 0 $0
Aggregated Statistics For Year 2005(Based on 1 full tract) A) FHA, FSA/RHS & VA B) Conventional C) Refinancings D) Home Improvement Loans E) Loans on Dwellings For 5+ Families F) Non-occupant Loans on Number Average Value Number Average Value Number Average Value Number Average Value Number Average Value Number Average Value
LOANS ORIGINATED 17 $125,294 148 $81,101 170 $94,476 38 $47,447 1 $880,000 97 $74,351 APPLICATIONS APPROVED, NOT ACCEPTED 1 $143,000 16 $99,438 33 $99,879 11 $49,273 0 $0 9 $91,556 APPLICATIONS DENIED 6 $106,500 51 $88,510 142 $93,423 36 $34,750 0 $0 27 $88,333 APPLICATIONS WITHDRAWN 1 $126,000 26 $81,192 91 $99,275 7 $161,000 0 $0 22 $73,727 FILES CLOSED FOR INCOMPLETENESS 0 $0 6 $54,500 29 $87,034 4 $104,750 0 $0 7 $47,429
Aggregated Statistics For Year 2004(Based on 1 full tract) A) FHA, FSA/RHS & VA B) Conventional C) Refinancings D) Home Improvement Loans F) Non-occupant Loans on G) Loans On Manufactured Number Average Value Number Average Value Number Average Value Number Average Value Number Average Value Number Average Value
LOANS ORIGINATED 29 $105,862 83 $82,386 142 $81,528 43 $33,488 40 $72,350 0 $0 APPLICATIONS APPROVED, NOT ACCEPTED 8 $21,625 19 $78,158 28 $77,571 5 $21,200 13 $40,385 1 $55,000 APPLICATIONS DENIED 3 $117,667 21 $91,095 128 $80,523 36 $22,417 14 $61,500 1 $15,000 APPLICATIONS WITHDRAWN 3 $90,667 13 $79,385 80 $85,712 9 $48,778 13 $67,615 0 $0 FILES CLOSED FOR INCOMPLETENESS 0 $0 1 $50,000 6 $83,333 0 $0 2 $62,500 0 $0
Aggregated Statistics For Year 2003(Based on 1 full tract) A) FHA, FSA/RHS & VA B) Conventional C) Refinancings D) Home Improvement Loans F) Non-occupant Loans on Number Average Value Number Average Value Number Average Value Number Average Value Number Average Value
LOANS ORIGINATED 31 $89,581 77 $74,338 150 $78,187 21 $22,857 55 $56,273 APPLICATIONS APPROVED, NOT ACCEPTED 2 $106,500 8 $72,500 51 $66,784 5 $14,000 12 $51,250 APPLICATIONS DENIED 4 $101,000 29 $67,655 96 $77,427 35 $18,800 26 $58,808 APPLICATIONS WITHDRAWN 3 $73,667 10 $74,100 78 $73,244 4 $18,750 11 $70,091 FILES CLOSED FOR INCOMPLETENESS 0 $0 0 $0 7 $62,571 0 $0 0 $0
Aggregated Statistics For Year 2002(Based on 1 full tract) A) FHA, FSA/RHS & VA B) Conventional C) Refinancings D) Home Improvement Loans E) Loans on Dwellings For 5+ Families F) Non-occupant Loans on Number Average Value Number Average Value Number Average Value Number Average Value Number Average Value Number Average Value
LOANS ORIGINATED 25 $77,080 46 $78,022 108 $67,389 24 $19,167 3 $1,143,333 30 $66,867 APPLICATIONS APPROVED, NOT ACCEPTED 0 $0 8 $76,625 25 $63,400 7 $34,143 0 $0 5 $85,400 APPLICATIONS DENIED 3 $77,000 8 $75,125 108 $69,241 28 $15,250 0 $0 9 $41,222 APPLICATIONS WITHDRAWN 6 $61,333 5 $77,600 81 $81,235 1 $10,000 0 $0 4 $74,000 FILES CLOSED FOR INCOMPLETENESS 1 $91,000 0 $0 14 $72,643 0 $0 0 $0 0 $0
Aggregated Statistics For Year 2001(Based on 1 full tract) A) FHA, FSA/RHS & VA B) Conventional C) Refinancings D) Home Improvement Loans F) Non-occupant Loans on Number Average Value Number Average Value Number Average Value Number Average Value Number Average Value
LOANS ORIGINATED 35 $74,971 34 $53,412 80 $64,438 25 $27,720 29 $51,483 APPLICATIONS APPROVED, NOT ACCEPTED 0 $0 11 $64,818 37 $66,108 5 $18,800 6 $51,500 APPLICATIONS DENIED 3 $72,667 15 $55,867 84 $56,417 33 $17,606 12 $49,500 APPLICATIONS WITHDRAWN 3 $64,667 7 $71,429 54 $67,204 9 $15,889 3 $27,000 FILES CLOSED FOR INCOMPLETENESS 1 $44,000 1 $80,000 10 $73,000 0 $0 0 $0
Aggregated Statistics For Year 2000(Based on 1 full tract) A) FHA, FSA/RHS & VA B) Conventional C) Refinancings D) Home Improvement Loans E) Loans on Dwellings For 5+ Families F) Non-occupant Loans on Number Average Value Number Average Value Number Average Value Number Average Value Number Average Value Number Average Value
LOANS ORIGINATED 36 $71,222 68 $62,897 55 $58,545 36 $27,028 1 $650,000 42 $55,476 APPLICATIONS APPROVED, NOT ACCEPTED 0 $0 8 $57,875 28 $66,643 23 $24,565 0 $0 4 $33,250 APPLICATIONS DENIED 1 $66,000 16 $55,188 73 $55,397 49 $18,245 0 $0 8 $32,000 APPLICATIONS WITHDRAWN 2 $65,500 5 $52,200 38 $52,026 3 $39,667 0 $0 5 $44,600 FILES CLOSED FOR INCOMPLETENESS 0 $0 6 $119,833 1 $126,000 0 $0 0 $0 0 $0
Aggregated Statistics For Year 1999(Based on 1 partial tract) A) FHA, FSA/RHS & VA B) Conventional C) Refinancings D) Home Improvement Loans F) Non-occupant Loans on Number Average Value Number Average Value Number Average Value Number Average Value Number Average Value
LOANS ORIGINATED 19 $73,588 38 $62,797 77 $56,829 28 $18,238 28 $59,732 APPLICATIONS APPROVED, NOT ACCEPTED 2 $77,835 10 $41,005 27 $59,097 13 $24,752 4 $49,120 APPLICATIONS DENIED 1 $69,290 12 $53,472 77 $57,199 25 $26,654 4 $67,155 APPLICATIONS WITHDRAWN 0 $0 6 $56,162 53 $58,832 3 $33,223 2 $49,360 FILES CLOSED FOR INCOMPLETENESS 0 $0 1 $93,970 12 $67,552 0 $0 1 $69,290
Detailed HMDA statistics for the following Tracts:
5004.00
Private Mortgage Insurance Companies Aggregated Statistics For Year 2009(Based on 1 full tract) B) Refinancings Number Average Value
LOANS ORIGINATED 0 $0 APPLICATIONS APPROVED, NOT ACCEPTED 2 $172,500 APPLICATIONS DENIED 1 $152,000 APPLICATIONS WITHDRAWN 0 $0 FILES CLOSED FOR INCOMPLETENESS 0 $0
Aggregated Statistics For Year 2008(Based on 1 full tract) A) Conventional B) Refinancings C) Non-occupant Loans on Number Average Value Number Average Value Number Average Value
LOANS ORIGINATED 12 $112,167 4 $183,500 7 $95,286 APPLICATIONS APPROVED, NOT ACCEPTED 7 $106,429 5 $156,000 3 $123,667 APPLICATIONS DENIED 3 $110,333 1 $173,000 3 $110,333 APPLICATIONS WITHDRAWN 1 $88,000 0 $0 1 $88,000 FILES CLOSED FOR INCOMPLETENESS 0 $0 0 $0 0 $0
Aggregated Statistics For Year 2007(Based on 1 full tract) A) Conventional B) Refinancings C) Non-occupant Loans on Number Average Value Number Average Value Number Average Value
LOANS ORIGINATED 35 $119,686 14 $144,786 7 $96,143 APPLICATIONS APPROVED, NOT ACCEPTED 4 $139,500 4 $166,250 3 $141,000 APPLICATIONS DENIED 1 $72,000 0 $0 0 $0 APPLICATIONS WITHDRAWN 1 $85,000 0 $0 1 $85,000 FILES CLOSED FOR INCOMPLETENESS 0 $0 1 $172,000 0 $0
Aggregated Statistics For Year 2006(Based on 1 full tract) A) Conventional B) Refinancings C) Non-occupant Loans on Number Average Value Number Average Value Number Average Value
LOANS ORIGINATED 25 $130,840 11 $136,727 11 $100,273 APPLICATIONS APPROVED, NOT ACCEPTED 3 $108,667 4 $131,500 3 $108,667 APPLICATIONS DENIED 0 $0 0 $0 0 $0 APPLICATIONS WITHDRAWN 1 $80,000 1 $162,000 0 $0 FILES CLOSED FOR INCOMPLETENESS 0 $0 0 $0 0 $0
Aggregated Statistics For Year 2005(Based on 1 full tract) A) Conventional B) Refinancings C) Non-occupant Loans on Number Average Value Number Average Value Number Average Value
LOANS ORIGINATED 26 $92,423 10 $135,900 15 $77,400 APPLICATIONS APPROVED, NOT ACCEPTED 1 $139,000 7 $97,714 0 $0 APPLICATIONS DENIED 1 $112,000 0 $0 1 $112,000 APPLICATIONS WITHDRAWN 1 $97,000 1 $107,000 0 $0 FILES CLOSED FOR INCOMPLETENESS 1 $80,000 4 $103,250 0 $0
Aggregated Statistics For Year 2004(Based on 1 full tract) A) Conventional B) Refinancings C) Non-occupant Loans on Number Average Value Number Average Value Number Average Value
LOANS ORIGINATED 34 $82,794 12 $100,167 13 $66,923 APPLICATIONS APPROVED, NOT ACCEPTED 6 $69,000 3 $127,000 1 $66,000 APPLICATIONS DENIED 0 $0 0 $0 0 $0 APPLICATIONS WITHDRAWN 1 $50,000 1 $88,000 2 $69,000 FILES CLOSED FOR INCOMPLETENESS 0 $0 0 $0 0 $0
Aggregated Statistics For Year 2003(Based on 1 full tract) A) Conventional B) Refinancings C) Non-occupant Loans on Number Average Value Number Average Value Number Average Value
LOANS ORIGINATED 33 $67,939 16 $100,750 16 $62,500 APPLICATIONS APPROVED, NOT ACCEPTED 7 $56,143 9 $91,111 6 $63,167 APPLICATIONS DENIED 2 $63,000 0 $0 0 $0 APPLICATIONS WITHDRAWN 1 $57,000 2 $109,000 0 $0 FILES CLOSED FOR INCOMPLETENESS 0 $0 0 $0 0 $0
Aggregated Statistics For Year 2002(Based on 1 full tract) A) Conventional B) Refinancings C) Non-occupant Loans on Number Average Value Number Average Value Number Average Value
LOANS ORIGINATED 22 $86,182 13 $83,615 8 $78,375 APPLICATIONS APPROVED, NOT ACCEPTED 2 $79,000 5 $88,400 1 $80,000 APPLICATIONS DENIED 3 $62,333 4 $96,000 1 $31,000 APPLICATIONS WITHDRAWN 3 $66,667 2 $93,000 1 $31,000 FILES CLOSED FOR INCOMPLETENESS 0 $0 0 $0 0 $0
Aggregated Statistics For Year 2001(Based on 1 full tract) A) Conventional B) Refinancings C) Non-occupant Loans on Number Average Value Number Average Value Number Average Value
LOANS ORIGINATED 7 $54,714 6 $78,500 4 $50,750 APPLICATIONS APPROVED, NOT ACCEPTED 2 $76,500 3 $80,000 1 $131,000 APPLICATIONS DENIED 0 $0 2 $81,000 0 $0 APPLICATIONS WITHDRAWN 0 $0 0 $0 0 $0 FILES CLOSED FOR INCOMPLETENESS 0 $0 0 $0 0 $0
Aggregated Statistics For Year 2000(Based on 1 full tract) A) Conventional B) Refinancings C) Non-occupant Loans on Number Average Value Number Average Value Number Average Value
LOANS ORIGINATED 27 $63,741 2 $80,000 14 $53,786 APPLICATIONS APPROVED, NOT ACCEPTED 4 $49,750 0 $0 3 $38,333 APPLICATIONS DENIED 1 $131,000 0 $0 1 $131,000 APPLICATIONS WITHDRAWN 1 $38,000 0 $0 1 $38,000 FILES CLOSED FOR INCOMPLETENESS 0 $0 0 $0 0 $0
Aggregated Statistics For Year 1999(Based on 1 partial tract) A) Conventional B) Refinancings C) Non-occupant Loans on Number Average Value Number Average Value Number Average Value
LOANS ORIGINATED 9 $73,404 7 $73,631 5 $69,102 APPLICATIONS APPROVED, NOT ACCEPTED 0 $0 0 $0 0 $0 APPLICATIONS DENIED 1 $51,260 0 $0 1 $51,260 APPLICATIONS WITHDRAWN 0 $0 0 $0 0 $0 FILES CLOSED FOR INCOMPLETENESS 0 $0 0 $0 0 $0
Detailed PMIC statistics for the following Tracts:
5004.00
Paulsboro compared to New Jersey state average:
Median household income below state average. Median house value significantly below state average. Black race population percentage significantly above state average. Median age below state average. Foreign-born population percentage significantly below state average. Length of stay since moving in significantly above state average. House age above state average. Number of college students significantly below state average. Percentage of population with a bachelor's degree or higher below state average.
#28 on the list of "Top 101 cities with largest percentage of females in industries: wholesale trade (population 5,000+)"
#34 on the list of "Top 101 cities with the most residents born in Africa, n.e.c. (population 500+)"
#35 on the list of "Top 101 cities with largest percentage of males in occupations: sales and related occupations (population 5,000+)"
#35 on the list of "Top 101 cities with the largest positive percentage difference between never married females and males (15+ years) (with at least 1,000 females never married)"
#65 on the list of "Top 101 cities with the most people below the poverty level, excluding cities with 15% or more of residents in college and with the median age below 28 (population 5,000+)"
#68 on the list of "Top 101 cities with largest percentage of females in occupations: sales and related occupations (population 5,000+)"
#91 on the list of "Top 101 cities with largest percentage of females in occupations: installation, maintenance, and repair occupations (population 5,000+)"
#92 on the list of "Top 101 cities with largest percentage of females in industries: retail trade (population 5,000+)"
#92 on the list of "Top 101 cities with largest percentage of females in industries: transportation and warehousing (population 5,000+)"
#61 (08066) on the list of "Top 101 zip codes with the smallest percentage of taxpayers reporting profit/loss from business in 2012 (pop 5,000+)"
#75 (08066) on the list of "Top 101 zip codes with the lowest 2012 average net capital gain/loss (pop 5,000+)"
#1 on the list of "Top 101 counties with the lowest number of infant deaths per 1000 residents 2007-2013 (pop. 50,000+)"
#1 on the list of "Top 101 counties with the largest decrease in the number of infant deaths per 1000 residents 2000-2006 to 2007-2013 (pop. 50,000+)"
#47 on the list of "Top 101 counties with the lowest percentage of residents that keep firearms around their homes"
#82 on the list of "Top 101 counties with the most Black Protestant adherents"
#94 on the list of "Top 101 counties with the highest average weight of females"
Top Patent Applicants
Seneca S. Cooper (2)
Hongzhi Zhang (1)
James Mcnulty (1)
Judith Campi (1)
Frederick A. Suter (1)
Total of 6 patent applications in 2008-2024.
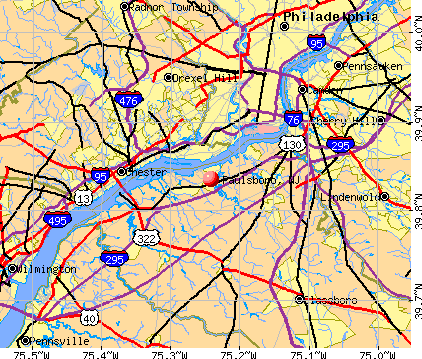


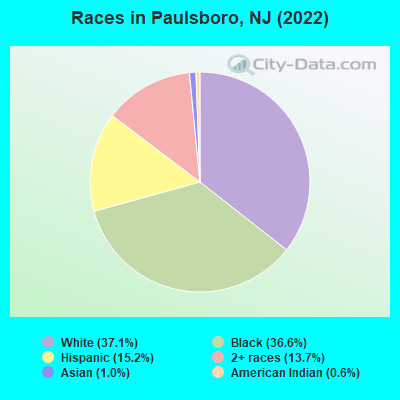
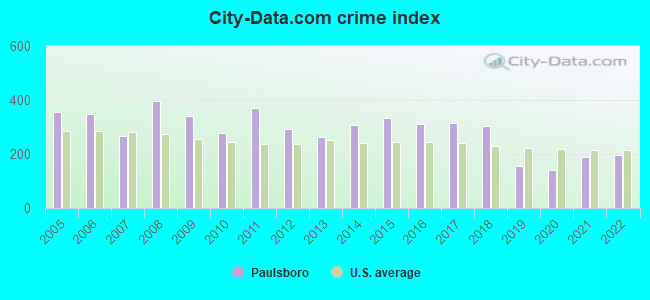
 Recent articles from our blog. Our writers, many of them Ph.D. graduates or candidates, create easy-to-read articles on a wide variety of topics.

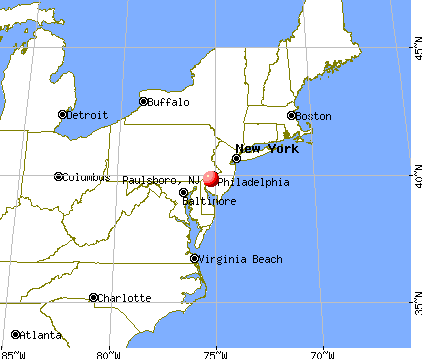
 (10.1 miles
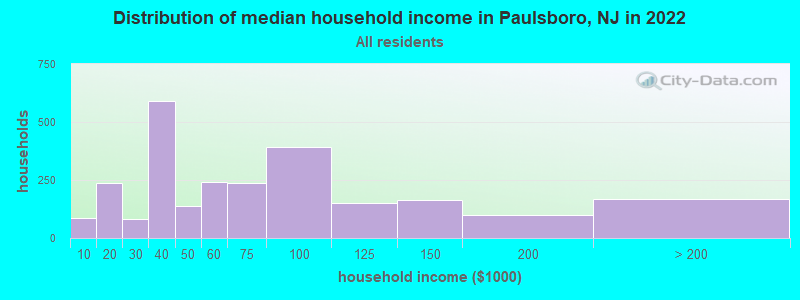
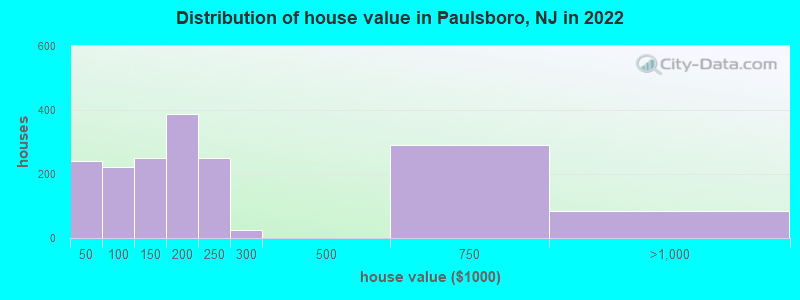
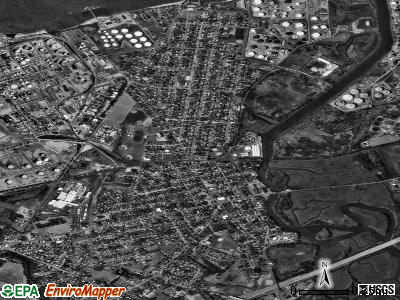
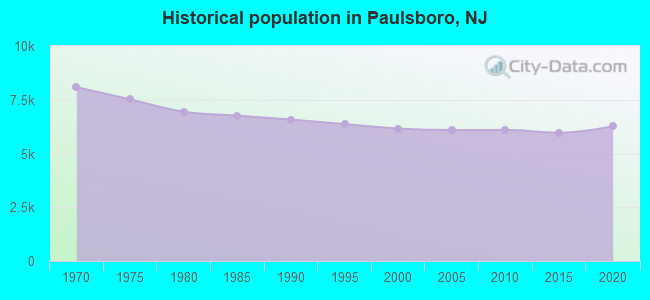
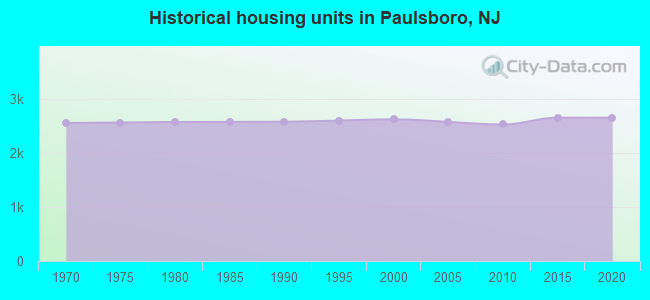
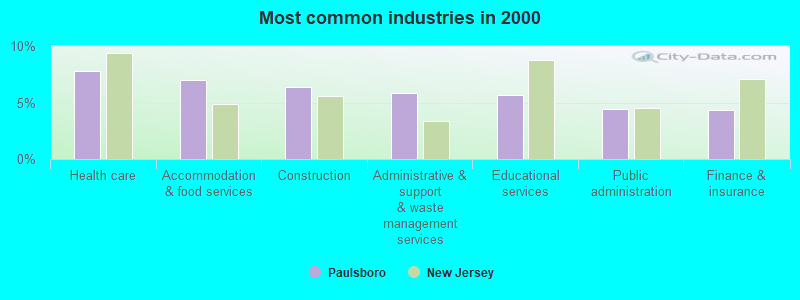
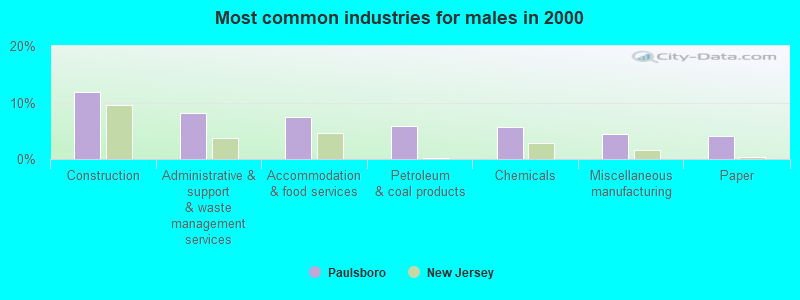
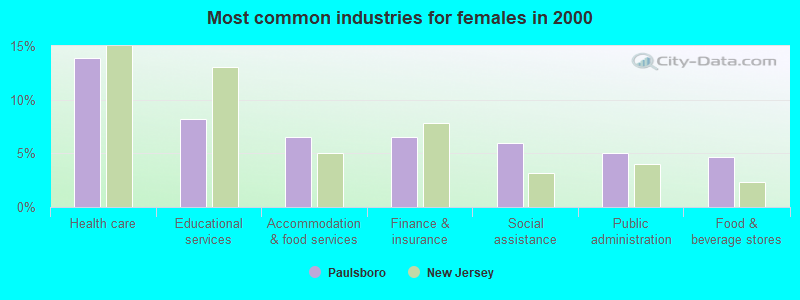
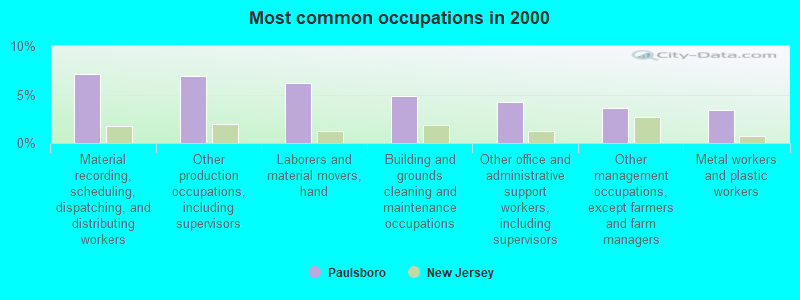
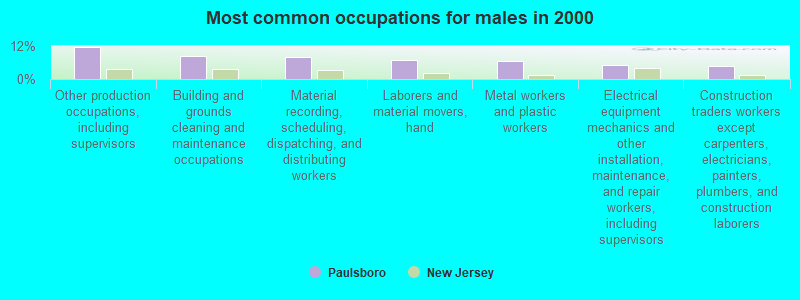
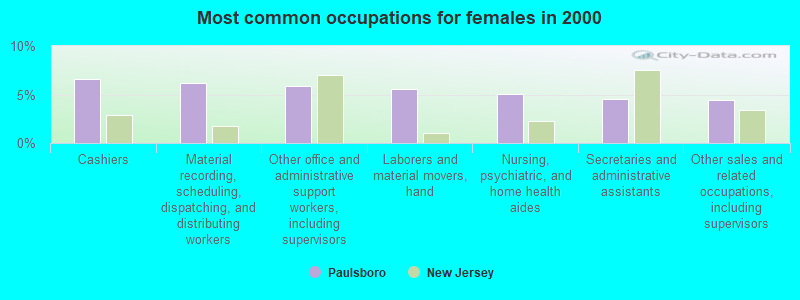
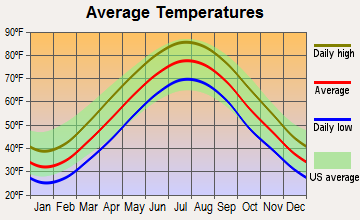
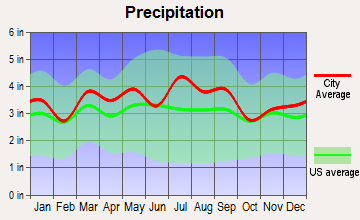
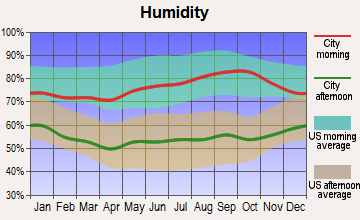
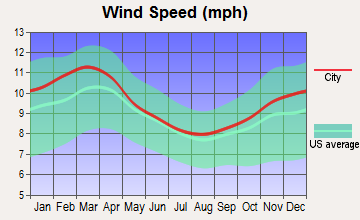
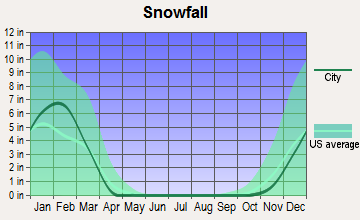
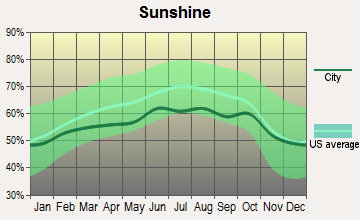
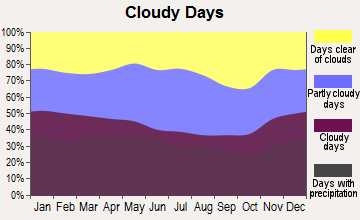
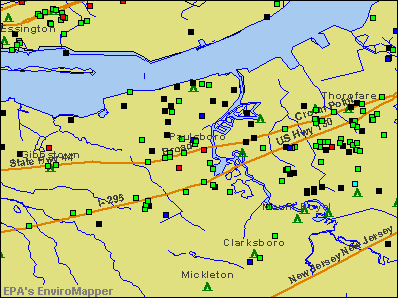

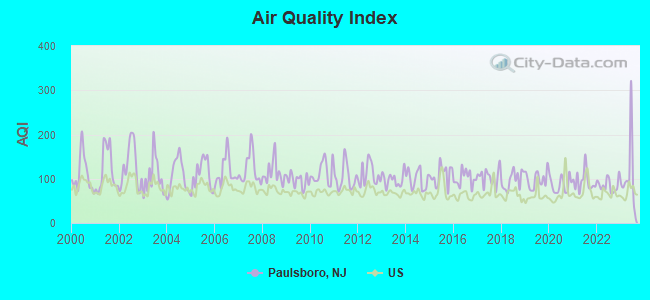
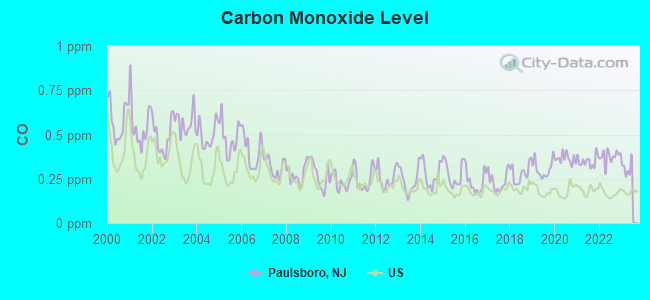
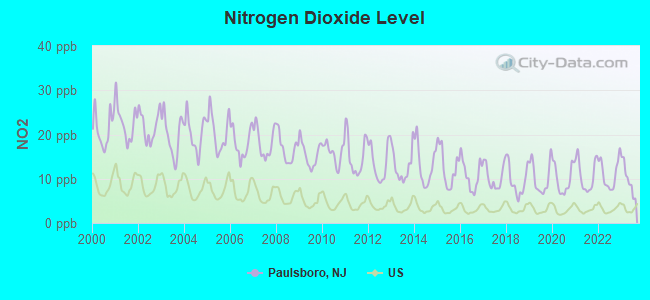
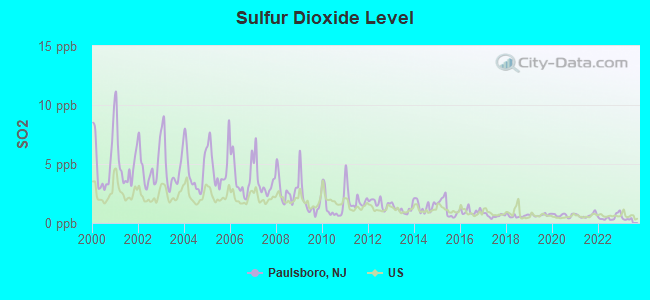
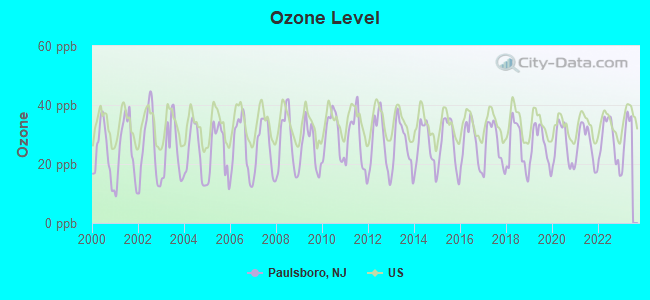
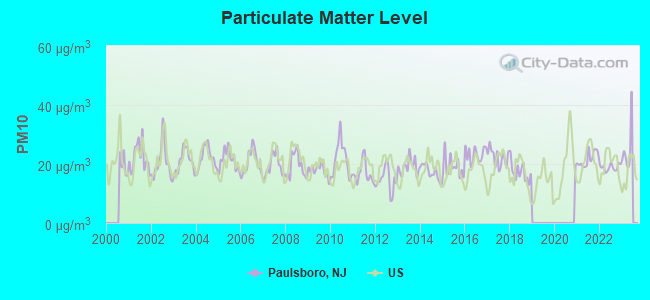
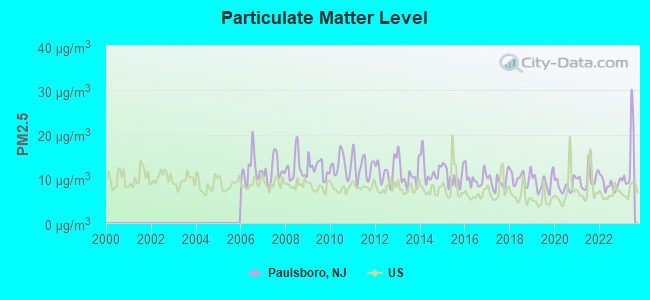
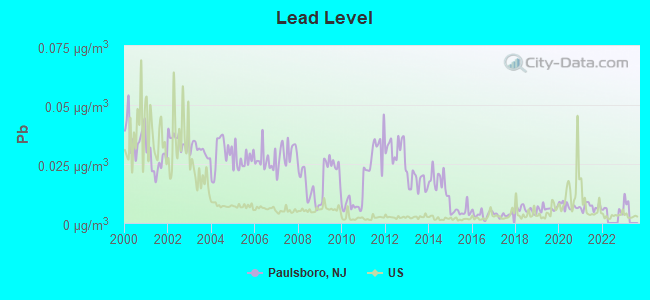
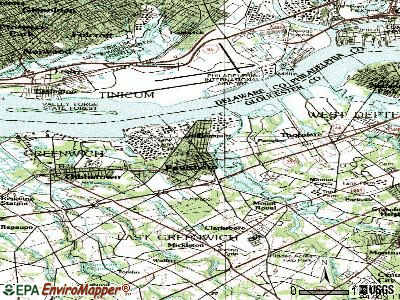
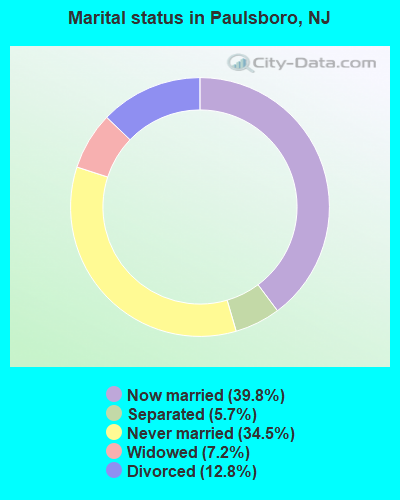
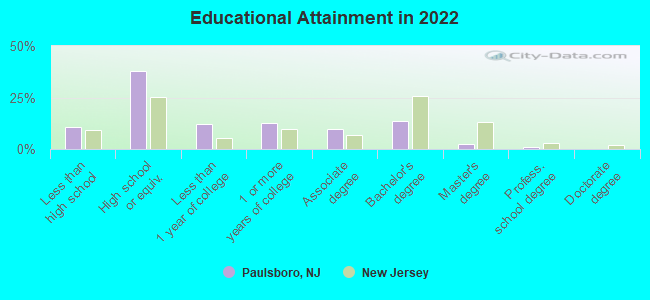
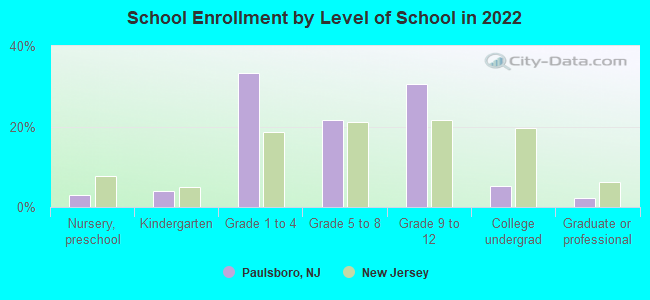
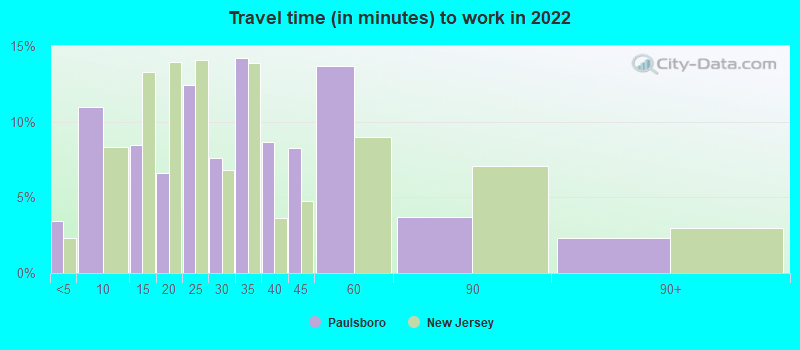
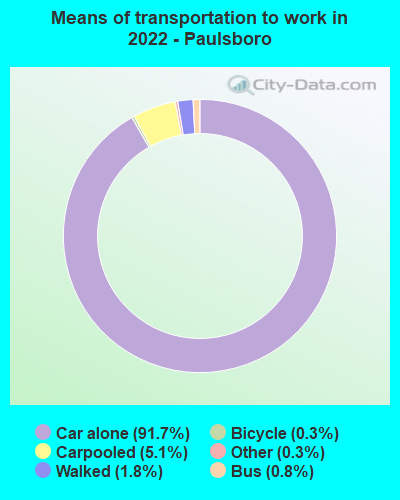
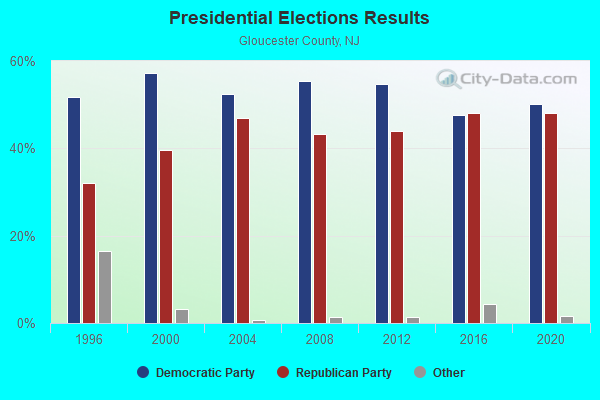
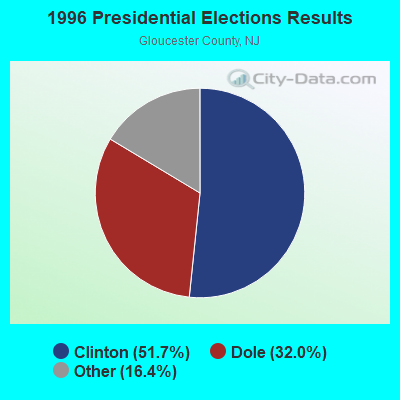
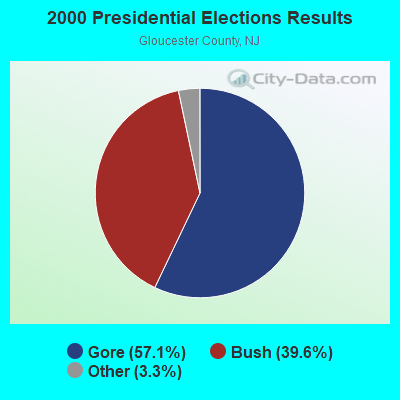
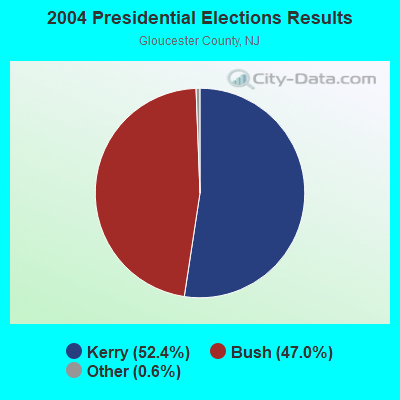


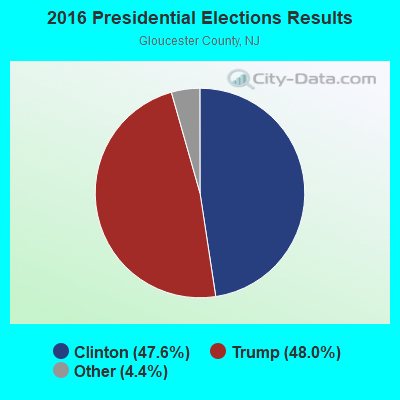
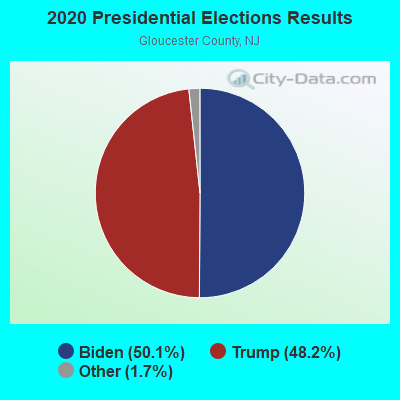
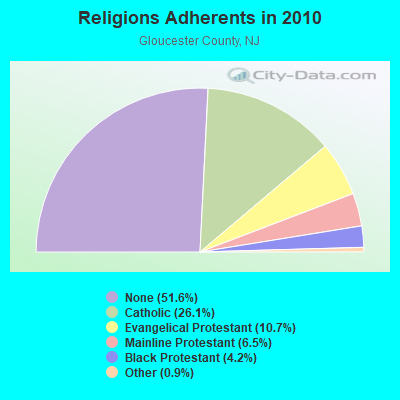
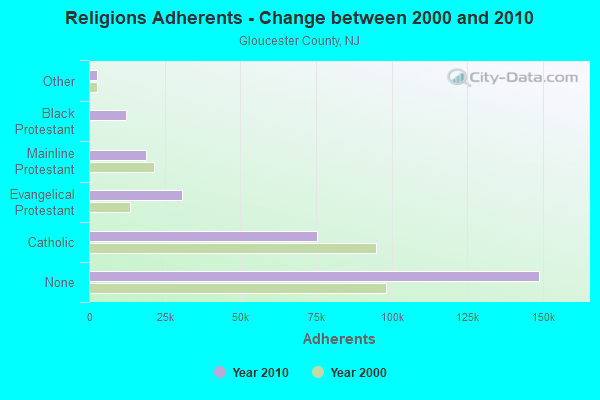
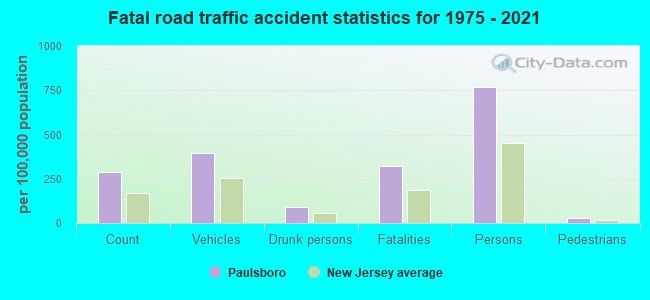
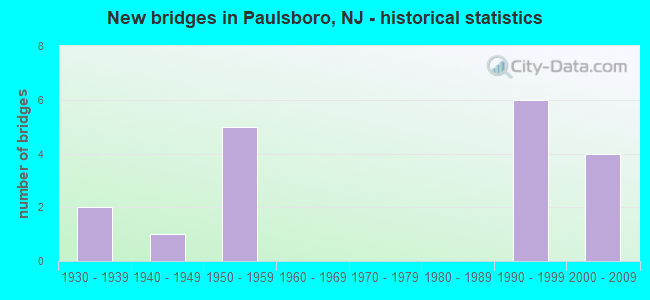
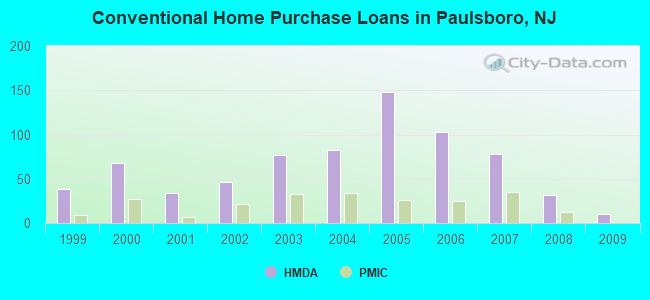
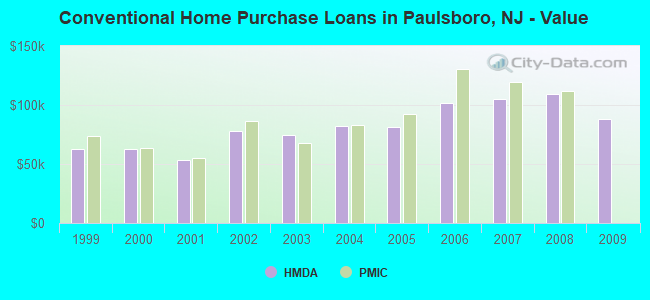
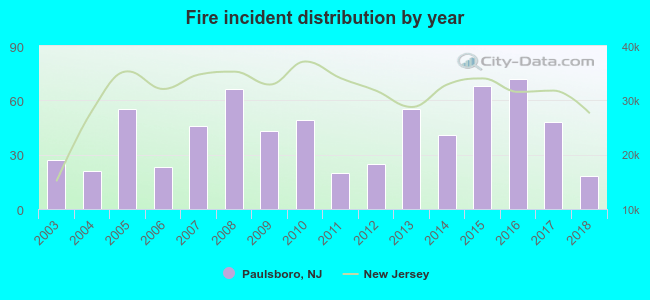 According to the data from the years 2003 - 2018 the average number of fire incidents per year is 42. The highest number of reported fire incidents - 72 took place in 2016, and the least - 18 in 2018. The data has a dropping trend.
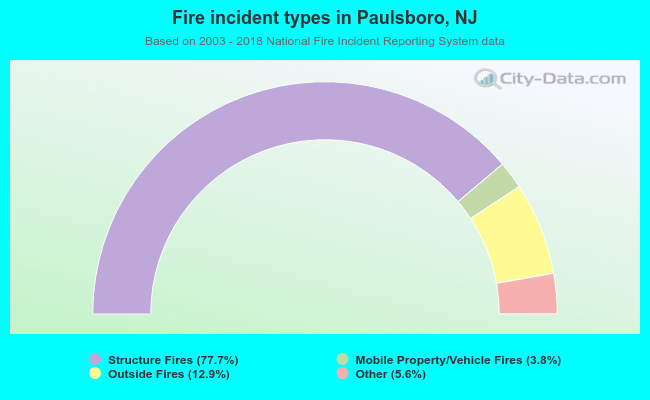 When looking into fire subcategories, the most reports belonged to: Structure Fires (77.7%), and Outside Fires (12.9%).