Crime rate in Philadelphia, Pennsylvania (PA): murders, rapes, robberies, assaults, burglaries, thefts, auto thefts, arson, law enforcement employees, police officers, crime map
Crime rate in Philadelphia, PA
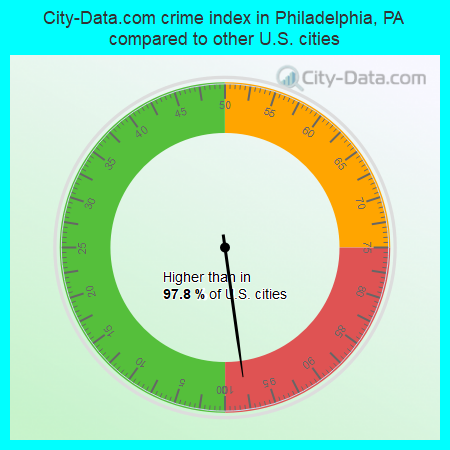
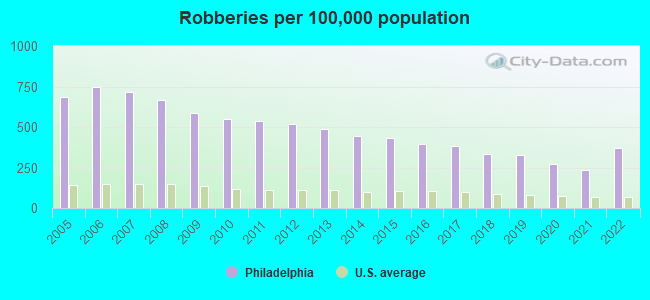
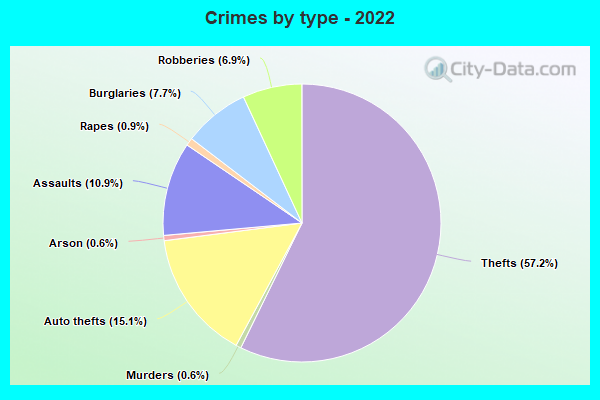
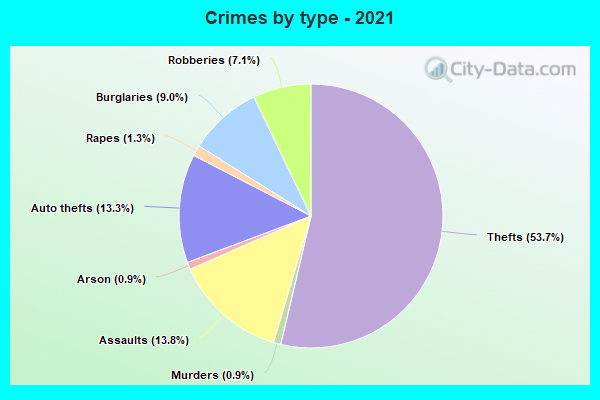
The 2022 crime rate in Philadelphia, PA is 553 (City-Data.com crime index), which is 2.2 times higher than the U.S. average. It was higher than in 97.8% U.S. cities. The 2022 Philadelphia crime rate rose by 45% compared to 2021. The number of homicides stood at 514 - an increase of 58 compared to 2021. In the last 5 years Philadelphia has seen rise of violent crime and increasing property crime.(Note: Higher means more crime)
| Philadelphia: | 553.0 |
| Camden: | 609.6 |
| Pennsauken: | 246.5 |
| Merchantville: | 51.1 |
| Woodlynne: | 198.8 |
| Narberth: | 86.8 |
| Millbourne: | 50.2 |
| Palmyra: | 173.6 |
| Rockledge: | 155.0 |

The City-Data.com crime index weighs serious crimes and violent crimes more heavily. Higher means more crime, U.S. average is 246.1. It adjusts for the number of visitors and daily workers commuting into cities.
- means the value is smaller than the state average.- means the value is about the same as the state average.
- means the value is bigger than the state average.
- means the value is much bigger than the state average.
According to our research of Pennsylvania and other state lists, there were 3,323 registered sex offenders living in Philadelphia, Pennsylvania as of April 26, 2024.
The ratio of all residents to sex offenders in Philadelphia is 472 to 1.
The ratio of registered sex offenders to all residents in this city is near the state average.
Violent crime rate in 2022
| Philadelphia: | 595.5 |
| U.S. Average: | 219.8 |
Violent crime rate in 2021
| Philadelphia: | 448.3 |
| U.S. Average: | 224.8 |
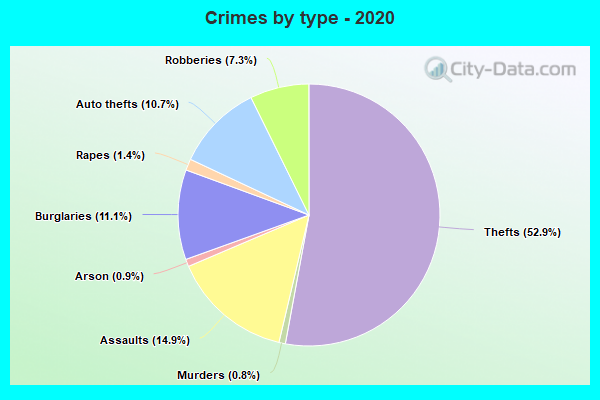
Violent crime rate in 2020
| Philadelphia: | 516.7 |
| U.S. Average: | 228.2 |
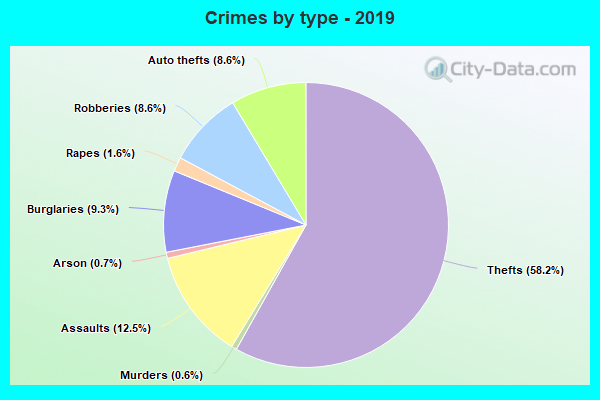
Violent crime rate in 2019
| Philadelphia: | 498.9 |
| U.S. Average: | 219.9 |
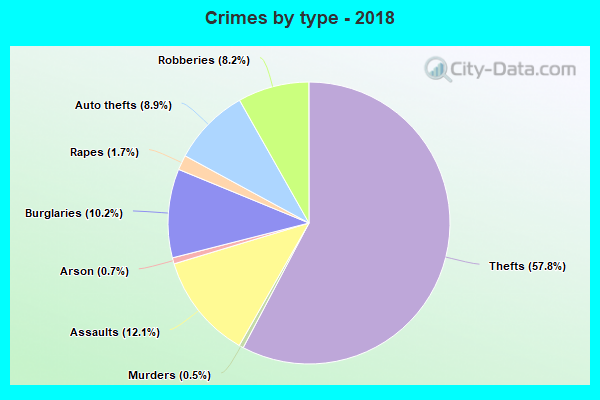
Violent crime rate in 2018
| Philadelphia: | 522.0 |
| U.S. Average: | 221.2 |
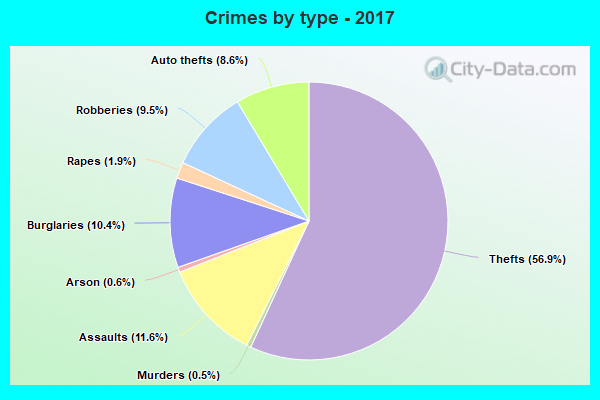
Violent crime rate in 2017
| Philadelphia: | 541.4 |
| U.S. Average: | 226.2 |
Violent crime rate in 2016
| Philadelphia: | 555.9 |
| U.S. Average: | 227.3 |
Violent crime rate in 2015
| Philadelphia: | 583.5 |
| U.S. Average: | 219.3 |
Violent crime rate in 2014
| Philadelphia: | 573.3 |
| U.S. Average: | 211.1 |
Violent crime rate in 2013
| Philadelphia: | 614.7 |
| U.S. Average: | 214.2 |
Violent crime rate in 2012
| Philadelphia: | 640.9 |
| U.S. Average: | 187.4 |
Violent crime rate in 2011
| Philadelphia: | 655.6 |
| U.S. Average: | 187.1 |
Violent crime rate in 2010
| Philadelphia: | 668.3 |
| U.S. Average: | 195.7 |
Violent crime rate in 2009
| Philadelphia: | 677.3 |
| U.S. Average: | 208.9 |
Violent crime rate in 2008
| Philadelphia: | 791.1 |
| U.S. Average: | 222.5 |
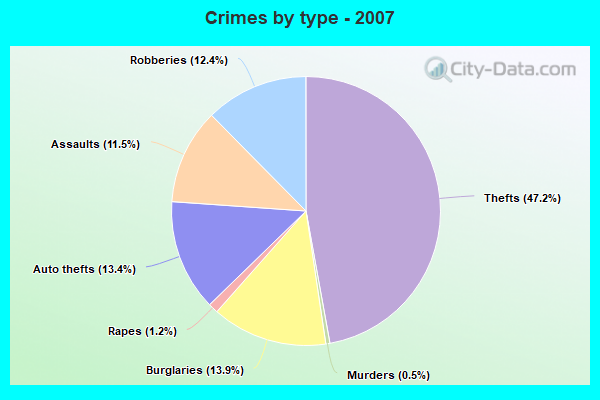
Violent crime rate in 2007
| Philadelphia: | 707.7 |
| U.S. Average: | 229.1 |
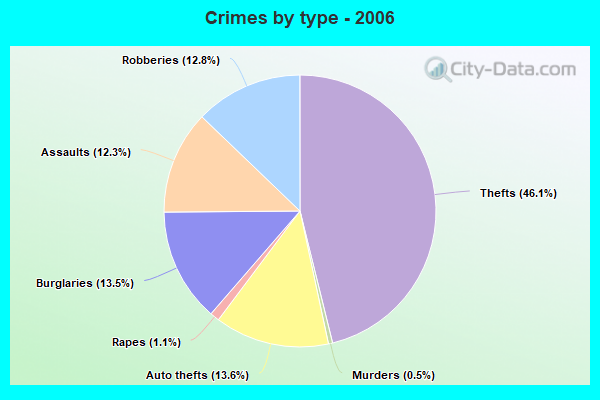
Violent crime rate in 2006
| Philadelphia: | 745.8 |
| U.S. Average: | 232.6 |
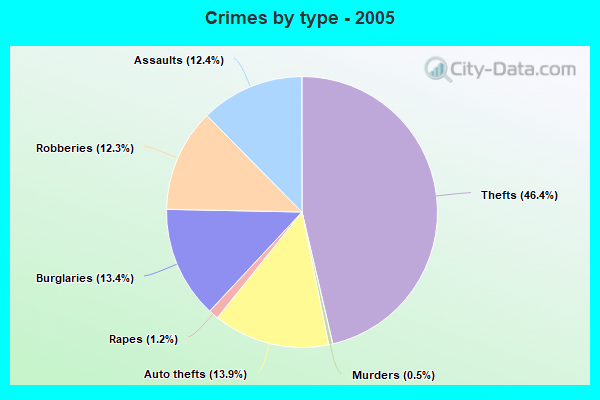
Violent crime rate in 2005
| Philadelphia: | 703.1 |
| U.S. Average: | 227.0 |
Property crime rate in 2022
| Philadelphia: | 360.1 |
| U.S. Average: | 166.5 |
Property crime rate in 2021
| Philadelphia: | 215.4 |
| U.S. Average: | 157.8 |
Property crime rate in 2020
| Philadelphia: | 237.5 |
| U.S. Average: | 169.6 |
Property crime rate in 2019
| Philadelphia: | 227.7 |
| U.S. Average: | 179.7 |
Property crime rate in 2018
| Philadelphia: | 252.0 |
| U.S. Average: | 190.2 |
Property crime rate in 2017
| Philadelphia: | 250.7 |
| U.S. Average: | 206.4 |
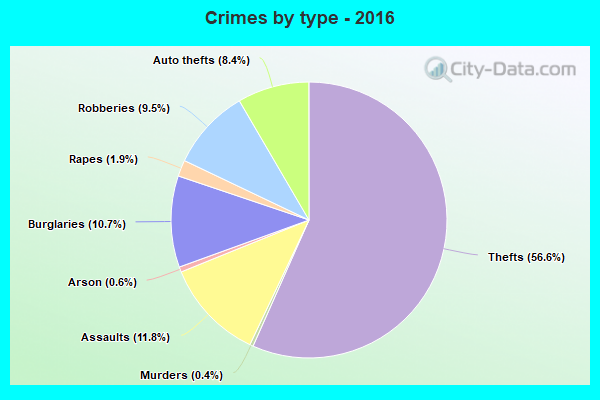
Property crime rate in 2016
| Philadelphia: | 258.7 |
| U.S. Average: | 216.6 |
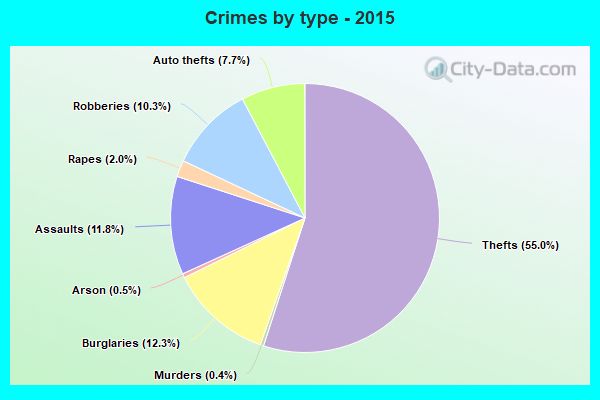
Property crime rate in 2015
| Philadelphia: | 267.1 |
| U.S. Average: | 221.5 |
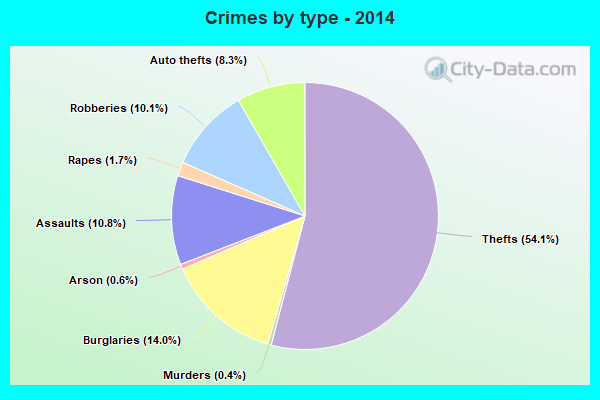
Property crime rate in 2014
| Philadelphia: | 299.4 |
| U.S. Average: | 230.8 |
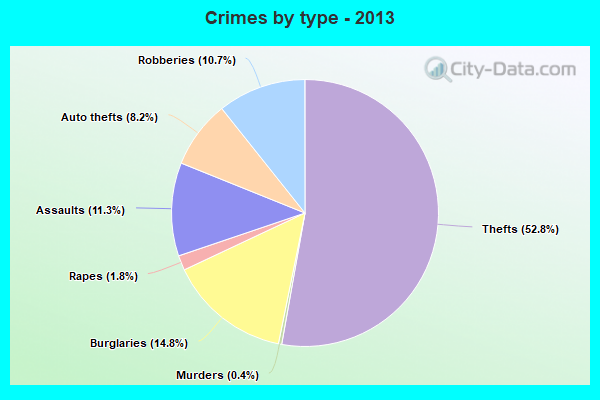
Property crime rate in 2013
| Philadelphia: | 309.9 |
| U.S. Average: | 250.4 |
Property crime rate in 2012
| Philadelphia: | 343.8 |
| U.S. Average: | 267.3 |
Property crime rate in 2011
| Philadelphia: | 361.5 |
| U.S. Average: | 273.5 |
Property crime rate in 2010
| Philadelphia: | 341.8 |
| U.S. Average: | 276.4 |
Property crime rate in 2009
| Philadelphia: | 332.0 |
| U.S. Average: | 285.6 |
Property crime rate in 2008
| Philadelphia: | 413.6 |
| U.S. Average: | 302.2 |
Property crime rate in 2007
| Philadelphia: | 360.0 |
| U.S. Average: | 309.2 |
Property crime rate in 2006
| Philadelphia: | 358.7 |
| U.S. Average: | 317.3 |
Property crime rate in 2005
| Philadelphia: | 343.6 |
| U.S. Average: | 322.3 |
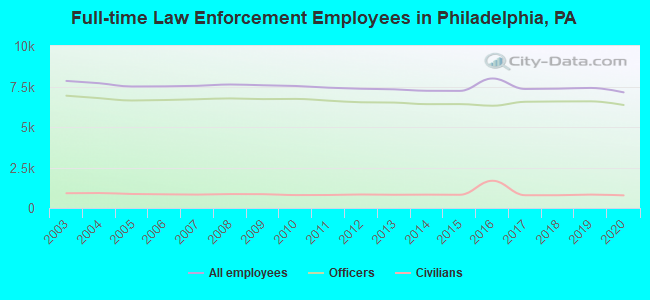
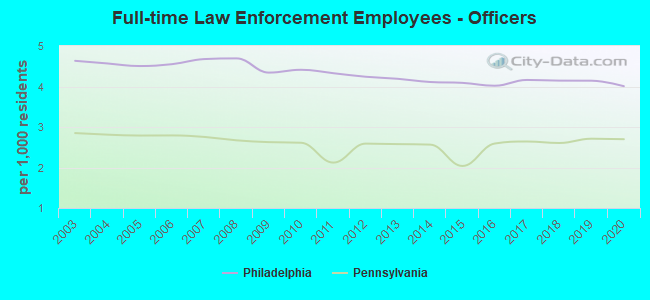
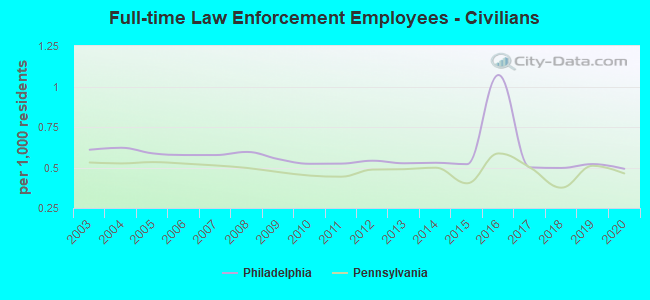
Full-time law enforcement employees in 2020, including police officers: 7,140 (6,359 officers - 4,987 male; 1,372 female).
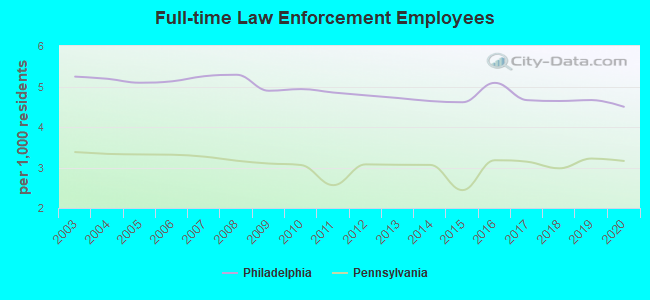
| Officers per 1,000 residents here: | 4.01 |
| Pennsylvania average: | 2.70 |
Full-time law enforcement employees in 2019, including police officers: 7,412 (6,584 officers - 5,165 male; 1,419 female).
| Officers per 1,000 residents here: | 4.14 |
| Pennsylvania average: | 2.71 |
Full-time law enforcement employees in 2018, including police officers: 7,366 (6,577 officers - 5,157 male; 1,420 female).
| Officers per 1,000 residents here: | 4.14 |
| Pennsylvania average: | 2.60 |
Full-time law enforcement employees in 2017, including police officers: 7,347 (6,558 officers - 5,144 male; 1,414 female).
| Officers per 1,000 residents here: | 4.16 |
| Pennsylvania average: | 2.64 |
Full-time law enforcement employees in 2016, including police officers: 7,995 (6,313 officers - 4,948 male; 1,365 female).
| Officers per 1,000 residents here: | 4.02 |
| Pennsylvania average: | 2.59 |
Full-time law enforcement employees in 2015, including police officers: 7,229 (6,413 officers - 5,013 male; 1,400 female).
| Officers per 1,000 residents here: | 4.09 |
| Pennsylvania average: | 2.04 |
Full-time law enforcement employees in 2014, including police officers: 7,235 (6,410 officers - 4,984 male; 1,426 female).
| Officers per 1,000 residents here: | 4.11 |
| Pennsylvania average: | 2.57 |
Full-time law enforcement employees in 2013, including police officers: 7,325 (6,508 officers - 5,048 male; 1,460 female).
| Officers per 1,000 residents here: | 4.19 |
| Pennsylvania average: | 2.58 |
Full-time law enforcement employees in 2012, including police officers: 7,360 (6,526 officers - 5,032 male; 1,494 female).
| Officers per 1,000 residents here: | 4.24 |
| Pennsylvania average: | 2.59 |
Full-time law enforcement employees in 2011, including police officers: 7,427 (6,625 officers - 5,083 male; 1,542 female).
| Officers per 1,000 residents here: | 4.33 |
| Pennsylvania average: | 2.12 |
Full-time law enforcement employees in 2010, including police officers: 7,532 (6,734 officers - 5,153 male; 1,581 female).
| Officers per 1,000 residents here: | 4.41 |
| Pennsylvania average: | 2.61 |
Full-time law enforcement employees in 2009, including police officers: 7,576 (6,722 officers - 5,115 male; 1,607 female).
| Officers per 1,000 residents here: | 4.34 |
| Pennsylvania average: | 2.63 |
Full-time law enforcement employees in 2008, including police officers: 7,623 (6,764 officers - 5,111 male; 1,653 female).
| Officers per 1,000 residents here: | 4.69 |
| Pennsylvania average: | 2.67 |
Full-time law enforcement employees in 2007, including police officers: 7,542 (6,714 officers - 5,058 male; 1,656 female).
| Officers per 1,000 residents here: | 4.68 |
| Pennsylvania average: | 2.76 |
Full-time law enforcement employees in 2006, including police officers: 7,510 (6,665 officers - 5,005 male; 1,660 female).
| Officers per 1,000 residents here: | 4.55 |
| Pennsylvania average: | 2.79 |
Full-time law enforcement employees in 2005, including police officers: 7,501 (6,636 officers - 4,956 male; 1,680 female).
| Officers per 1,000 residents here: | 4.51 |
| Pennsylvania average: | 2.79 |
Full-time law enforcement employees in 2004, including police officers: 7,704 (6,781 officers - 5,075 male; 1,706 female).
| Officers per 1,000 residents here: | 4.57 |
| Pennsylvania average: | 2.81 |
Full-time law enforcement employees in 2003, including police officers: 7,844 (6,932 officers - 5,204 male; 1,728 female).
| Officers per 1,000 residents here: | 4.63 |
| Pennsylvania average: | 2.85 |

Zip codes: 19102, 19103, 19104, 19106, 19107, 19109, 19111, 19112, 19114, 19115, 19116, 19118, 19119, 19120, 19121, 19122, 19123, 19124, 19125, 19126, 19127, 19128, 19129, 19130, 19131, 19132, 19133, 19134, 19135, 19136, 19137, 19138, 19139, 19140, 19141, 19142, 19143, 19144, 19145, 19146, 19147, 19148, 19149, 19150, 19151, 19152, 19153, 19154.