Estimated zip code population in 2022: 33,508
Zip code population in 2010: 29,883
Zip code population in 2000: 31,255
Houses and condos: 15,037
Renter-occupied apartments: 5,002
% of renters here:
37%State:
31%
March 2022 cost of living index in zip code 19151: 102.8
(near average, U.S. average is 100)
Land area: 2.4
sq. mi.
Water area: 0.0
sq. mi.
Population density: 14,010 people per square mile (very high).
OSM Map
General Map
Google Map
MSN Map
OSM Map
General Map
Google Map
MSN Map
OSM Map
General Map
Google Map
MSN Map
OSM Map
General Map
Google Map
MSN Map
Please wait while loading the map...
Real estate property taxes paid for housing units in 2022:
This zip code:
0.9% ($1,544)Pennsylvania:
1.3% ($3,094)
Median real estate property taxes paid for housing units with mortgages in 2022: $1,623 (0.8%)
Median real estate property taxes paid for housing units with no mortgage in 2022: $1,302 (0.8%)
Profiles of local businesses
Business Search - 14 Million verified businesses
Males: 16,158 Females: 17,350
For population 25 years and over in 19151:
High school or higher: 92.6%Bachelor's degree or higher: 28.7%Graduate or professional degree: 12.6%Unemployed: 5.8%Mean travel time to work (commute): 32.4 minutes
For population 15 years and over in 19151:
Never married: 51.5%Now married: 31.2%Separated: 4.1%Widowed: 3.5%Divorced: 9.7%
Zip code 19151 compared to state average:
Black race population percentage significantly above state average. Hispanic race population percentage significantly below state average. Median age below state average. Length of stay since moving in significantly above state average. House age above state average. 29,197 87.1% Black 2,293 6.8% White 895 2.7% Hispanic or Latino 811 2.4% Two or more races 259 0.8% Asian 27 0.08% American Indian 21 0.06% Some other race
Data:
Median household income ($)
Median household income (% change since 2000)
Household income diversity
Ratio of average income to average house value (%)
Ratio of average income to average rent
Median household income ($) - White
Median household income ($) - Black or African American
Median household income ($) - Asian
Median household income ($) - Hispanic or Latino
Median household income ($) - American Indian and Alaska Native
Median household income ($) - Multirace
Median household income ($) - Other Race
Median household income for houses/condos with a mortgage ($)
Median household income for apartments without a mortgage ($)
Races - White alone (%)
Races - White alone (% change since 2000)
Races - Black alone (%)
Races - Black alone (% change since 2000)
Races - American Indian alone (%)
Races - American Indian alone (% change since 2000)
Races - Asian alone (%)
Races - Asian alone (% change since 2000)
Races - Hispanic (%)
Races - Hispanic (% change since 2000)
Races - Native Hawaiian and Other Pacific Islander alone (%)
Races - Native Hawaiian and Other Pacific Islander alone (% change since 2000)
Races - Two or more races (%)
Races - Two or more races (% change since 2000)
Races - Other race alone (%)
Races - Other race alone (% change since 2000)
Racial diversity
Unemployment (%)
Unemployment (% change since 2000)
Unemployment (%) - White
Unemployment (%) - Black or African American
Unemployment (%) - Asian
Unemployment (%) - Hispanic or Latino
Unemployment (%) - American Indian and Alaska Native
Unemployment (%) - Multirace
Unemployment (%) - Other Race
Population density (people per square mile)
Population - Males (%)
Population - Females (%)
Population - Males (%) - White
Population - Males (%) - Black or African American
Population - Males (%) - Asian
Population - Males (%) - Hispanic or Latino
Population - Males (%) - American Indian and Alaska Native
Population - Males (%) - Multirace
Population - Males (%) - Other Race
Population - Females (%) - White
Population - Females (%) - Black or African American
Population - Females (%) - Asian
Population - Females (%) - Hispanic or Latino
Population - Females (%) - American Indian and Alaska Native
Population - Females (%) - Multirace
Population - Females (%) - Other Race
Coronavirus confirmed cases (Apr 27, 2024)
Deaths caused by coronavirus (Apr 27, 2024)
Coronavirus confirmed cases (per 100k population) (Apr 27, 2024)
Deaths caused by coronavirus (per 100k population) (Apr 27, 2024)
Daily increase in number of cases (Apr 27, 2024)
Weekly increase in number of cases (Apr 27, 2024)
Cases doubled (in days) (Apr 27, 2024)
Hospitalized patients (Apr 18, 2022)
Negative test results (Apr 18, 2022)
Total test results (Apr 18, 2022)
COVID Vaccine doses distributed (per 100k population) (Sep 19, 2023)
COVID Vaccine doses administered (per 100k population) (Sep 19, 2023)
COVID Vaccine doses distributed (Sep 19, 2023)
COVID Vaccine doses administered (Sep 19, 2023)
Likely homosexual households (%)
Likely homosexual households (% change since 2000)
Likely homosexual households - Lesbian couples (%)
Likely homosexual households - Lesbian couples (% change since 2000)
Likely homosexual households - Gay men (%)
Likely homosexual households - Gay men (% change since 2000)
Cost of living index
Median gross rent ($)
Median contract rent ($)
Median monthly housing costs ($)
Median house or condo value ($)
Median house or condo value ($ change since 2000)
Mean house or condo value by units in structure - 1, detached ($)
Mean house or condo value by units in structure - 1, attached ($)
Mean house or condo value by units in structure - 2 ($)
Mean house or condo value by units in structure by units in structure - 3 or 4 ($)
Mean house or condo value by units in structure - 5 or more ($)
Mean house or condo value by units in structure - Boat, RV, van, etc. ($)
Mean house or condo value by units in structure - Mobile home ($)
Median house or condo value ($) - White
Median house or condo value ($) - Black or African American
Median house or condo value ($) - Asian
Median house or condo value ($) - Hispanic or Latino
Median house or condo value ($) - American Indian and Alaska Native
Median house or condo value ($) - Multirace
Median house or condo value ($) - Other Race
Median resident age
Resident age diversity
Median resident age - Males
Median resident age - Females
Median resident age - White
Median resident age - Black or African American
Median resident age - Asian
Median resident age - Hispanic or Latino
Median resident age - American Indian and Alaska Native
Median resident age - Multirace
Median resident age - Other Race
Median resident age - Males - White
Median resident age - Males - Black or African American
Median resident age - Males - Asian
Median resident age - Males - Hispanic or Latino
Median resident age - Males - American Indian and Alaska Native
Median resident age - Males - Multirace
Median resident age - Males - Other Race
Median resident age - Females - White
Median resident age - Females - Black or African American
Median resident age - Females - Asian
Median resident age - Females - Hispanic or Latino
Median resident age - Females - American Indian and Alaska Native
Median resident age - Females - Multirace
Median resident age - Females - Other Race
Commute - mean travel time to work (minutes)
Travel time to work - Less than 5 minutes (%)
Travel time to work - Less than 5 minutes (% change since 2000)
Travel time to work - 5 to 9 minutes (%)
Travel time to work - 5 to 9 minutes (% change since 2000)
Travel time to work - 10 to 19 minutes (%)
Travel time to work - 10 to 19 minutes (% change since 2000)
Travel time to work - 20 to 29 minutes (%)
Travel time to work - 20 to 29 minutes (% change since 2000)
Travel time to work - 30 to 39 minutes (%)
Travel time to work - 30 to 39 minutes (% change since 2000)
Travel time to work - 40 to 59 minutes (%)
Travel time to work - 40 to 59 minutes (% change since 2000)
Travel time to work - 60 to 89 minutes (%)
Travel time to work - 60 to 89 minutes (% change since 2000)
Travel time to work - 90 or more minutes (%)
Travel time to work - 90 or more minutes (% change since 2000)
Marital status - Never married (%)
Marital status - Now married (%)
Marital status - Separated (%)
Marital status - Widowed (%)
Marital status - Divorced (%)
Median family income ($)
Median family income (% change since 2000)
Median non-family income ($)
Median non-family income (% change since 2000)
Median per capita income ($)
Median per capita income (% change since 2000)
Median family income ($) - White
Median family income ($) - Black or African American
Median family income ($) - Asian
Median family income ($) - Hispanic or Latino
Median family income ($) - American Indian and Alaska Native
Median family income ($) - Multirace
Median family income ($) - Other Race
Median year house/condo built
Median year apartment built
Year house built - Built 2005 or later (%)
Year house built - Built 2000 to 2004 (%)
Year house built - Built 1990 to 1999 (%)
Year house built - Built 1980 to 1989 (%)
Year house built - Built 1970 to 1979 (%)
Year house built - Built 1960 to 1969 (%)
Year house built - Built 1950 to 1959 (%)
Year house built - Built 1940 to 1949 (%)
Year house built - Built 1939 or earlier (%)
Average household size
Household density (households per square mile)
Average household size - White
Average household size - Black or African American
Average household size - Asian
Average household size - Hispanic or Latino
Average household size - American Indian and Alaska Native
Average household size - Multirace
Average household size - Other Race
Occupied housing units (%)
Vacant housing units (%)
Owner occupied housing units (%)
Renter occupied housing units (%)
Vacancy status - For rent (%)
Vacancy status - For sale only (%)
Vacancy status - Rented or sold, not occupied (%)
Vacancy status - For seasonal, recreational, or occasional use (%)
Vacancy status - For migrant workers (%)
Vacancy status - Other vacant (%)
Residents with income below the poverty level (%)
Residents with income below 50% of the poverty level (%)
Children below poverty level (%)
Poor families by family type - Married-couple family (%)
Poor families by family type - Male, no wife present (%)
Poor families by family type - Female, no husband present (%)
Poverty status for native-born residents (%)
Poverty status for foreign-born residents (%)
Poverty among high school graduates not in families (%)
Poverty among people who did not graduate high school not in families (%)
Residents with income below the poverty level (%) - White
Residents with income below the poverty level (%) - Black or African American
Residents with income below the poverty level (%) - Asian
Residents with income below the poverty level (%) - Hispanic or Latino
Residents with income below the poverty level (%) - American Indian and Alaska Native
Residents with income below the poverty level (%) - Multirace
Residents with income below the poverty level (%) - Other Race
Air pollution - Air Quality Index (AQI)
Air pollution - CO
Air pollution - NO2
Air pollution - SO2
Air pollution - Ozone
Air pollution - PM10
Air pollution - PM25
Air pollution - Pb
Crime - Murders per 100,000 population
Crime - Rapes per 100,000 population
Crime - Robberies per 100,000 population
Crime - Assaults per 100,000 population
Crime - Burglaries per 100,000 population
Crime - Thefts per 100,000 population
Crime - Auto thefts per 100,000 population
Crime - Arson per 100,000 population
Crime - City-data.com crime index
Crime - Violent crime index
Crime - Property crime index
Crime - Murders per 100,000 population (5 year average)
Crime - Rapes per 100,000 population (5 year average)
Crime - Robberies per 100,000 population (5 year average)
Crime - Assaults per 100,000 population (5 year average)
Crime - Burglaries per 100,000 population (5 year average)
Crime - Thefts per 100,000 population (5 year average)
Crime - Auto thefts per 100,000 population (5 year average)
Crime - Arson per 100,000 population (5 year average)
Crime - City-data.com crime index (5 year average)
Crime - Violent crime index (5 year average)
Crime - Property crime index (5 year average)
1996 Presidential Elections Results (%) - Democratic Party (Clinton)
1996 Presidential Elections Results (%) - Republican Party (Dole)
1996 Presidential Elections Results (%) - Other
2000 Presidential Elections Results (%) - Democratic Party (Gore)
2000 Presidential Elections Results (%) - Republican Party (Bush)
2000 Presidential Elections Results (%) - Other
2004 Presidential Elections Results (%) - Democratic Party (Kerry)
2004 Presidential Elections Results (%) - Republican Party (Bush)
2004 Presidential Elections Results (%) - Other
2008 Presidential Elections Results (%) - Democratic Party (Obama)
2008 Presidential Elections Results (%) - Republican Party (McCain)
2008 Presidential Elections Results (%) - Other
2012 Presidential Elections Results (%) - Democratic Party (Obama)
2012 Presidential Elections Results (%) - Republican Party (Romney)
2012 Presidential Elections Results (%) - Other
2016 Presidential Elections Results (%) - Democratic Party (Clinton)
2016 Presidential Elections Results (%) - Republican Party (Trump)
2016 Presidential Elections Results (%) - Other
2020 Presidential Elections Results (%) - Democratic Party (Biden)
2020 Presidential Elections Results (%) - Republican Party (Trump)
2020 Presidential Elections Results (%) - Other
Ancestries Reported - Arab (%)
Ancestries Reported - Czech (%)
Ancestries Reported - Danish (%)
Ancestries Reported - Dutch (%)
Ancestries Reported - English (%)
Ancestries Reported - French (%)
Ancestries Reported - French Canadian (%)
Ancestries Reported - German (%)
Ancestries Reported - Greek (%)
Ancestries Reported - Hungarian (%)
Ancestries Reported - Irish (%)
Ancestries Reported - Italian (%)
Ancestries Reported - Lithuanian (%)
Ancestries Reported - Norwegian (%)
Ancestries Reported - Polish (%)
Ancestries Reported - Portuguese (%)
Ancestries Reported - Russian (%)
Ancestries Reported - Scotch-Irish (%)
Ancestries Reported - Scottish (%)
Ancestries Reported - Slovak (%)
Ancestries Reported - Subsaharan African (%)
Ancestries Reported - Swedish (%)
Ancestries Reported - Swiss (%)
Ancestries Reported - Ukrainian (%)
Ancestries Reported - United States (%)
Ancestries Reported - Welsh (%)
Ancestries Reported - West Indian (%)
Ancestries Reported - Other (%)
Educational Attainment - No schooling completed (%)
Educational Attainment - Less than high school (%)
Educational Attainment - High school or equivalent (%)
Educational Attainment - Less than 1 year of college (%)
Educational Attainment - 1 or more years of college (%)
Educational Attainment - Associate degree (%)
Educational Attainment - Bachelor's degree (%)
Educational Attainment - Master's degree (%)
Educational Attainment - Professional school degree (%)
Educational Attainment - Doctorate degree (%)
School Enrollment - Nursery, preschool (%)
School Enrollment - Kindergarten (%)
School Enrollment - Grade 1 to 4 (%)
School Enrollment - Grade 5 to 8 (%)
School Enrollment - Grade 9 to 12 (%)
School Enrollment - College undergrad (%)
School Enrollment - Graduate or professional (%)
School Enrollment - Not enrolled in school (%)
School enrollment - Public schools (%)
School enrollment - Private schools (%)
School enrollment - Not enrolled (%)
Median number of rooms in houses and condos
Median number of rooms in apartments
Housing units lacking complete plumbing facilities (%)
Housing units lacking complete kitchen facilities (%)
Density of houses
Urban houses (%)
Rural houses (%)
Households with people 60 years and over (%)
Households with people 65 years and over (%)
Households with people 75 years and over (%)
Households with one or more nonrelatives (%)
Households with no nonrelatives (%)
Population in households (%)
Family households (%)
Nonfamily households (%)
Population in families (%)
Family households with own children (%)
Median number of bedrooms in owner occupied houses
Mean number of bedrooms in owner occupied houses
Median number of bedrooms in renter occupied houses
Mean number of bedrooms in renter occupied houses
Median number of vehichles in owner occupied houses
Mean number of vehichles in owner occupied houses
Median number of vehichles in renter occupied houses
Mean number of vehichles in renter occupied houses
Mortgage status - with mortgage (%)
Mortgage status - with second mortgage (%)
Mortgage status - with home equity loan (%)
Mortgage status - with both second mortgage and home equity loan (%)
Mortgage status - without a mortgage (%)
Average family size
Average family size - White
Average family size - Black or African American
Average family size - Asian
Average family size - Hispanic or Latino
Average family size - American Indian and Alaska Native
Average family size - Multirace
Average family size - Other Race
Geographical mobility - Same house 1 year ago (%)
Geographical mobility - Moved within same county (%)
Geographical mobility - Moved from different county within same state (%)
Geographical mobility - Moved from different state (%)
Geographical mobility - Moved from abroad (%)
Place of birth - Born in state of residence (%)
Place of birth - Born in other state (%)
Place of birth - Native, outside of US (%)
Place of birth - Foreign born (%)
Housing units in structures - 1, detached (%)
Housing units in structures - 1, attached (%)
Housing units in structures - 2 (%)
Housing units in structures - 3 or 4 (%)
Housing units in structures - 5 to 9 (%)
Housing units in structures - 10 to 19 (%)
Housing units in structures - 20 to 49 (%)
Housing units in structures - 50 or more (%)
Housing units in structures - Mobile home (%)
Housing units in structures - Boat, RV, van, etc. (%)
House/condo owner moved in on average (years ago)
Renter moved in on average (years ago)
Year householder moved into unit - Moved in 1999 to March 2000 (%)
Year householder moved into unit - Moved in 1995 to 1998 (%)
Year householder moved into unit - Moved in 1990 to 1994 (%)
Year householder moved into unit - Moved in 1980 to 1989 (%)
Year householder moved into unit - Moved in 1970 to 1979 (%)
Year householder moved into unit - Moved in 1969 or earlier (%)
Means of transportation to work - Drove car alone (%)
Means of transportation to work - Carpooled (%)
Means of transportation to work - Public transportation (%)
Means of transportation to work - Bus or trolley bus (%)
Means of transportation to work - Streetcar or trolley car (%)
Means of transportation to work - Subway or elevated (%)
Means of transportation to work - Railroad (%)
Means of transportation to work - Ferryboat (%)
Means of transportation to work - Taxicab (%)
Means of transportation to work - Motorcycle (%)
Means of transportation to work - Bicycle (%)
Means of transportation to work - Walked (%)
Means of transportation to work - Other means (%)
Working at home (%)
Industry diversity
Most Common Industries - Agriculture, forestry, fishing and hunting, and mining (%)
Most Common Industries - Agriculture, forestry, fishing and hunting (%)
Most Common Industries - Mining, quarrying, and oil and gas extraction (%)
Most Common Industries - Construction (%)
Most Common Industries - Manufacturing (%)
Most Common Industries - Wholesale trade (%)
Most Common Industries - Retail trade (%)
Most Common Industries - Transportation and warehousing, and utilities (%)
Most Common Industries - Transportation and warehousing (%)
Most Common Industries - Utilities (%)
Most Common Industries - Information (%)
Most Common Industries - Finance and insurance, and real estate and rental and leasing (%)
Most Common Industries - Finance and insurance (%)
Most Common Industries - Real estate and rental and leasing (%)
Most Common Industries - Professional, scientific, and management, and administrative and waste management services (%)
Most Common Industries - Professional, scientific, and technical services (%)
Most Common Industries - Management of companies and enterprises (%)
Most Common Industries - Administrative and support and waste management services (%)
Most Common Industries - Educational services, and health care and social assistance (%)
Most Common Industries - Educational services (%)
Most Common Industries - Health care and social assistance (%)
Most Common Industries - Arts, entertainment, and recreation, and accommodation and food services (%)
Most Common Industries - Arts, entertainment, and recreation (%)
Most Common Industries - Accommodation and food services (%)
Most Common Industries - Other services, except public administration (%)
Most Common Industries - Public administration (%)
Occupation diversity
Most Common Occupations - Management, business, science, and arts occupations (%)
Most Common Occupations - Management, business, and financial occupations (%)
Most Common Occupations - Management occupations (%)
Most Common Occupations - Business and financial operations occupations (%)
Most Common Occupations - Computer, engineering, and science occupations (%)
Most Common Occupations - Computer and mathematical occupations (%)
Most Common Occupations - Architecture and engineering occupations (%)
Most Common Occupations - Life, physical, and social science occupations (%)
Most Common Occupations - Education, legal, community service, arts, and media occupations (%)
Most Common Occupations - Community and social service occupations (%)
Most Common Occupations - Legal occupations (%)
Most Common Occupations - Education, training, and library occupations (%)
Most Common Occupations - Arts, design, entertainment, sports, and media occupations (%)
Most Common Occupations - Healthcare practitioners and technical occupations (%)
Most Common Occupations - Health diagnosing and treating practitioners and other technical occupations (%)
Most Common Occupations - Health technologists and technicians (%)
Most Common Occupations - Service occupations (%)
Most Common Occupations - Healthcare support occupations (%)
Most Common Occupations - Protective service occupations (%)
Most Common Occupations - Fire fighting and prevention, and other protective service workers including supervisors (%)
Most Common Occupations - Law enforcement workers including supervisors (%)
Most Common Occupations - Food preparation and serving related occupations (%)
Most Common Occupations - Building and grounds cleaning and maintenance occupations (%)
Most Common Occupations - Personal care and service occupations (%)
Most Common Occupations - Sales and office occupations (%)
Most Common Occupations - Sales and related occupations (%)
Most Common Occupations - Office and administrative support occupations (%)
Most Common Occupations - Natural resources, construction, and maintenance occupations (%)
Most Common Occupations - Farming, fishing, and forestry occupations (%)
Most Common Occupations - Construction and extraction occupations (%)
Most Common Occupations - Installation, maintenance, and repair occupations (%)
Most Common Occupations - Production, transportation, and material moving occupations (%)
Most Common Occupations - Production occupations (%)
Most Common Occupations - Transportation occupations (%)
Most Common Occupations - Material moving occupations (%)
People in Group quarters - Institutionalized population (%)
People in Group quarters - Correctional institutions (%)
People in Group quarters - Federal prisons and detention centers (%)
People in Group quarters - Halfway houses (%)
People in Group quarters - Local jails and other confinement facilities (including police lockups) (%)
People in Group quarters - Military disciplinary barracks (%)
People in Group quarters - State prisons (%)
People in Group quarters - Other types of correctional institutions (%)
People in Group quarters - Nursing homes (%)
People in Group quarters - Hospitals/wards, hospices, and schools for the handicapped (%)
People in Group quarters - Hospitals/wards and hospices for chronically ill (%)
People in Group quarters - Hospices or homes for chronically ill (%)
People in Group quarters - Military hospitals or wards for chronically ill (%)
People in Group quarters - Other hospitals or wards for chronically ill (%)
People in Group quarters - Hospitals or wards for drug/alcohol abuse (%)
People in Group quarters - Mental (Psychiatric) hospitals or wards (%)
People in Group quarters - Schools, hospitals, or wards for the mentally retarded (%)
People in Group quarters - Schools, hospitals, or wards for the physically handicapped (%)
People in Group quarters - Institutions for the deaf (%)
People in Group quarters - Institutions for the blind (%)
People in Group quarters - Orthopedic wards and institutions for the physically handicapped (%)
People in Group quarters - Wards in general hospitals for patients who have no usual home elsewhere (%)
People in Group quarters - Wards in military hospitals for patients who have no usual home elsewhere (%)
People in Group quarters - Juvenile institutions (%)
People in Group quarters - Long-term care (%)
People in Group quarters - Homes for abused, dependent, and neglected children (%)
People in Group quarters - Residential treatment centers for emotionally disturbed children (%)
People in Group quarters - Training schools for juvenile delinquents (%)
People in Group quarters - Short-term care, detention or diagnostic centers for delinquent children (%)
People in Group quarters - Type of juvenile institution unknown (%)
People in Group quarters - Noninstitutionalized population (%)
People in Group quarters - College dormitories (includes college quarters off campus) (%)
People in Group quarters - Military quarters (%)
People in Group quarters - On base (%)
People in Group quarters - Barracks, unaccompanied personnel housing (UPH), (Enlisted/Officer), ;and similar group living quarters for military personnel (%)
People in Group quarters - Transient quarters for temporary residents (%)
People in Group quarters - Military ships (%)
People in Group quarters - Group homes (%)
People in Group quarters - Homes or halfway houses for drug/alcohol abuse (%)
People in Group quarters - Homes for the mentally ill (%)
People in Group quarters - Homes for the mentally retarded (%)
People in Group quarters - Homes for the physically handicapped (%)
People in Group quarters - Other group homes (%)
People in Group quarters - Religious group quarters (%)
People in Group quarters - Dormitories (%)
People in Group quarters - Agriculture workers' dormitories on farms (%)
People in Group quarters - Job Corps and vocational training facilities (%)
People in Group quarters - Other workers' dormitories (%)
People in Group quarters - Crews of maritime vessels (%)
People in Group quarters - Other nonhousehold living situations (%)
People in Group quarters - Other noninstitutional group quarters (%)
Residents speaking English at home (%)
Residents speaking English at home - Born in the United States (%)
Residents speaking English at home - Native, born elsewhere (%)
Residents speaking English at home - Foreign born (%)
Residents speaking Spanish at home (%)
Residents speaking Spanish at home - Born in the United States (%)
Residents speaking Spanish at home - Native, born elsewhere (%)
Residents speaking Spanish at home - Foreign born (%)
Residents speaking other language at home (%)
Residents speaking other language at home - Born in the United States (%)
Residents speaking other language at home - Native, born elsewhere (%)
Residents speaking other language at home - Foreign born (%)
Class of Workers - Employee of private company (%)
Class of Workers - Self-employed in own incorporated business (%)
Class of Workers - Private not-for-profit wage and salary workers (%)
Class of Workers - Local government workers (%)
Class of Workers - State government workers (%)
Class of Workers - Federal government workers (%)
Class of Workers - Self-employed workers in own not incorporated business and Unpaid family workers (%)
House heating fuel used in houses and condos - Utility gas (%)
House heating fuel used in houses and condos - Bottled, tank, or LP gas (%)
House heating fuel used in houses and condos - Electricity (%)
House heating fuel used in houses and condos - Fuel oil, kerosene, etc. (%)
House heating fuel used in houses and condos - Coal or coke (%)
House heating fuel used in houses and condos - Wood (%)
House heating fuel used in houses and condos - Solar energy (%)
House heating fuel used in houses and condos - Other fuel (%)
House heating fuel used in houses and condos - No fuel used (%)
House heating fuel used in apartments - Utility gas (%)
House heating fuel used in apartments - Bottled, tank, or LP gas (%)
House heating fuel used in apartments - Electricity (%)
House heating fuel used in apartments - Fuel oil, kerosene, etc. (%)
House heating fuel used in apartments - Coal or coke (%)
House heating fuel used in apartments - Wood (%)
House heating fuel used in apartments - Solar energy (%)
House heating fuel used in apartments - Other fuel (%)
House heating fuel used in apartments - No fuel used (%)
Armed forces status - In Armed Forces (%)
Armed forces status - Civilian (%)
Armed forces status - Civilian - Veteran (%)
Armed forces status - Civilian - Nonveteran (%)
Fatal accidents locations in years 2005-2021
Fatal accidents locations in 2005
Fatal accidents locations in 2006
Fatal accidents locations in 2007
Fatal accidents locations in 2008
Fatal accidents locations in 2009
Fatal accidents locations in 2010
Fatal accidents locations in 2011
Fatal accidents locations in 2012
Fatal accidents locations in 2013
Fatal accidents locations in 2014
Fatal accidents locations in 2015
Fatal accidents locations in 2016
Fatal accidents locations in 2017
Fatal accidents locations in 2018
Fatal accidents locations in 2019
Fatal accidents locations in 2020
Fatal accidents locations in 2021
Alcohol use - People drinking some alcohol every month (%)
Alcohol use - People not drinking at all (%)
Alcohol use - Average days/month drinking alcohol
Alcohol use - Average drinks/week
Alcohol use - Average days/year people drink much
Audiometry - Average condition of hearing (%)
Audiometry - People that can hear a whisper from across a quiet room (%)
Audiometry - People that can hear normal voice from across a quiet room (%)
Audiometry - Ears ringing, roaring, buzzing (%)
Audiometry - Had a job exposure to loud noise (%)
Audiometry - Had off-work exposure to loud noise (%)
Blood Pressure & Cholesterol - Has high blood pressure (%)
Blood Pressure & Cholesterol - Checking blood pressure at home (%)
Blood Pressure & Cholesterol - Frequently checking blood cholesterol (%)
Blood Pressure & Cholesterol - Has high cholesterol level (%)
Consumer Behavior - Money monthly spent on food at supermarket/grocery store
Consumer Behavior - Money monthly spent on food at other stores
Consumer Behavior - Money monthly spent on eating out
Consumer Behavior - Money monthly spent on carryout/delivered foods
Consumer Behavior - Income spent on food at supermarket/grocery store (%)
Consumer Behavior - Income spent on food at other stores (%)
Consumer Behavior - Income spent on eating out (%)
Consumer Behavior - Income spent on carryout/delivered foods (%)
Current Health Status - General health condition (%)
Current Health Status - Blood donors (%)
Current Health Status - Has blood ever tested for HIV virus (%)
Current Health Status - Left-handed people (%)
Dermatology - People using sunscreen (%)
Diabetes - Diabetics (%)
Diabetes - Had a blood test for high blood sugar (%)
Diabetes - People taking insulin (%)
Diet Behavior & Nutrition - Diet health (%)
Diet Behavior & Nutrition - Milk product consumption (# of products/month)
Diet Behavior & Nutrition - Meals not home prepared (#/week)
Diet Behavior & Nutrition - Meals from fast food or pizza place (#/week)
Diet Behavior & Nutrition - Ready-to-eat foods (#/month)
Diet Behavior & Nutrition - Frozen meals/pizza (#/month)
Drug Use - People that ever used marijuana or hashish (%)
Drug Use - Ever used hard drugs (%)
Drug Use - Ever used any form of cocaine (%)
Drug Use - Ever used heroin (%)
Drug Use - Ever used methamphetamine (%)
Health Insurance - People covered by health insurance (%)
Kidney Conditions-Urology - Avg. # of times urinating at night
Medical Conditions - People with asthma (%)
Medical Conditions - People with anemia (%)
Medical Conditions - People with psoriasis (%)
Medical Conditions - People with overweight (%)
Medical Conditions - Elderly people having difficulties in thinking or remembering (%)
Medical Conditions - People who ever received blood transfusion (%)
Medical Conditions - People having trouble seeing even with glass/contacts (%)
Medical Conditions - People with arthritis (%)
Medical Conditions - People with gout (%)
Medical Conditions - People with congestive heart failure (%)
Medical Conditions - People with coronary heart disease (%)
Medical Conditions - People with angina pectoris (%)
Medical Conditions - People who ever had heart attack (%)
Medical Conditions - People who ever had stroke (%)
Medical Conditions - People with emphysema (%)
Medical Conditions - People with thyroid problem (%)
Medical Conditions - People with chronic bronchitis (%)
Medical Conditions - People with any liver condition (%)
Medical Conditions - People who ever had cancer or malignancy (%)
Mental Health - People who have little interest in doing things (%)
Mental Health - People feeling down, depressed, or hopeless (%)
Mental Health - People who have trouble sleeping or sleeping too much (%)
Mental Health - People feeling tired or having little energy (%)
Mental Health - People with poor appetite or overeating (%)
Mental Health - People feeling bad about themself (%)
Mental Health - People who have trouble concentrating on things (%)
Mental Health - People moving or speaking slowly or too fast (%)
Mental Health - People having thoughts they would be better off dead (%)
Oral Health - Average years since last visit a dentist
Oral Health - People embarrassed because of mouth (%)
Oral Health - People with gum disease (%)
Oral Health - General health of teeth and gums (%)
Oral Health - Average days a week using dental floss/device
Oral Health - Average days a week using mouthwash for dental problem
Oral Health - Average number of teeth
Pesticide Use - Households using pesticides to control insects (%)
Pesticide Use - Households using pesticides to kill weeds (%)
Physical Activity - People doing vigorous-intensity work activities (%)
Physical Activity - People doing moderate-intensity work activities (%)
Physical Activity - People walking or bicycling (%)
Physical Activity - People doing vigorous-intensity recreational activities (%)
Physical Activity - People doing moderate-intensity recreational activities (%)
Physical Activity - Average hours a day doing sedentary activities
Physical Activity - Average hours a day watching TV or videos
Physical Activity - Average hours a day using computer
Physical Functioning - People having limitations keeping them from working (%)
Physical Functioning - People limited in amount of work they can do (%)
Physical Functioning - People that need special equipment to walk (%)
Physical Functioning - People experiencing confusion/memory problems (%)
Physical Functioning - People requiring special healthcare equipment (%)
Prescription Medications - Average number of prescription medicines taking
Preventive Aspirin Use - Adults 40+ taking low-dose aspirin (%)
Reproductive Health - Vaginal deliveries (%)
Reproductive Health - Cesarean deliveries (%)
Reproductive Health - Deliveries resulted in a live birth (%)
Reproductive Health - Pregnancies resulted in a delivery (%)
Reproductive Health - Women breastfeeding newborns (%)
Reproductive Health - Women that had a hysterectomy (%)
Reproductive Health - Women that had both ovaries removed (%)
Reproductive Health - Women that have ever taken birth control pills (%)
Reproductive Health - Women taking birth control pills (%)
Reproductive Health - Women that have ever used Depo-Provera or injectables (%)
Reproductive Health - Women that have ever used female hormones (%)
Sexual Behavior - People 18+ that ever had sex (vaginal, anal, or oral) (%)
Sexual Behavior - Males 18+ that ever had vaginal sex with a woman (%)
Sexual Behavior - Males 18+ that ever performed oral sex on a woman (%)
Sexual Behavior - Males 18+ that ever had anal sex with a woman (%)
Sexual Behavior - Males 18+ that ever had any sex with a man (%)
Sexual Behavior - Females 18+ that ever had vaginal sex with a man (%)
Sexual Behavior - Females 18+ that ever performed oral sex on a man (%)
Sexual Behavior - Females 18+ that ever had anal sex with a man (%)
Sexual Behavior - Females 18+ that ever had any kind of sex with a woman (%)
Sexual Behavior - Average age people first had sex
Sexual Behavior - Average number of female sex partners in lifetime (males 18+)
Sexual Behavior - Average number of female vaginal sex partners in lifetime (males 18+)
Sexual Behavior - Average age people first performed oral sex on a woman (18+)
Sexual Behavior - Average number of woman performed oral sex on in lifetime (18+)
Sexual Behavior - Average number of male sex partners in lifetime (males 18+)
Sexual Behavior - Average number of male anal sex partners in lifetime (males 18+)
Sexual Behavior - Average age people first performed oral sex on a man (18+)
Sexual Behavior - Average number of male oral sex partners in lifetime (18+)
Sexual Behavior - People using protection when performing oral sex (%)
Sexual Behavior - Average number of times people have vaginal or anal sex a year
Sexual Behavior - People having sex without condom (%)
Sexual Behavior - Average number of male sex partners in lifetime (females 18+)
Sexual Behavior - Average number of male vaginal sex partners in lifetime (females 18+)
Sexual Behavior - Average number of female sex partners in lifetime (females 18+)
Sexual Behavior - Circumcised males 18+ (%)
Sleep Disorders - Average hours sleeping at night
Sleep Disorders - People that has trouble sleeping (%)
Smoking-Cigarette Use - People smoking cigarettes (%)
Taste & Smell - People 40+ having problems with smell (%)
Taste & Smell - People 40+ having problems with taste (%)
Taste & Smell - People 40+ that ever had wisdom teeth removed (%)
Taste & Smell - People 40+ that ever had tonsils teeth removed (%)
Taste & Smell - People 40+ that ever had a loss of consciousness because of a head injury (%)
Taste & Smell - People 40+ that ever had a broken nose or other serious injury to face or skull (%)
Taste & Smell - People 40+ that ever had two or more sinus infections (%)
Weight - Average height (inches)
Weight - Average weight (pounds)
Weight - Average BMI
Weight - People that are obese (%)
Weight - People that ever were obese (%)
Weight - People trying to lose weight (%)
100%
urban population.
Estimated median house/condo value in 2022: $181,032
19151:
$181,032Pennsylvania:
$245,500
According to our research of Pennsylvania and other state lists, there were 73 registered sex offenders living in 19151 zip code as of April 27, 2024 . The ratio of all residents to sex offenders in zip code 19151 is 478 to 1.The ratio of registered sex offenders to all residents in this zip code is near the state average.
Median resident age: This zip code:
34.4 yearsPennsylvania median age:
40.9 years
Average household size: This zip code:
2.5 peoplePennsylvania:
2.4 people
Averages for the 2020 tax year for zip code 19151, filed in 2021:
Average Adjusted Gross Income (AGI) in 2020: $44,651 (Individual Income Tax Returns) Here:
$44,651State:
$75,707
Salary/wage: $41,578 (reported on 84.6% of returns )Here:
$41,578State:
$62,806
(% of AGI for various income ranges: 1001.7% for AGIs below $25k , 3419.0% for AGIs $25k-50k , 6682.9% for AGIs $50k-75k , 10311.3% for AGIs $75k-100k , 16496.8% for AGIs $100k-200k , 83600.0% for AGIs over 200k ) Taxable interest for individuals: $614 (reported on 13.8% of returns )This zip code:
$614Pennsylvania:
$1,633
(% of AGI for various income ranges: 4.1% for AGIs below $25k , 5.1% for AGIs $25k-50k , 7.0% for AGIs $50k-75k , 17.4% for AGIs $75k-100k , 56.8% for AGIs $100k-200k , 702.5% for AGIs over 200k ) Ordinary dividends: $2,304 (reported on 5.3% of returns )(% of AGI for various income ranges: 4.4% for AGIs below $25k , 5.1% for AGIs $25k-50k , 13.5% for AGIs $50k-75k , 16.4% for AGIs $75k-100k , 92.1% for AGIs $100k-200k , 1242.5% for AGIs over 200k ) Net capital gain/loss in AGI: +$6,062 (reported on 4.8% of returns )Here:
+$6,062State:
+$23,522
(% of AGI for various income ranges: 2.0% for AGIs below $25k , 7.4% for AGIs $25k-50k , 11.0% for AGIs $50k-75k , 55.3% for AGIs $75k-100k , 241.5% for AGIs $100k-200k , 4815.0% for AGIs over 200k ) Profit/loss from business: +$3,461 (reported on 13.7% of returns )Here:
+$3,461State:
+$16,274
(% of AGI for various income ranges: 44.8% for AGIs below $25k , 18.7% for AGIs $25k-50k , 74.3% for AGIs $50k-75k , 147.1% for AGIs $75k-100k , 181.0% for AGIs $100k-200k , 1962.5% for AGIs over 200k ) Taxable individual retirement arrangement distribution: $11,816 (reported on 3.3% of returns )19151:
$11,816Pennsylvania:
$18,583
(% of AGI for various income ranges: 16.2% for AGIs below $25k , 22.8% for AGIs $25k-50k , 57.1% for AGIs $50k-75k , 109.2% for AGIs $75k-100k , 369.7% for AGIs $100k-200k ) Total itemized deductions: $24,802 (reported on 9.1% of returns )Here:
$24,802State:
$34,850
(% of AGI for various income ranges: 20.9% for AGIs below $25k , 139.0% for AGIs $25k-50k , 474.0% for AGIs $50k-75k , 868.9% for AGIs $75k-100k , 1453.9% for AGIs $100k-200k , 6827.5% for AGIs over 200k ) Charity contributions: $9,307 (reported on 7.9% of returns )(% of AGI for various income ranges: 3.7% for AGIs below $25k , 40.4% for AGIs $25k-50k , 150.0% for AGIs $50k-75k , 277.8% for AGIs $75k-100k , 562.7% for AGIs $100k-200k , 1992.5% for AGIs over 200k ) Taxes paid: $7,336 (reported on 9.1% of returns )(% of AGI for various income ranges: 4.3% for AGIs below $25k , 32.9% for AGIs $25k-50k , 146.1% for AGIs $50k-75k , 274.1% for AGIs $75k-100k , 486.0% for AGIs $100k-200k , 1640.0% for AGIs over 200k ) Earned income credit: $2,137 (reported on 23.3% of returns )(% of AGI for various income ranges: 104.3% for AGIs below $25k , 70.7% for AGIs $25k-50k ) Percentage of individuals using paid preparers for their 2020 taxes: 90.6%(% for various income ranges: 91.0% for AGIs below $25k , 92.5% for AGIs $25k-50k , 88.1% for AGIs $50k-75k , 88.0% for AGIs $75k-100k , 87.9% for AGIs $100k-200k , 85.7% for AGIs over 200k )
Averages for the 2012 tax year for zip code 19151, filed in 2013:
Average Adjusted Gross Income (AGI) in 2012: $38,453 (Individual Income Tax Returns) Here:
$38,453State:
$61,346
Salary/wage: $36,724 (reported on 87.3% of returns )Here:
$36,724State:
$51,902
(% of AGI for various income ranges: 74.9% for AGIs below $25k , 87.6% for AGIs $25k-50k , 86.5% for AGIs $50k-75k , 87.6% for AGIs $75k-100k , 80.5% for AGIs $100k-200k , 68.8% for AGIs over 200k ) Taxable interest for individuals: $621 (reported on 15.1% of returns )This zip code:
$621Pennsylvania:
$1,588
(% of AGI for various income ranges: 0.4% for AGIs below $25k , 0.1% for AGIs $25k-50k , 0.2% for AGIs $50k-75k , 0.3% for AGIs $75k-100k , 0.2% for AGIs $100k-200k , 0.5% for AGIs over 200k ) Ordinary dividends: $2,167 (reported on 6.2% of returns )(% of AGI for various income ranges: 0.5% for AGIs below $25k , 0.2% for AGIs $25k-50k , 0.3% for AGIs $50k-75k , 0.3% for AGIs $75k-100k , 0.3% for AGIs $100k-200k , 1.3% for AGIs over 200k ) Net capital gain/loss in AGI: +$4,848 (reported on 3.7% of returns )Here:
+$4,848State:
+$14,495
(% of AGI for various income ranges: 0.2% for AGIs $75k-100k , 1.1% for AGIs $100k-200k , 3.8% for AGIs over 200k ) Profit/loss from business: +$6,576 (reported on 11.0% of returns )Here:
+$6,576State:
+$16,268
(% of AGI for various income ranges: 6.9% for AGIs below $25k , 0.8% for AGIs $25k-50k , 0.7% for AGIs $50k-75k , 1.0% for AGIs $75k-100k , 1.2% for AGIs $100k-200k , 3.0% for AGIs over 200k ) Taxable individual retirement arrangement distribution: $12,241 (reported on 4.3% of returns )19151:
$12,241Pennsylvania:
$14,550
(% of AGI for various income ranges: 1.1% for AGIs below $25k , 0.9% for AGIs $25k-50k , 1.3% for AGIs $50k-75k , 0.9% for AGIs $75k-100k , 4.0% for AGIs $100k-200k ) Self-employment retirement plans: $18,200 (reported on 0.2% of returns )19151:
$18,200Pennsylvania:
$20,922
Total itemized deductions: $17,029 (26% of AGI, reported on 33.0% of returns )Here:
$17,029State:
$23,538
Here:
25.8% of AGIState:
18.4% of AGI
(% of AGI for various income ranges: 6.3% for AGIs below $25k , 14.1% for AGIs $25k-50k , 17.6% for AGIs $50k-75k , 17.8% for AGIs $75k-100k , 17.1% for AGIs $100k-200k , 13.9% for AGIs over 200k ) Charity contributions: $3,668 (reported on 27.0% of returns )(% of AGI for various income ranges: 0.9% for AGIs below $25k , 2.3% for AGIs $25k-50k , 3.2% for AGIs $50k-75k , 3.5% for AGIs $75k-100k , 3.2% for AGIs $100k-200k , 2.0% for AGIs over 200k ) Taxes paid: $6,217 (reported on 32.8% of returns )(% of AGI for various income ranges: 1.4% for AGIs below $25k , 4.3% for AGIs $25k-50k , 6.2% for AGIs $50k-75k , 6.9% for AGIs $75k-100k , 7.6% for AGIs $100k-200k , 7.5% for AGIs over 200k ) Earned income credit: $2,269 (reported on 30.3% of returns )(% of AGI for various income ranges: 9.8% for AGIs below $25k , 1.3% for AGIs $25k-50k ) Percentage of individuals using paid preparers for their 2012 taxes: 43.6%(% for various income ranges: 43.6% for AGIs below $25k , 41.4% for AGIs $25k-50k , 43.8% for AGIs $50k-75k , 46.8% for AGIs $75k-100k , 52.6% for AGIs $100k-200k , 70.0% for AGIs over 200k )
Averages for the 2004 tax year for zip code 19151, filed in 2005:
Average Adjusted Gross Income (AGI) in 2004: $32,438 (Individual Income Tax Returns) Here:
$32,438State:
$48,049
Salary/wage: $31,784 (reported on 88.5% of returns )Here:
$31,784State:
$42,646
(% of AGI for various income ranges: 83.9% for AGIs below $10k , 79.9% for AGIs $10k-25k , 91.8% for AGIs $25k-50k , 89.3% for AGIs $50k-75k , 87.1% for AGIs $75k-100k , 75.6% for AGIs over 100k ) Taxable interest for individuals: $1,069 (reported on 24.3% of returns )This zip code:
$1,069Pennsylvania:
$1,657
(% of AGI for various income ranges: 2.6% for AGIs below $10k , 1.3% for AGIs $10k-25k , 0.5% for AGIs $25k-50k , 0.6% for AGIs $50k-75k , 0.7% for AGIs $75k-100k , 1.0% for AGIs over 100k ) Taxable dividends: $1,734 (reported on 9.5% of returns )(% of AGI for various income ranges: 1.2% for AGIs below $10k , 0.6% for AGIs $10k-25k , 0.2% for AGIs $25k-50k , 0.3% for AGIs $50k-75k , 0.4% for AGIs $75k-100k , 1.4% for AGIs over 100k ) Net capital gain/loss: +$5,071 (reported on 6.2% of returns )Here:
+$5,071State:
+$9,716
(% of AGI for various income ranges: -0.5% for AGIs below $10k , 0.2% for AGIs $10k-25k , 0.1% for AGIs $25k-50k , 0.6% for AGIs $50k-75k , 0.7% for AGIs $75k-100k , 5.6% for AGIs over 100k ) Profit/loss from business: +$5,181 (reported on 8.1% of returns )Here:
+$5,181State:
+$14,267
(% of AGI for various income ranges: 5.2% for AGIs below $10k , 3.6% for AGIs $10k-25k , 0.4% for AGIs $25k-50k , 0.7% for AGIs $50k-75k , 1.3% for AGIs $75k-100k , 1.4% for AGIs over 100k ) IRA payment deduction: $2,246 (reported on 1.5% of returns )19151:
$2,246Pennsylvania:
$2,903
(% of AGI for various income ranges: 0.2% for AGIs $10k-25k , 0.1% for AGIs $25k-50k , 0.1% for AGIs $50k-75k , 0.1% for AGIs $75k-100k ) Self-employed pension: $15,381 (reported on 0.2% of returns )Here:
$15,381Pennsylvania:
$14,674
Total itemized deductions: $15,168 (28% of AGI, reported on 35.1% of returns )Here:
$15,168State:
$18,804
Here:
28.2% of AGIState:
19.5% of AGI
(% of AGI for various income ranges: 6.0% for AGIs below $10k , 8.1% for AGIs $10k-25k , 16.6% for AGIs $25k-50k , 21.3% for AGIs $50k-75k , 19.2% for AGIs $75k-100k , 17.6% for AGIs over 100k ) Charity contributions deductions: $3,477 (6% of AGI, reported on 31.6% of returns )Here:
6.3% of AGIState:
3.3% of AGI
(% of AGI for various income ranges: 0.6% for AGIs below $10k , 1.5% for AGIs $10k-25k , 3.5% for AGIs $25k-50k , 4.4% for AGIs $50k-75k , 4.3% for AGIs $75k-100k , 3.3% for AGIs over 100k ) Total tax: $3,755 (reported on 64.6% of returns )(% of AGI for various income ranges: 1.7% for AGIs below $10k , 3.0% for AGIs $10k-25k , 5.4% for AGIs $25k-50k , 8.7% for AGIs $50k-75k , 10.1% for AGIs $75k-100k , 15.9% for AGIs over 100k ) Earned income credit: $1,790 (reported on 27.9% of returns )Percentage of individuals using paid preparers for their 2004 taxes: 54.1%(% for various income ranges: 53.9% for AGIs below $10k , 58.0% for AGIs $10k-25k , 52.0% for AGIs $25k-50k , 51.0% for AGIs $50k-75k , 53.9% for AGIs $75k-100k , 56.9% for AGIs over 100k )
Estimated median household income in 2022: This zip code:
$52,328Pennsylvania:
$71,798
Nearest zip codes: 19082 ,
19066 ,
19096 ,
19139 ,
19004 ,
19131 .
Philadelphia Zip Code Map
Percentage of family households: This zip code:
43.2%Pennsylvania:
42.6%
Percentage of households with unmarried partners: This zip code:
5.5%Pennsylvania:
46.5%
No gay or lesbian households reported
Household received Food Stamps/SNAP in the past 12 months: 3,196Household did not receive Food Stamps/SNAP in the past 12 months: 10,338
Women who had a birth in the past 12 months: 174 (159 now married , 21 unmarried) Women who did not have a birth in the past 12 months: 8,365 (1,986 now married , 6,425 unmarried)
Housing units in zip code 19151 with a mortgage: 5,765 (559
second mortgage , 102
home equity loan , 398
both second mortgage and home equity loan )
Houses without a mortgage: 144
Median monthly owner costs for units with a mortgage: $1,260
Median monthly owner costs for units without a mortgage: $544
Residents with income below the poverty level in 2022:
This zip code:
20.8%Whole state:
11.8%
Residents with income below 50% of the poverty level in 2022:
This zip code:
8.6%Whole state:
6.1%
Median number of rooms in houses and condos: Median number of rooms in apartments: Notable locations in this zip code not listed on our city pages
Click to draw/clear zip code borders Notable locations in zip code 19151: (A) , Overbrook Station (B) , Haddington Branch Library Free Library of Philadelphia (C) , E R Tustin Community Center (D) , Overbrook Park Branch Library Free Library of Philadelphia (E) , Philadelphia Fire Department Engine 41 (F) , Philadelphia Fire Department Engine 54 (G) , Philadelphia District 19 Police Station (H) , Rose Community Center (I) . Display/hide their locations on the map
Churches in zip code 19151 include: (A) , Saint Johns Church (B) , Cooper Church (C) , Temple Beth T' Fillah (D) , Mount Herman Church (E) , Saint Pauls Church (F) , Calvin Church (G) . Display/hide their locations on the map
Creek: (A) . Display/hide its location on the map
Parks in zip code 19151 include: (1) , Morris Park (2) . Display/hide their locations on the map
Year house built (houses)
14 2020 or later281 2010 to 201945 2000 to 2009355 1990 to 1999293 1980 to 1989684 1970 to 19791,111 1960 to 19692,186 1950 to 19592,825 1940 to 19496,900 1939 or earlier
Zip code 19151 household income distribution in 2022 1,608 Less than $10,000981 $10,000 to $14,999410 $15,000 to $19,999490 $20,000 to $24,999744 $25,000 to $29,999416 $30,000 to $34,999202 $35,000 to $39,9991,356 $40,000 to $44,999336 $45,000 to $49,999957 $50,000 to $59,9991,438 $60,000 to $74,9991,678 $75,000 to $99,9991,121 $100,000 to $124,999515 $125,000 to $149,999966 $150,000 to $199,999404 $200,000 or moreEstimate of home value of owner-occupied houses/condos in 2022 in zip code 19151 77 Less than $10,00061 $10,000 to $14,99950 $15,000 to $19,99911 $20,000 to $24,99964 $30,000 to $34,999160 $35,000 to $39,99942 $40,000 to $49,99917 $50,000 to $59,99931 $60,000 to $69,999312 $70,000 to $79,999120 $80,000 to $89,999159 $90,000 to $99,999968 $100,000 to $124,999803 $125,000 to $149,9991,335 $150,000 to $174,999874 $175,000 to $199,9991,121 $200,000 to $249,999811 $250,000 to $299,999544 $300,000 to $399,999160 $400,000 to $499,999108 $500,000 to $749,99954 $750,000 to $999,99922 $1,000,000 to $1,499,99921 $2,000,000 or moreRent paid by renters in 2022 in zip code 19151 61 Less than $10033 $100 to $14971 $150 to $199101 $200 to $24950 $300 to $34966 $350 to $39992 $400 to $44948 $450 to $49949 $500 to $549178 $550 to $59954 $600 to $649105 $650 to $69930 $700 to $749577 $750 to $799668 $800 to $899576 $900 to $9991,097 $1,000 to $1,249350 $1,250 to $1,49962 $1,500 to $1,99990 $2,000 to $2,49912 $3,000 to $3,499476 No cash rent
Median gross rent in 2022: $1,071.
Median price asked for vacant for-sale houses and condos in 2022: $159,329.
Estimated median house (or condo) value in 2022 for: White Non-Hispanic householders: $193,477Black or African American householders: $173,111American Indian or Alaska Native householders: $210,166Asian householders: $200,266Some other race householders: $198,003Two or more races householders: $205,075Hispanic or Latino householders: $168,585Estimated median house or condo value in 2022: $181,032
19151:
$181,032Pennsylvania:
$245,500
Lower value quartile - upper value quartile: $134,359 - $244,595
Mean price in 2022: Detached houses: $382,521Here:
$382,521State:
$317,202
Townhouses or other attached units: $260,733Here:
$260,733State:
$254,369
In 2-unit structures: $270,436Here:
$270,436State:
$249,182
In 3-to-4-unit structures: $324,453Here:
$324,453State:
$297,446
In 5-or-more-unit structures: $444,254Here:
$444,254State:
$320,068
Mobile homes: $57,703Here:
$57,703State:
$92,414
Occupied boats, RVs, vans, etc.: $424,146Here:
$424,146State:
$563,750
Housing units in structures:
One, detached: 740One, attached: 10,538Two: 1,2133 or 4: 1,3275 to 9: 27310 to 19: 1820 to 49: 6250 or more: 730Mobile homes: 54Unemployment : 5.8%
Means of transportation to work in zip code 19151 50.6% 7,611 Drove a car alone7.2% 1,088 Carpooled14.7% 2,206 Bus or trolley bus3.5% 524 Streetcar or trolley car2.1% 320 Subway or elevated0.3% 52 Railroad1.0% 155 Taxi0.1% 10 Motorcycle0.1% 16 Bicycle3.2% 485 Walked2.6% 388 Other means8.8% 1,332 Worked at homeTravel time to work (commute) in zip code 19151 390 Less than 5 minutes560 5 to 9 minutes756 10 to 14 minutes962 15 to 19 minutes1,732 20 to 24 minutes1,241 25 to 29 minutes3,026 30 to 34 minutes577 35 to 39 minutes815 40 to 44 minutes1,715 45 to 59 minutes1,368 60 to 89 minutes328 90 or more minutes
Neighborhoods in zip code 19151: Percentage of zip code residents living and working in this county: 77.0%
Household type by relationship:
Households: 33,508
Male householders: 5,853 (2,869 living alone ), Female householders: 7,620 (2,178 living alone )3,339 spouses (3,255 opposite-sex spouses ), 668 unmarried partners , (668 opposite-sex unmarried partners ), 11,486 children (11,244 natural , 51 adopted , 199 stepchildren ), 1,525 grandchildren , 649 brothers or sisters , 208 parents , 75 foster children , 618 other relatives , 879 non-relatives In group quarters: 400 (-1 institutionalized population )
Size of family households: 2,917 2-persons , 1,920 3-persons , 1,679 4-persons , 762 5-persons , 321 6-persons , 72 7-or-more-persons
Size of nonfamily households: 5,047 1-person , 627 2-persons , 7 3-persons , 59 4-persons
2,973 married couples with children. single-parent households (593 men , 3,266 women ).
90.2% of residents of 19151 zip code speak English at home. of residents speak Spanish at home (58% very well, 31% well, 11% not well ).of residents speak other Indo-European language at home (68% very well, 26% well, 5% not well ).of residents speak Asian or Pacific Island language at home (82% very well, 18% well ).of residents speak other language at home (69% very well, 21% well, 8% not well, 1% not at all ).
Foreign born population: 3,424 (10.2%)
(62.2%
of them are naturalized citizens )
This zip code:
10.2%Whole state:
7.5%
15% Haiti 15% Uruguay 13% Democratic Republic of Congo (Zaire) 8% Grenada 7% Cabo Verde 5% Thailand 4% Liberia 3% African 2% Jamaican 2% Haitian 1% American 1% Italian 1% English 0% Nigerian
Year of entry for the foreign-born population
1,573 2010 or later 685 2000 to 2009 557 1990 to 1999 688 Before 1990
There are
62 Medical Specialists in Zip Code 19151 .
Facilities with environmental interests located in this zip code:
AMOCO 84769 (7554 CITY LINE in PHILADELPHIA, PA)
STATE MASTER (Pennsylvania database) - RCRIS-PAD987359866, HAZARDOUS WASTE PROGRAM Small Quantity Generators, between 100 kg and 1000 kg of hazardous waste/month (Resource Conservation and Recovery Act (tracking hazardous waste)) - notification Small Quantity Generators, between 100 kg and 1000 kg of hazardous waste/month (Resource Conservation and Recovery Act (tracking hazardous waste)) - notification Organizations: AMOCO OIL COMPANY (CONTACT/OWNER)
, SHOOSTER BROTHERS (CONTACT/OWNER)
Alternative names: AMOCO 84769 TANKS, JOHNS AMOCO STATION
ASHBOURNE CLEANERS (6700 HAVERFORD AVE in PHILADELPHIA, PA)
AIR MINOR (AIRS/AFS) Small Quantity Generators, between 100 kg and 1000 kg of hazardous waste/month (Resource Conservation and Recovery Act (tracking hazardous waste)) - notification Business SIC classification: COIN-OPERATED LAUNDRIES AND DRYCLEANINGOrganizations: OPERNAME (CONTACT/OPERATOR)
, LEE, JONG KIL (CONTACT/OWNER)
Alternative names: ASHBOURNE CLNR SVC
AMOCO SERVICE STATION (76 CITY LINE AVE in PHILADELPHIA, PA)
Conditionally Exempt Small Quantity Generators, less than 100 kg/month of hazardous waste (Resource Conservation and Recovery Act (tracking hazardous waste)) - notification Organizations: OPERNAME (CONTACT/OPERATOR)
ATWOOD AUTO BODY (523 ATWOOD RD in PHILADELPHIA, PA)
Small Quantity Generators, between 100 kg and 1000 kg of hazardous waste/month (Resource Conservation and Recovery Act (tracking hazardous waste)) - notification Organizations: OPERNAME (CONTACT/OPERATOR)
, GEIGER, CHARLES (CONTACT/OWNER)
AUTO CRAFT COLLISION CTR (6229-31 GIRARD AVE in PHILADELPHIA, PA)
Conditionally Exempt Small Quantity Generators, less than 100 kg/month of hazardous waste (Resource Conservation and Recovery Act (tracking hazardous waste)) - notification Organizations: BELTRANTE JOSEPH (CONTACT/OWNER)
Housing units lacking complete plumbing facilities: 2.4%
Housing units lacking complete kitchen facilities: 4.2%
79.5% Utility gas 15.3% Electricity 2.2% Fuel oil, kerosene, etc. 1.3% Bottled, tank, or LP gas 0.7% No fuel used 0.7% Other fuel
Population in 1990: 36,265.
Place of birth for U.S.-born residents:
This state: 26,329Northeast: 1,160Midwest: 325South: 1,815West: 310
61% of the 19151 zip code residents lived in the same house 5 years ago.
Out of people who lived in different houses, 78% lived in this county.
Out of people who lived in different counties, 50% lived in Pennsylvania.
97% of the 19151 zip code residents lived in the same house 1 year ago.
Out of people who lived in different houses, 93% moved from this county.
Out of people who lived in different houses, 2% moved from different county within same state.
Out of people who lived in different houses, 1% moved from different state.
Out of people who lived in different houses, 11% moved from abroad.
Private vs. public school enrollment:
Students in private schools in grades 1 to 8 (elementary and middle school): 738
Here:
16.8%Pennsylvania:
15.7%
Students in private schools in grades 9 to 12 (high school): 737
Here:
38.4%Pennsylvania:
13.4%
Students in private undergraduate colleges: 1,063
Here:
62.7%Pennsylvania:
39.8%
Occupation by median earnings in the past 12 months ($)
84,881 Law enforcement workers including supervisors 74,137 Health diagnosing and treating practitioners and other technical occupations 71,835 Fire fighting and prevention, and other protective service workers including supervisors 66,797 Life, physical, and social science occupations 65,200 Arts, design, entertainment, sports, and media occupations 63,028 Management occupations
Companies with federal contracts located in this zip code:
SUPERIOR LANDSCAPING COMPANY I (6625 CALLOWHILL ST in PHILADELPHIA, PA; small business) in 135 contracts from 2001 to 2006
Contracts for Landscaping/Groundskeeping Services, Custodial Janitorial Services, Maintenance, Repair and Rebuilding of Equipment -- Water Purification and Sewage Treatment Equipment, Installation of Equipment -- Water Purification and Sewage Treatment Equipment, and more by Air Force, NavySigned by year: 2000: $0; 2001: $1,208,848; 2002: $2,365,056; 2003: $2,990,143; 2004: $2,844,217; 2005: $3,118,840; 2006: $1,477,819.
Biggest contracts: with Air Force for Landscaping/Groundskeeping Services. Taking place in DC. Signed on 2002-10-16. Completion date: 2003-09-30.
, same as above. Signed on 2004-10-01. Completion date: 2005-09-30.
, same as above. Signed on 2003-10-01. Completion date: 2006-09-30.
, same as above. Signed on 2001-10-01. Completion date: 2002-09-30.
Top industries in this zip code by the number of employees in 2005:
Educational Services: Elementary and Secondary Schools (250-499 employees: 1 establishment, 20-49 employees: 1 establishment, 10-19 employees: 2 establishments)Health Care and Social Assistance: Residential Mental Retardation Facilities (50-99: 2, 10-19: 2, 5-9: 4)Other Services (except Public Administration): Religious Organizations (20-49: 2, 10-19: 5, 5-9: 4, 1-4: 4)Other Services (except Public Administration): Computer and Office Machine Repair and Maintenance (100-249: 1)Health Care and Social Assistance: Other Individual and Family Services (50-99: 1, 20-49: 1)Health Care and Social Assistance: Child Day Care Services (10-19: 3, 5-9: 5, 1-4: 9)Accommodation and Food Services: Limited-Service Restaurants (20-49: 1, 10-19: 1, 5-9: 3, 1-4: 9)
People in group quarters in 2010:
115 people in college/university student housing
91 people in emergency and transitional shelters (with sleeping facilities) for people experiencing homelessness
50 people in group homes intended for adults
33 people in workers' group living quarters and job corps centers
29 people in other noninstitutional facilities
People in group quarters in 2000:
453 people in college dormitories (includes college quarters off campus)
57 people in religious group quarters
29 people in homes for the mentally retarded
28 people in institutions for the blind
13 people in homes for the mentally ill
10 people in other nonhousehold living situations
9 people in other group homes
Fatal accident statistics in 2012:
Fatal accident count: 1Vehicles involved in fatal accidents: 2Fatal accidents caused by drunken drivers: 0Fatalities: 1Persons involved in fatal accidents: 2Pedestrians involved in fatal accidents: 1
Fatal accident statistics in 2011:
Fatal accident count: 1Vehicles involved in fatal accidents: 1Fatal accidents caused by drunken drivers: 0Fatalities: 1Persons involved in fatal accidents: 1Pedestrians involved in fatal accidents: 0
Home Mortgage Disclosure Act Aggregated Statistics For Year 2009(Based on 6 full and 10 partial tracts) A) FHA, FSA/RHS & VA B) Conventional C) Refinancings D) Home Improvement Loans E) Loans on Dwellings For 5+ Families F) Non-occupant Loans on G) Loans On Manufactured Number Average Value Number Average Value Number Average Value Number Average Value Number Average Value Number Average Value Number Average Value
LOANS ORIGINATED 285 $125,906 97 $116,511 548 $121,532 127 $33,848 3 $6,013,847 79 $87,076 0 $0 APPLICATIONS APPROVED, NOT ACCEPTED 12 $140,066 7 $145,506 94 $107,421 17 $31,148 0 $0 1 $3,000 0 $0 APPLICATIONS DENIED 56 $134,353 39 $95,265 509 $114,810 298 $26,899 0 $0 52 $81,956 2 $248,725 APPLICATIONS WITHDRAWN 38 $119,387 29 $154,116 278 $110,878 25 $78,232 0 $0 27 $95,295 0 $0 FILES CLOSED FOR INCOMPLETENESS 16 $102,107 4 $139,432 78 $132,981 13 $71,435 0 $0 5 $63,878 0 $0
Aggregated Statistics For Year 2008(Based on 6 full and 10 partial tracts) A) FHA, FSA/RHS & VA B) Conventional C) Refinancings D) Home Improvement Loans E) Loans on Dwellings For 5+ Families F) Non-occupant Loans on G) Loans On Manufactured Number Average Value Number Average Value Number Average Value Number Average Value Number Average Value Number Average Value Number Average Value
LOANS ORIGINATED 261 $123,173 236 $134,947 702 $106,824 184 $44,513 5 $3,727,638 133 $92,744 4 $12,935 APPLICATIONS APPROVED, NOT ACCEPTED 13 $114,696 38 $121,392 150 $113,257 63 $42,663 0 $0 31 $80,913 0 $0 APPLICATIONS DENIED 50 $141,952 104 $110,129 993 $114,369 494 $32,291 0 $0 149 $97,408 7 $51,896 APPLICATIONS WITHDRAWN 36 $110,249 19 $173,746 267 $110,129 49 $61,047 0 $0 26 $112,244 0 $0 FILES CLOSED FOR INCOMPLETENESS 9 $103,327 24 $114,792 99 $125,566 8 $60,885 0 $0 8 $130,206 0 $0
Aggregated Statistics For Year 2007(Based on 6 full and 10 partial tracts) A) FHA, FSA/RHS & VA B) Conventional C) Refinancings D) Home Improvement Loans E) Loans on Dwellings For 5+ Families F) Non-occupant Loans on G) Loans On Manufactured Number Average Value Number Average Value Number Average Value Number Average Value Number Average Value Number Average Value Number Average Value
LOANS ORIGINATED 79 $129,144 659 $111,085 1,049 $99,848 279 $46,372 9 $1,097,654 296 $101,379 0 $0 APPLICATIONS APPROVED, NOT ACCEPTED 5 $65,182 111 $93,653 255 $97,379 77 $41,248 2 $2,509,175 73 $91,310 0 $0 APPLICATIONS DENIED 19 $130,716 246 $125,633 1,278 $102,121 637 $37,269 2 $131,525 251 $91,390 2 $995 APPLICATIONS WITHDRAWN 14 $132,826 108 $124,540 535 $106,546 81 $55,059 0 $0 52 $90,208 2 $58,700 FILES CLOSED FOR INCOMPLETENESS 0 $0 53 $138,785 148 $114,888 7 $107,264 0 $0 24 $104,485 0 $0
Aggregated Statistics For Year 2006(Based on 6 full and 10 partial tracts) A) FHA, FSA/RHS & VA B) Conventional C) Refinancings D) Home Improvement Loans E) Loans on Dwellings For 5+ Families F) Non-occupant Loans on G) Loans On Manufactured Number Average Value Number Average Value Number Average Value Number Average Value Number Average Value Number Average Value Number Average Value
LOANS ORIGINATED 95 $115,973 940 $104,155 1,299 $94,953 415 $43,773 20 $895,786 362 $89,818 0 $0 APPLICATIONS APPROVED, NOT ACCEPTED 9 $124,626 159 $89,998 316 $86,424 73 $34,635 0 $0 92 $72,287 0 $0 APPLICATIONS DENIED 22 $135,255 375 $109,488 1,605 $97,962 714 $32,481 5 $1,279,070 276 $76,912 8 $50,344 APPLICATIONS WITHDRAWN 16 $138,222 168 $102,416 723 $90,556 59 $58,380 2 $77,720 71 $85,595 0 $0 FILES CLOSED FOR INCOMPLETENESS 4 $89,042 51 $103,942 265 $99,320 6 $102,435 0 $0 22 $83,987 0 $0
Aggregated Statistics For Year 2005(Based on 6 full and 10 partial tracts) A) FHA, FSA/RHS & VA B) Conventional C) Refinancings D) Home Improvement Loans E) Loans on Dwellings For 5+ Families F) Non-occupant Loans on G) Loans On Manufactured Number Average Value Number Average Value Number Average Value Number Average Value Number Average Value Number Average Value Number Average Value
LOANS ORIGINATED 72 $93,925 780 $94,316 1,261 $85,693 295 $39,441 9 $2,343,433 336 $73,571 0 $0 APPLICATIONS APPROVED, NOT ACCEPTED 3 $70,123 122 $88,012 325 $81,337 60 $31,264 0 $0 51 $72,888 0 $0 APPLICATIONS DENIED 13 $77,332 324 $81,458 1,794 $82,774 767 $25,362 2 $223,750 321 $45,320 15 $61,383 APPLICATIONS WITHDRAWN 12 $98,078 173 $95,964 780 $87,075 129 $127,714 4 $79,782 90 $77,180 0 $0 FILES CLOSED FOR INCOMPLETENESS 2 $109,605 49 $105,525 297 $94,569 6 $93,413 0 $0 20 $79,929 0 $0
Aggregated Statistics For Year 2004(Based on 6 full and 10 partial tracts) A) FHA, FSA/RHS & VA B) Conventional C) Refinancings D) Home Improvement Loans E) Loans on Dwellings For 5+ Families F) Non-occupant Loans on G) Loans On Manufactured Number Average Value Number Average Value Number Average Value Number Average Value Number Average Value Number Average Value Number Average Value
LOANS ORIGINATED 148 $81,402 602 $81,720 1,088 $77,049 275 $33,753 8 $1,052,114 255 $65,280 2 $7,040 APPLICATIONS APPROVED, NOT ACCEPTED 11 $62,586 125 $85,561 376 $76,388 65 $23,918 0 $0 60 $61,252 2 $8,955 APPLICATIONS DENIED 36 $69,912 197 $87,587 1,851 $72,450 587 $26,082 3 $99,090 204 $42,509 4 $34,442 APPLICATIONS WITHDRAWN 14 $100,484 100 $84,103 645 $75,851 71 $65,940 0 $0 37 $60,342 0 $0 FILES CLOSED FOR INCOMPLETENESS 3 $139,380 37 $82,424 440 $90,219 22 $28,898 0 $0 15 $65,522 0 $0
Aggregated Statistics For Year 2003(Based on 6 full and 10 partial tracts) A) FHA, FSA/RHS & VA B) Conventional C) Refinancings D) Home Improvement Loans E) Loans on Dwellings For 5+ Families F) Non-occupant Loans on Number Average Value Number Average Value Number Average Value Number Average Value Number Average Value Number Average Value
LOANS ORIGINATED 190 $74,927 455 $78,668 1,363 $80,616 165 $24,784 4 $1,113,110 214 $68,523 APPLICATIONS APPROVED, NOT ACCEPTED 25 $72,925 84 $79,340 380 $70,876 55 $21,478 3 $801,550 58 $58,311 APPLICATIONS DENIED 14 $89,895 156 $81,677 1,694 $72,120 371 $19,115 4 $65,762 122 $47,235 APPLICATIONS WITHDRAWN 23 $79,463 85 $83,612 553 $75,416 38 $32,609 0 $0 45 $79,711 FILES CLOSED FOR INCOMPLETENESS 6 $68,625 22 $78,122 101 $79,425 12 $20,454 0 $0 5 $53,660
Aggregated Statistics For Year 2002(Based on 6 full and 10 partial tracts) A) FHA, FSA/RHS & VA B) Conventional C) Refinancings D) Home Improvement Loans E) Loans on Dwellings For 5+ Families F) Non-occupant Loans on Number Average Value Number Average Value Number Average Value Number Average Value Number Average Value Number Average Value
LOANS ORIGINATED 267 $69,962 349 $477,839 795 $368,486 124 $28,691 6 $566,153 167 $1,169,475 APPLICATIONS APPROVED, NOT ACCEPTED 17 $77,931 69 $65,815 375 $65,562 62 $34,120 2 $11,185 33 $56,266 APPLICATIONS DENIED 36 $4,108,224 128 $57,734 1,300 $72,201 334 $17,108 2 $71,920 55 $57,053 APPLICATIONS WITHDRAWN 16 $86,687 62 $82,413 327 $66,614 28 $36,339 2 $62,505 20 $82,006 FILES CLOSED FOR INCOMPLETENESS 13 $68,534 39 $60,986 197 $70,023 6 $13,525 0 $0 26 $58,706
Aggregated Statistics For Year 2001(Based on 6 full and 10 partial tracts) A) FHA, FSA/RHS & VA B) Conventional C) Refinancings D) Home Improvement Loans E) Loans on Dwellings For 5+ Families F) Non-occupant Loans on Number Average Value Number Average Value Number Average Value Number Average Value Number Average Value Number Average Value
LOANS ORIGINATED 369 $68,216 362 $73,616 630 $68,699 145 $15,650 3 $1,147,270 114 $59,895 APPLICATIONS APPROVED, NOT ACCEPTED 23 $68,969 101 $54,691 249 $53,078 51 $22,582 2 $35,960 39 $50,926 APPLICATIONS DENIED 19 $58,495 188 $60,747 1,112 $54,971 406 $15,787 3 $291,937 73 $50,046 APPLICATIONS WITHDRAWN 25 $64,822 60 $62,278 330 $59,991 73 $26,077 0 $0 27 $52,920 FILES CLOSED FOR INCOMPLETENESS 11 $63,204 8 $36,776 151 $64,725 9 $14,789 0 $0 9 $49,171
Aggregated Statistics For Year 2000(Based on 6 full and 10 partial tracts) A) FHA, FSA/RHS & VA B) Conventional C) Refinancings D) Home Improvement Loans E) Loans on Dwellings For 5+ Families F) Non-occupant Loans on Number Average Value Number Average Value Number Average Value Number Average Value Number Average Value Number Average Value
LOANS ORIGINATED 436 $64,539 417 $71,693 378 $47,156 245 $14,116 2 $51,940 72 $49,729 APPLICATIONS APPROVED, NOT ACCEPTED 22 $67,856 77 $57,774 190 $49,029 111 $16,933 0 $0 15 $52,591 APPLICATIONS DENIED 22 $73,467 232 $55,875 830 $42,152 499 $14,678 2 $72,225 56 $48,322 APPLICATIONS WITHDRAWN 34 $74,193 98 $59,685 427 $47,130 73 $24,205 0 $0 46 $52,628 FILES CLOSED FOR INCOMPLETENESS 7 $64,921 24 $51,620 123 $59,390 2 $10,000 0 $0 7 $31,439
Aggregated Statistics For Year 1999(Based on 4 full and 5 partial tracts) A) FHA, FSA/RHS & VA B) Conventional C) Refinancings D) Home Improvement Loans E) Loans on Dwellings For 5+ Families F) Non-occupant Loans on Number Average Value Number Average Value Number Average Value Number Average Value Number Average Value Number Average Value
LOANS ORIGINATED 221 $64,964 236 $67,256 384 $53,718 148 $14,299 0 $0 65 $54,406 APPLICATIONS APPROVED, NOT ACCEPTED 6 $68,305 62 $56,336 206 $53,288 72 $16,917 2 $74,485 20 $48,252 APPLICATIONS DENIED 15 $67,719 111 $55,869 480 $46,301 328 $15,282 0 $0 37 $41,590 APPLICATIONS WITHDRAWN 17 $56,788 53 $57,185 280 $47,568 44 $24,313 1 $3,181,850 28 $50,484 FILES CLOSED FOR INCOMPLETENESS 4 $54,135 18 $71,056 71 $53,570 4 $26,855 0 $0 7 $45,336
Private Mortgage Insurance Companies Aggregated Statistics For Year 2009(Based on 4 full and 8 partial tracts) A) Conventional B) Refinancings C) Non-occupant Loans on Number Average Value Number Average Value Number Average Value
LOANS ORIGINATED 22 $173,010 8 $135,066 4 $100,960 APPLICATIONS APPROVED, NOT ACCEPTED 14 $107,725 3 $125,940 0 $0 APPLICATIONS DENIED 7 $193,031 2 $110,600 0 $0 APPLICATIONS WITHDRAWN 0 $0 2 $109,965 0 $0 FILES CLOSED FOR INCOMPLETENESS 4 $80,965 0 $0 0 $0
Aggregated Statistics For Year 2008(Based on 5 full and 10 partial tracts) A) Conventional B) Refinancings C) Non-occupant Loans on Number Average Value Number Average Value Number Average Value
LOANS ORIGINATED 104 $125,641 33 $142,418 18 $77,288 APPLICATIONS APPROVED, NOT ACCEPTED 55 $126,341 25 $125,782 1 $81,000 APPLICATIONS DENIED 32 $111,972 8 $194,086 5 $99,302 APPLICATIONS WITHDRAWN 4 $182,128 2 $130,530 0 $0 FILES CLOSED FOR INCOMPLETENESS 0 $0 2 $291,180 0 $0
Aggregated Statistics For Year 2007(Based on 6 full and 10 partial tracts) A) Conventional B) Refinancings C) Non-occupant Loans on Number Average Value Number Average Value Number Average Value
LOANS ORIGINATED 302 $122,772 82 $114,904 40 $99,013 APPLICATIONS APPROVED, NOT ACCEPTED 46 $114,864 19 $120,872 8 $114,686 APPLICATIONS DENIED 6 $125,560 4 $114,585 0 $0 APPLICATIONS WITHDRAWN 23 $107,490 9 $120,909 6 $73,965 FILES CLOSED FOR INCOMPLETENESS 2 $124,550 2 $127,540 0 $0
Aggregated Statistics For Year 2006(Based on 5 full and 8 partial tracts) A) Conventional B) Refinancings C) Non-occupant Loans on Number Average Value Number Average Value Number Average Value
LOANS ORIGINATED 255 $115,324 53 $123,108 32 $102,956 APPLICATIONS APPROVED, NOT ACCEPTED 39 $99,087 7 $103,590 12 $86,676 APPLICATIONS DENIED 2 $99,125 0 $0 2 $99,125 APPLICATIONS WITHDRAWN 13 $139,598 2 $62,060 2 $113,590 FILES CLOSED FOR INCOMPLETENESS 2 $95,095 2 $118,570 0 $0
Aggregated Statistics For Year 2005(Based on 6 full and 10 partial tracts) A) Conventional B) Refinancings C) Non-occupant Loans on Number Average Value Number Average Value Number Average Value
LOANS ORIGINATED 238 $106,597 63 $94,429 33 $82,718 APPLICATIONS APPROVED, NOT ACCEPTED 28 $87,921 17 $123,228 6 $65,215 APPLICATIONS DENIED 9 $113,374 0 $0 2 $88,545 APPLICATIONS WITHDRAWN 18 $83,655 7 $81,670 3 $72,200 FILES CLOSED FOR INCOMPLETENESS 2 $80,585 0 $0 0 $0
Aggregated Statistics For Year 2004(Based on 6 full and 10 partial tracts) A) Conventional B) Refinancings C) Non-occupant Loans on Number Average Value Number Average Value Number Average Value
LOANS ORIGINATED 278 $83,953 95 $78,534 48 $76,816 APPLICATIONS APPROVED, NOT ACCEPTED 62 $74,888 36 $87,299 7 $67,743 APPLICATIONS DENIED 14 $93,609 2 $226,085 2 $42,190 APPLICATIONS WITHDRAWN 20 $73,388 10 $79,740 0 $0 FILES CLOSED FOR INCOMPLETENESS 2 $85,690 4 $55,715 0 $0
Aggregated Statistics For Year 2003(Based on 6 full and 10 partial tracts) A) Conventional B) Refinancings C) Non-occupant Loans on Number Average Value Number Average Value Number Average Value
LOANS ORIGINATED 248 $77,422 123 $79,693 25 $61,493 APPLICATIONS APPROVED, NOT ACCEPTED 51 $87,737 23 $84,474 10 $94,712 APPLICATIONS DENIED 5 $68,130 6 $61,222 6 $61,222 APPLICATIONS WITHDRAWN 3 $50,953 18 $88,435 2 $51,140 FILES CLOSED FOR INCOMPLETENESS 2 $58,595 0 $0 0 $0
Aggregated Statistics For Year 2002(Based on 6 full and 10 partial tracts) A) Conventional B) Refinancings C) Non-occupant Loans on Number Average Value Number Average Value Number Average Value
LOANS ORIGINATED 156 $72,790 80 $78,356 33 $59,215 APPLICATIONS APPROVED, NOT ACCEPTED 23 $90,804 29 $132,272 7 $52,657 APPLICATIONS DENIED 13 $61,534 4 $63,840 4 $77,045 APPLICATIONS WITHDRAWN 9 $74,011 4 $115,042 0 $0 FILES CLOSED FOR INCOMPLETENESS 2 $33,560 2 $64,725 2 $33,560
Aggregated Statistics For Year 2001(Based on 6 full and 10 partial tracts) A) Conventional B) Refinancings C) Non-occupant Loans on Number Average Value Number Average Value Number Average Value
LOANS ORIGINATED 178 $75,965 30 $87,627 28 $46,954 APPLICATIONS APPROVED, NOT ACCEPTED 31 $68,061 9 $112,689 8 $56,599 APPLICATIONS DENIED 4 $49,928 2 $79,175 3 $39,570 APPLICATIONS WITHDRAWN 1 $38,000 4 $72,240 3 $58,500 FILES CLOSED FOR INCOMPLETENESS 6 $63,778 2 $50,345 0 $0
Aggregated Statistics For Year 2000(Based on 6 full and 8 partial tracts) A) Conventional B) Refinancings C) Non-occupant Loans on Number Average Value Number Average Value Number Average Value
LOANS ORIGINATED 147 $82,049 31 $61,741 15 $79,383 APPLICATIONS APPROVED, NOT ACCEPTED 28 $67,134 6 $54,127 8 $49,354 APPLICATIONS DENIED 10 $48,036 2 $39,955 0 $0 APPLICATIONS WITHDRAWN 2 $52,810 0 $0 0 $0 FILES CLOSED FOR INCOMPLETENESS 0 $0 0 $0 0 $0
Aggregated Statistics For Year 1999(Based on 4 full and 5 partial tracts) A) Conventional B) Refinancings C) Non-occupant Loans on Number Average Value Number Average Value Number Average Value
LOANS ORIGINATED 76 $65,151 30 $67,037 8 $53,674 APPLICATIONS APPROVED, NOT ACCEPTED 9 $64,079 7 $98,196 0 $0 APPLICATIONS DENIED 5 $56,038 0 $0 0 $0 APPLICATIONS WITHDRAWN 0 $0 0 $0 0 $0 FILES CLOSED FOR INCOMPLETENESS 2 $56,870 0 $0 0 $0
2003 - 2018 National Fire Incident Reporting System (NFIRS) incidents See full 2006 National Fire Incident Reporting System statistics for zip code 19151, Pennsylvania
Most common first names in zip code 19151 among deceased individuals Name Count Lived (average)
Mary 368 79.4 years Joseph 347 74.3 years John 344 73.0 years William 277 74.0 years James 265 72.9 years Anna 228 82.3 years Rose 185 79.4 years Charles 166 74.5 years Samuel 158 76.7 years Margaret 146 75.8 years
Most common last names in zip code 19151 among deceased individuals Last name Count Lived (average)
Smith 108 74.9 years Johnson 104 73.2 years Brown 95 72.4 years Williams 87 71.7 years Jones 77 72.2 years Miller 54 74.0 years Cohen 53 75.6 years Robinson 49 71.0 years Wilson 45 74.6 years Harris 39 74.5 years
Businesses in zip code 19151
Name Count Name Count
7-Eleven 1 KFC 1 Applebee's 1 McDonald's 1 AutoZone 1 Payless 1 Baskin-Robbins 1 Popeyes 1 CVS 2 RadioShack 1 Cricket Wireless 1 Rite Aid 2 Domino's Pizza 1 Sears 1 Dunkin Donuts 2 T-Mobile 1 FedEx 1 T.J.Maxx 1 GNC 2 U-Haul 1 GameStop 1 UPS 1 H&R Block 1 Wendy's 1
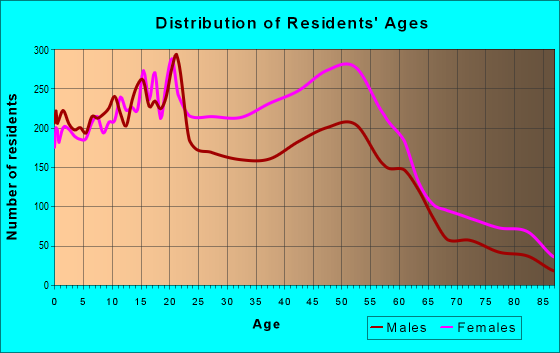
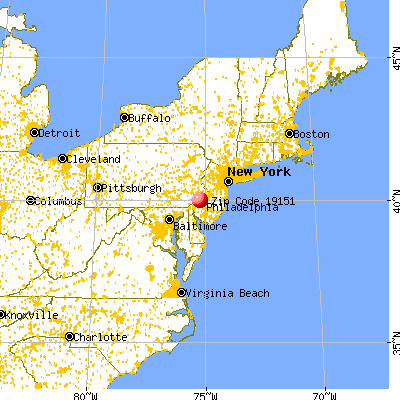


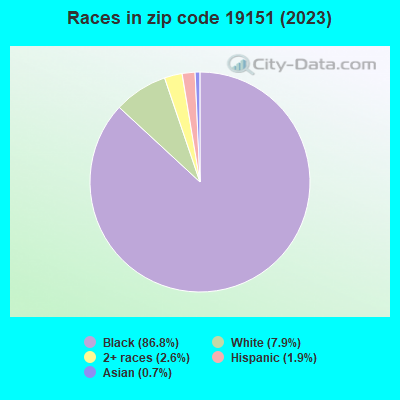


 Nearest zip codes: 19082, 19066, 19096, 19139, 19004, 19131.
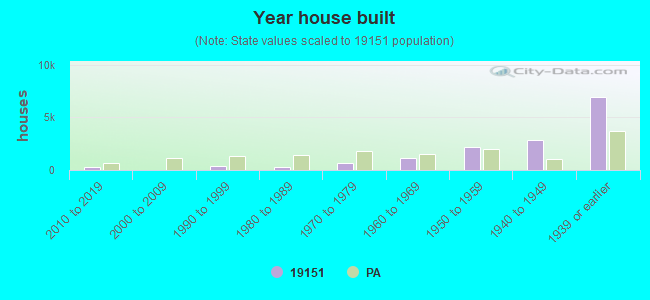

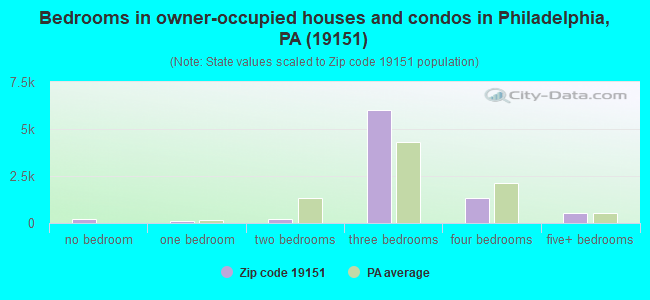
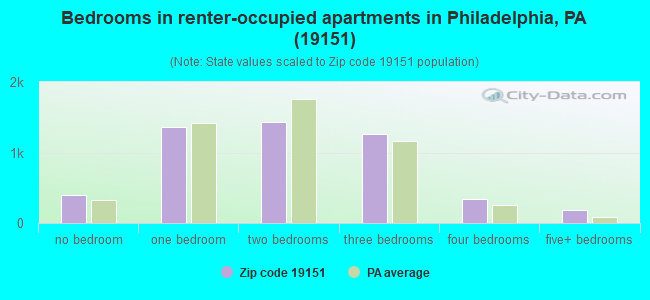
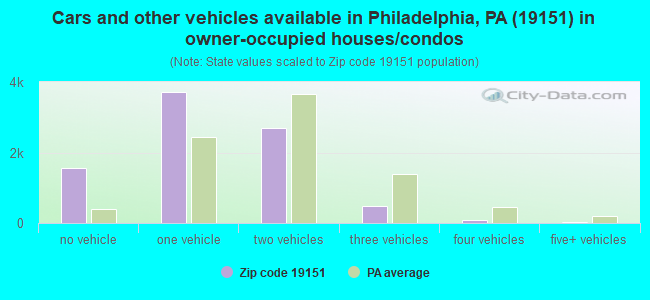
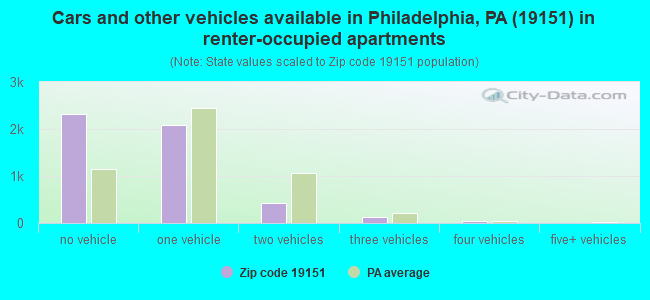


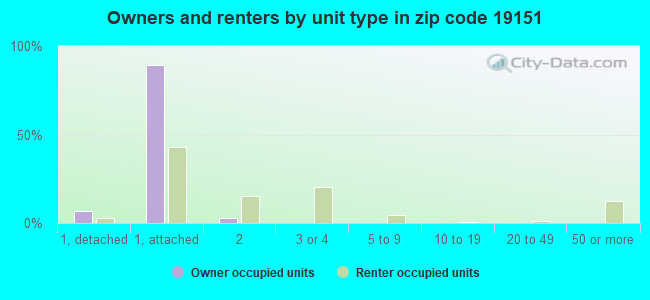
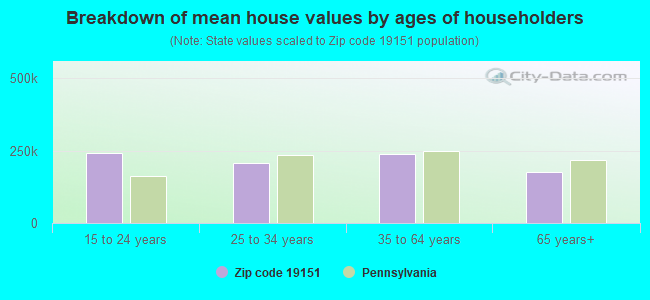


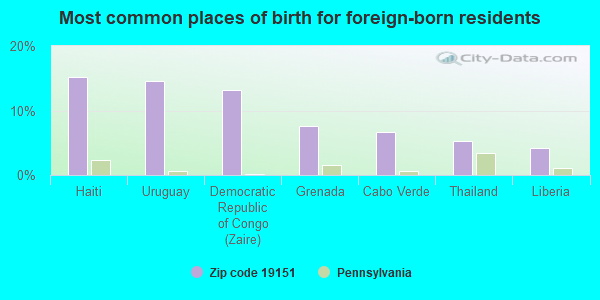
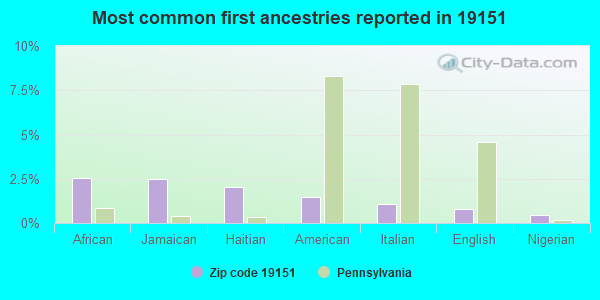
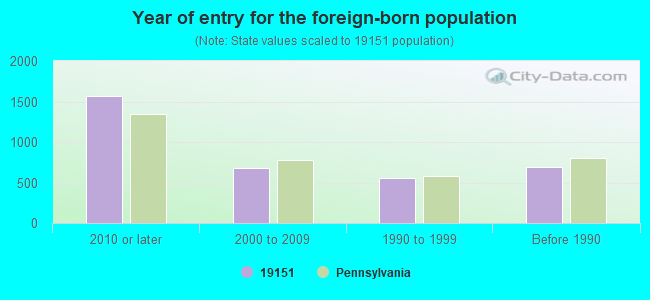


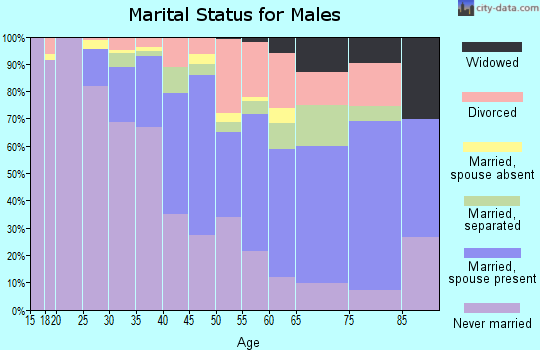
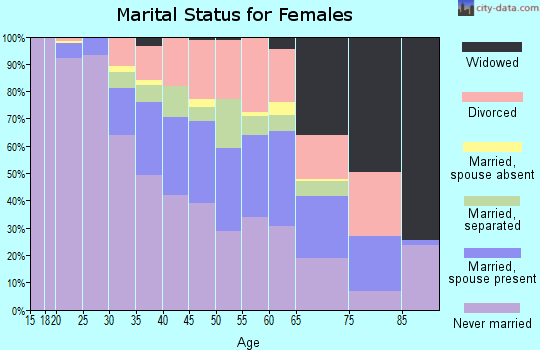
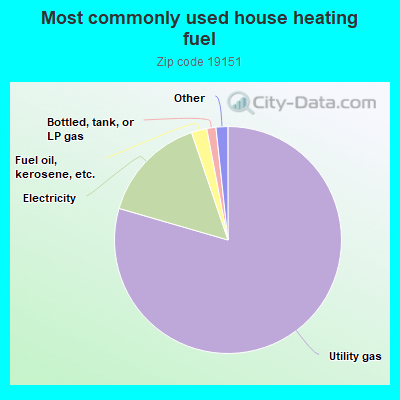
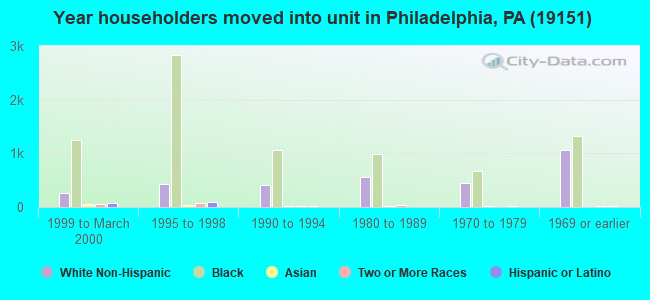
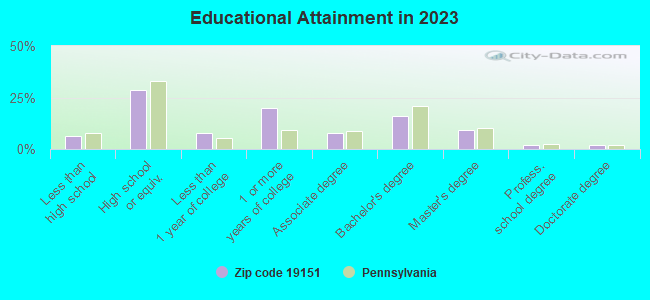
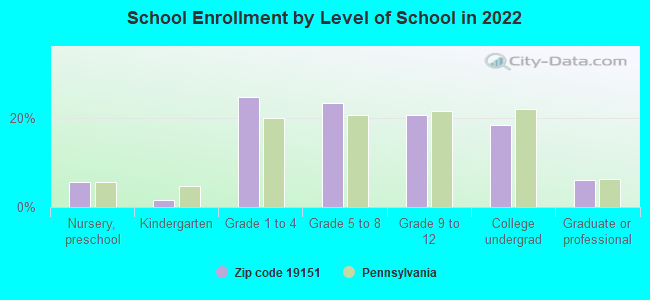
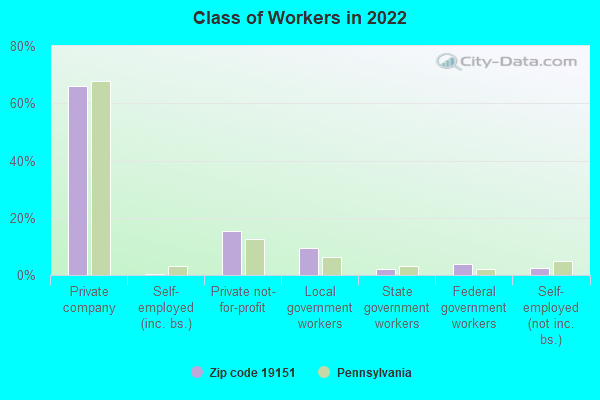
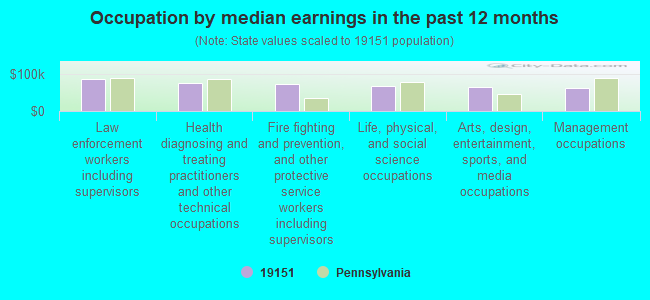
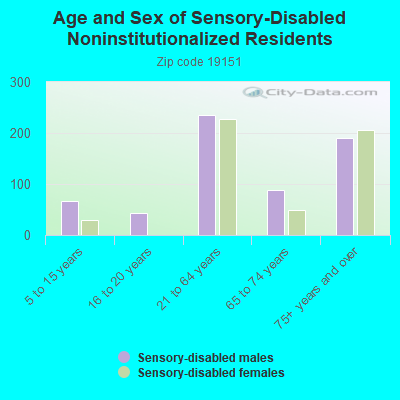
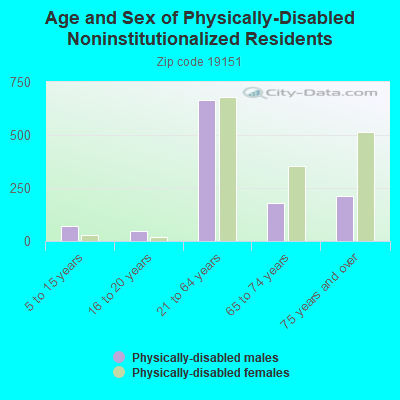
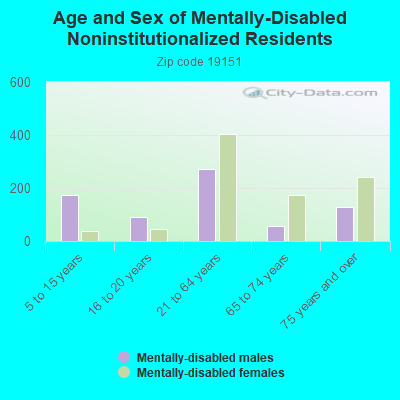

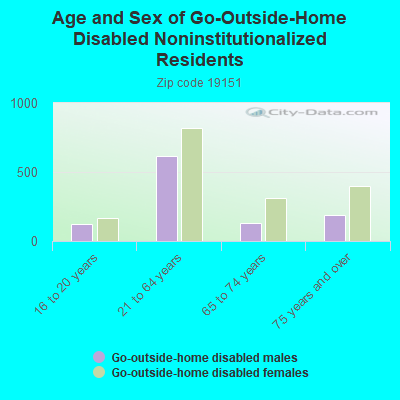
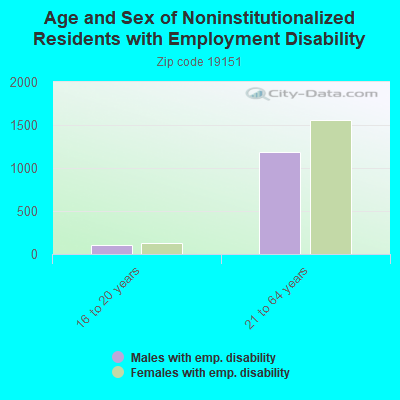
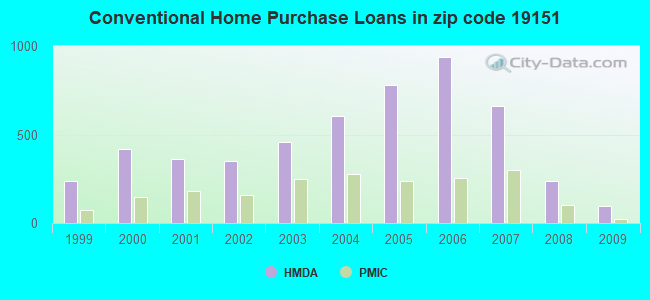
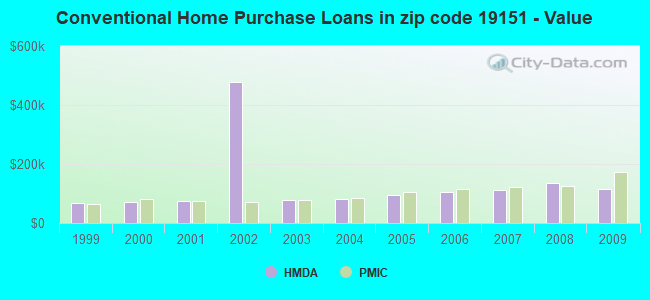
 According to the data from the years 2003 - 2018 the average number of fire incidents per year is 58. The highest number of reported fire incidents - 155 took place in 2010, and the least - 0 in 2006. The data has an increasing trend.
 When looking into fire subcategories, the most reports belonged to: Structure Fires (56.0%), and Outside Fires (22.5%).