Estimated zip code population in 2022: 42,790 Zip code population in 2010: 40,997 Zip code population in 2000: 38,348
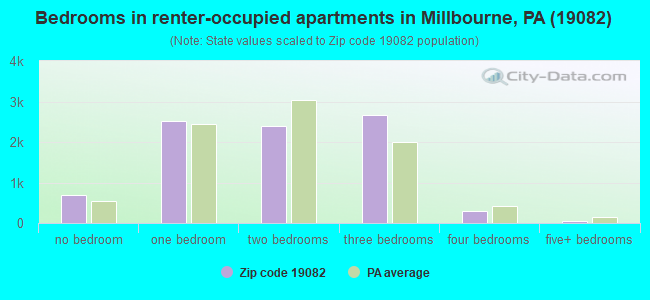
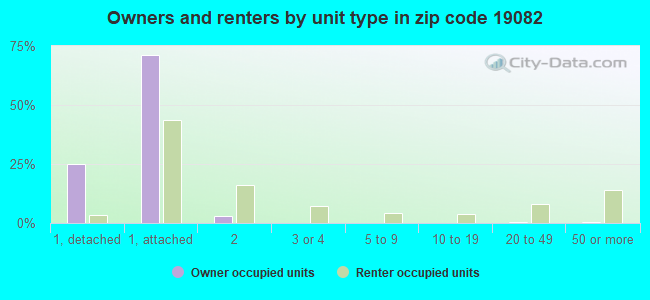
Houses and condos: 17,097 Renter-occupied apartments: 8,607
% of renters here:
53%
State:
31%
March 2022 cost of living index in zip code 19082: 102.4 (near average, U.S. average is 100)
Land area: 2.6 sq. mi. Water area: 0.0 sq. mi.
Population density: 16,523 people per square mile
(very high).
OSM Map
General Map
Google Map
MSN Map
OSM Map
General Map
Google Map
MSN Map
OSM Map
General Map
Google Map
MSN Map
OSM Map
General Map
Google Map
MSN Map
Please wait while loading the map...
Real estate property taxes paid for housing units in 2022:
This zip code:
2.5% ($3,843)
Pennsylvania:
1.3% ($3,094)
Median real estate property taxes paid for housing units with mortgages in 2022: $3,978 (2.4%) Median real estate property taxes paid for housing units with no mortgage in 2022: $3,543 (2.6%)
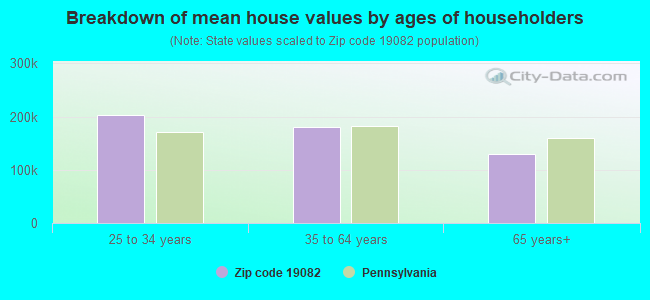
Estimated median house/condo value in 2022: $156,721
19082:
$156,721
Pennsylvania:
$245,500
According to our research of Pennsylvania and other state lists, there were 66 registered sex offenders living in 19082 zip code as of April 27, 2024. The ratio of all residents to sex offenders in zip code 19082 is 626 to 1. The ratio of registered sex offenders to all residents in this zip code is near the state average.
Median resident age:
This zip code:
33.7 years
Pennsylvania median age:
40.9 years
Average household size:
This zip code:
2.6 people
Pennsylvania:
2.4 people
Averages for the 2020 tax year for zip code 19082, filed in 2021:
Average Adjusted Gross Income (AGI) in 2020: $39,201 (Individual Income Tax Returns)
Here:
$39,201
State:
$75,707
Salary/wage: $35,659 (reported on 83.4% of returns)
Here:
$35,659
State:
$62,806
(% of AGI for various income ranges: 1075.7% for AGIs below $25k, 3382.8% for AGIs $25k-50k, 6691.0% for AGIs $50k-75k, 10335.8% for AGIs $75k-100k, 18642.7% for AGIs $100k-200k, 46060.0% for AGIs over 200k)
Taxable interest for individuals: $615 (reported on 12.3% of returns)
This zip code:
$615
Pennsylvania:
$1,633
(% of AGI for various income ranges: 4.6% for AGIs below $25k, 6.2% for AGIs $25k-50k, 10.8% for AGIs $50k-75k, 26.5% for AGIs $75k-100k, 68.9% for AGIs $100k-200k, 177.5% for AGIs over 200k)
Ordinary dividends: $2,152 (reported on 5.7% of returns)
Here:
$2,152
State:
$7,382
(% of AGI for various income ranges: 4.2% for AGIs below $25k, 6.7% for AGIs $25k-50k, 14.0% for AGIs $50k-75k, 45.6% for AGIs $75k-100k, 117.1% for AGIs $100k-200k, 1337.5% for AGIs over 200k)
Net capital gain/loss in AGI: +$6,054 (reported on 6.0% of returns)
Here:
+$6,054
State:
+$23,522
(% of AGI for various income ranges: 1.4% for AGIs below $25k, 12.3% for AGIs $25k-50k, 42.3% for AGIs $50k-75k, 87.1% for AGIs $75k-100k, 405.0% for AGIs $100k-200k, 6625.0% for AGIs over 200k)
Profit/loss from business: +$5,632 (reported on 21.1% of returns)
Here:
+$5,632
State:
+$16,274
(% of AGI for various income ranges: 153.2% for AGIs below $25k, 122.0% for AGIs $25k-50k, 131.6% for AGIs $50k-75k, 262.9% for AGIs $75k-100k, 407.5% for AGIs $100k-200k, 1555.0% for AGIs over 200k)
Taxable individual retirement arrangement distribution: $12,059 (reported on 2.5% of returns)
19082:
$12,059
Pennsylvania:
$18,583
(% of AGI for various income ranges: 15.1% for AGIs below $25k, 16.9% for AGIs $25k-50k, 58.3% for AGIs $50k-75k, 132.1% for AGIs $75k-100k, 360.2% for AGIs $100k-200k)
Total itemized deductions: $26,228 (reported on 4.7% of returns)
Here:
$26,228
State:
$34,850
(% of AGI for various income ranges: 16.7% for AGIs below $25k, 98.5% for AGIs $25k-50k, 265.0% for AGIs $50k-75k, 660.5% for AGIs $75k-100k, 1030.5% for AGIs $100k-200k, 4025.0% for AGIs over 200k)
Charity contributions: $8,851 (reported on 3.8% of returns)
Here:
$8,851
State:
$12,392
(% of AGI for various income ranges: 2.5% for AGIs below $25k, 25.7% for AGIs $25k-50k, 72.9% for AGIs $50k-75k, 185.4% for AGIs $75k-100k, 400.0% for AGIs $100k-200k)
Taxes paid: $7,475 (reported on 4.6% of returns)
19082:
$7,475
State:
$8,200
(% of AGI for various income ranges: 4.4% for AGIs below $25k, 25.2% for AGIs $25k-50k, 81.2% for AGIs $50k-75k, 203.8% for AGIs $75k-100k, 298.8% for AGIs $100k-200k, 552.5% for AGIs over 200k)
Earned income credit: $2,305 (reported on 28.3% of returns)
Here:
$2,305
State:
$2,100
(% of AGI for various income ranges: 123.3% for AGIs below $25k, 100.1% for AGIs $25k-50k, 1.3% for AGIs $50k-75k)
Percentage of individuals using paid preparers for their 2020 taxes: 91.7%
Here:
92%
State:
92%
(% for various income ranges: 91.2% for AGIs below $25k, 93.2% for AGIs $25k-50k, 91.5% for AGIs $50k-75k, 89.7% for AGIs $75k-100k, 89.1% for AGIs $100k-200k, 90.0% for AGIs over 200k)
Averages for the 2012 tax year for zip code 19082, filed in 2013:
Average Adjusted Gross Income (AGI) in 2012: $33,084 (Individual Income Tax Returns)
Here:
$33,084
State:
$61,346
Salary/wage: $32,158 (reported on 86.1% of returns)
Here:
$32,158
State:
$51,902
(% of AGI for various income ranges: 75.9% for AGIs below $25k, 88.7% for AGIs $25k-50k, 86.7% for AGIs $50k-75k, 84.8% for AGIs $75k-100k, 82.7% for AGIs $100k-200k, 57.6% for AGIs over 200k)
Taxable interest for individuals: $693 (reported on 17.1% of returns)
This zip code:
$693
Pennsylvania:
$1,588
(% of AGI for various income ranges: 0.4% for AGIs below $25k, 0.3% for AGIs $25k-50k, 0.4% for AGIs $50k-75k, 0.4% for AGIs $75k-100k, 0.5% for AGIs $100k-200k)
Ordinary dividends: $2,208 (reported on 7.1% of returns)
Here:
$2,208
State:
$5,827
(% of AGI for various income ranges: 0.5% for AGIs below $25k, 0.2% for AGIs $25k-50k, 0.5% for AGIs $50k-75k, 0.7% for AGIs $75k-100k, 1.0% for AGIs $100k-200k)
Net capital gain/loss in AGI: +$2,078 (reported on 4.4% of returns)
Here:
+$2,078
State:
+$14,495
(% of AGI for various income ranges: 0.2% for AGIs $50k-75k, 0.5% for AGIs $75k-100k, 0.4% for AGIs $100k-200k, 5.7% for AGIs over 200k)
Profit/loss from business: +$9,236 (reported on 16.9% of returns)
Here:
+$9,236
State:
+$16,268
(% of AGI for various income ranges: 14.2% for AGIs below $25k, 3.1% for AGIs $25k-50k, 1.6% for AGIs $50k-75k, 1.6% for AGIs $75k-100k, 3.4% for AGIs $100k-200k)
Taxable individual retirement arrangement distribution: $9,197 (reported on 4.2% of returns)
19082:
$9,197
Pennsylvania:
$14,550
(% of AGI for various income ranges: 1.1% for AGIs below $25k, 0.7% for AGIs $25k-50k, 1.5% for AGIs $50k-75k, 1.4% for AGIs $75k-100k, 1.7% for AGIs $100k-200k)
Total itemized deductions: $16,874 (28% of AGI, reported on 23.3% of returns)
Here:
$16,874
State:
$23,538
Here:
27.6% of AGI
State:
18.4% of AGI
(% of AGI for various income ranges: 6.3% for AGIs below $25k, 11.2% for AGIs $25k-50k, 13.8% for AGIs $50k-75k, 15.1% for AGIs $75k-100k, 15.5% for AGIs $100k-200k, 13.0% for AGIs over 200k)
Charity contributions: $2,847 (reported on 17.8% of returns)
Here:
$2,847
State:
$4,025
(% of AGI for various income ranges: 0.5% for AGIs below $25k, 1.4% for AGIs $25k-50k, 1.9% for AGIs $50k-75k, 2.2% for AGIs $75k-100k, 2.2% for AGIs $100k-200k, 2.0% for AGIs over 200k)
Taxes paid: $6,520 (reported on 23.2% of returns)
19082:
$6,520
State:
$9,982
(% of AGI for various income ranges: 2.3% for AGIs below $25k, 3.5% for AGIs $25k-50k, 5.4% for AGIs $50k-75k, 6.6% for AGIs $75k-100k, 7.1% for AGIs $100k-200k, 5.0% for AGIs over 200k)
Earned income credit: $2,413 (reported on 35.0% of returns)
Here:
$2,413
State:
$2,106
(% of AGI for various income ranges: 10.3% for AGIs below $25k, 1.7% for AGIs $25k-50k)
Percentage of individuals using paid preparers for their 2012 taxes: 53.5%
Here:
53%
State:
53%
(% for various income ranges: 55.9% for AGIs below $25k, 51.6% for AGIs $25k-50k, 49.3% for AGIs $50k-75k, 51.6% for AGIs $75k-100k, 49.3% for AGIs $100k-200k, 60.0% for AGIs over 200k)
Averages for the 2004 tax year for zip code 19082, filed in 2005:
Average Adjusted Gross Income (AGI) in 2004: $30,762 (Individual Income Tax Returns)
Here:
$30,762
State:
$48,049
Salary/wage: $30,407 (reported on 87.8% of returns)
Here:
$30,407
State:
$42,646
(% of AGI for various income ranges: 93.0% for AGIs below $10k, 81.3% for AGIs $10k-25k, 91.4% for AGIs $25k-50k, 88.9% for AGIs $50k-75k, 89.8% for AGIs $75k-100k, 71.7% for AGIs over 100k)
Taxable interest for individuals: $1,208 (reported on 29.9% of returns)
This zip code:
$1,208
Pennsylvania:
$1,657
(% of AGI for various income ranges: 2.6% for AGIs below $10k, 1.0% for AGIs $10k-25k, 0.7% for AGIs $25k-50k, 1.0% for AGIs $50k-75k, 1.0% for AGIs $75k-100k, 2.9% for AGIs over 100k)
Taxable dividends: $1,688 (reported on 12.1% of returns)
Here:
$1,688
State:
$3,566
(% of AGI for various income ranges: 1.4% for AGIs below $10k, 0.8% for AGIs $10k-25k, 0.4% for AGIs $25k-50k, 0.6% for AGIs $50k-75k, 0.5% for AGIs $75k-100k, 1.3% for AGIs over 100k)
Net capital gain/loss: +$2,368 (reported on 8.3% of returns)
Here:
+$2,368
State:
+$9,716
(% of AGI for various income ranges: -0.5% for AGIs below $10k, -0.1% for AGIs $10k-25k, 0.0% for AGIs $25k-50k, 0.5% for AGIs $50k-75k, 1.2% for AGIs $75k-100k, 3.6% for AGIs over 100k)
Profit/loss from business: +$8,598 (reported on 12.6% of returns)
Here:
+$8,598
State:
+$14,267
(% of AGI for various income ranges: 12.3% for AGIs below $10k, 8.5% for AGIs $10k-25k, 2.2% for AGIs $25k-50k, 1.2% for AGIs $50k-75k, 1.9% for AGIs $75k-100k, 3.6% for AGIs over 100k)
IRA payment deduction: $2,611 (reported on 2.0% of returns)
19082:
$2,611
Pennsylvania:
$2,903
(% of AGI for various income ranges: 0.2% for AGIs below $10k, 0.2% for AGIs $10k-25k, 0.2% for AGIs $25k-50k, 0.2% for AGIs $50k-75k, 0.1% for AGIs $75k-100k, 0.1% for AGIs over 100k)
Self-employed pension: $5,600 (reported on 0.1% of returns)
Here:
$5,600
Pennsylvania:
$14,674
Total itemized deductions: $14,375 (27% of AGI, reported on 26.7% of returns)
Here:
$14,375
State:
$18,804
Here:
26.5% of AGI
State:
19.5% of AGI
(% of AGI for various income ranges: 5.5% for AGIs below $10k, 7.4% for AGIs $10k-25k, 12.4% for AGIs $25k-50k, 14.7% for AGIs $50k-75k, 15.7% for AGIs $75k-100k, 14.6% for AGIs over 100k)
Charity contributions deductions: $2,735 (5% of AGI, reported on 23.6% of returns)
Here:
$2,735
State:
$3,337
Here:
4.9% of AGI
State:
3.3% of AGI
(% of AGI for various income ranges: 0.5% for AGIs below $10k, 0.9% for AGIs $10k-25k, 2.1% for AGIs $25k-50k, 2.5% for AGIs $50k-75k, 2.5% for AGIs $75k-100k, 3.1% for AGIs over 100k)
Total tax: $3,628 (reported on 67.5% of returns)
19082:
$3,628
State:
$8,008
(% of AGI for various income ranges: 3.4% for AGIs below $10k, 4.1% for AGIs $10k-25k, 6.3% for AGIs $25k-50k, 8.9% for AGIs $50k-75k, 10.5% for AGIs $75k-100k, 15.7% for AGIs over 100k)
Earned income credit: $1,807 (reported on 25.3% of returns)
Here:
$1,807
State:
$1,643
Percentage of individuals using paid preparers for their 2004 taxes: 54.7%
Here:
55%
State:
56%
(% for various income ranges: 50.4% for AGIs below $10k, 60.5% for AGIs $10k-25k, 53.1% for AGIs $25k-50k, 54.7% for AGIs $50k-75k, 47.0% for AGIs $75k-100k, 57.6% for AGIs over 100k)
Likely homosexual households (counted as self-reported same-sex unmarried-partner households)
Lesbian couples: 0.1% of all households
Gay men: 0.1% of all households
Household received Food Stamps/SNAP in the past 12 months: 4,163 Household did not receive Food Stamps/SNAP in the past 12 months: 12,113
Women who had a birth in the past 12 months: 555 (410 now married, 147 unmarried) Women who did not have a birth in the past 12 months: 10,813 (3,948 now married, 6,876 unmarried)
Housing units in zip code 19082 with a mortgage: 5,170 (431 second mortgage, 291 both second mortgage and home equity loan) Houses without a mortgage: 346
Median monthly owner costs for units with a mortgage: $1,375 Median monthly owner costs for units without a mortgage: $591
Residents with income below the poverty level in 2022:
This zip code:
17.5%
Whole state:
11.8%
Residents with income below 50% of the poverty level in 2022:
This zip code:
9.4%
Whole state:
6.1%
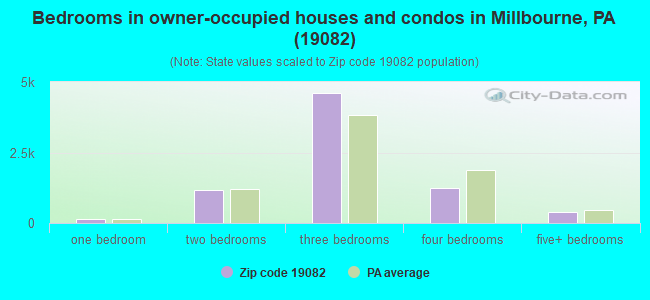
Median number of rooms in houses and condos:
Here:
6.4
State:
6.8
Median number of rooms in apartments:
Here:
4.7
State:
4.3
Notable locations in this zip code not listed on our city pages
Notable locations in zip code 19082: Cardington (A), Philadelphia Electric Country Club (B), Beverly Hills Station (C), Bywood Station (D), 69th Street Station (E), Hilltop Road Station (F), Fairfield Avenue Station (G), Millbourne Station (H), Parkview Station (I), Upper Darby Township Fire Department - Cardington - Stonehurst Fire Company Station 36 (J), Upper Darby Township Fire Department - Highland Park Fire Company Station 26 (K), Millbourne Borough Hall (L), Millbourne Volunteer Fire Company Station 22 (M), Upper Darby Township Fire Department - Upper Darby Fire Company Station 37 (N), Upper Darby Library (O), Upper Darby Township Building (P), Upper Darby Township Police Station (Q). Display/hide their locations on the map
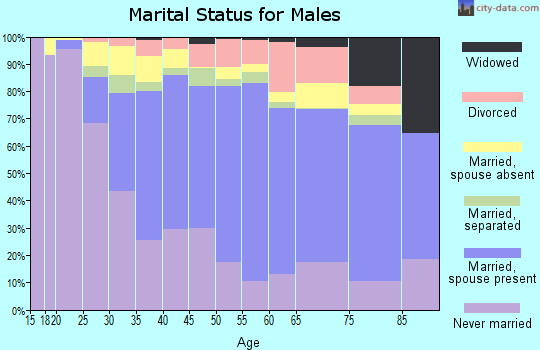
4,971 married couples with children.
4,105 single-parent households (471 men, 3,634 women).
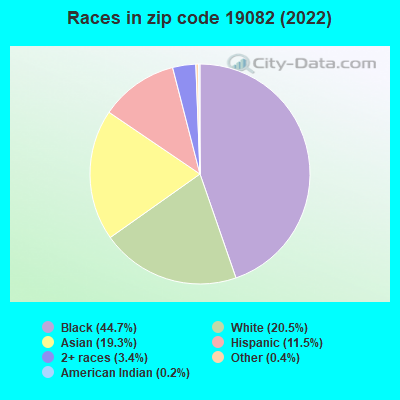
60.4% of residents of 19082 zip code speak English at home.
9.9% of residents speak Spanish at home (55% very well, 21% well, 17% not well, 7% not at all).
16.4% of residents speak other Indo-European language at home (54% very well, 32% well, 10% not well, 4% not at all).
8.9% of residents speak Asian or Pacific Island language at home (40% very well, 26% well, 29% not well, 5% not at all).
5.3% of residents speak other language at home (44% very well, 38% well, 13% not well, 4% not at all).
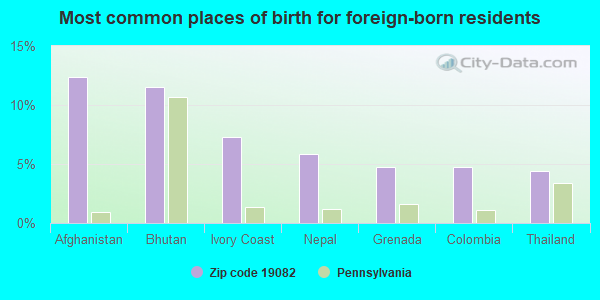
Foreign born population: 15,350 (35.9%) (54.2% of them are naturalized citizens)
This zip code:
35.9%
Whole state:
7.5%
12%Afghanistan
12%Bhutan
7%Ivory Coast
6%Nepal
5%Grenada
5%Colombia
4%Thailand
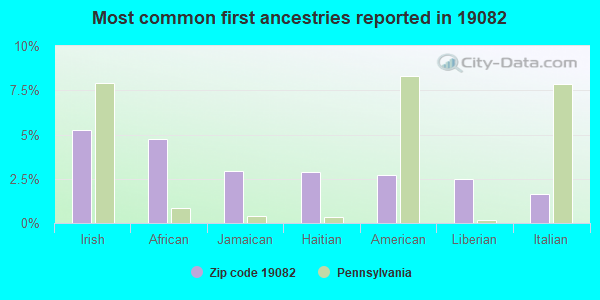
5%Irish
5%African
3%Jamaican
3%Haitian
3%American
2%Liberian
2%Italian
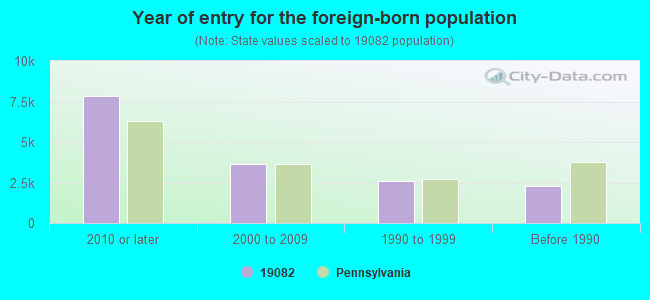
Year of entry for the foreign-born population
7,8262010 or later
3,6522000 to 2009
2,5921990 to 1999
2,306Before 1990
Facilities with environmental interests located in this zip code:
STATE MASTER (Pennsylvania database) - RCRIS-PAD987330495, HAZARDOUS WASTE PROGRAM Conditionally Exempt Small Quantity Generators, less than 100 kg/month of hazardous waste (Resource Conservation and Recovery Act (tracking hazardous waste)) - notification Organizations: OPERNAME (CONTACT/OPERATOR)
, ATLANTIC REFINING & MARKETING (CONTACT/OWNER)
, ATLANTIC REFINING & MARKETING CORPORATION (CONTACT/OWNER)
Alternative names: ATLANTIC SERVICE STATION
ARLINGTON AUTO BODY (1726 STATE RD in UPPER DARBY, PA)
STATE MASTER (Pennsylvania database) - RCRIS-PAD055213540, HAZARDOUS WASTE PROGRAM, AFS-00-1200196-1, AIR PROGRAM Small Quantity Generators, between 100 kg and 1000 kg of hazardous waste/month (Resource Conservation and Recovery Act (tracking hazardous waste)) - notification Business SIC classification: TOP, BODY, AND UPHOLSTERY REPAIR SHOPS AND PAINT SHOPS Business NAICS classification: AUTOMOTIVE BODY, PAINT, AND INTERIOR REPAIR AND MAINTENANCE. Organizations: OPERNAME (CONTACT/OPERATOR)
, KNAPP, EVERETT (CONTACT/OWNER)
BEVERLY HILLS MS ( in UPPER DARBY, PA)
(National Center for Education Statistics) - STATE ID-1970 Organizations: UPPER DARBY SD (SCHOOL DISTRICT)
BELL TEL OF PA KIRKLYN BATTERY REMOVAL (9228 W CHESTER PIKE in UPPER DABRY, PA)
AAMCO TRANS (7027 WEST CHESTER PK in UPPER DARBY, PA)
(Resource Conservation and Recovery Act (tracking hazardous waste)) Business NAICS classification: GENERAL AUTOMOTIVE REPAIR.; AUTOMOTIVE TRANSMISSION REPAIR. Organizations: OPERNAME (CONTACT/OPERATOR)
ALYAN L J CORP (303 S 69TH ST in UPPER DARBY, PA)
(Resource Conservation and Recovery Act (tracking hazardous waste)) Business NAICS classification: OTHER COMMERCIAL AND SERVICE INDUSTRY MACHINERY MANUFACTURING.; PUMP AND PUMPING EQUIPMENT MANUFACTURING. Organizations: L J ALYAN CORP (CONTACT/OWNER)
ATLANTIC SERVICE STATION (8203 W CHESTER PIKE-TANKS in UPPER DARBY, PA)
Conditionally Exempt Small Quantity Generators, less than 100 kg/month of hazardous waste (Resource Conservation and Recovery Act (tracking hazardous waste)) - notification Organizations: OPERNAME (CONTACT/OPERATOR)
, ATLANTIC REFINING & MARKETING (CONTACT/OWNER)
ATLANTIC SERVICE STATION (WEST CHESTER PK & ST LAWRENCE in UPPER DARBY, PA)
Conditionally Exempt Small Quantity Generators, less than 100 kg/month of hazardous waste (Resource Conservation and Recovery Act (tracking hazardous waste)) - notification Organizations: OPERNAME (CONTACT/OPERATOR)
A&A AUTO REPAIR CTR (S STATE RD & HIGHLAND AVE in UPPER DARBY, PA)
Small Quantity Generators, between 100 kg and 1000 kg of hazardous waste/month (Resource Conservation and Recovery Act (tracking hazardous waste)) - notification Organizations: PAPADAKIS ALEX (CONTACT/OWNER)
Housing units lacking complete plumbing facilities: 1.1% Housing units lacking complete kitchen facilities: 1.3%
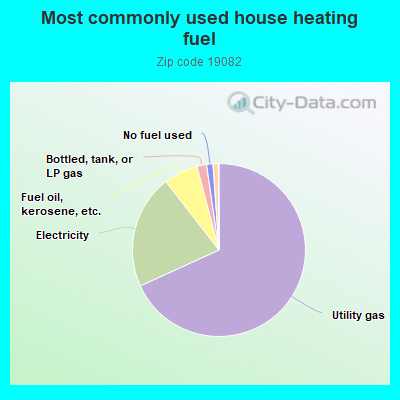
68.2%Utility gas
21.3%Electricity
6.4%Fuel oil, kerosene, etc.
1.8%Bottled, tank, or LP gas
1.2%No fuel used
1.0%Other fuel
Population in 1990: 36,400. Population change in the 1990s: +1,948 (+5.4%).
Place of birth for U.S.-born residents:
This state: 22,397
Northeast: 2,794
Midwest: 482
South: 1,011
West: 414
60% of the 19082 zip code residents lived in the same house 5 years ago. Out of people who lived in different houses, 47% lived in this county. Out of people who lived in different counties, 50% lived in Pennsylvania.
91% of the 19082 zip code residents lived in the same house 1 year ago. Out of people who lived in different houses, 50% moved from this county. Out of people who lived in different houses, 36% moved from different county within same state. Out of people who lived in different houses, 8% moved from different state. Out of people who lived in different houses, 6% moved from abroad.
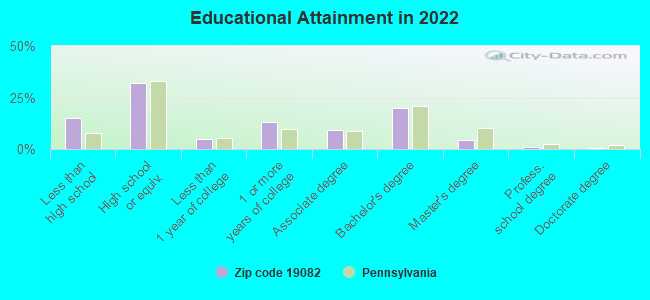
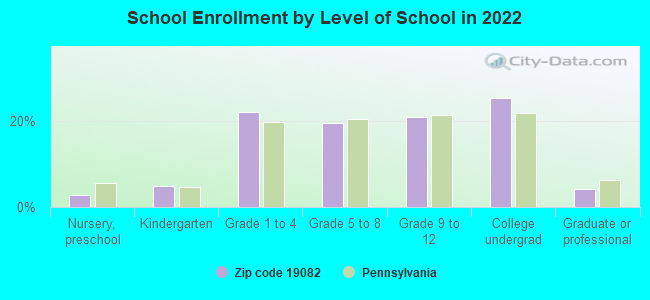
Private vs. public school enrollment:
Students in private schools in grades 1 to 8 (elementary and middle school): 388
Here:
8.5%
Pennsylvania:
15.7%
Students in private schools in grades 9 to 12 (high school): 364
Here:
15.9%
Pennsylvania:
13.4%
Students in private undergraduate colleges: 933
Here:
33.4%
Pennsylvania:
39.8%
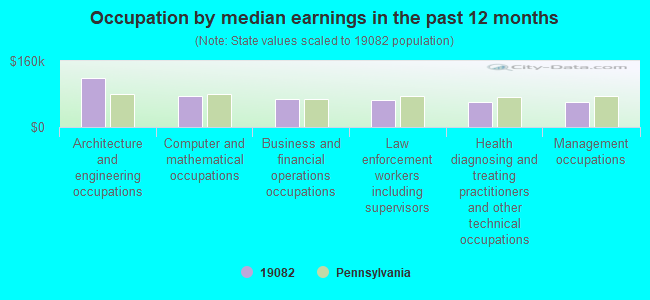
Occupation by median earnings in the past 12 months ($)
118,682Architecture and engineering occupations
74,375Computer and mathematical occupations
67,828Business and financial operations occupations
66,317Law enforcement workers including supervisors
61,350Health diagnosing and treating practitioners and other technical occupations
60,809Management occupations
Companies with federal contracts located in this zip code:
U S A ENVIRONMENTAL MANAGEMENT INC ( in Upper Darby, PA; small business) : $17,510,495 in 283 contractsfrom 2000 to 2006
Contracts for Maintenance, Repair or Alteration of Real Property -- Other Administrative Facilities and Service Buildings, Hazardous Substance Removal, Cleanup, and Disposal Services and Operational Support, Construction of Structures and Facilities -- Other Non-Building Facilities, Maintenance, Repair or Alteration of Real Property -- Other Non-Building Facilities, and moreby Army, Navy, U.S. Army Corps of Engineers - civil program financing only, Bureau of Prisoners/Federal Prison System, and others Signed by year:2000: $2,148,692; 2001: $5,505,513; 2002: $1,366,597; 2003: $2,873,437; 2004: $3,355,726; 2005: $1,715,442; 2006: $545,088.
Biggest contracts:
$1,360,000 with Army for Maintenance, Repair or Alteration of Real Property -- Other Administrative Facilities and Service Buildings. Taking place in NJ. Signed on 2001-09-28. Completion date: 2002-09-27.
$998,061 with Army for Hazardous Substance Removal, Cleanup, and Disposal Services and Operational Support. Taking place in DC. Signed on 2001-04-17. Completion date: 2002-04-17.
$891,400 with Navy for Construction of Structures and Facilities -- Other Non-Building Facilities. Taking place in ME. Signed on 2004-10-13. Completion date: 2005-10-12.
$698,400 with U.S. Army Corps of Engineers - civil program financing only for Maintenance, Repair or Alteration of Real Property -- Other Non-Building Facilities. Signed on 2000-09-05. Completion date: 2001-02-12.
BEATTY LUMBER & MILLWORK CO, I (1835 S STATE RD in UPPER DARBY, PA; small business) : $37,776 in 2 contractsin 2003
$18,888 with Army for Lumber and Related Basic Wood Materials. Signed on 2003-03-13. Completion date: 2003-03-13.
$18,888, same as above.Signed on 2003-03-13. Completion date: 2003-03-13.
ATERMON INC (6816 CHESTNUT ST in UPPER DARBY, PA; small business)
$6,475 with Air Force for Maintenance, Repair or Alteration of Real Property -- Fuel Supply Facilities. Signed on 2002-09-18. Completion date: 2003-01-10.
TRI-STATE OFFICE SYSTEMS INC (281 E TOWNSHIP LINE RD in UPPER DARBY, PA; small business)
$5,000 with Navy for Miscellaneous Office Machines. Signed on 2004-10-01. Completion date: 2005-09-30.
Top industries in this zip code by the number of employees in 2005:
Administrative and Support and Waste Management and Remediation Services: Janitorial Services (over 1000 employees: 1 establishment, 10-19 employees: 1 establishment, 5-9 employees: 3 establishments, 1-4 employees: 6 establishments)
2004 - 2018 National Fire Incident Reporting System (NFIRS) incidents
According to the data from the years 2004 - 2018 the average number of fire incidents per year is 55. The highest number of reported fire incidents - 212 took place in 2018, and the least - 0 in 2008. The data has an increasing trend.
When looking into fire subcategories, the most incidents belonged to: Structure Fires (60.7%), and Outside Fires (25.8%).
Fire incident types reported to NFIRS in Zip Code 19082

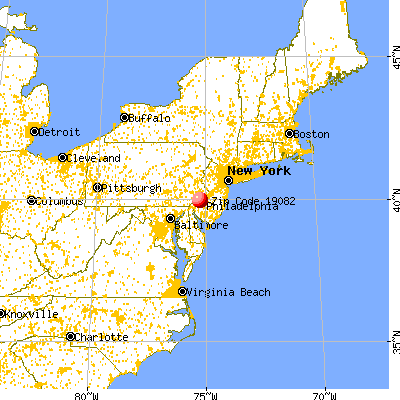


 Nearest zip codes: 19151, 19050, 19026, 19096, 19139, 19023.


 According to the data from the years 2004 - 2018 the average number of fire incidents per year is 55. The highest number of reported fire incidents - 212 took place in 2018, and the least - 0 in 2008. The data has an increasing trend.
 When looking into fire subcategories, the most incidents belonged to: Structure Fires (60.7%), and Outside Fires (25.8%).