Estimated zip code population in 2022: 22,463 Zip code population in 2010: 22,164 Zip code population in 2000: 21,404
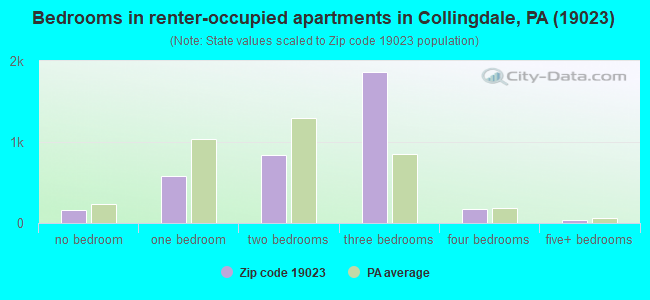
Houses and condos: 8,767 Renter-occupied apartments: 3,725
% of renters here:
47%
State:
31%
March 2022 cost of living index in zip code 19023: 102.2 (near average, U.S. average is 100)
Land area: 2.0 sq. mi. Water area: 0.0 sq. mi.
Population density: 11,247 people per square mile
(high).
OSM Map
General Map
Google Map
MSN Map
OSM Map
General Map
Google Map
MSN Map
OSM Map
General Map
Google Map
MSN Map
OSM Map
General Map
Google Map
MSN Map
Please wait while loading the map...
Real estate property taxes paid for housing units in 2022:
This zip code:
2.9% ($3,448)
Pennsylvania:
1.3% ($3,094)
Median real estate property taxes paid for housing units with mortgages in 2022: $3,501 (2.7%) Median real estate property taxes paid for housing units with no mortgage in 2022: $3,302 (3.4%)
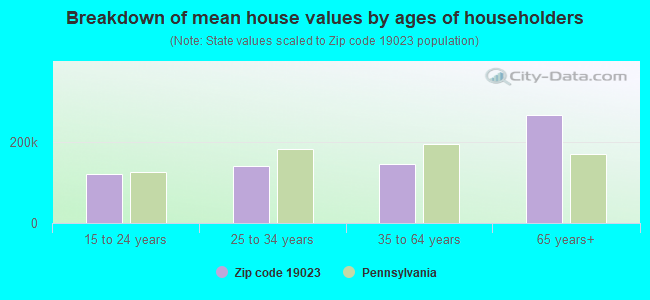
Estimated median house/condo value in 2022: $119,711
19023:
$119,711
Pennsylvania:
$245,500
According to our research of Pennsylvania and other state lists, there were 48 registered sex offenders living in 19023 zip code as of April 27, 2024. The ratio of all residents to sex offenders in zip code 19023 is 473 to 1. The ratio of registered sex offenders to all residents in this zip code is near the state average.
Median resident age:
This zip code:
33.8 years
Pennsylvania median age:
40.9 years
Average household size:
This zip code:
2.8 people
Pennsylvania:
2.4 people
Averages for the 2020 tax year for zip code 19023, filed in 2021:
Average Adjusted Gross Income (AGI) in 2020: $38,145 (Individual Income Tax Returns)
Here:
$38,145
State:
$75,707
Salary/wage: $35,027 (reported on 87.0% of returns)
Here:
$35,027
State:
$62,806
(% of AGI for various income ranges: 1077.4% for AGIs below $25k, 3374.8% for AGIs $25k-50k, 6606.6% for AGIs $50k-75k, 10600.2% for AGIs $75k-100k, 17743.0% for AGIs $100k-200k)
Taxable interest for individuals: $393 (reported on 9.8% of returns)
This zip code:
$393
Pennsylvania:
$1,633
(% of AGI for various income ranges: 2.5% for AGIs below $25k, 2.6% for AGIs $25k-50k, 5.4% for AGIs $50k-75k, 25.8% for AGIs $75k-100k, 22.2% for AGIs $100k-200k)
Ordinary dividends: $2,174 (reported on 4.0% of returns)
Here:
$2,174
State:
$7,382
(% of AGI for various income ranges: 3.2% for AGIs below $25k, 5.7% for AGIs $25k-50k, 10.2% for AGIs $50k-75k, 26.7% for AGIs $75k-100k, 138.5% for AGIs $100k-200k)
Net capital gain/loss in AGI: +$6,230 (reported on 3.1% of returns)
Here:
+$6,230
State:
+$23,522
(% of AGI for various income ranges: 1.3% for AGIs below $25k, 3.9% for AGIs $25k-50k, 13.0% for AGIs $50k-75k, 44.4% for AGIs $75k-100k, 566.7% for AGIs $100k-200k)
Profit/loss from business: +$694 (reported on 16.8% of returns)
Here:
+$694
State:
+$16,274
(% of AGI for various income ranges: 1.3% for AGIs below $25k, 210.9% for AGIs $75k-100k, 315.2% for AGIs $100k-200k)
Taxable individual retirement arrangement distribution: $9,511 (reported on 2.6% of returns)
19023:
$9,511
Pennsylvania:
$18,583
(% of AGI for various income ranges: 11.3% for AGIs below $25k, 19.9% for AGIs $25k-50k, 34.7% for AGIs $50k-75k, 107.4% for AGIs $75k-100k, 267.0% for AGIs $100k-200k)
Total itemized deductions: $26,384 (reported on 5.4% of returns)
Here:
$26,384
State:
$34,850
(% of AGI for various income ranges: 18.5% for AGIs below $25k, 108.6% for AGIs $25k-50k, 401.0% for AGIs $50k-75k, 663.7% for AGIs $75k-100k, 1106.7% for AGIs $100k-200k)
Charity contributions: $10,320 (reported on 4.2% of returns)
Here:
$10,320
State:
$12,392
(% of AGI for various income ranges: 4.0% for AGIs below $25k, 32.2% for AGIs $25k-50k, 112.3% for AGIs $50k-75k, 211.6% for AGIs $75k-100k, 423.0% for AGIs $100k-200k)
Taxes paid: $6,891 (reported on 5.4% of returns)
19023:
$6,891
State:
$8,200
(% of AGI for various income ranges: 3.8% for AGIs below $25k, 25.5% for AGIs $25k-50k, 101.9% for AGIs $50k-75k, 199.3% for AGIs $75k-100k, 308.5% for AGIs $100k-200k)
Earned income credit: $2,347 (reported on 31.8% of returns)
Here:
$2,347
State:
$2,100
(% of AGI for various income ranges: 129.6% for AGIs below $25k, 102.2% for AGIs $25k-50k, 0.9% for AGIs $50k-75k)
Percentage of individuals using paid preparers for their 2020 taxes: 93.1%
Here:
93%
State:
92%
(% for various income ranges: 93.3% for AGIs below $25k, 94.7% for AGIs $25k-50k, 90.6% for AGIs $50k-75k, 90.5% for AGIs $75k-100k, 93.0% for AGIs $100k-200k, 66.7% for AGIs over 200k)
Averages for the 2012 tax year for zip code 19023, filed in 2013:
Average Adjusted Gross Income (AGI) in 2012: $31,710 (Individual Income Tax Returns)
Here:
$31,710
State:
$61,346
Salary/wage: $30,461 (reported on 89.3% of returns)
Here:
$30,461
State:
$51,902
(% of AGI for various income ranges: 78.8% for AGIs below $25k, 89.5% for AGIs $25k-50k, 87.9% for AGIs $50k-75k, 87.6% for AGIs $75k-100k, 80.9% for AGIs $100k-200k)
Taxable interest for individuals: $517 (reported on 14.1% of returns)
This zip code:
$517
Pennsylvania:
$1,588
(% of AGI for various income ranges: 0.3% for AGIs below $25k, 0.2% for AGIs $25k-50k, 0.3% for AGIs $50k-75k, 0.2% for AGIs $75k-100k, 0.1% for AGIs $100k-200k)
Ordinary dividends: $1,841 (reported on 5.8% of returns)
Here:
$1,841
State:
$5,827
(% of AGI for various income ranges: 0.4% for AGIs below $25k, 0.3% for AGIs $25k-50k, 0.3% for AGIs $50k-75k, 0.2% for AGIs $75k-100k, 0.4% for AGIs $100k-200k)
Net capital gain/loss in AGI: +$563 (reported on 2.8% of returns)
Here:
+$563
State:
+$14,495
(% of AGI for various income ranges: 0.1% for AGIs $25k-50k, 0.2% for AGIs $100k-200k)
Profit/loss from business: +$5,787 (reported on 11.7% of returns)
Here:
+$5,787
State:
+$16,268
(% of AGI for various income ranges: 7.2% for AGIs below $25k, 0.6% for AGIs $25k-50k, 0.9% for AGIs $50k-75k, 0.8% for AGIs $75k-100k, 1.5% for AGIs $100k-200k)
Taxable individual retirement arrangement distribution: $7,174 (reported on 4.0% of returns)
19023:
$7,174
Pennsylvania:
$14,550
(% of AGI for various income ranges: 1.0% for AGIs below $25k, 0.6% for AGIs $25k-50k, 1.0% for AGIs $50k-75k, 1.2% for AGIs $75k-100k, 1.0% for AGIs $100k-200k)
Total itemized deductions: $16,276 (30% of AGI, reported on 25.9% of returns)
Here:
$16,276
State:
$23,538
Here:
29.7% of AGI
State:
18.4% of AGI
(% of AGI for various income ranges: 8.4% for AGIs below $25k, 13.5% for AGIs $25k-50k, 16.0% for AGIs $50k-75k, 15.9% for AGIs $75k-100k, 13.8% for AGIs $100k-200k)
Charity contributions: $2,931 (reported on 19.7% of returns)
Here:
$2,931
State:
$4,025
(% of AGI for various income ranges: 0.6% for AGIs below $25k, 1.7% for AGIs $25k-50k, 2.4% for AGIs $50k-75k, 2.7% for AGIs $75k-100k, 2.4% for AGIs $100k-200k)
Taxes paid: $7,171 (reported on 25.9% of returns)
19023:
$7,171
State:
$9,982
(% of AGI for various income ranges: 3.3% for AGIs below $25k, 5.9% for AGIs $25k-50k, 6.3% for AGIs $50k-75k, 6.5% for AGIs $75k-100k, 8.7% for AGIs $100k-200k)
Earned income credit: $2,484 (reported on 38.7% of returns)
Here:
$2,484
State:
$2,106
(% of AGI for various income ranges: 11.4% for AGIs below $25k, 1.9% for AGIs $25k-50k)
Percentage of individuals using paid preparers for their 2012 taxes: 50.3%
Here:
50%
State:
53%
(% for various income ranges: 50.7% for AGIs below $25k, 48.5% for AGIs $25k-50k, 51.0% for AGIs $50k-75k, 54.5% for AGIs $75k-100k, 51.9% for AGIs $100k-200k)
Averages for the 2004 tax year for zip code 19023, filed in 2005:
Average Adjusted Gross Income (AGI) in 2004: $29,115 (Individual Income Tax Returns)
Here:
$29,115
State:
$48,049
Salary/wage: $28,415 (reported on 89.6% of returns)
Here:
$28,415
State:
$42,646
(% of AGI for various income ranges: 84.1% for AGIs below $10k, 82.2% for AGIs $10k-25k, 91.5% for AGIs $25k-50k, 89.3% for AGIs $50k-75k, 92.8% for AGIs $75k-100k, 69.5% for AGIs over 100k)
Taxable interest for individuals: $776 (reported on 25.8% of returns)
This zip code:
$776
Pennsylvania:
$1,657
(% of AGI for various income ranges: 1.8% for AGIs below $10k, 0.9% for AGIs $10k-25k, 0.5% for AGIs $25k-50k, 0.5% for AGIs $50k-75k, 0.3% for AGIs $75k-100k, 1.8% for AGIs over 100k)
Taxable dividends: $1,357 (reported on 9.9% of returns)
Here:
$1,357
State:
$3,566
(% of AGI for various income ranges: 0.9% for AGIs below $10k, 0.5% for AGIs $10k-25k, 0.4% for AGIs $25k-50k, 0.4% for AGIs $50k-75k, 0.4% for AGIs $75k-100k, 0.9% for AGIs over 100k)
Net capital gain/loss: +$1,901 (reported on 5.6% of returns)
Here:
+$1,901
State:
+$9,716
(% of AGI for various income ranges: -0.3% for AGIs below $10k, -0.1% for AGIs $10k-25k, 0.2% for AGIs $25k-50k, 0.4% for AGIs $50k-75k, 0.2% for AGIs $75k-100k, 2.5% for AGIs over 100k)
Profit/loss from business: +$5,605 (reported on 7.5% of returns)
Here:
+$5,605
State:
+$14,267
(% of AGI for various income ranges: 5.7% for AGIs below $10k, 3.2% for AGIs $10k-25k, 0.9% for AGIs $25k-50k, 0.6% for AGIs $50k-75k, 0.3% for AGIs $75k-100k, 1.7% for AGIs over 100k)
IRA payment deduction: $2,280 (reported on 1.7% of returns)
19023:
$2,280
Pennsylvania:
$2,903
(% of AGI for various income ranges: 0.1% for AGIs $10k-25k, 0.2% for AGIs $25k-50k, 0.1% for AGIs $50k-75k, 0.1% for AGIs $75k-100k)
Total itemized deductions: $14,072 (28% of AGI, reported on 26.9% of returns)
Here:
$14,072
State:
$18,804
Here:
28.4% of AGI
State:
19.5% of AGI
(% of AGI for various income ranges: 4.3% for AGIs below $10k, 7.2% for AGIs $10k-25k, 14.0% for AGIs $25k-50k, 15.4% for AGIs $50k-75k, 14.4% for AGIs $75k-100k, 17.2% for AGIs over 100k)
Charity contributions deductions: $2,807 (6% of AGI, reported on 24.4% of returns)
Here:
$2,807
State:
$3,337
Here:
5.5% of AGI
State:
3.3% of AGI
(% of AGI for various income ranges: 0.3% for AGIs below $10k, 1.3% for AGIs $10k-25k, 2.4% for AGIs $25k-50k, 2.8% for AGIs $50k-75k, 2.6% for AGIs $75k-100k, 4.0% for AGIs over 100k)
Total tax: $3,260 (reported on 61.1% of returns)
19023:
$3,260
State:
$8,008
(% of AGI for various income ranges: 1.5% for AGIs below $10k, 2.9% for AGIs $10k-25k, 5.6% for AGIs $25k-50k, 8.5% for AGIs $50k-75k, 10.2% for AGIs $75k-100k, 15.3% for AGIs over 100k)
Earned income credit: $1,898 (reported on 30.9% of returns)
Here:
$1,898
State:
$1,643
Percentage of individuals using paid preparers for their 2004 taxes: 55.9%
Here:
56%
State:
56%
(% for various income ranges: 50.3% for AGIs below $10k, 61.9% for AGIs $10k-25k, 54.0% for AGIs $25k-50k, 55.0% for AGIs $50k-75k, 56.9% for AGIs $75k-100k, 58.2% for AGIs over 100k)
Likely homosexual households (counted as self-reported same-sex unmarried-partner households)
Lesbian couples: 0.0% of all households
Gay men: 0.4% of all households
Household received Food Stamps/SNAP in the past 12 months: 3,113 Household did not receive Food Stamps/SNAP in the past 12 months: 4,982
Women who had a birth in the past 12 months: 222 (90 now married, 117 unmarried) Women who did not have a birth in the past 12 months: 5,926 (1,154 now married, 4,813 unmarried)
Housing units in zip code 19023 with a mortgage: 2,756 (178 second mortgage, 152 both second mortgage and home equity loan) Houses without a mortgage: 78
Median monthly owner costs for units with a mortgage: $1,311 Median monthly owner costs for units without a mortgage: $616
Residents with income below the poverty level in 2022:
This zip code:
28.7%
Whole state:
11.8%
Residents with income below 50% of the poverty level in 2022:
This zip code:
15.2%
Whole state:
6.1%
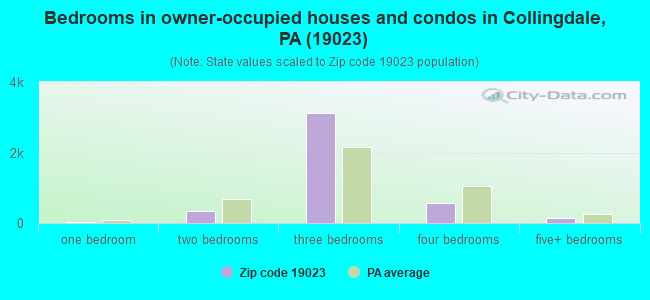
Median number of rooms in houses and condos:
Here:
6.3
State:
6.8
Median number of rooms in apartments:
Here:
5.7
State:
4.3
Notable locations in this zip code not listed on our city pages
Notable locations in zip code 19023: Darby Station (A), Bartram Avenue Station (B), Collingdale Borough Hall (C), Collingdale Station (D), Colwyn Borough Hall (E), Andrews Avenue Station (F), Darby Borough Hall (G), North Street Station (H), Collingdale Fire Company 1 Station 6 (I), Collingdale Fire Company 2 Station 42 (J), Collingdale Library (K), Collingdale Police Department (L), Colwyn Fire Company 1 Station 10 (M), Colwyn Police Department (N), Darby Fire Company 1 Station 4 (O), Darby Library (P), Darby Fire Patrol 2 Station 21 (Q), Darby Police Department (R), Saint Francis Country Home (S). Display/hide their locations on the map
1,277 married couples with children.
3,435 single-parent households (84 men, 3,351 women).
84.1% of residents of 19023 zip code speak English at home.
3.1% of residents speak Spanish at home (54% very well, 6% well, 2% not well, 38% not at all).
4.7% of residents speak other Indo-European language at home (42% very well, 41% well, 15% not well, 3% not at all).
1.2% of residents speak Asian or Pacific Island language at home (39% very well, 20% well, 27% not well, 13% not at all).
6.5% of residents speak other language at home (38% very well, 48% well, 13% not well, 1% not at all).
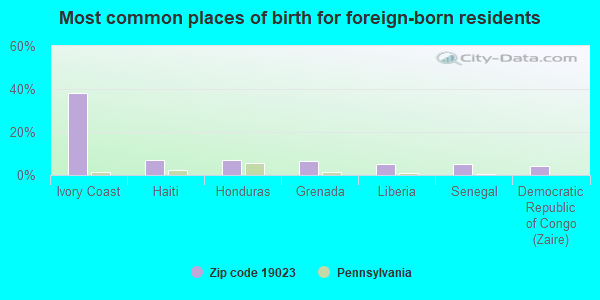
Foreign born population: 3,891 (17.3%) (56.7% of them are naturalized citizens)
Facilities with environmental interests located in this zip code:
7 ELEVEN 20579 (MAIN AND RIDGE AVENUE in DARBY, PA)
STATE MASTER (Pennsylvania database) - RCRIS-PAD987327384, HAZARDOUS WASTE PROGRAM Small Quantity Generators, between 100 kg and 1000 kg of hazardous waste/month (Resource Conservation and Recovery Act (tracking hazardous waste)) - notification Organizations: OPERNAME (CONTACT/OPERATOR)
, SOUTHLAND CORPORATION THE (CONTACT/OWNER)
Alternative names: 7-ELEVEN #20579
ACE & SONS AUTO BODY (99 CHESTER PIKE in DARBY, PA)
STATE MASTER (Pennsylvania database) - AFS-00-1200360-1, AIR PROGRAM Small Quantity Generators, between 100 kg and 1000 kg of hazardous waste/month (Resource Conservation and Recovery Act (tracking hazardous waste)) - notification Business SIC classification: TOP, BODY, AND UPHOLSTERY REPAIR SHOPS AND PAINT SHOPS Business NAICS classification: AUTOMOTIVE BODY, PAINT, AND INTERIOR REPAIR AND MAINTENANCE. Organizations: ACE AND SONS INC (CONTACT/OWNER)
, ACE & SONS, INC. (OWNER/OPERATOR)
Alternative names: ACE AND SONS INC
AMERICAN FIBER VELOPE (PUSEY & MILDRES AVES in COLLINGDALE, PA)
Small Quantity Generators, between 100 kg and 1000 kg of hazardous waste/month (Resource Conservation and Recovery Act (tracking hazardous waste)) - notification Organizations: OPERNAME (CONTACT/OPERATOR)
, AMERICAN BUSINESS PRD (CONTACT/OWNER)
BALDWIN-DEFIENCE (108 MCDADE BLVD in DARBY, PA)
Small Quantity Generators, between 100 kg and 1000 kg of hazardous waste/month (Resource Conservation and Recovery Act (tracking hazardous waste)) - notification Organizations: OPERNAME (CONTACT/OPERATOR)
, BALDWIN-DEFIENCE INC (CONTACT/OWNER)
BIG MARTY TRANSFORMERER (MAIN AND POWELL STREETS in DARBY, PA)
SUPERFUND (Superfund database) Alternative names: BIG MARTY TRANSFORMER ER
Housing units lacking complete plumbing facilities: 2.6% Housing units lacking complete kitchen facilities: 4.6%
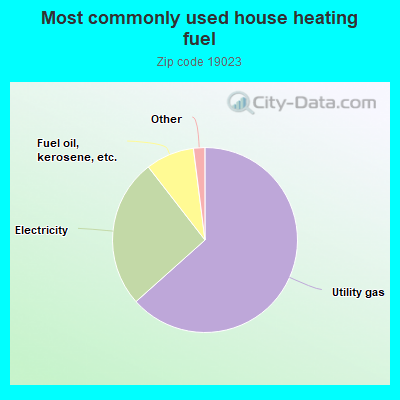
63.4%Utility gas
26.1%Electricity
8.5%Fuel oil, kerosene, etc.
0.9%Bottled, tank, or LP gas
0.7%Other fuel
Population in 1990: 23,274.
Place of birth for U.S.-born residents:
This state: 16,126
Northeast: 920
Midwest: 164
South: 1,022
West: 47
64% of the 19023 zip code residents lived in the same house 5 years ago. Out of people who lived in different houses, 58% lived in this county. Out of people who lived in different counties, 50% lived in Pennsylvania.
90% of the 19023 zip code residents lived in the same house 1 year ago. Out of people who lived in different houses, 51% moved from this county. Out of people who lived in different houses, 29% moved from different county within same state. Out of people who lived in different houses, 7% moved from different state. Out of people who lived in different houses, 13% moved from abroad.
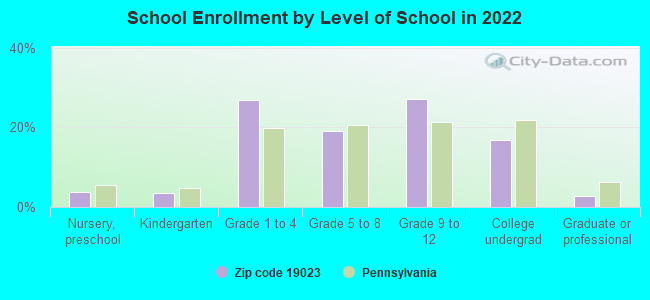
Private vs. public school enrollment:
Students in private schools in grades 1 to 8 (elementary and middle school): 553
Here:
17.8%
Pennsylvania:
15.7%
Students in private schools in grades 9 to 12 (high school): 286
Here:
15.6%
Pennsylvania:
13.4%
Students in private undergraduate colleges: 291
Here:
25.9%
Pennsylvania:
39.8%
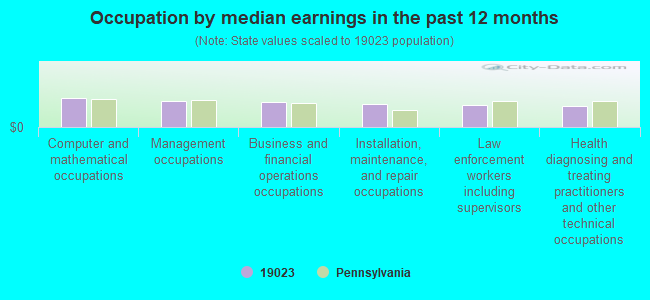
Occupation by median earnings in the past 12 months ($)
77,323Computer and mathematical occupations
69,751Management occupations
66,598Business and financial operations occupations
59,940Installation, maintenance, and repair occupations
59,048Law enforcement workers including supervisors
55,848Health diagnosing and treating practitioners and other technical occupations
Companies with federal contracts located in this zip code:
J AND J INDUSTRIES INC (19 MACDADE BLVD in COLLINGDALE, PA; small business) : $328,166 in 21 contractsfrom 2002 to 2006
Contracts for Weapons Maintenance and Repair Shop Specialized Equipment, Vehicular Cab, Body, and Frame Structural Components, Aircraft Ground Servicing Equipment, Launchers, Torpedo and Depth Charge, and moreby Defense Logistics Agency Signed by year:2000: $0; 2001: $0; 2002: $72,666; 2003: $0; 2004: $0; 2005: $209,001; 2006: $46,499.
Biggest contracts:
$72,666 with Defense Logistics Agency for Weapons Maintenance and Repair Shop Specialized Equipment. Signed on 2002-09-13. Completion date: 2002-10-01.
$55,644 with Defense Logistics Agency for Vehicular Cab, Body, and Frame Structural Components. Signed on 2005-10-11. Completion date: 2006-04-15.
$32,340 with Defense Logistics Agency for Aircraft Ground Servicing Equipment. Signed on 2005-11-07. Completion date: 2006-05-06.
$29,766 with Defense Logistics Agency for Vehicular Cab, Body, and Frame Structural Components. Signed on 2005-07-20. Completion date: 2005-07-22.
MERLIN MACHINE & TOOL CO INC (17 MACDADE BLVD in COLLINGDALE, PA; small business) : $243,060 in 15 contractsfrom 2004 to 2006
Contracts for Airframe Structural Components, Fire Control Designating and Indicating Equipment, Nuts and Washers, Valves, Nonpowered, and moreby Defense Logistics Agency Signed by year:2000: $0; 2001: $0; 2002: $0; 2003: $0; 2004: $129,454; 2005: $27,696; 2006: $85,910.
Biggest contracts:
$56,550 with Defense Logistics Agency for Airframe Structural Components. Signed on 2004-09-03. Completion date: 2005-03-02.
$46,300 with Defense Logistics Agency for Fire Control Designating and Indicating Equipment. Signed on 2006-05-25. Completion date: 2007-03-01.
$36,000 with Defense Logistics Agency for Nuts and Washers. Signed on 2004-03-23. Completion date: 2004-09-19.
$25,984 with Defense Logistics Agency for Valves, Nonpowered. Signed on 2006-06-10. Completion date: 2007-02-05.
ROBERTS FILTER HOLDING COMPANY (6TH & COLUMBIA STREETS in DARBY, PA) : $113,585 in 3 contractsfrom 2003 to 2004
$93,000 with Army for Maintenance, Repair and Rebuilding of Equipment -- Water Purification and Sewage Treatment Equipment. Taking place in NJ. Signed on 2004-09-24. Completion date: 2004-10-22.
$17,850, same as above.Signed on 2003-07-23. Completion date: 2004-06-30.
$2,735 with Army for Maintenance, Repair and Rebuilding of Equipment -- Water Purification and Sewage Treatment Equipment. Signed on 2003-02-10. Completion date: 2003-02-27.
UNIVERSAL SERVICES ASSOCIATES (500 ELLIS AVE in DARBY, PA; small business) : $105,213 in 10 contractsfrom 2003 to 2005
Contracts for Miscellaneous Prefabricated Structures, Laboratory Equipment and Supplies, by U.S. Army Corps of Engineers - civil program financing only, Army, NASA Signed by year:2000: $0; 2001: $0; 2002: $0; 2003: $65,623; 2004: $20,830; 2005: $18,760; 2006: $0.
Biggest contracts:
$18,363 with U.S. Army Corps of Engineers - civil program financing only for Miscellaneous Prefabricated Structures. Signed on 2003-06-18. Completion date: 2003-06-11.
$13,630 with U.S. Army Corps of Engineers - civil program financing only for Laboratory Equipment and Supplies. Taking place in MO. Signed on 2003-11-06. Completion date: 2003-12-06.
$13,630 with Army for Laboratory Equipment and Supplies. Taking place in MO. Signed on 2003-11-06. Completion date: 2003-12-06.
$11,430 with NASA for . Signed on 2004-12-16. Completion date: 2005-04-15.
SCULLY WELDING SUPPLY CORP (309 OAK AVE in COLLINGDALE, PA; small business) : $81,705 in 7 contractsfrom 2003 to 2005
Contracts for Storage Tanks, Fueling and Other Petroleum Services - Excluding Storage, Miscellaneous Engine Accessories, Nonaircraft by Army Signed by year:2000: $0; 2001: $0; 2002: $0; 2003: $10,600; 2004: $17,570; 2005: $53,535; 2006: $0.
Biggest contracts:
$14,615 with Army for Storage Tanks. Signed on 2005-08-09. Completion date: 2005-08-19.
$13,900 with Army for Fueling and Other Petroleum Services - Excluding Storage. Signed on 2005-01-26. Completion date: 2005-04-30.
$13,900, same as above.Signed on 2005-02-14. Completion date: 2005-04-30.
$11,120, same as above.Signed on 2004-10-28. Completion date: 2005-04-30.
MICHAEL D RANALLI, INC (330 PUSEY AVE in COLLINGDALE, PA; small business) : $28,850 in 4 contractsin 2001
$14,000 with Navy for Maintenance, Repair or Alteration of Real Property -- Office Buildings. Signed on 2001-08-27. Completion date: 2001-09-27.
$7,450 with Navy for Construction of Structures and Facilities -- Office Buildings. Signed on 2001-08-08. Completion date: 2001-09-09.
$6,000 with Navy for Maintenance, Repair or Alteration of Real Property -- Office Buildings. Signed on 2001-08-03. Completion date: 2001-09-04.
$1,400 with Navy for Construction of Structures and Facilities -- Office Buildings. Signed on 2001-08-30. Completion date: 2001-09-30.
WESTLAKE PLASTICS COMPANY (100 PINE ST in DARBY, PA; small business) : $7,965 in 2 contractsin 2002
$4,590 with Navy for Bags and Sacks. Signed on 2002-01-30. Completion date: 2002-02-28.
$3,375, same as above.Signed on 2002-01-29. Completion date: 2002-02-22.
OFFICEHAUS STATIONERS, INC (620 PUSEY AVE in COLLINGDALE, FL; small business)
$2,647 with Army for Office Furniture. Taking place in FL. Signed on 2003-09-18. Completion date: 2003-11-07.
Top industries in this zip code by the number of employees in 2005:
Health Care and Social Assistance: General Medical and Surgical Hospitals (over 1000 employees: 1 establishment)
Health Care and Social Assistance: Nursing Care Facilities (250-499: 1, 100-249: 1, 5-9: 1)
Other Services (except Public Administration): Business Associations (250-499: 1, 1-4: 1)
Health Care and Social Assistance: Offices of Physicians (except Mental Health Specialists) (20-49: 1, 10-19: 4, 5-9: 6, 1-4: 18)
Health Care and Social Assistance: Specialty (except Psychiatric and Substance Abuse) Hospitals (100-249: 1)
Other Services (except Public Administration): Religious Organizations (50-99: 1, 5-9: 3, 1-4: 8)
2003 - 2018 National Fire Incident Reporting System (NFIRS) incidents
According to the data from the years 2003 - 2018 the average number of fires per year is 103. The highest number of fires - 300 took place in 2017, and the least - 2 in 2013. The data has a rising trend.
When looking into fire subcategories, the most reports belonged to: Structure Fires (63.6%), and Other (16.9%).
Fire incident types reported to NFIRS in Zip Code 19023

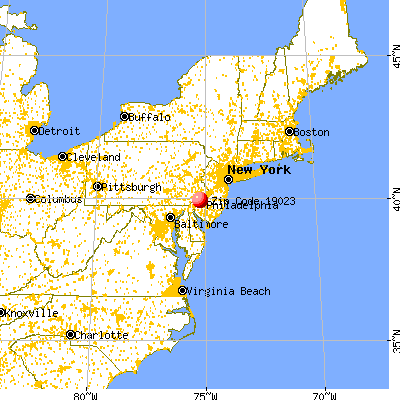


 Nearest zip codes: 19079, 19050, 19032, 19036, 19018, 19142.
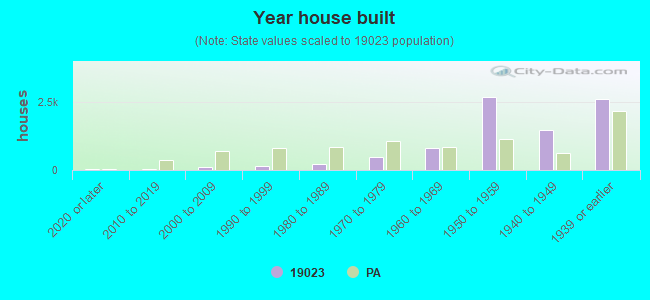


 According to the data from the years 2003 - 2018 the average number of fires per year is 103. The highest number of fires - 300 took place in 2017, and the least - 2 in 2013. The data has a rising trend.
 When looking into fire subcategories, the most reports belonged to: Structure Fires (63.6%), and Other (16.9%).