Estimated zip code population in 2022: 28,866 Zip code population in 2010: 28,073 Zip code population in 2000: 28,744
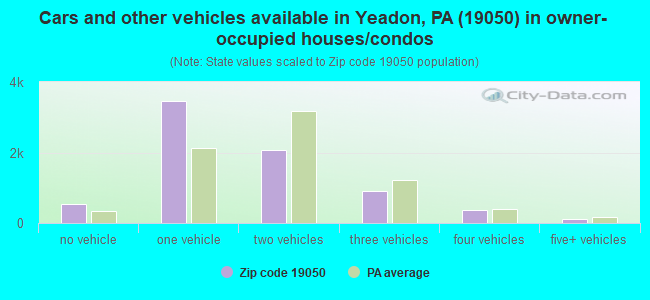
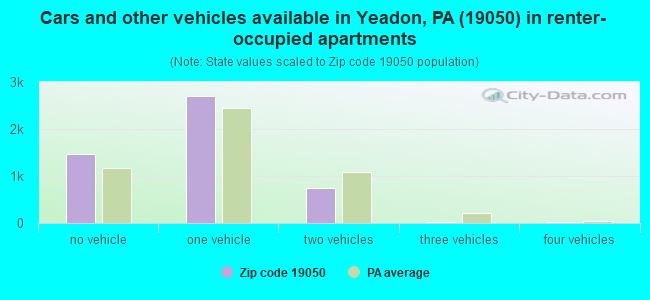
Houses and condos: 13,120 Renter-occupied apartments: 4,979
% of renters here:
40%
State:
31%
March 2022 cost of living index in zip code 19050: 102.6 (near average, U.S. average is 100)
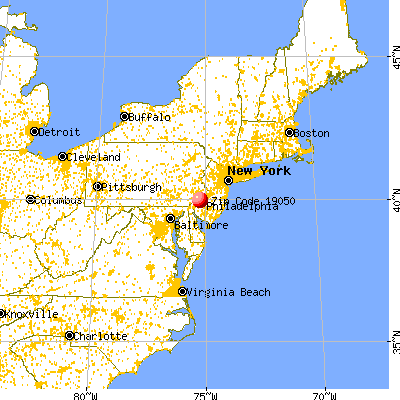
Land area: 3.7 sq. mi. Water area: 0.0 sq. mi.
Population density: 7,835 people per square mile
(high).
OSM Map
General Map
Google Map
MSN Map
OSM Map
General Map
Google Map
MSN Map
OSM Map
General Map
Google Map
MSN Map
OSM Map
General Map
Google Map
MSN Map
Please wait while loading the map...
Real estate property taxes paid for housing units in 2022:
This zip code:
2.7% ($4,988)
Pennsylvania:
1.3% ($3,094)
Median real estate property taxes paid for housing units with mortgages in 2022: $5,266 (2.8%) Median real estate property taxes paid for housing units with no mortgage in 2022: $4,291 (2.5%)
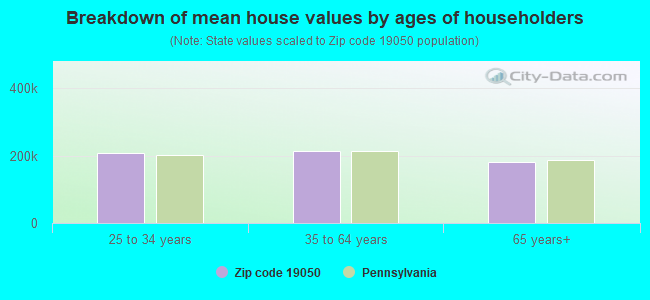
Estimated median house/condo value in 2022: $185,048
19050:
$185,048
Pennsylvania:
$245,500
According to our research of Pennsylvania and other state lists, there were 45 registered sex offenders living in 19050 zip code as of April 27, 2024. The ratio of all residents to sex offenders in zip code 19050 is 624 to 1. The ratio of registered sex offenders to all residents in this zip code is near the state average.
Median resident age:
This zip code:
41.4 years
Pennsylvania median age:
40.9 years
Average household size:
This zip code:
2.3 people
Pennsylvania:
2.4 people
Averages for the 2020 tax year for zip code 19050, filed in 2021:
Average Adjusted Gross Income (AGI) in 2020: $51,141 (Individual Income Tax Returns)
Here:
$51,141
State:
$75,707
Salary/wage: $47,201 (reported on 82.6% of returns)
Here:
$47,201
State:
$62,806
(% of AGI for various income ranges: 1059.9% for AGIs below $25k, 3451.7% for AGIs $25k-50k, 6577.6% for AGIs $50k-75k, 10250.3% for AGIs $75k-100k, 18329.8% for AGIs $100k-200k, 56537.1% for AGIs over 200k)
Taxable interest for individuals: $617 (reported on 19.1% of returns)
This zip code:
$617
Pennsylvania:
$1,633
(% of AGI for various income ranges: 7.5% for AGIs below $25k, 7.8% for AGIs $25k-50k, 18.0% for AGIs $50k-75k, 29.1% for AGIs $75k-100k, 54.3% for AGIs $100k-200k, 184.3% for AGIs over 200k)
Ordinary dividends: $3,187 (reported on 10.0% of returns)
Here:
$3,187
State:
$7,382
(% of AGI for various income ranges: 10.5% for AGIs below $25k, 12.8% for AGIs $25k-50k, 33.2% for AGIs $50k-75k, 91.2% for AGIs $75k-100k, 173.0% for AGIs $100k-200k, 1405.7% for AGIs over 200k)
Net capital gain/loss in AGI: +$6,665 (reported on 7.9% of returns)
Here:
+$6,665
State:
+$23,522
(% of AGI for various income ranges: 2.4% for AGIs below $25k, 16.0% for AGIs $25k-50k, 40.1% for AGIs $50k-75k, 109.9% for AGIs $75k-100k, 298.8% for AGIs $100k-200k, 4210.0% for AGIs over 200k)
Profit/loss from business: +$4,816 (reported on 17.6% of returns)
Here:
+$4,816
State:
+$16,274
(% of AGI for various income ranges: 68.2% for AGIs below $25k, 47.9% for AGIs $25k-50k, 109.8% for AGIs $50k-75k, 217.6% for AGIs $75k-100k, 302.1% for AGIs $100k-200k, 2588.6% for AGIs over 200k)
Taxable individual retirement arrangement distribution: $15,548 (reported on 5.8% of returns)
19050:
$15,548
Pennsylvania:
$18,583
(% of AGI for various income ranges: 30.4% for AGIs below $25k, 44.8% for AGIs $25k-50k, 103.6% for AGIs $50k-75k, 221.5% for AGIs $75k-100k, 549.7% for AGIs $100k-200k, 3004.3% for AGIs over 200k)
Self-employed (Keogh) retirement plans: $10,850 (reported on 0.1% of returns)
19050:
$10,850
Pennsylvania:
$25,407
(% of AGI for various income ranges: 10.6% for AGIs $50k-75k)
Total itemized deductions: $25,433 (reported on 11.0% of returns)
Here:
$25,433
State:
$34,850
(% of AGI for various income ranges: 46.5% for AGIs below $25k, 185.0% for AGIs $25k-50k, 552.2% for AGIs $50k-75k, 833.3% for AGIs $75k-100k, 1371.4% for AGIs $100k-200k, 4411.4% for AGIs over 200k)
Charity contributions: $8,962 (reported on 9.2% of returns)
Here:
$8,962
State:
$12,392
(% of AGI for various income ranges: 7.3% for AGIs below $25k, 45.3% for AGIs $25k-50k, 157.7% for AGIs $50k-75k, 243.4% for AGIs $75k-100k, 433.7% for AGIs $100k-200k, 2014.3% for AGIs over 200k)
Taxes paid: $7,948 (reported on 11.0% of returns)
19050:
$7,948
State:
$8,200
(% of AGI for various income ranges: 12.8% for AGIs below $25k, 50.0% for AGIs $25k-50k, 173.5% for AGIs $50k-75k, 283.6% for AGIs $75k-100k, 464.1% for AGIs $100k-200k, 1115.7% for AGIs over 200k)
Earned income credit: $2,105 (reported on 18.5% of returns)
Here:
$2,105
State:
$2,100
(% of AGI for various income ranges: 95.6% for AGIs below $25k, 65.5% for AGIs $25k-50k, 0.6% for AGIs $50k-75k)
Percentage of individuals using paid preparers for their 2020 taxes: 90.2%
Here:
90%
State:
92%
(% for various income ranges: 90.5% for AGIs below $25k, 91.7% for AGIs $25k-50k, 89.9% for AGIs $50k-75k, 88.0% for AGIs $75k-100k, 87.3% for AGIs $100k-200k, 90.0% for AGIs over 200k)
Averages for the 2012 tax year for zip code 19050, filed in 2013:
Average Adjusted Gross Income (AGI) in 2012: $45,446 (Individual Income Tax Returns)
Here:
$45,446
State:
$61,346
Salary/wage: $42,938 (reported on 85.4% of returns)
Here:
$42,938
State:
$51,902
(% of AGI for various income ranges: 72.5% for AGIs below $25k, 84.2% for AGIs $25k-50k, 83.0% for AGIs $50k-75k, 84.3% for AGIs $75k-100k, 81.7% for AGIs $100k-200k, 60.0% for AGIs over 200k)
Taxable interest for individuals: $736 (reported on 23.1% of returns)
This zip code:
$736
Pennsylvania:
$1,588
(% of AGI for various income ranges: 0.6% for AGIs below $25k, 0.2% for AGIs $25k-50k, 0.4% for AGIs $50k-75k, 0.3% for AGIs $75k-100k, 0.5% for AGIs $100k-200k, 0.6% for AGIs over 200k)
Ordinary dividends: $2,950 (reported on 12.0% of returns)
Here:
$2,950
State:
$5,827
(% of AGI for various income ranges: 1.7% for AGIs below $25k, 0.4% for AGIs $25k-50k, 0.5% for AGIs $50k-75k, 0.5% for AGIs $75k-100k, 0.8% for AGIs $100k-200k, 2.4% for AGIs over 200k)
Net capital gain/loss in AGI: +$3,983 (reported on 7.4% of returns)
Here:
+$3,983
State:
+$14,495
(% of AGI for various income ranges: 0.3% for AGIs $50k-75k, 0.1% for AGIs $75k-100k, 0.5% for AGIs $100k-200k, 7.0% for AGIs over 200k)
Profit/loss from business: +$8,390 (reported on 14.8% of returns)
Here:
+$8,390
State:
+$16,268
(% of AGI for various income ranges: 8.7% for AGIs below $25k, 2.1% for AGIs $25k-50k, 1.5% for AGIs $50k-75k, 1.5% for AGIs $75k-100k, 1.9% for AGIs $100k-200k, 5.4% for AGIs over 200k)
Taxable individual retirement arrangement distribution: $12,328 (reported on 6.7% of returns)
19050:
$12,328
Pennsylvania:
$14,550
(% of AGI for various income ranges: 1.9% for AGIs below $25k, 1.3% for AGIs $25k-50k, 1.7% for AGIs $50k-75k, 1.9% for AGIs $75k-100k, 2.0% for AGIs $100k-200k, 3.2% for AGIs over 200k)
Self-employment retirement plans: $14,350 (reported on 0.3% of returns)
19050:
$14,350
Pennsylvania:
$20,922
Total itemized deductions: $18,835 (26% of AGI, reported on 39.1% of returns)
Here:
$18,835
State:
$23,538
Here:
25.6% of AGI
State:
18.4% of AGI
(% of AGI for various income ranges: 10.3% for AGIs below $25k, 14.9% for AGIs $25k-50k, 18.5% for AGIs $50k-75k, 18.5% for AGIs $75k-100k, 17.4% for AGIs $100k-200k, 12.9% for AGIs over 200k)
Charity contributions: $3,578 (reported on 32.0% of returns)
Here:
$3,578
State:
$4,025
(% of AGI for various income ranges: 1.2% for AGIs below $25k, 2.1% for AGIs $25k-50k, 2.8% for AGIs $50k-75k, 2.9% for AGIs $75k-100k, 2.9% for AGIs $100k-200k, 3.0% for AGIs over 200k)
Taxes paid: $7,967 (reported on 38.9% of returns)
19050:
$7,967
State:
$9,982
(% of AGI for various income ranges: 3.3% for AGIs below $25k, 5.3% for AGIs $25k-50k, 7.6% for AGIs $50k-75k, 8.3% for AGIs $75k-100k, 8.4% for AGIs $100k-200k, 6.0% for AGIs over 200k)
Earned income credit: $2,162 (reported on 22.5% of returns)
Here:
$2,162
State:
$2,106
(% of AGI for various income ranges: 7.7% for AGIs below $25k, 1.1% for AGIs $25k-50k)
Percentage of individuals using paid preparers for their 2012 taxes: 46.9%
Here:
47%
State:
53%
(% for various income ranges: 46.0% for AGIs below $25k, 45.9% for AGIs $25k-50k, 48.7% for AGIs $50k-75k, 47.1% for AGIs $75k-100k, 49.2% for AGIs $100k-200k, 61.5% for AGIs over 200k)
Averages for the 2004 tax year for zip code 19050, filed in 2005:
Average Adjusted Gross Income (AGI) in 2004: $40,810 (Individual Income Tax Returns)
Here:
$40,810
State:
$48,049
Salary/wage: $39,481 (reported on 86.9% of returns)
Here:
$39,481
State:
$42,646
(% of AGI for various income ranges: 83.7% for AGIs below $10k, 77.8% for AGIs $10k-25k, 87.3% for AGIs $25k-50k, 87.5% for AGIs $50k-75k, 88.8% for AGIs $75k-100k, 75.5% for AGIs over 100k)
Taxable interest for individuals: $1,123 (reported on 36.8% of returns)
This zip code:
$1,123
Pennsylvania:
$1,657
(% of AGI for various income ranges: 4.1% for AGIs below $10k, 1.4% for AGIs $10k-25k, 0.8% for AGIs $25k-50k, 0.7% for AGIs $50k-75k, 0.5% for AGIs $75k-100k, 1.5% for AGIs over 100k)
Taxable dividends: $1,998 (reported on 17.4% of returns)
Here:
$1,998
State:
$3,566
(% of AGI for various income ranges: 2.4% for AGIs below $10k, 1.1% for AGIs $10k-25k, 0.6% for AGIs $25k-50k, 0.6% for AGIs $50k-75k, 0.6% for AGIs $75k-100k, 1.4% for AGIs over 100k)
Net capital gain/loss: +$3,912 (reported on 11.3% of returns)
Here:
+$3,912
State:
+$9,716
(% of AGI for various income ranges: -0.7% for AGIs below $10k, 0.2% for AGIs $10k-25k, 0.3% for AGIs $25k-50k, 0.4% for AGIs $50k-75k, 0.4% for AGIs $75k-100k, 3.8% for AGIs over 100k)
Profit/loss from business: +$7,580 (reported on 11.6% of returns)
Here:
+$7,580
State:
+$14,267
(% of AGI for various income ranges: 7.9% for AGIs below $10k, 5.1% for AGIs $10k-25k, 1.6% for AGIs $25k-50k, 1.4% for AGIs $50k-75k, 1.6% for AGIs $75k-100k, 2.3% for AGIs over 100k)
IRA payment deduction: $2,505 (reported on 2.2% of returns)
19050:
$2,505
Pennsylvania:
$2,903
(% of AGI for various income ranges: 0.3% for AGIs below $10k, 0.2% for AGIs $10k-25k, 0.2% for AGIs $25k-50k, 0.1% for AGIs $50k-75k, 0.1% for AGIs $75k-100k, 0.1% for AGIs over 100k)
Self-employed pension: $9,017 (reported on 0.4% of returns)
Here:
$9,017
Pennsylvania:
$14,674
Total itemized deductions: $16,549 (26% of AGI, reported on 42.1% of returns)
Here:
$16,549
State:
$18,804
Here:
25.8% of AGI
State:
19.5% of AGI
(% of AGI for various income ranges: 15.0% for AGIs below $10k, 12.4% for AGIs $10k-25k, 16.4% for AGIs $25k-50k, 19.8% for AGIs $50k-75k, 19.4% for AGIs $75k-100k, 15.5% for AGIs over 100k)
Charity contributions deductions: $3,272 (5% of AGI, reported on 38.2% of returns)
Here:
$3,272
State:
$3,337
Here:
5.0% of AGI
State:
3.3% of AGI
(% of AGI for various income ranges: 0.9% for AGIs below $10k, 1.8% for AGIs $10k-25k, 2.9% for AGIs $25k-50k, 3.6% for AGIs $50k-75k, 3.4% for AGIs $75k-100k, 3.2% for AGIs over 100k)
Total tax: $5,156 (reported on 74.2% of returns)
19050:
$5,156
State:
$8,008
(% of AGI for various income ranges: 2.4% for AGIs below $10k, 3.8% for AGIs $10k-25k, 6.7% for AGIs $25k-50k, 9.3% for AGIs $50k-75k, 10.2% for AGIs $75k-100k, 15.6% for AGIs over 100k)
Earned income credit: $1,682 (reported on 16.6% of returns)
Here:
$1,682
State:
$1,643
Percentage of individuals using paid preparers for their 2004 taxes: 50.0%
Here:
50%
State:
56%
(% for various income ranges: 44.1% for AGIs below $10k, 55.0% for AGIs $10k-25k, 50.0% for AGIs $25k-50k, 48.5% for AGIs $50k-75k, 50.7% for AGIs $75k-100k, 50.4% for AGIs over 100k)
Likely homosexual households (counted as self-reported same-sex unmarried-partner households)
Lesbian couples: 0.4% of all households
Gay men: 0.1% of all households
Household received Food Stamps/SNAP in the past 12 months: 2,258 Household did not receive Food Stamps/SNAP in the past 12 months: 10,154
Women who had a birth in the past 12 months: 281 (219 now married, 65 unmarried) Women who did not have a birth in the past 12 months: 5,877 (1,649 now married, 4,251 unmarried)
Housing units in zip code 19050 with a mortgage: 4,951 (563 second mortgage, 405 both second mortgage and home equity loan) Houses without a mortgage: 107
Median monthly owner costs for units with a mortgage: $1,621 Median monthly owner costs for units without a mortgage: $726
Residents with income below the poverty level in 2022:
This zip code:
11.3%
Whole state:
11.8%
Residents with income below 50% of the poverty level in 2022:
This zip code:
5.1%
Whole state:
6.1%
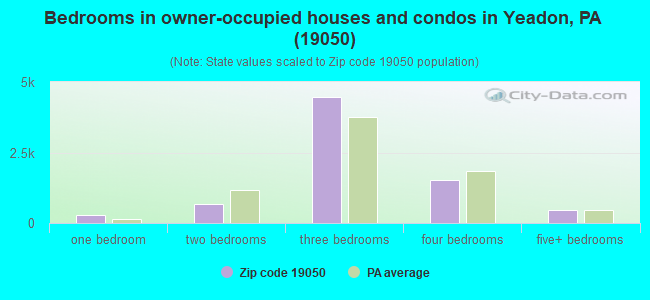
Median number of rooms in houses and condos:
Here:
6.6
State:
6.8
Median number of rooms in apartments:
Here:
4.0
State:
4.3
Notable locations in this zip code not listed on our city pages
Notable locations in zip code 19050: Millbank Mills (A), Pattonville (B), Gladstone Station (C), Congress Avenue Station (D), Lansdowne Borough Hall (E), Lansdowne Station (F), Fernwood Station (G), East Lansdowne Borough Hall (H), East Lansdowne Fire Company Station 24 (I), East Lansdowne Library (J), East Lansdowne Police Station (K), Lansdowne Fire Company Station 19 (L), Lansdowne Library (M), Lansdowne Police Department (N), Yeadon Borough Hall (O), Yeadon Fire Company Station 16 (P), Yeadon Library (Q), Yeadon Police Department (R). Display/hide their locations on the map
2,049 married couples with children.
2,104 single-parent households (655 men, 1,449 women).
85.1% of residents of 19050 zip code speak English at home.
3.1% of residents speak Spanish at home (57% very well, 30% well, 8% not well, 5% not at all).
6.0% of residents speak other Indo-European language at home (51% very well, 32% well, 14% not well, 2% not at all).
1.3% of residents speak Asian or Pacific Island language at home (44% very well, 46% well, 5% not well, 5% not at all).
4.7% of residents speak other language at home (68% very well, 30% well, 3% not well).
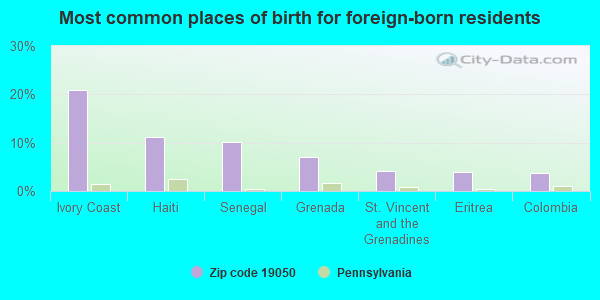
Foreign born population: 4,595 (15.9%) (65.0% of them are naturalized citizens)
This zip code:
15.9%
Whole state:
7.5%
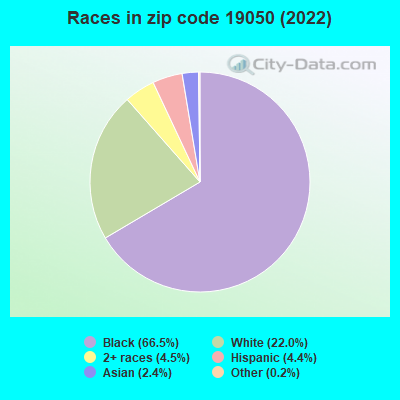
21%Ivory Coast
11%Haiti
10%Senegal
7%Grenada
4%St. Vincent and the Grenadines
4%Eritrea
4%Colombia
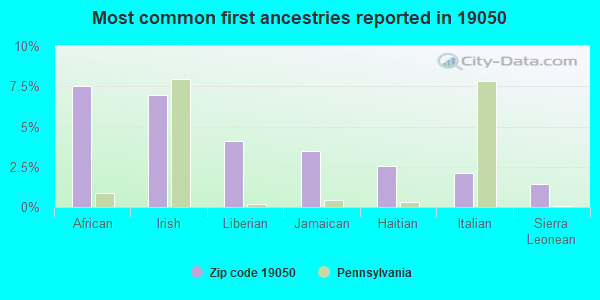
8%African
7%Irish
4%Liberian
3%Jamaican
3%Haitian
2%Italian
1%Sierra Leonean
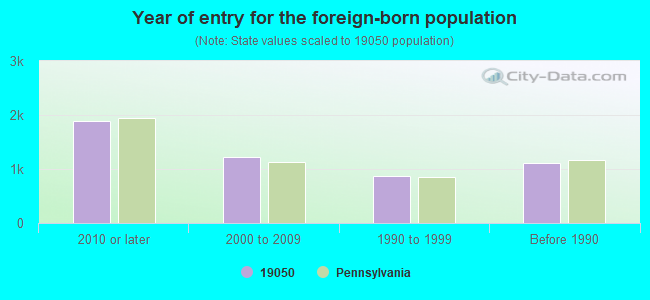
Year of entry for the foreign-born population
1,8952010 or later
1,2292000 to 2009
8631990 to 1999
1,104Before 1990
Facilities with environmental interests located in this zip code:
7 ELEVEN 20700 (501 CHURCH LANE in YEADON, PA)
STATE MASTER (Pennsylvania database) - RCRIS-PAD987327244, HAZARDOUS WASTE PROGRAM Small Quantity Generators, between 100 kg and 1000 kg of hazardous waste/month (Resource Conservation and Recovery Act (tracking hazardous waste)) - notification Organizations: OPERNAME (CONTACT/OPERATOR)
, SOUTHLAND CORPORATION THE (CONTACT/OWNER)
Alternative names: 7-ELEVEN #20700
ADVANCED CHEM CHEM BLENDING (41 S UNION AVE in LANSDOWNE, PA)
STATE MASTER (Pennsylvania database) - RCRIS-PADEP00005710, HAZARDOUS WASTE PROGRAM (Resource Conservation and Recovery Act (tracking hazardous waste)) Business NAICS classification: ALL OTHER MISCELLANEOUS CHEMICAL PRODUCT AND PREPARATION MANUFACTURING. Alternative names: ADVANCED CHEMICALS INC
BERM STUDIOS MFG (404 INDUSTRIAL PARK DRIVE in YEADON, PA)
STATE MASTER (Pennsylvania database) - RCRIS-PAD081874059, HAZARDOUS WASTE PROGRAM Small Quantity Generators, between 100 kg and 1000 kg of hazardous waste/month (Resource Conservation and Recovery Act (tracking hazardous waste)) - notification Organizations: OPERNAME (CONTACT/OPERATOR)
, OWNERNAME (CONTACT/OWNER)
Alternative names: BERM STUDIOS INC, BERM STUDIOS INC MFG
ARDMORE AVE ELEM (ARDMORE & ESSEX AVENUES in LANSDOWNE, PA)
STATE MASTER (Pennsylvania database) - RCRIS-PAD987360500, HAZARDOUS WASTE PROGRAM Conditionally Exempt Small Quantity Generators, less than 100 kg/month of hazardous waste (Resource Conservation and Recovery Act (tracking hazardous waste)) - notification Organizations: WILLIAM PENN SCHOOL DISTRICT (CONTACT/OWNER)
Alternative names: ARDMORE AVE ELEMENTARY, ARDMORE AVENUE ELEMENTARY SCHOOL
ARDMORE AVENUE ELEMENTARY SCHOOL (161 W. ARDMORE AVENUE in LANSDOWNE, PA)
(Geographic Names Information System) (National Center for Education Statistics) - STATE ID-1887 Organizations: WILLIAM PENN SD (SCHOOL DISTRICT)
Alternative names: ARDMORE AVENUE SCH
BELL AVENUE SCHOOL ( in YEADON, PA)
(National Center for Education Statistics) - STATE ID-7385 Organizations: WILLIAM PENN SD (SCHOOL DISTRICT)
ADVANCE SPECIALTY COMPANY INCORPORATED (20 SOUTH UNION AVENUE in LANSDOWNE, PA)
(Resource Conservation and Recovery Act (tracking hazardous waste)) Business NAICS classification: OTHER FABRICATED WIRE PRODUCT MANUFACTURING. Organizations: OPERNAME (CONTACT/OPERATOR)
, OWNERNAME (CONTACT/OWNER)
ANGUS MILLS INC (462 PENN ST in LANSDOWNE, PA)
(Resource Conservation and Recovery Act (tracking hazardous waste)) Business NAICS classification: OTHER KNIT FABRIC AND LACE MILLS. Organizations: OPERNAME (CONTACT/OPERATOR)
, OWNERNAME (CONTACT/OWNER)
AUSTIN AVENUE RADIATION SITE (133 AUSTIN AVENUE in LANSDOWNE, PA)
SUPERFUND NPL (Superfund database) RAD NPL (Radiation and radioactivity tracking)
BELL AVE ELEMENTARY SCHOOL (BELL AVE & MACDADE BLVD in YEADON, PA)
Conditionally Exempt Small Quantity Generators, less than 100 kg/month of hazardous waste (Resource Conservation and Recovery Act (tracking hazardous waste)) - notification Organizations: WILLIAM PENN SCHOOL DISTRICT (CONTACT/OWNER)
Alternative names: BELL AVE ELEM SCH
Housing units lacking complete plumbing facilities: 0.4% Housing units lacking complete kitchen facilities: 1.5%
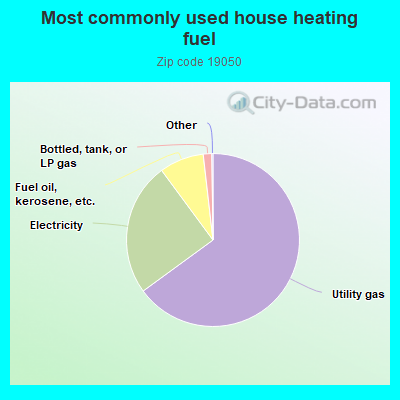
64.9%Utility gas
24.9%Electricity
8.3%Fuel oil, kerosene, etc.
1.6%Bottled, tank, or LP gas
Population in 1990: 30,411.
Place of birth for U.S.-born residents:
This state: 19,826
Northeast: 1,759
Midwest: 490
South: 1,508
West: 181
66% of the 19050 zip code residents lived in the same house 5 years ago. Out of people who lived in different houses, 46% lived in this county. Out of people who lived in different counties, 50% lived in Pennsylvania.
90% of the 19050 zip code residents lived in the same house 1 year ago. Out of people who lived in different houses, 36% moved from this county. Out of people who lived in different houses, 45% moved from different county within same state. Out of people who lived in different houses, 10% moved from different state. Out of people who lived in different houses, 9% moved from abroad.
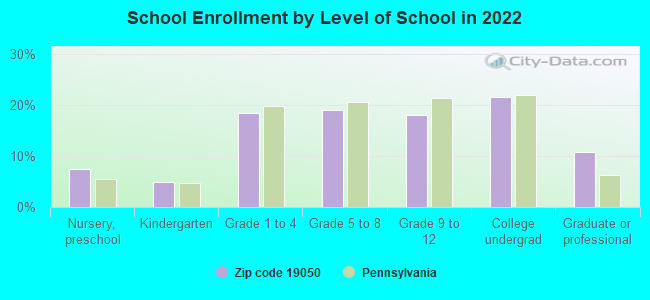
Private vs. public school enrollment:
Students in private schools in grades 1 to 8 (elementary and middle school): 875
Here:
37.0%
Pennsylvania:
15.7%
Students in private schools in grades 9 to 12 (high school): 158
Here:
14.1%
Pennsylvania:
13.4%
Students in private undergraduate colleges: 276
Here:
20.6%
Pennsylvania:
39.8%
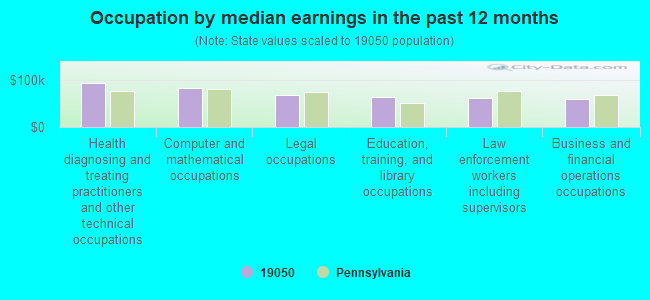
Occupation by median earnings in the past 12 months ($)
92,915Health diagnosing and treating practitioners and other technical occupations
81,650Computer and mathematical occupations
68,191Legal occupations
63,791Education, training, and library occupations
61,235Law enforcement workers including supervisors
58,425Business and financial operations occupations
Companies with federal contracts located in this zip code:
THOMAS, S J CO INC (140 BARTRAM AVE in LANSDOWNE, PA; small business) : $20,047,548 in 319 contractsfrom 1999 to 2006
Contracts for Architect - Engineer Services (including landscaping, interior layout, and designing), Maintenance, Repair or Alteration of Real Property -- Office Buildings, Maintenance, Repair or Alteration of Real Property -- Other Utilities, Maintenance, Repair or Alteration of Real Property -- Hospitals and Infirmaries, and moreby Navy, Public Buildings Service, Department of Veterans Affairs Signed by year:2000: $4,358,000; 2001: $3,030,960; 2002: $2,942,668; 2003: $1,979,719; 2004: $4,245,355; 2005: $3,339,216; 2006: $77,630.
Biggest contracts:
$2,097,000 with Navy for Architect - Engineer Services (including landscaping, interior layout, and designing). Taking place in NY. Signed on 2004-09-21. Completion date: 2005-05-06.
$1,679,000 with Public Buildings Service for Maintenance, Repair or Alteration of Real Property -- Office Buildings. Signed on 2000-08-15. Completion date: 2001-06-15.
$1,595,000 with Navy for Maintenance, Repair or Alteration of Real Property -- Other Utilities. Signed on 2005-03-31. Completion date: 2006-11-30.
$1,584,960 with Public Buildings Service for Maintenance, Repair or Alteration of Real Property -- Office Buildings. Signed on 2001-09-15. Completion date: 2002-06-15.
CONSTANTINE N POLITES & CO (833 GUENTHER AVE in YEADON, PA; small business) : $112,737 in 3 contractsfrom 2000 to 2005
$83,117 with U.S. Army Corps of Engineers - civil program financing only for Pipe, Tube and Rigid Tubing. Taking place in IA. Signed on 2000-11-17. Completion date: 2001-03-23.
$29,042 with Navy for Scaffolding Equipment and Concrete Forms. Signed on 2002-12-04. Completion date: 2003-06-30.
$578, same as above.Signed on 2005-07-25. Completion date: 2005-07-29.
CLEAR SOUND INC (546 PENN STREET in YEADON, PA; small business) : $35,607 in 2 contractsin 2004
$18,759 with Army for ADP Input/Output and Storage Devices. Signed on 2004-03-30. Completion date: 2004-09-30.
$16,848 with Army for Miscellaneous Electrical and Electronic Components. Signed on 2004-06-02. Completion date: 2004-06-22.
D N SUPPLY CORPORATION (80 E BALTIMORE AVE in LANSDOWNE, PA; small business)
$33,116 with Army for Plumbing Fixtures and Accessories. Taking place in NJ. Signed on 2000-10-18. Completion date: 2000-12-19.
GRASSWORKS LANDSCAPE DESIGN IN (14KELLEY ST in LANSDOWNE, PA; small business)
$28,200 with Army for Well Drilling/Exploratory Services. Signed on 2002-10-22. Completion date: 2002-11-30.
HALO SERVICE COMPANY (234 CRAWFORD AVE in LANSDOWNE, PA)
$6,576 with Navy for Maintenance, Repair and Rebuilding of Equipment -- Ground Effect Vehicles, Motor Vehicles, Trailers, and Cycles. Signed on 2005-08-15. Completion date: 2006-09-30.
DELAWARE TOOL & MACHINE CO (544 INDUSTRIAL PARK DR in YEADON, PA; small business) 50 employees, $0 revenue. Small Disadvantaged Business
$3,675 with Army for Miscellaneous Power Transmission Equipment. Signed on 2002-12-20. Completion date: 2003-06-20.
Top industries in this zip code by the number of employees in 2005:
Administrative and Support and Waste Management and Remediation Services: Security Guards and Patrol Services (250-499 employees: 1 establishment)
Health Care and Social Assistance: Nursing Care Facilities (100-249: 2)
2006 - 2018 National Fire Incident Reporting System (NFIRS) incidents
According to the data from the years 2006 - 2018 the average number of fires per year is 99. The highest number of reported fires - 285 took place in 2017, and the least - 0 in 2010. The data has a rising trend.
When looking into fire subcategories, the most incidents belonged to: Structure Fires (61.3%), and Other (27.7%).
Fire incident types reported to NFIRS in Zip Code 19050


 Nearest zip codes: 19023, 19082, 19142, 19018, 19143, 19079.


 According to the data from the years 2006 - 2018 the average number of fires per year is 99. The highest number of reported fires - 285 took place in 2017, and the least - 0 in 2010. The data has a rising trend.
 When looking into fire subcategories, the most incidents belonged to: Structure Fires (61.3%), and Other (27.7%).