Estimated zip code population in 2022: 31,874 Zip code population in 2010: 30,738 Zip code population in 2000: 32,013
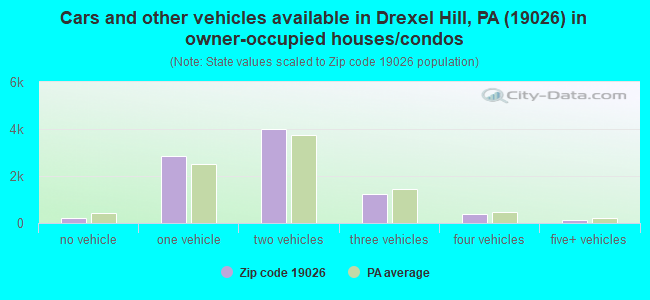
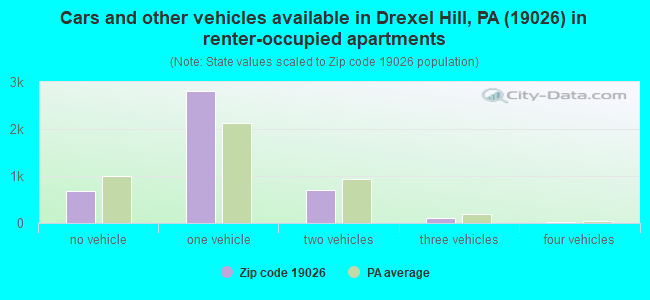
Houses and condos: 13,709 Renter-occupied apartments: 4,321
% of renters here:
33%
State:
31%
March 2022 cost of living index in zip code 19026: 102.8 (near average, U.S. average is 100)
Land area: 3.6 sq. mi. Water area: 0.0 sq. mi.
Population density: 8,802 people per square mile
(high).
OSM Map
General Map
Google Map
MSN Map
OSM Map
General Map
Google Map
MSN Map
OSM Map
General Map
Google Map
MSN Map
OSM Map
General Map
Google Map
MSN Map
Please wait while loading the map...
Real estate property taxes paid for housing units in 2022:
This zip code:
2.7% ($6,530)
Pennsylvania:
1.3% ($3,094)
Median real estate property taxes paid for housing units with mortgages in 2022: $6,617 (2.7%) Median real estate property taxes paid for housing units with no mortgage in 2022: $6,314 (2.6%)
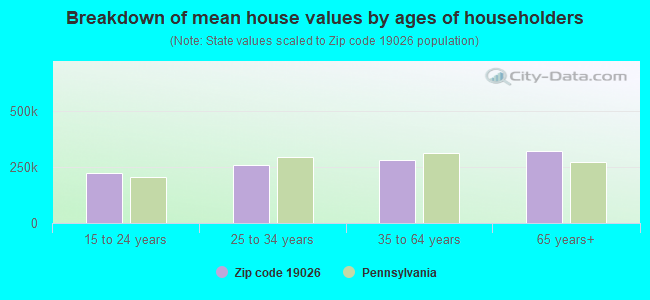
Estimated median house/condo value in 2022: $246,368
19026:
$246,368
Pennsylvania:
$245,500
According to our research of Pennsylvania and other state lists, there were 19 registered sex offenders living in 19026 zip code as of April 27, 2024. The ratio of all residents to sex offenders in zip code 19026 is 1,662 to 1. The ratio of registered sex offenders to all residents in this zip code is much lower than the state average.
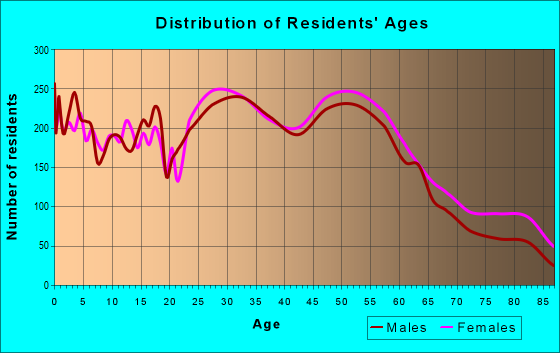
Median resident age:
This zip code:
36.9 years
Pennsylvania median age:
40.9 years
Average household size:
This zip code:
2.4 people
Pennsylvania:
2.4 people
Averages for the 2020 tax year for zip code 19026, filed in 2021:
Average Adjusted Gross Income (AGI) in 2020: $69,694 (Individual Income Tax Returns)
Here:
$69,694
State:
$75,707
Salary/wage: $63,364 (reported on 84.2% of returns)
Here:
$63,364
State:
$62,806
(% of AGI for various income ranges: 1051.5% for AGIs below $25k, 3508.3% for AGIs $25k-50k, 6728.0% for AGIs $50k-75k, 9873.4% for AGIs $75k-100k, 19557.7% for AGIs $100k-200k, 71267.9% for AGIs over 200k)
Taxable interest for individuals: $979 (reported on 28.5% of returns)
This zip code:
$979
Pennsylvania:
$1,633
(% of AGI for various income ranges: 16.7% for AGIs below $25k, 14.1% for AGIs $25k-50k, 23.3% for AGIs $50k-75k, 54.8% for AGIs $75k-100k, 90.9% for AGIs $100k-200k, 453.7% for AGIs over 200k)
Ordinary dividends: $3,971 (reported on 18.7% of returns)
Here:
$3,971
State:
$7,382
(% of AGI for various income ranges: 25.2% for AGIs below $25k, 28.3% for AGIs $25k-50k, 53.6% for AGIs $50k-75k, 117.4% for AGIs $75k-100k, 254.2% for AGIs $100k-200k, 1702.1% for AGIs over 200k)
Net capital gain/loss in AGI: +$10,894 (reported on 15.5% of returns)
Here:
+$10,894
State:
+$23,522
(% of AGI for various income ranges: 8.7% for AGIs below $25k, 21.6% for AGIs $25k-50k, 56.1% for AGIs $50k-75k, 69.4% for AGIs $75k-100k, 342.5% for AGIs $100k-200k, 8212.1% for AGIs over 200k)
Profit/loss from business: +$12,200 (reported on 15.4% of returns)
Here:
+$12,200
State:
+$16,274
(% of AGI for various income ranges: 121.6% for AGIs below $25k, 138.4% for AGIs $25k-50k, 130.2% for AGIs $50k-75k, 272.4% for AGIs $75k-100k, 552.3% for AGIs $100k-200k, 3424.2% for AGIs over 200k)
Taxable individual retirement arrangement distribution: $17,909 (reported on 7.9% of returns)
19026:
$17,909
Pennsylvania:
$18,583
(% of AGI for various income ranges: 48.7% for AGIs below $25k, 70.0% for AGIs $25k-50k, 135.7% for AGIs $50k-75k, 254.8% for AGIs $75k-100k, 577.7% for AGIs $100k-200k, 1921.7% for AGIs over 200k)
Self-employed (Keogh) retirement plans: $22,762 (reported on 0.5% of returns)
19026:
$22,762
Pennsylvania:
$25,407
(% of AGI for various income ranges: 7.8% for AGIs $25k-50k, 21.2% for AGIs $100k-200k, 519.6% for AGIs over 200k)
Total itemized deductions: $25,552 (reported on 10.8% of returns)
Here:
$25,552
State:
$34,850
(% of AGI for various income ranges: 66.3% for AGIs below $25k, 147.9% for AGIs $25k-50k, 388.4% for AGIs $50k-75k, 630.3% for AGIs $75k-100k, 883.6% for AGIs $100k-200k, 3755.4% for AGIs over 200k)
Charity contributions: $6,295 (reported on 8.6% of returns)
Here:
$6,295
State:
$12,392
(% of AGI for various income ranges: 3.5% for AGIs below $25k, 16.6% for AGIs $25k-50k, 61.4% for AGIs $50k-75k, 98.4% for AGIs $75k-100k, 212.1% for AGIs $100k-200k, 1042.9% for AGIs over 200k)
Taxes paid: $8,705 (reported on 10.7% of returns)
19026:
$8,705
State:
$8,200
(% of AGI for various income ranges: 19.9% for AGIs below $25k, 46.0% for AGIs $25k-50k, 153.1% for AGIs $50k-75k, 257.4% for AGIs $75k-100k, 308.1% for AGIs $100k-200k, 884.2% for AGIs over 200k)
Earned income credit: $1,945 (reported on 11.3% of returns)
Here:
$1,945
State:
$2,100
(% of AGI for various income ranges: 67.5% for AGIs below $25k, 49.3% for AGIs $25k-50k, 0.9% for AGIs $50k-75k)
Percentage of individuals using paid preparers for their 2020 taxes: 91.2%
Here:
91%
State:
92%
(% for various income ranges: 89.5% for AGIs below $25k, 93.0% for AGIs $25k-50k, 92.0% for AGIs $50k-75k, 90.4% for AGIs $75k-100k, 90.5% for AGIs $100k-200k, 92.1% for AGIs over 200k)
Averages for the 2012 tax year for zip code 19026, filed in 2013:
Average Adjusted Gross Income (AGI) in 2012: $60,781 (Individual Income Tax Returns)
Here:
$60,781
State:
$61,346
Salary/wage: $57,204 (reported on 85.3% of returns)
Here:
$57,204
State:
$51,902
(% of AGI for various income ranges: 68.8% for AGIs below $25k, 81.9% for AGIs $25k-50k, 81.8% for AGIs $50k-75k, 82.2% for AGIs $75k-100k, 84.0% for AGIs $100k-200k, 71.8% for AGIs over 200k)
Taxable interest for individuals: $1,080 (reported on 37.9% of returns)
This zip code:
$1,080
Pennsylvania:
$1,588
(% of AGI for various income ranges: 1.9% for AGIs below $25k, 0.6% for AGIs $25k-50k, 0.5% for AGIs $50k-75k, 0.6% for AGIs $75k-100k, 0.5% for AGIs $100k-200k, 1.0% for AGIs over 200k)
Ordinary dividends: $3,594 (reported on 22.5% of returns)
Here:
$3,594
State:
$5,827
(% of AGI for various income ranges: 2.2% for AGIs below $25k, 1.2% for AGIs $25k-50k, 0.9% for AGIs $50k-75k, 1.1% for AGIs $75k-100k, 1.0% for AGIs $100k-200k, 2.5% for AGIs over 200k)
Net capital gain/loss in AGI: +$4,140 (reported on 15.3% of returns)
Here:
+$4,140
State:
+$14,495
(% of AGI for various income ranges: 0.3% for AGIs $50k-75k, 0.5% for AGIs $75k-100k, 0.7% for AGIs $100k-200k, 4.6% for AGIs over 200k)
Profit/loss from business: +$14,229 (reported on 12.8% of returns)
Here:
+$14,229
State:
+$16,268
(% of AGI for various income ranges: 7.8% for AGIs below $25k, 2.9% for AGIs $25k-50k, 2.4% for AGIs $50k-75k, 2.5% for AGIs $75k-100k, 2.4% for AGIs $100k-200k, 3.8% for AGIs over 200k)
Taxable individual retirement arrangement distribution: $13,047 (reported on 10.1% of returns)
19026:
$13,047
Pennsylvania:
$14,550
(% of AGI for various income ranges: 3.8% for AGIs below $25k, 2.0% for AGIs $25k-50k, 1.9% for AGIs $50k-75k, 1.9% for AGIs $75k-100k, 2.2% for AGIs $100k-200k, 2.2% for AGIs over 200k)
Self-employment retirement plans: $14,040 (reported on 0.6% of returns)
19026:
$14,040
Pennsylvania:
$20,922
(% of AGI for various income ranges: 0.2% for AGIs $50k-75k, 0.2% for AGIs $100k-200k, 0.4% for AGIs over 200k)
Total itemized deductions: $21,490 (22% of AGI, reported on 43.6% of returns)
Here:
$21,490
State:
$23,538
Here:
21.5% of AGI
State:
18.4% of AGI
(% of AGI for various income ranges: 13.1% for AGIs below $25k, 11.5% for AGIs $25k-50k, 16.1% for AGIs $50k-75k, 17.7% for AGIs $75k-100k, 17.1% for AGIs $100k-200k, 13.5% for AGIs over 200k)
Charity contributions: $2,791 (reported on 37.2% of returns)
Here:
$2,791
State:
$4,025
(% of AGI for various income ranges: 0.8% for AGIs below $25k, 1.0% for AGIs $25k-50k, 1.6% for AGIs $50k-75k, 1.7% for AGIs $75k-100k, 2.0% for AGIs $100k-200k, 2.3% for AGIs over 200k)
Taxes paid: $10,344 (reported on 43.4% of returns)
19026:
$10,344
State:
$9,982
(% of AGI for various income ranges: 4.7% for AGIs below $25k, 4.8% for AGIs $25k-50k, 7.1% for AGIs $50k-75k, 8.5% for AGIs $75k-100k, 8.7% for AGIs $100k-200k, 7.3% for AGIs over 200k)
Earned income credit: $1,855 (reported on 11.0% of returns)
Here:
$1,855
State:
$2,106
(% of AGI for various income ranges: 4.0% for AGIs below $25k, 0.7% for AGIs $25k-50k)
Percentage of individuals using paid preparers for their 2012 taxes: 47.2%
Here:
47%
State:
53%
(% for various income ranges: 44.4% for AGIs below $25k, 43.8% for AGIs $25k-50k, 48.2% for AGIs $50k-75k, 50.6% for AGIs $75k-100k, 51.9% for AGIs $100k-200k, 62.5% for AGIs over 200k)
Averages for the 2004 tax year for zip code 19026, filed in 2005:
Average Adjusted Gross Income (AGI) in 2004: $50,400 (Individual Income Tax Returns)
Here:
$50,400
State:
$48,049
Salary/wage: $48,579 (reported on 84.0% of returns)
Here:
$48,579
State:
$42,646
(% of AGI for various income ranges: 82.0% for AGIs below $10k, 67.6% for AGIs $10k-25k, 82.5% for AGIs $25k-50k, 84.6% for AGIs $50k-75k, 86.5% for AGIs $75k-100k, 78.0% for AGIs over 100k)
Taxable interest for individuals: $1,413 (reported on 53.1% of returns)
This zip code:
$1,413
Pennsylvania:
$1,657
(% of AGI for various income ranges: 5.9% for AGIs below $10k, 3.7% for AGIs $10k-25k, 1.6% for AGIs $25k-50k, 1.2% for AGIs $50k-75k, 1.0% for AGIs $75k-100k, 1.2% for AGIs over 100k)
Taxable dividends: $2,515 (reported on 30.7% of returns)
Here:
$2,515
State:
$3,566
(% of AGI for various income ranges: 5.4% for AGIs below $10k, 2.6% for AGIs $10k-25k, 1.2% for AGIs $25k-50k, 1.1% for AGIs $50k-75k, 1.1% for AGIs $75k-100k, 1.8% for AGIs over 100k)
Net capital gain/loss: +$5,153 (reported on 21.3% of returns)
Here:
+$5,153
State:
+$9,716
(% of AGI for various income ranges: -1.6% for AGIs below $10k, -0.4% for AGIs $10k-25k, 0.3% for AGIs $25k-50k, 0.6% for AGIs $50k-75k, 0.7% for AGIs $75k-100k, 5.1% for AGIs over 100k)
Profit/loss from business: +$13,746 (reported on 11.9% of returns)
Here:
+$13,746
State:
+$14,267
(% of AGI for various income ranges: 6.5% for AGIs below $10k, 6.6% for AGIs $10k-25k, 2.9% for AGIs $25k-50k, 2.3% for AGIs $50k-75k, 2.6% for AGIs $75k-100k, 3.5% for AGIs over 100k)
IRA payment deduction: $2,936 (reported on 3.0% of returns)
19026:
$2,936
Pennsylvania:
$2,903
(% of AGI for various income ranges: 0.3% for AGIs below $10k, 0.2% for AGIs $10k-25k, 0.3% for AGIs $25k-50k, 0.2% for AGIs $50k-75k, 0.2% for AGIs $75k-100k, 0.1% for AGIs over 100k)
Self-employed pension: $11,303 (reported on 0.8% of returns)
Here:
$11,303
Pennsylvania:
$14,674
(% of AGI for various income ranges: 0.1% for AGIs $25k-50k, 0.1% for AGIs $50k-75k, 0.1% for AGIs $75k-100k, 0.4% for AGIs over 100k)
Total itemized deductions: $17,688 (21% of AGI, reported on 43.5% of returns)
Here:
$17,688
State:
$18,804
Here:
21.5% of AGI
State:
19.5% of AGI
(% of AGI for various income ranges: 14.2% for AGIs below $10k, 12.0% for AGIs $10k-25k, 13.2% for AGIs $25k-50k, 16.7% for AGIs $50k-75k, 17.6% for AGIs $75k-100k, 15.1% for AGIs over 100k)
Charity contributions deductions: $2,555 (3% of AGI, reported on 40.1% of returns)
Here:
$2,555
State:
$3,337
Here:
3.0% of AGI
State:
3.3% of AGI
(% of AGI for various income ranges: 1.0% for AGIs below $10k, 1.3% for AGIs $10k-25k, 1.6% for AGIs $25k-50k, 2.0% for AGIs $50k-75k, 2.1% for AGIs $75k-100k, 2.4% for AGIs over 100k)
Total tax: $7,318 (reported on 80.3% of returns)
19026:
$7,318
State:
$8,008
(% of AGI for various income ranges: 2.3% for AGIs below $10k, 4.8% for AGIs $10k-25k, 8.1% for AGIs $25k-50k, 9.3% for AGIs $50k-75k, 10.1% for AGIs $75k-100k, 16.9% for AGIs over 100k)
Earned income credit: $1,406 (reported on 7.3% of returns)
Here:
$1,406
State:
$1,643
Percentage of individuals using paid preparers for their 2004 taxes: 47.8%
Here:
48%
State:
56%
(% for various income ranges: 40.2% for AGIs below $10k, 48.7% for AGIs $10k-25k, 46.8% for AGIs $25k-50k, 50.2% for AGIs $50k-75k, 50.7% for AGIs $75k-100k, 54.9% for AGIs over 100k)
Likely homosexual households (counted as self-reported same-sex unmarried-partner households)
Lesbian couples: 0.0% of all households
Gay men: 0.2% of all households
Household received Food Stamps/SNAP in the past 12 months: 1,036 Household did not receive Food Stamps/SNAP in the past 12 months: 12,004
Women who had a birth in the past 12 months: 703 (249 now married, 401 unmarried) Women who did not have a birth in the past 12 months: 7,472 (2,863 now married, 4,612 unmarried)
Housing units in zip code 19026 with a mortgage: 5,947 (698 second mortgage, 70 home equity loan, 577 both second mortgage and home equity loan) Houses without a mortgage: 213
Median monthly owner costs for units with a mortgage: $1,959 Median monthly owner costs for units without a mortgage: $919
Residents with income below the poverty level in 2022:
This zip code:
8.0%
Whole state:
11.8%
Residents with income below 50% of the poverty level in 2022:
This zip code:
4.4%
Whole state:
6.1%
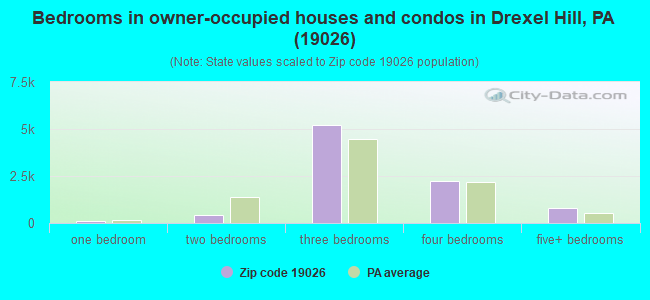
Median number of rooms in houses and condos:
Here:
7.0
State:
6.8
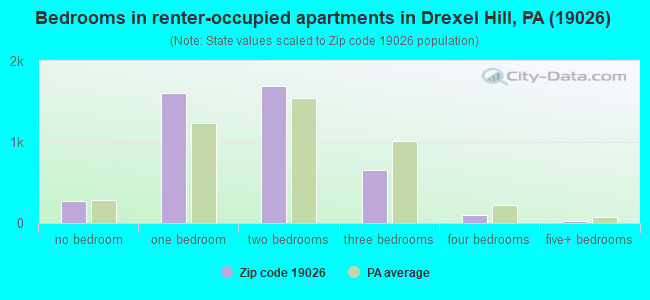
Median number of rooms in apartments:
Here:
3.9
State:
4.3
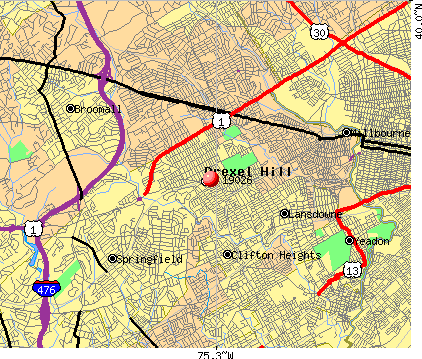
Notable locations in this zip code not listed on our city pages
Notable locations in zip code 19026: Kellyville (A), Garrettford (B), Heyville (C), Aronimink Station (D), Huey Avenue Station (E), Drexel Hill Junction Station (F), Drexel Park Station (G), Drexelbrook Station (H), Drexeline Station (I), Irvington Road Station (J), Lansdowne Avenue Station (K), School Lane Station (L), Oakview Station (M), Upper Darby Township Fire Department - Garrettford - Drexel Hill Fire Company Station 20 (N). Display/hide their locations on the map
In group quarters: 113 (-1 institutionalized population)
Size of family households: 3,744 2-persons, 1,967 3-persons, 1,860 4-persons, 642 5-persons, 156 6-persons, 56 7-or-more-persons
Size of nonfamily households: 3,729 1-person, 855 2-persons, 55 3-persons
4,420 married couples with children.
1,746 single-parent households (405 men, 1,341 women).
85.9% of residents of 19026 zip code speak English at home.
3.0% of residents speak Spanish at home (75% very well, 19% well, 6% not well, 1% not at all).
5.1% of residents speak other Indo-European language at home (61% very well, 30% well, 7% not well, 2% not at all).
3.3% of residents speak Asian or Pacific Island language at home (53% very well, 26% well, 21% not well).
2.6% of residents speak other language at home (53% very well, 36% well, 10% not well, 1% not at all).
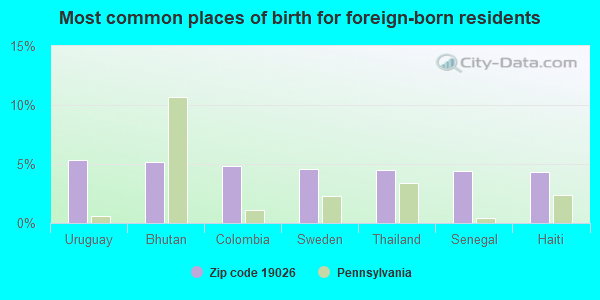
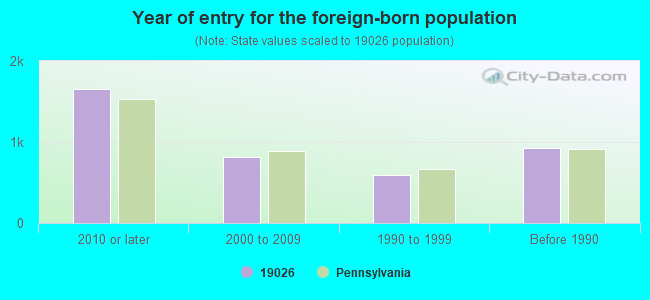
Foreign born population: 3,664 (11.5%) (64.5% of them are naturalized citizens)
Facilities with environmental interests located in this zip code:
7 ELEVEN 20078 (3401 GARRETT ROAD in DREXEL HILL, PA)
STATE MASTER (Pennsylvania database) - RCRIS-PAD987327392, HAZARDOUS WASTE PROGRAM (Resource Conservation and Recovery Act (tracking hazardous waste)) Organizations: OPERNAME (CONTACT/OPERATOR)
, SOUTHLAND CORPORATION THE (CONTACT/OWNER)
Alternative names: 7 ELEVEN #20078
AUTOBAHN MOTOR CARS (5018 TOWNSHIP LINE RD in DREXEL HILL, PA)
STATE MASTER (Pennsylvania database) - RCRIS-PAD982568917, HAZARDOUS WASTE PROGRAM Small Quantity Generators, between 100 kg and 1000 kg of hazardous waste/month (Resource Conservation and Recovery Act (tracking hazardous waste)) - notification Organizations: OPERNAME (CONTACT/OPERATOR)
, OPDERBECK, GERD (CONTACT/OWNER)
AMOCO 81 (3620 GARRETT RD in DREXEL HILL, PA)
STATE MASTER (Pennsylvania database) - RCRIS-PAD987359296, HAZARDOUS WASTE PROGRAM Small Quantity Generators, between 100 kg and 1000 kg of hazardous waste/month (Resource Conservation and Recovery Act (tracking hazardous waste)) - notification Organizations: AMOCO OIL CO (CONTACT/OWNER)
Alternative names: DREXEL HILL AMOCO
ARONIMINK ELEMENTARY SCHOOL (4611 BOND AVENUE in DREXEL HILL, PA)
(Geographic Names Information System) (National Center for Education Statistics) - STATE ID-1959 Organizations: UPPER DARBY SD (SCHOOL DISTRICT)
Alternative names: ARONIMINK EL SCH
BLANCO CLEANERS & DYERS (3706 GARRETT RD in DREXEL HILL, PA)
AIR MINOR (AIRS/AFS) (Resource Conservation and Recovery Act (tracking hazardous waste)) Business SIC classification: DRYCLEANING PLANTS, EXCEPT RUG CLEANING Organizations: OPERNAME (CONTACT/OPERATOR)
, MAHTESIAN LEON A (CONTACT/OWNER)
Alternative names: BLANCO CLNR SVC, BLANCO CLNRS
AVA GLECTRONICS CORP (4000 BRIDGE ST in DREXEL HILL, PA)
(Resource Conservation and Recovery Act (tracking hazardous waste)) Business NAICS classification: OTHER ELECTRONIC COMPONENT MANUFACTURING. Organizations: OPERNAME (CONTACT/OPERATOR)
ATLANTIC SERVICE STATION (TOWNSHIP LINE & STATE RD-TANKS in DREXEL HILL, PA)
Conditionally Exempt Small Quantity Generators, less than 100 kg/month of hazardous waste (Resource Conservation and Recovery Act (tracking hazardous waste)) - notification Organizations: OPERNAME (CONTACT/OPERATOR)
, ATLANTIC REFINING & MARKETING (CONTACT/OWNER)
ATLANTIC SERVICE STATION (TOWNSHIP KEYSTONE in DREXEL HILL, PA)
Conditionally Exempt Small Quantity Generators, less than 100 kg/month of hazardous waste (Resource Conservation and Recovery Act (tracking hazardous waste)) - notification Organizations: OPERNAME (CONTACT/OPERATOR)
AMOCO 81 TANKS (3620 GARRETT RD TANKS in DREXEL HILL, PA)
Small Quantity Generators, between 100 kg and 1000 kg of hazardous waste/month (Resource Conservation and Recovery Act (tracking hazardous waste)) - notification Organizations: AMOCO OIL COMPANY (CONTACT/OWNER)
ARCHBISHOP PRENDERGAST H.S. (201 N. LANSDOWNE AVE. in DREXEL HILL, PA)
COMPLIANCE ACTIVITY (Tracking inspections of insecticide, fungicide, and rodenticide, and toxic substances)
Housing units lacking complete plumbing facilities: 0.2% Housing units lacking complete kitchen facilities: 0.8%
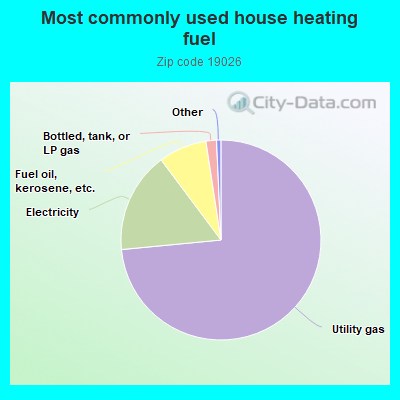
73.4%Utility gas
16.3%Electricity
7.8%Fuel oil, kerosene, etc.
1.7%Bottled, tank, or LP gas
Population in 1990: 32,559.
Place of birth for U.S.-born residents:
This state: 23,514
Northeast: 2,107
Midwest: 685
South: 1,180
West: 373
69% of the 19026 zip code residents lived in the same house 5 years ago. Out of people who lived in different houses, 62% lived in this county. Out of people who lived in different counties, 50% lived in Pennsylvania.
90% of the 19026 zip code residents lived in the same house 1 year ago. Out of people who lived in different houses, 46% moved from this county. Out of people who lived in different houses, 35% moved from different county within same state. Out of people who lived in different houses, 14% moved from different state. Out of people who lived in different houses, 3% moved from abroad.
Private vs. public school enrollment:
Students in private schools in grades 1 to 8 (elementary and middle school): 804
Here:
29.8%
Pennsylvania:
15.7%
Students in private schools in grades 9 to 12 (high school): 335
Here:
22.4%
Pennsylvania:
13.4%
Students in private undergraduate colleges: 546
Here:
31.7%
Pennsylvania:
39.8%
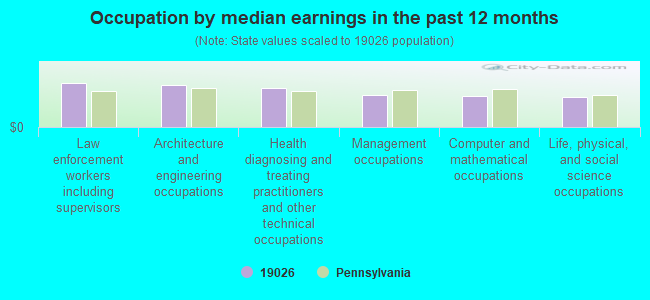
Occupation by median earnings in the past 12 months ($)
104,912Law enforcement workers including supervisors
99,255Architecture and engineering occupations
92,832Health diagnosing and treating practitioners and other technical occupations
77,073Management occupations
74,003Computer and mathematical occupations
71,189Life, physical, and social science occupations
Companies with federal contracts located in this zip code (DREXEL HILL, PA):
TITANIC CONTROLS INC (611 MORGAN AVE 15; small business) : $480,349 in 11 contractsfrom 1999 to 2005
Contracts for Miscellaneous Ship and Marine Equipment, Refrigeration and Air Conditioning Components, Electrical and Electronic Properties Measuring and Testing Instruments, Cable, Cord, and Wire Assemblies: Communications Equipment, and moreby Navy Signed by year:2000: $139,741; 2001: $26,142; 2002: $130,907; 2003: $0; 2004: $8,035; 2005: $3,550; 2006: $0.
Biggest contracts:
$95,400 with Navy for Miscellaneous Ship and Marine Equipment. Signed on 2000-07-31. Completion date: 2001-03-14.
$82,975, same as above.Signed on 2002-04-22. Completion date: 2002-09-02.
$82,621 with Navy for Refrigeration and Air Conditioning Components. Signed on 1999-11-17. Completion date: 2000-05-17.
$48,742, same as above.Signed on 1999-11-17. Completion date: 2000-06-14.
TOTAL CONSTRUCTION INC (4812 DREXELBROOK DR; small business)
$187,400 with Navy for Maintenance, Repair or Alteration of Real Property -- Heating and Cooling Plants. Taking place in NC. Signed on 2000-09-05. Completion date: 2001-06-17.
GERALD P H BALLOUGH, PH D (825 BLYTHE AVENUE; small business) : $82,623 in 9 contractsfrom 2002 to 2005
Contracts for Other Professional Services, Chemical/Biological Studies and Analyses, Other Administrative Support Services by Army Signed by year:2000: $0; 2001: $0; 2002: $13,000; 2003: $12,000; 2004: $25,623; 2005: $32,000; 2006: $0.
Biggest contracts:
$19,500 with Army for Other Professional Services. Taking place in MD. Signed on 2004-05-20. Completion date: 2004-12-31.
$18,000, same as above.Signed on 2005-08-10. Completion date: 2006-07-31.
$13,000 with Army for Chemical/Biological Studies and Analyses. Taking place in MD. Signed on 2002-07-08. Completion date: 2002-12-31.
$12,000, same as above.Signed on 2003-04-17. Completion date: 2003-12-31.
ASSOCIATED STEAM SPECIALTY COM (3709 JONES ST; small business) : $34,894 in 3 contractsfrom 2003 to 2006
$15,506 with Army for Space and Water Heating Equipment. Signed on 2006-05-24. Completion date: 2006-05-30.
$10,340 with Army for Fans, Air Circulators, and Blower Equipment. Signed on 2004-08-12. Completion date: 2004-09-08.
$9,048 with Army for Power and Hand Pumps. Signed on 2003-10-09. Completion date: 2003-10-27.
ATLANTIC PETROLEUM TECHNOLOGIE (740 R BURMONT RD)
$28,895 with Navy for Construction of Structures and Facilities -- Other Non-Building Facilities. Signed on 2001-09-28. Completion date: 2001-11-27.
WALTER, JOSEPH R (17 TREATY RD; small business)
$17,028 with Army for Maintenance, Repair and Rebuilding of Equipment -- Plumbing, Heating, and Waste Disposal Equipment. Taking place in NJ. Signed on 2006-01-26. Completion date: 2006-03-12.
MCGRORY, JOHN (3825 PLUMSTEAD AVE; small business)
-$26,400 with Defense Logistics Agency for Plastics Fabricated Materials. Signed on 1999-11-15. Completion date: 1999-11-15.
Top industries in this zip code by the number of employees in 2005:
Health Care and Social Assistance: General Medical and Surgical Hospitals (over 1000 employees: 1 establishment, 250-499 employees: 1 establishment)
Health Care and Social Assistance: Offices of Physicians (except Mental Health Specialists) (50-99: 1, 20-49: 3, 10-19: 8, 5-9: 15, 1-4: 12)
2004 - 2018 National Fire Incident Reporting System (NFIRS) incidents
Based on the data from the years 2004 - 2018 the average number of fires per year is 15. The highest number of fires - 78 took place in 2018, and the least - 0 in 2007. The data has an increasing trend.
When looking into fire subcategories, the most reports belonged to: Structure Fires (55.4%), and Outside Fires (35.1%).
Fire incident types reported to NFIRS in Zip Code 19026


 Nearest zip codes: 19018, 19083, 19082, 19064, 19050, 19036.
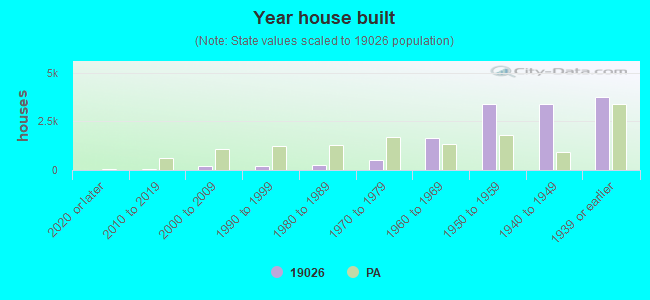


 Based on the data from the years 2004 - 2018 the average number of fires per year is 15. The highest number of fires - 78 took place in 2018, and the least - 0 in 2007. The data has an increasing trend.
 When looking into fire subcategories, the most reports belonged to: Structure Fires (55.4%), and Outside Fires (35.1%).