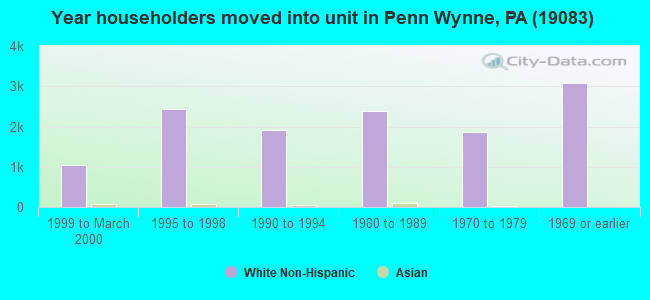
Estimated zip code population in 2022: 37,093 Zip code population in 2010: 35,878 Zip code population in 2000: 36,300
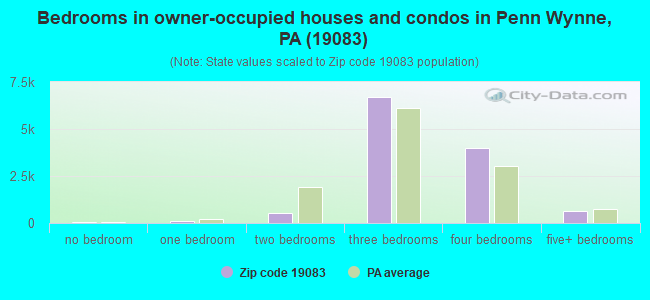
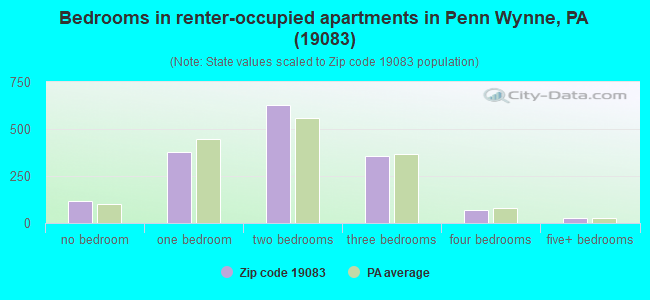
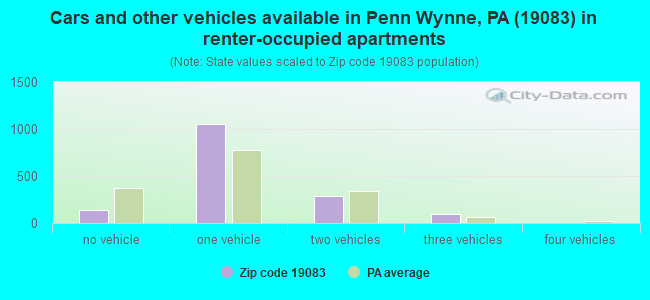
Houses and condos: 13,731 Renter-occupied apartments: 1,572
% of renters here:
12%
State:
31%
March 2022 cost of living index in zip code 19083: 104.1 (near average, U.S. average is 100)
Land area: 5.6 sq. mi. Water area: 0.0 sq. mi.
Population density: 6,675 people per square mile
(high).
OSM Map
General Map
Google Map
MSN Map
OSM Map
General Map
Google Map
MSN Map
OSM Map
General Map
Google Map
MSN Map
OSM Map
General Map
Google Map
MSN Map
Please wait while loading the map...
Real estate property taxes paid for housing units in 2022:
This zip code:
1.6% ($6,750)
Pennsylvania:
1.3% ($3,094)
Median real estate property taxes paid for housing units with mortgages in 2022: $7,042 (1.5%) Median real estate property taxes paid for housing units with no mortgage in 2022: $6,237 (1.6%)
Estimated median house/condo value in 2022: $431,741
19083:
$431,741
Pennsylvania:
$245,500
According to our research of Pennsylvania and other state lists, there were 15 registered sex offenders living in 19083 zip code as of April 27, 2024. The ratio of all residents to sex offenders in zip code 19083 is 2,489 to 1. The ratio of registered sex offenders to all residents in this zip code is much lower than the state average.
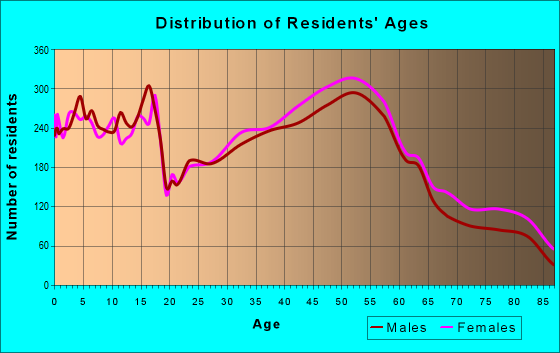
Median resident age:
This zip code:
39.2 years
Pennsylvania median age:
40.9 years
Average household size:
This zip code:
2.7 people
Pennsylvania:
2.4 people
Averages for the 2020 tax year for zip code 19083, filed in 2021:
Average Adjusted Gross Income (AGI) in 2020: $101,328 (Individual Income Tax Returns)
Here:
$101,328
State:
$75,707
Salary/wage: $93,226 (reported on 82.8% of returns)
Here:
$93,226
State:
$62,806
(% of AGI for various income ranges: 1073.3% for AGIs below $25k, 3562.5% for AGIs $25k-50k, 6409.6% for AGIs $50k-75k, 9611.2% for AGIs $75k-100k, 20233.0% for AGIs $100k-200k, 77340.7% for AGIs over 200k)
Taxable interest for individuals: $1,255 (reported on 44.7% of returns)
This zip code:
$1,255
Pennsylvania:
$1,633
(% of AGI for various income ranges: 34.0% for AGIs below $25k, 44.7% for AGIs $25k-50k, 54.0% for AGIs $50k-75k, 89.6% for AGIs $75k-100k, 112.3% for AGIs $100k-200k, 493.6% for AGIs over 200k)
Ordinary dividends: $5,005 (reported on 35.2% of returns)
Here:
$5,005
State:
$7,382
(% of AGI for various income ranges: 58.2% for AGIs below $25k, 88.0% for AGIs $25k-50k, 169.1% for AGIs $50k-75k, 238.5% for AGIs $75k-100k, 329.2% for AGIs $100k-200k, 2040.7% for AGIs over 200k)
Net capital gain/loss in AGI: +$12,102 (reported on 28.9% of returns)
Here:
+$12,102
State:
+$23,522
(% of AGI for various income ranges: 27.8% for AGIs below $25k, 66.7% for AGIs $25k-50k, 120.1% for AGIs $50k-75k, 225.5% for AGIs $75k-100k, 486.9% for AGIs $100k-200k, 6319.7% for AGIs over 200k)
Profit/loss from business: +$21,293 (reported on 16.5% of returns)
Here:
+$21,293
State:
+$16,274
(% of AGI for various income ranges: 121.3% for AGIs below $25k, 256.1% for AGIs $25k-50k, 293.0% for AGIs $50k-75k, 395.8% for AGIs $75k-100k, 760.3% for AGIs $100k-200k, 3674.6% for AGIs over 200k)
Taxable individual retirement arrangement distribution: $19,651 (reported on 11.6% of returns)
19083:
$19,651
Pennsylvania:
$18,583
(% of AGI for various income ranges: 87.4% for AGIs below $25k, 161.5% for AGIs $25k-50k, 257.0% for AGIs $50k-75k, 349.6% for AGIs $75k-100k, 636.0% for AGIs $100k-200k, 1510.1% for AGIs over 200k)
Self-employed (Keogh) retirement plans: $19,509 (reported on 1.2% of returns)
19083:
$19,509
Pennsylvania:
$25,407
(% of AGI for various income ranges: 19.8% for AGIs $50k-75k, 39.7% for AGIs $100k-200k, 419.9% for AGIs over 200k)
Total itemized deductions: $28,262 (reported on 14.0% of returns)
Here:
$28,262
State:
$34,850
(% of AGI for various income ranges: 121.0% for AGIs below $25k, 247.6% for AGIs $25k-50k, 473.5% for AGIs $50k-75k, 659.8% for AGIs $75k-100k, 859.8% for AGIs $100k-200k, 3539.3% for AGIs over 200k)
Charity contributions: $5,914 (reported on 11.9% of returns)
Here:
$5,914
State:
$12,392
(% of AGI for various income ranges: 6.1% for AGIs below $25k, 26.9% for AGIs $25k-50k, 50.0% for AGIs $50k-75k, 100.2% for AGIs $75k-100k, 148.0% for AGIs $100k-200k, 868.8% for AGIs over 200k)
Taxes paid: $8,957 (reported on 13.9% of returns)
19083:
$8,957
State:
$8,200
(% of AGI for various income ranges: 32.5% for AGIs below $25k, 72.7% for AGIs $25k-50k, 174.3% for AGIs $50k-75k, 250.4% for AGIs $75k-100k, 291.7% for AGIs $100k-200k, 939.4% for AGIs over 200k)
Earned income credit: $1,676 (reported on 5.8% of returns)
Here:
$1,676
State:
$2,100
(% of AGI for various income ranges: 38.4% for AGIs below $25k, 39.8% for AGIs $25k-50k)
Percentage of individuals using paid preparers for their 2020 taxes: 90.2%
Here:
90%
State:
92%
(% for various income ranges: 87.9% for AGIs below $25k, 90.3% for AGIs $25k-50k, 89.8% for AGIs $50k-75k, 90.3% for AGIs $75k-100k, 91.2% for AGIs $100k-200k, 92.8% for AGIs over 200k)
Averages for the 2012 tax year for zip code 19083, filed in 2013:
Average Adjusted Gross Income (AGI) in 2012: $75,724 (Individual Income Tax Returns)
Here:
$75,724
State:
$61,346
Salary/wage: $70,911 (reported on 83.5% of returns)
Here:
$70,911
State:
$51,902
(% of AGI for various income ranges: 65.8% for AGIs below $25k, 74.8% for AGIs $25k-50k, 74.9% for AGIs $50k-75k, 78.8% for AGIs $75k-100k, 84.8% for AGIs $100k-200k, 72.1% for AGIs over 200k)
Taxable interest for individuals: $1,254 (reported on 49.0% of returns)
This zip code:
$1,254
Pennsylvania:
$1,588
(% of AGI for various income ranges: 2.5% for AGIs below $25k, 1.3% for AGIs $25k-50k, 1.0% for AGIs $50k-75k, 0.8% for AGIs $75k-100k, 0.6% for AGIs $100k-200k, 0.7% for AGIs over 200k)
Ordinary dividends: $3,911 (reported on 34.9% of returns)
Here:
$3,911
State:
$5,827
(% of AGI for various income ranges: 3.7% for AGIs below $25k, 2.3% for AGIs $25k-50k, 1.9% for AGIs $50k-75k, 1.5% for AGIs $75k-100k, 1.3% for AGIs $100k-200k, 2.3% for AGIs over 200k)
Net capital gain/loss in AGI: +$5,430 (reported on 24.2% of returns)
Here:
+$5,430
State:
+$14,495
(% of AGI for various income ranges: 0.1% for AGIs $25k-50k, 0.5% for AGIs $50k-75k, 0.5% for AGIs $75k-100k, 0.7% for AGIs $100k-200k, 5.7% for AGIs over 200k)
Profit/loss from business: +$19,107 (reported on 15.7% of returns)
Here:
+$19,107
State:
+$16,268
(% of AGI for various income ranges: 9.1% for AGIs below $25k, 4.9% for AGIs $25k-50k, 3.9% for AGIs $50k-75k, 3.7% for AGIs $75k-100k, 3.2% for AGIs $100k-200k, 4.2% for AGIs over 200k)
Taxable individual retirement arrangement distribution: $14,187 (reported on 13.0% of returns)
19083:
$14,187
Pennsylvania:
$14,550
(% of AGI for various income ranges: 5.6% for AGIs below $25k, 3.0% for AGIs $25k-50k, 3.2% for AGIs $50k-75k, 2.6% for AGIs $75k-100k, 2.0% for AGIs $100k-200k, 2.0% for AGIs over 200k)
Self-employment retirement plans: $15,458 (reported on 1.3% of returns)
19083:
$15,458
Pennsylvania:
$20,922
(% of AGI for various income ranges: 0.2% for AGIs $25k-50k, 0.1% for AGIs $75k-100k, 0.2% for AGIs $100k-200k, 0.6% for AGIs over 200k)
Total itemized deductions: $23,303 (20% of AGI, reported on 52.6% of returns)
Here:
$23,303
State:
$23,538
Here:
20.0% of AGI
State:
18.4% of AGI
(% of AGI for various income ranges: 19.5% for AGIs below $25k, 14.6% for AGIs $25k-50k, 18.1% for AGIs $50k-75k, 18.5% for AGIs $75k-100k, 17.1% for AGIs $100k-200k, 12.6% for AGIs over 200k)
Charity contributions: $2,700 (reported on 46.5% of returns)
Here:
$2,700
State:
$4,025
(% of AGI for various income ranges: 1.1% for AGIs below $25k, 1.3% for AGIs $25k-50k, 1.6% for AGIs $50k-75k, 1.7% for AGIs $75k-100k, 1.7% for AGIs $100k-200k, 1.9% for AGIs over 200k)
Taxes paid: $10,881 (reported on 52.5% of returns)
19083:
$10,881
State:
$9,982
(% of AGI for various income ranges: 6.2% for AGIs below $25k, 5.8% for AGIs $25k-50k, 7.6% for AGIs $50k-75k, 8.3% for AGIs $75k-100k, 8.3% for AGIs $100k-200k, 6.7% for AGIs over 200k)
Earned income credit: $1,710 (reported on 6.4% of returns)
Here:
$1,710
State:
$2,106
(% of AGI for various income ranges: 2.5% for AGIs below $25k, 0.5% for AGIs $25k-50k)
Percentage of individuals using paid preparers for their 2012 taxes: 51.2%
Here:
51%
State:
53%
(% for various income ranges: 47.5% for AGIs below $25k, 48.9% for AGIs $25k-50k, 54.0% for AGIs $50k-75k, 53.1% for AGIs $75k-100k, 52.2% for AGIs $100k-200k, 63.4% for AGIs over 200k)
Averages for the 2004 tax year for zip code 19083, filed in 2005:
Average Adjusted Gross Income (AGI) in 2004: $58,686 (Individual Income Tax Returns)
Here:
$58,686
State:
$48,049
Salary/wage: $56,510 (reported on 81.8% of returns)
Here:
$56,510
State:
$42,646
(% of AGI for various income ranges: 91.1% for AGIs below $10k, 59.3% for AGIs $10k-25k, 75.1% for AGIs $25k-50k, 79.2% for AGIs $50k-75k, 83.9% for AGIs $75k-100k, 79.3% for AGIs over 100k)
Taxable interest for individuals: $1,497 (reported on 63.9% of returns)
This zip code:
$1,497
Pennsylvania:
$1,657
(% of AGI for various income ranges: 8.7% for AGIs below $10k, 5.1% for AGIs $10k-25k, 2.3% for AGIs $25k-50k, 1.7% for AGIs $50k-75k, 1.3% for AGIs $75k-100k, 1.1% for AGIs over 100k)
Taxable dividends: $2,576 (reported on 42.2% of returns)
Here:
$2,576
State:
$3,566
(% of AGI for various income ranges: 8.3% for AGIs below $10k, 4.4% for AGIs $10k-25k, 2.3% for AGIs $25k-50k, 1.8% for AGIs $50k-75k, 1.4% for AGIs $75k-100k, 1.5% for AGIs over 100k)
Net capital gain/loss: +$4,733 (reported on 30.8% of returns)
Here:
+$4,733
State:
+$9,716
(% of AGI for various income ranges: -4.0% for AGIs below $10k, 0.5% for AGIs $10k-25k, 0.3% for AGIs $25k-50k, 0.8% for AGIs $50k-75k, 1.0% for AGIs $75k-100k, 4.6% for AGIs over 100k)
Profit/loss from business: +$17,010 (reported on 15.2% of returns)
Here:
+$17,010
State:
+$14,267
(% of AGI for various income ranges: 6.3% for AGIs below $10k, 9.5% for AGIs $10k-25k, 5.3% for AGIs $25k-50k, 3.7% for AGIs $50k-75k, 3.8% for AGIs $75k-100k, 4.1% for AGIs over 100k)
IRA payment deduction: $3,126 (reported on 4.3% of returns)
19083:
$3,126
Pennsylvania:
$2,903
(% of AGI for various income ranges: 0.3% for AGIs below $10k, 0.5% for AGIs $10k-25k, 0.4% for AGIs $25k-50k, 0.3% for AGIs $50k-75k, 0.2% for AGIs $75k-100k, 0.1% for AGIs over 100k)
Self-employed pension: $10,638 (reported on 1.7% of returns)
Here:
$10,638
Pennsylvania:
$14,674
(% of AGI for various income ranges: 0.1% for AGIs $10k-25k, 0.2% for AGIs $25k-50k, 0.1% for AGIs $50k-75k, 0.2% for AGIs $75k-100k, 0.5% for AGIs over 100k)
Total itemized deductions: $19,023 (21% of AGI, reported on 50.8% of returns)
Here:
$19,023
State:
$18,804
Here:
20.9% of AGI
State:
19.5% of AGI
(% of AGI for various income ranges: 20.1% for AGIs below $10k, 16.3% for AGIs $10k-25k, 15.6% for AGIs $25k-50k, 18.9% for AGIs $50k-75k, 19.1% for AGIs $75k-100k, 14.8% for AGIs over 100k)
Charity contributions deductions: $2,503 (3% of AGI, reported on 47.7% of returns)
Here:
$2,503
State:
$3,337
Here:
2.7% of AGI
State:
3.3% of AGI
(% of AGI for various income ranges: 0.9% for AGIs below $10k, 1.5% for AGIs $10k-25k, 1.7% for AGIs $25k-50k, 2.1% for AGIs $50k-75k, 2.3% for AGIs $75k-100k, 2.1% for AGIs over 100k)
Total tax: $9,047 (reported on 81.2% of returns)
19083:
$9,047
State:
$8,008
(% of AGI for various income ranges: 2.9% for AGIs below $10k, 5.2% for AGIs $10k-25k, 8.1% for AGIs $25k-50k, 9.2% for AGIs $50k-75k, 9.9% for AGIs $75k-100k, 16.9% for AGIs over 100k)
Earned income credit: $1,373 (reported on 4.4% of returns)
Here:
$1,373
State:
$1,643
Percentage of individuals using paid preparers for their 2004 taxes: 52.2%
Here:
52%
State:
56%
(% for various income ranges: 46.2% for AGIs below $10k, 53.5% for AGIs $10k-25k, 51.8% for AGIs $25k-50k, 54.5% for AGIs $50k-75k, 53.5% for AGIs $75k-100k, 55.1% for AGIs over 100k)
Likely homosexual households (counted as self-reported same-sex unmarried-partner households)
Lesbian couples: 0.1% of all households
Gay men: 0.0% of all households
Household received Food Stamps/SNAP in the past 12 months: 739 Household did not receive Food Stamps/SNAP in the past 12 months: 12,801
Women who had a birth in the past 12 months: 699 (690 now married, 46 unmarried) Women who did not have a birth in the past 12 months: 7,456 (3,880 now married, 3,544 unmarried)
Housing units in zip code 19083 with a mortgage: 7,969 (1,151 second mortgage, 17 home equity loan, 1,038 both second mortgage and home equity loan) Houses without a mortgage: 548
Median monthly owner costs for units with a mortgage: $2,356 Median monthly owner costs for units without a mortgage: $910
Residents with income below the poverty level in 2022:
This zip code:
3.9%
Whole state:
11.8%
Residents with income below 50% of the poverty level in 2022:
This zip code:
2.5%
Whole state:
6.1%
Median number of rooms in houses and condos:
Here:
7.4
State:
6.8
Median number of rooms in apartments:
Here:
4.3
State:
4.3
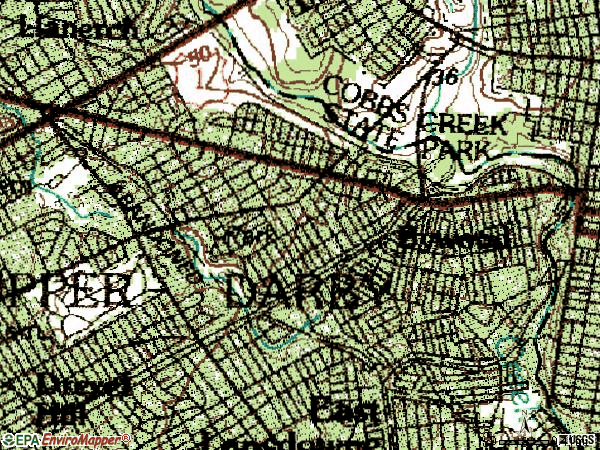
Notable locations in this zip code not listed on our city pages
Notable locations in zip code 19083: Echo Mills (A), Lawrence Mills (B), Clinton Mills (C), Llanerch Country Club (D), Beechwood-Brookline Station (E), Ardmore Junction Station (F), Penfield Station (G), West Overbrook Station (H), Wynnewood Road Station (I), Bon Air Fire Company Station 58 (J), Brookline Fire Company Station 35 (K), Haverford Township Free Library (L), Haverford Township Hall (M), Haverford Township Police Station (N), Delaware County District Justice Courthouse (O), Llanerch Fire Company Station 34 (P), Manoa Fire Company Station 56 (Q), Oakmont Fire Company Station 38 (R), Taddeo's Greenhouses (S). Display/hide their locations on the map
Churches in zip code 19083 include: All States Church (A), Martyrs Church (B), Trinity Church (C), Grace Chapel (D), Saint Andrews Church (E), Saint Faith Church (F), Saint James Church (G), Calvary Church (H), Ebenezer Church (I). Display/hide their locations on the map
Parks in zip code 19083 include: Darby Creek Valley Park (1), Westgate Hills Park (2), Williamson Field (3), Grange Field (4). Display/hide their locations on the map
Tourist attraction (not listed on the city page) : Grange Estate Friends Of The (Myrtle & Warwick Rds).
7,943 married couples with children.
945 single-parent households (180 men, 765 women).
89.3% of residents of 19083 zip code speak English at home.
1.5% of residents speak Spanish at home (86% very well, 9% well, 4% not well).
4.5% of residents speak other Indo-European language at home (52% very well, 27% well, 11% not well, 9% not at all).
3.8% of residents speak Asian or Pacific Island language at home (56% very well, 23% well, 20% not well, 1% not at all).
0.6% of residents speak other language at home (69% very well, 24% well, 3% not well, 4% not at all).
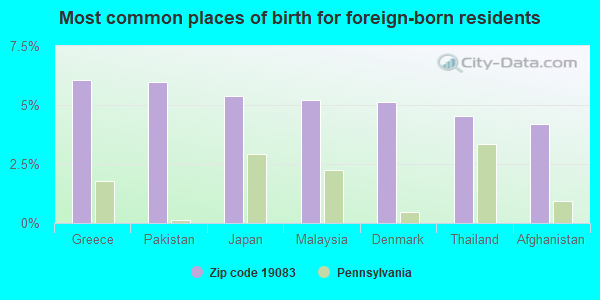
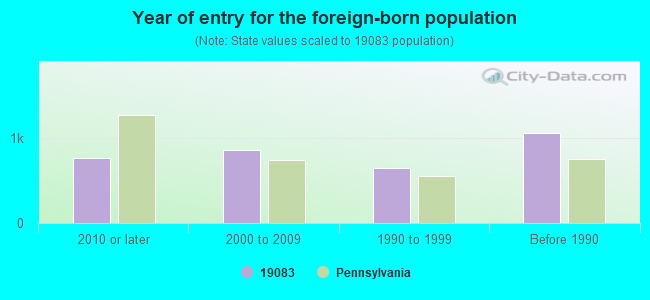
Foreign born population: 3,147 (8.5%) (74.6% of them are naturalized citizens)
This zip code:
8.5%
Whole state:
7.5%
6%Greece
6%Pakistan
5%Japan
5%Malaysia
5%Denmark
5%Thailand
4%Afghanistan
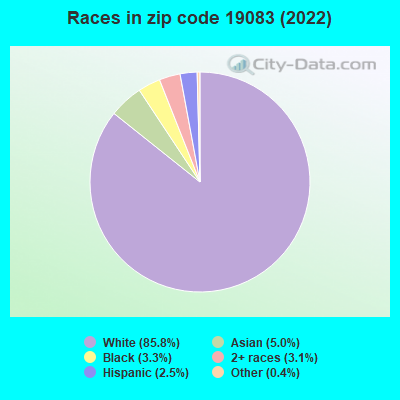
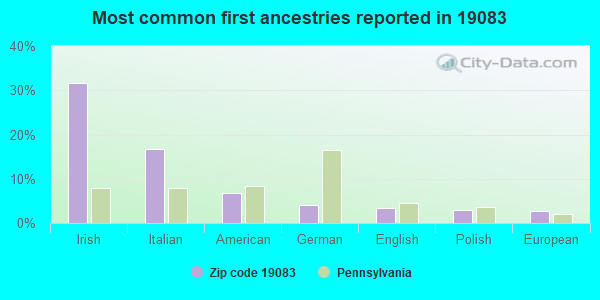
32%Irish
17%Italian
7%American
4%German
3%English
3%Polish
3%European
Year of entry for the foreign-born population
7622010 or later
8542000 to 2009
6401990 to 1999
1,053Before 1990
Facilities with environmental interests located in this zip code:
B & D MURTAUGHS AUTO REPAIR (801 WEST CHESTER PIKE in HAVERTOWN, PA)
STATE MASTER (Pennsylvania database) - RCRIS-PAD987351434, HAZARDOUS WASTE PROGRAM Small Quantity Generators, between 100 kg and 1000 kg of hazardous waste/month (Resource Conservation and Recovery Act (tracking hazardous waste)) - notification Organizations: OPERNAME (CONTACT/OPERATOR)
, SHEA (CONTACT/OWNER)
ATOMIC TIRE & AUTO SERVICE CO HAVERTOWN (418 TOWNSHIP LINE RD in HAVERTOWN, PA)
Small Quantity Generators, between 100 kg and 1000 kg of hazardous waste/month (Resource Conservation and Recovery Act (tracking hazardous waste)) - notification Organizations: OPERNAME (CONTACT/OPERATOR)
Alternative names: ATOMIC TIRE & AUTO SVC HAVERTOWN
AYOUB NAIM REFINISHING (49 W EAGLE RD in HAVERTOWN, PA)
Conditionally Exempt Small Quantity Generators, less than 100 kg/month of hazardous waste (Resource Conservation and Recovery Act (tracking hazardous waste)) - notification Organizations: DEL PIZZO PIETRO (CONTACT/OWNER)
BARRY COHEN DMD (LEXINGTON & TOWNSHIP LINE RD in HAVERTOWN, PA)
Conditionally Exempt Small Quantity Generators, less than 100 kg/month of hazardous waste (Resource Conservation and Recovery Act (tracking hazardous waste)) - notification Organizations: COHEN BARRY I (CONTACT/OWNER)
BENNETT CO INC (83 SO EAGLE ROAD in HAVERTOWN, PA)
Conditionally Exempt Small Quantity Generators, less than 100 kg/month of hazardous waste (Resource Conservation and Recovery Act (tracking hazardous waste)) - notification Organizations: MICHAEL KLEINMAN (CONTACT/OWNER)
BOB & JOE'S SERVICE CTR (WOCHESTER PIKE in HAVERTOWN, PA)
Small Quantity Generators, between 100 kg and 1000 kg of hazardous waste/month (Resource Conservation and Recovery Act (tracking hazardous waste)) - notification Organizations: BOB BROTZMAN (CONTACT/OWNER)
Housing units lacking complete plumbing facilities: 0.3% Housing units lacking complete kitchen facilities: 0.2%
77.8%Utility gas
9.9%Electricity
9.7%Fuel oil, kerosene, etc.
1.3%Bottled, tank, or LP gas
0.5%Other fuel
Population in 1990: 36,702.
Place of birth for U.S.-born residents:
This state: 27,229
Northeast: 2,830
Midwest: 997
South: 1,945
West: 608
73% of the 19083 zip code residents lived in the same house 5 years ago. Out of people who lived in different houses, 58% lived in this county. Out of people who lived in different counties, 50% lived in Pennsylvania.
92% of the 19083 zip code residents lived in the same house 1 year ago. Out of people who lived in different houses, 49% moved from this county. Out of people who lived in different houses, 32% moved from different county within same state. Out of people who lived in different houses, 12% moved from different state. Out of people who lived in different houses, 7% moved from abroad.
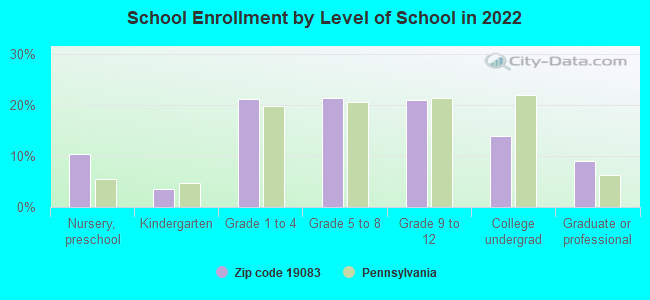
Private vs. public school enrollment:
Students in private schools in grades 1 to 8 (elementary and middle school): 750
Here:
19.2%
Pennsylvania:
15.7%
Students in private schools in grades 9 to 12 (high school): 284
Here:
14.9%
Pennsylvania:
13.4%
Students in private undergraduate colleges: 505
Here:
39.7%
Pennsylvania:
39.8%
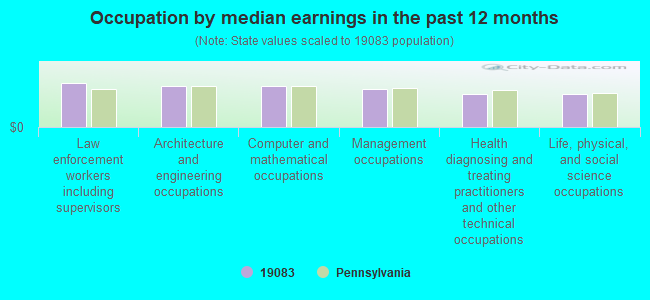
Occupation by median earnings in the past 12 months ($)
116,805Law enforcement workers including supervisors
109,391Architecture and engineering occupations
107,525Computer and mathematical occupations
100,349Management occupations
88,456Health diagnosing and treating practitioners and other technical occupations
87,251Life, physical, and social science occupations
Companies with federal contracts located in this zip code:
UNISTRY ASSOCIATES, INC (101 W EAGLE ROAD in HAVERTOWN, PA; small business) : $449,868 in 2 contractsfrom 2000 to 2001
$262,500 with Air Force for Miscellaneous Defense Hard Goods -- Management and Support (R&D). Signed on 2001-09-26. Completion date: 2003-10-31.
$187,368, same as above.Signed on 2000-05-24. Completion date: 2001-05-19.
WOOD MASTER INC (36 W EAGLE RD in HAVERTOWN, PA; small business)
$6,250 with Navy for Signs, Advertising Displays, and Identification Plates. Signed on 2004-04-06. Completion date: 2004-06-08.
Top industries in this zip code by the number of employees in 2005:
Health Care and Social Assistance: Home Health Care Services (500-999 employees: 1 establishment, 50-99 employees: 1 establishment, 5-9 employees: 1 establishment)
Health Care and Social Assistance: Offices of Physicians (except Mental Health Specialists) (100-249: 1, 20-49: 3, 10-19: 6, 5-9: 8, 1-4: 16)
Other Services (except Public Administration): Religious Organizations (50-99: 1, 20-49: 6, 10-19: 4, 5-9: 4, 1-4: 5)
2006 - 2018 National Fire Incident Reporting System (NFIRS) incidents
According to the data from the years 2006 - 2018 the average number of fire incidents per year is 55. The highest number of reported fire incidents - 96 took place in 2015, and the least - 0 in 2008. The data has a decreasing trend.
When looking into fire subcategories, the most incidents belonged to: Structure Fires (60.3%), and Outside Fires (29.0%).
Fire incident types reported to NFIRS in Zip Code 19083


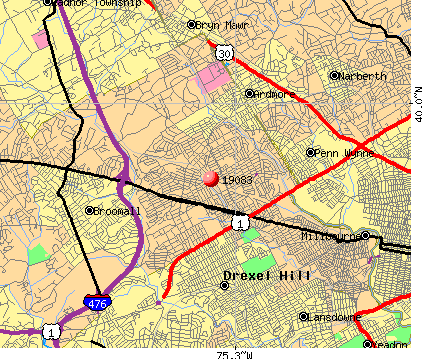 Nearest zip codes: 19003, 19026, 19041, 19096, 19082, 19008.


 According to the data from the years 2006 - 2018 the average number of fire incidents per year is 55. The highest number of reported fire incidents - 96 took place in 2015, and the least - 0 in 2008. The data has a decreasing trend.
 When looking into fire subcategories, the most incidents belonged to: Structure Fires (60.3%), and Outside Fires (29.0%).