Estimated zip code population in 2022: 20,464 Zip code population in 2010: 20,535 Zip code population in 2000: 20,386
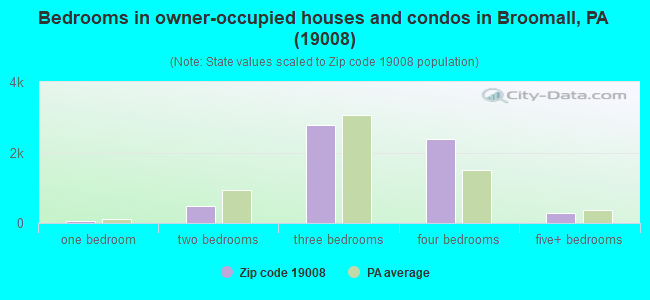
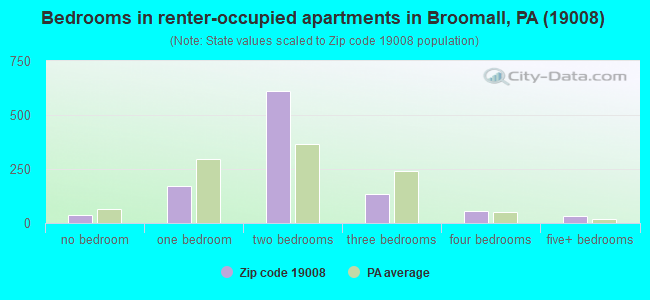
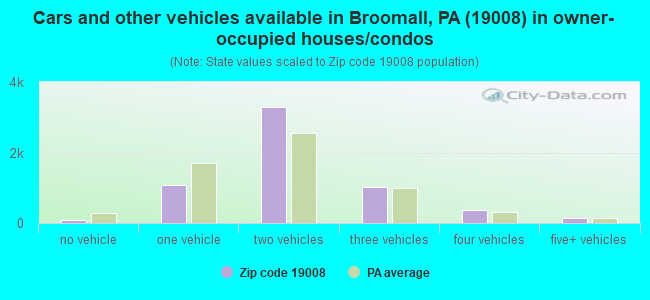
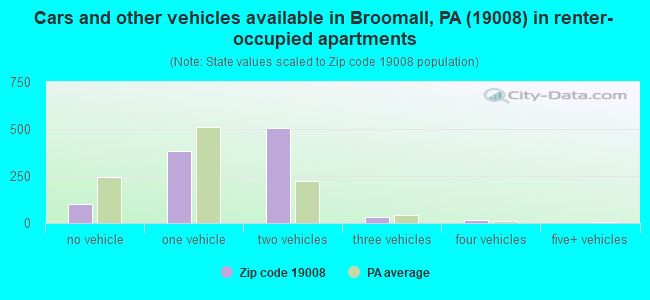
Houses and condos: 7,268 Renter-occupied apartments: 1,039
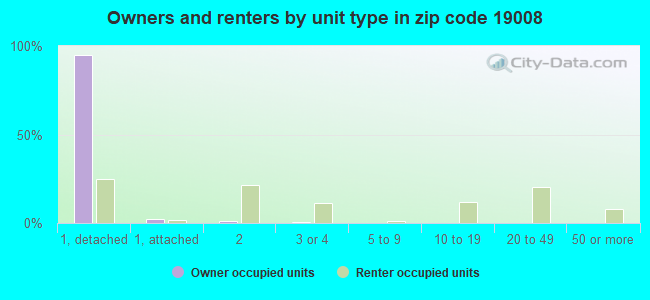
% of renters here:
15%
State:
31%
March 2022 cost of living index in zip code 19008: 105.4 (more than average, U.S. average is 100)
Land area: 6.6 sq. mi. Water area: 0.0 sq. mi.
Population density: 3,121 people per square mile
(average).
OSM Map
General Map
Google Map
MSN Map
OSM Map
General Map
Google Map
MSN Map
OSM Map
General Map
Google Map
MSN Map
OSM Map
General Map
Google Map
MSN Map
Please wait while loading the map...
Real estate property taxes paid for housing units in 2022:
This zip code:
1.1% ($5,336)
Pennsylvania:
1.3% ($3,094)
Median real estate property taxes paid for housing units with mortgages in 2022: $5,417 (1.1%) Median real estate property taxes paid for housing units with no mortgage in 2022: $5,215 (1.1%)
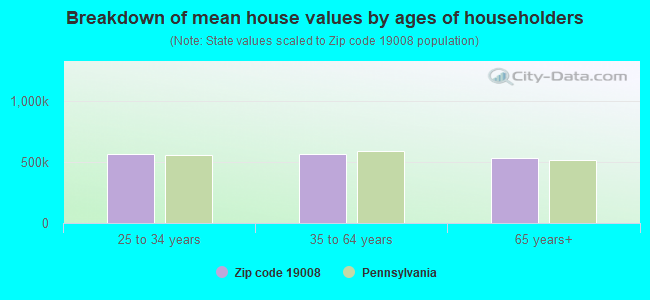
Estimated median house/condo value in 2022: $479,387
19008:
$479,387
Pennsylvania:
$245,500
According to our research of Pennsylvania and other state lists, there were 13 registered sex offenders living in 19008 zip code as of April 27, 2024. The ratio of all residents to sex offenders in zip code 19008 is 1,619 to 1. The ratio of registered sex offenders to all residents in this zip code is much lower than the state average.
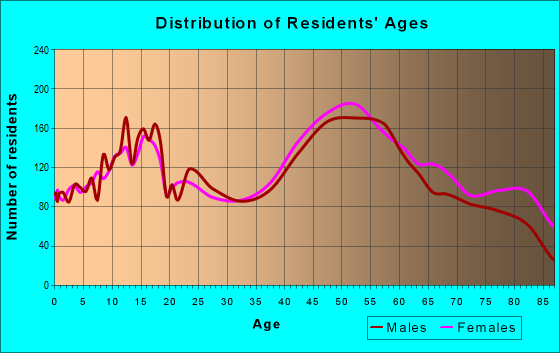
Median resident age:
This zip code:
44.0 years
Pennsylvania median age:
40.9 years
Average household size:
This zip code:
2.8 people
Pennsylvania:
2.4 people
Averages for the 2020 tax year for zip code 19008, filed in 2021:
Average Adjusted Gross Income (AGI) in 2020: $98,711 (Individual Income Tax Returns)
Here:
$98,711
State:
$75,707
Salary/wage: $83,534 (reported on 78.4% of returns)
Here:
$83,534
State:
$62,806
(% of AGI for various income ranges: 1101.1% for AGIs below $25k, 3624.7% for AGIs $25k-50k, 6504.8% for AGIs $50k-75k, 9913.6% for AGIs $75k-100k, 19455.5% for AGIs $100k-200k, 82317.5% for AGIs over 200k)
Taxable interest for individuals: $2,278 (reported on 45.5% of returns)
This zip code:
$2,278
Pennsylvania:
$1,633
(% of AGI for various income ranges: 48.0% for AGIs below $25k, 73.8% for AGIs $25k-50k, 101.0% for AGIs $50k-75k, 112.6% for AGIs $75k-100k, 168.3% for AGIs $100k-200k, 1749.4% for AGIs over 200k)
Ordinary dividends: $8,563 (reported on 33.6% of returns)
Here:
$8,563
State:
$7,382
(% of AGI for various income ranges: 68.6% for AGIs below $25k, 98.5% for AGIs $25k-50k, 196.0% for AGIs $50k-75k, 240.4% for AGIs $75k-100k, 457.4% for AGIs $100k-200k, 6025.9% for AGIs over 200k)
Net capital gain/loss in AGI: +$18,324 (reported on 28.9% of returns)
Here:
+$18,324
State:
+$23,522
(% of AGI for various income ranges: 33.0% for AGIs below $25k, 90.6% for AGIs $25k-50k, 125.7% for AGIs $50k-75k, 229.3% for AGIs $75k-100k, 638.4% for AGIs $100k-200k, 13878.1% for AGIs over 200k)
Profit/loss from business: +$21,790 (reported on 16.1% of returns)
Here:
+$21,790
State:
+$16,274
(% of AGI for various income ranges: 152.8% for AGIs below $25k, 292.3% for AGIs $25k-50k, 269.9% for AGIs $50k-75k, 343.8% for AGIs $75k-100k, 711.6% for AGIs $100k-200k, 5512.5% for AGIs over 200k)
Taxable individual retirement arrangement distribution: $19,108 (reported on 12.9% of returns)
19008:
$19,108
Pennsylvania:
$18,583
(% of AGI for various income ranges: 100.7% for AGIs below $25k, 167.5% for AGIs $25k-50k, 340.4% for AGIs $50k-75k, 540.1% for AGIs $75k-100k, 716.2% for AGIs $100k-200k, 2138.1% for AGIs over 200k)
Self-employed (Keogh) retirement plans: $23,733 (reported on 1.1% of returns)
19008:
$23,733
Pennsylvania:
$25,407
(% of AGI for various income ranges: 50.3% for AGIs $100k-200k, 688.8% for AGIs over 200k)
Total itemized deductions: $33,416 (reported on 12.2% of returns)
Here:
$33,416
State:
$34,850
(% of AGI for various income ranges: 118.2% for AGIs below $25k, 189.7% for AGIs $25k-50k, 345.7% for AGIs $50k-75k, 668.4% for AGIs $75k-100k, 966.4% for AGIs $100k-200k, 6053.1% for AGIs over 200k)
Charity contributions: $6,625 (reported on 10.2% of returns)
Here:
$6,625
State:
$12,392
(% of AGI for various income ranges: 4.3% for AGIs below $25k, 12.6% for AGIs $25k-50k, 29.9% for AGIs $50k-75k, 71.4% for AGIs $75k-100k, 165.5% for AGIs $100k-200k, 1303.8% for AGIs over 200k)
Taxes paid: $8,508 (reported on 12.1% of returns)
19008:
$8,508
State:
$8,200
(% of AGI for various income ranges: 24.1% for AGIs below $25k, 49.8% for AGIs $25k-50k, 94.6% for AGIs $50k-75k, 203.6% for AGIs $75k-100k, 296.6% for AGIs $100k-200k, 1243.1% for AGIs over 200k)
Earned income credit: $1,627 (reported on 6.8% of returns)
Here:
$1,627
State:
$2,100
(% of AGI for various income ranges: 44.8% for AGIs below $25k, 39.3% for AGIs $25k-50k)
Percentage of individuals using paid preparers for their 2020 taxes: 89.1%
Here:
89%
State:
92%
(% for various income ranges: 86.7% for AGIs below $25k, 89.1% for AGIs $25k-50k, 88.8% for AGIs $50k-75k, 88.7% for AGIs $75k-100k, 91.1% for AGIs $100k-200k, 91.8% for AGIs over 200k)
Averages for the 2012 tax year for zip code 19008, filed in 2013:
Average Adjusted Gross Income (AGI) in 2012: $75,408 (Individual Income Tax Returns)
Here:
$75,408
State:
$61,346
Salary/wage: $65,513 (reported on 79.3% of returns)
Here:
$65,513
State:
$51,902
(% of AGI for various income ranges: 63.5% for AGIs below $25k, 68.1% for AGIs $25k-50k, 69.5% for AGIs $50k-75k, 71.9% for AGIs $75k-100k, 78.1% for AGIs $100k-200k, 58.1% for AGIs over 200k)
Taxable interest for individuals: $1,590 (reported on 51.0% of returns)
This zip code:
$1,590
Pennsylvania:
$1,588
(% of AGI for various income ranges: 2.4% for AGIs below $25k, 1.6% for AGIs $25k-50k, 1.1% for AGIs $50k-75k, 1.0% for AGIs $75k-100k, 0.7% for AGIs $100k-200k, 1.1% for AGIs over 200k)
Ordinary dividends: $5,287 (reported on 35.5% of returns)
Here:
$5,287
State:
$5,827
(% of AGI for various income ranges: 4.1% for AGIs below $25k, 2.2% for AGIs $25k-50k, 2.6% for AGIs $50k-75k, 2.0% for AGIs $75k-100k, 1.7% for AGIs $100k-200k, 3.3% for AGIs over 200k)
Net capital gain/loss in AGI: +$10,014 (reported on 26.6% of returns)
Here:
+$10,014
State:
+$14,495
(% of AGI for various income ranges: 0.5% for AGIs $50k-75k, 1.0% for AGIs $75k-100k, 1.5% for AGIs $100k-200k, 9.6% for AGIs over 200k)
Profit/loss from business: +$24,184 (reported on 15.2% of returns)
Here:
+$24,184
State:
+$16,268
(% of AGI for various income ranges: 9.6% for AGIs below $25k, 6.4% for AGIs $25k-50k, 4.2% for AGIs $50k-75k, 3.3% for AGIs $75k-100k, 3.1% for AGIs $100k-200k, 6.5% for AGIs over 200k)
Taxable individual retirement arrangement distribution: $16,467 (reported on 15.9% of returns)
19008:
$16,467
Pennsylvania:
$14,550
(% of AGI for various income ranges: 6.2% for AGIs below $25k, 4.4% for AGIs $25k-50k, 4.3% for AGIs $50k-75k, 3.0% for AGIs $75k-100k, 3.0% for AGIs $100k-200k, 3.1% for AGIs over 200k)
Self-employment retirement plans: $19,808 (reported on 1.2% of returns)
19008:
$19,808
Pennsylvania:
$20,922
(% of AGI for various income ranges: 0.4% for AGIs $50k-75k, 0.2% for AGIs $100k-200k, 0.7% for AGIs over 200k)
Total itemized deductions: $24,712 (20% of AGI, reported on 46.2% of returns)
Here:
$24,712
State:
$23,538
Here:
19.6% of AGI
State:
18.4% of AGI
(% of AGI for various income ranges: 17.7% for AGIs below $25k, 15.6% for AGIs $25k-50k, 16.9% for AGIs $50k-75k, 17.1% for AGIs $75k-100k, 16.2% for AGIs $100k-200k, 12.0% for AGIs over 200k)
Charity contributions: $2,971 (reported on 41.1% of returns)
Here:
$2,971
State:
$4,025
(% of AGI for various income ranges: 1.0% for AGIs below $25k, 1.2% for AGIs $25k-50k, 1.5% for AGIs $50k-75k, 1.7% for AGIs $75k-100k, 1.8% for AGIs $100k-200k, 1.6% for AGIs over 200k)
Taxes paid: $10,139 (reported on 46.1% of returns)
19008:
$10,139
State:
$9,982
(% of AGI for various income ranges: 4.7% for AGIs below $25k, 4.7% for AGIs $25k-50k, 6.0% for AGIs $50k-75k, 6.7% for AGIs $75k-100k, 7.0% for AGIs $100k-200k, 5.9% for AGIs over 200k)
Earned income credit: $1,680 (reported on 7.9% of returns)
Here:
$1,680
State:
$2,106
(% of AGI for various income ranges: 2.7% for AGIs below $25k, 0.6% for AGIs $25k-50k)
Percentage of individuals using paid preparers for their 2012 taxes: 55.3%
Here:
55%
State:
53%
(% for various income ranges: 48.6% for AGIs below $25k, 56.1% for AGIs $25k-50k, 58.1% for AGIs $50k-75k, 60.0% for AGIs $75k-100k, 58.5% for AGIs $100k-200k, 66.7% for AGIs over 200k)
Averages for the 2004 tax year for zip code 19008, filed in 2005:
Average Adjusted Gross Income (AGI) in 2004: $63,892 (Individual Income Tax Returns)
Here:
$63,892
State:
$48,049
Salary/wage: $54,804 (reported on 77.3% of returns)
Here:
$54,804
State:
$42,646
(% of AGI for various income ranges: 92.5% for AGIs below $10k, 56.3% for AGIs $10k-25k, 69.7% for AGIs $25k-50k, 70.5% for AGIs $50k-75k, 78.0% for AGIs $75k-100k, 61.6% for AGIs over 100k)
Taxable interest for individuals: $2,179 (reported on 66.6% of returns)
This zip code:
$2,179
Pennsylvania:
$1,657
(% of AGI for various income ranges: 11.9% for AGIs below $10k, 6.0% for AGIs $10k-25k, 2.9% for AGIs $25k-50k, 2.6% for AGIs $50k-75k, 1.8% for AGIs $75k-100k, 1.6% for AGIs over 100k)
Taxable dividends: $4,076 (reported on 43.9% of returns)
Here:
$4,076
State:
$3,566
(% of AGI for various income ranges: 10.6% for AGIs below $10k, 4.2% for AGIs $10k-25k, 2.3% for AGIs $25k-50k, 2.6% for AGIs $50k-75k, 1.8% for AGIs $75k-100k, 3.0% for AGIs over 100k)
Net capital gain/loss: +$14,119 (reported on 32.8% of returns)
Here:
+$14,119
State:
+$9,716
(% of AGI for various income ranges: -0.8% for AGIs below $10k, 0.1% for AGIs $10k-25k, 0.4% for AGIs $25k-50k, 1.2% for AGIs $50k-75k, 1.0% for AGIs $75k-100k, 12.9% for AGIs over 100k)
Profit/loss from business: +$22,448 (reported on 15.6% of returns)
Here:
+$22,448
State:
+$14,267
(% of AGI for various income ranges: 9.7% for AGIs below $10k, 9.3% for AGIs $10k-25k, 6.9% for AGIs $25k-50k, 5.1% for AGIs $50k-75k, 4.5% for AGIs $75k-100k, 5.1% for AGIs over 100k)
IRA payment deduction: $3,557 (reported on 4.6% of returns)
19008:
$3,557
Pennsylvania:
$2,903
(% of AGI for various income ranges: 0.6% for AGIs below $10k, 0.5% for AGIs $10k-25k, 0.6% for AGIs $25k-50k, 0.4% for AGIs $50k-75k, 0.3% for AGIs $75k-100k, 0.1% for AGIs over 100k)
Self-employed pension: $16,781 (reported on 1.8% of returns)
Here:
$16,781
Pennsylvania:
$14,674
(% of AGI for various income ranges: 0.1% for AGIs $25k-50k, 0.2% for AGIs $50k-75k, 0.3% for AGIs $75k-100k, 0.7% for AGIs over 100k)
Total itemized deductions: $22,094 (21% of AGI, reported on 46.0% of returns)
Here:
$22,094
State:
$18,804
Here:
20.6% of AGI
State:
19.5% of AGI
(% of AGI for various income ranges: 28.5% for AGIs below $10k, 15.7% for AGIs $10k-25k, 14.7% for AGIs $25k-50k, 18.1% for AGIs $50k-75k, 18.2% for AGIs $75k-100k, 14.8% for AGIs over 100k)
Charity contributions deductions: $3,306 (3% of AGI, reported on 42.9% of returns)
Here:
$3,306
State:
$3,337
Here:
3.0% of AGI
State:
3.3% of AGI
(% of AGI for various income ranges: 1.2% for AGIs below $10k, 1.6% for AGIs $10k-25k, 1.5% for AGIs $25k-50k, 2.3% for AGIs $50k-75k, 2.4% for AGIs $75k-100k, 2.4% for AGIs over 100k)
Total tax: $10,939 (reported on 80.1% of returns)
19008:
$10,939
State:
$8,008
(% of AGI for various income ranges: 3.5% for AGIs below $10k, 4.8% for AGIs $10k-25k, 8.1% for AGIs $25k-50k, 9.3% for AGIs $50k-75k, 10.2% for AGIs $75k-100k, 18.1% for AGIs over 100k)
Earned income credit: $1,358 (reported on 5.1% of returns)
Here:
$1,358
State:
$1,643
Percentage of individuals using paid preparers for their 2004 taxes: 55.8%
Here:
56%
State:
56%
(% for various income ranges: 50.3% for AGIs below $10k, 55.3% for AGIs $10k-25k, 55.0% for AGIs $25k-50k, 58.8% for AGIs $50k-75k, 57.4% for AGIs $75k-100k, 60.5% for AGIs over 100k)
Household received Food Stamps/SNAP in the past 12 months: 304 Household did not receive Food Stamps/SNAP in the past 12 months: 6,699
Women who had a birth in the past 12 months: 171 (183 now married, 0 unmarried) Women who did not have a birth in the past 12 months: 3,554 (1,917 now married, 1,619 unmarried)
Housing units in zip code 19008 with a mortgage: 3,605 (633 second mortgage, 578 both second mortgage and home equity loan) Houses without a mortgage: 161
Median monthly owner costs for units with a mortgage: $2,359 Median monthly owner costs for units without a mortgage: $826
Residents with income below the poverty level in 2022:
This zip code:
2.7%
Whole state:
11.8%
Residents with income below 50% of the poverty level in 2022:
This zip code:
1.3%
Whole state:
6.1%
Median number of rooms in houses and condos:
Here:
7.6
State:
6.8
Median number of rooms in apartments:
Here:
4.7
State:
4.3
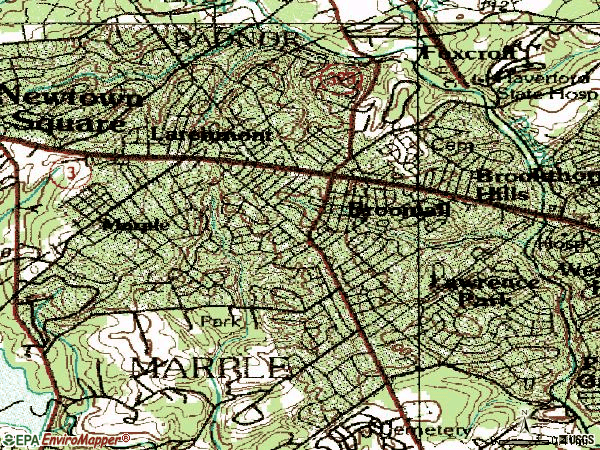
Notable locations in this zip code not listed on our city pages
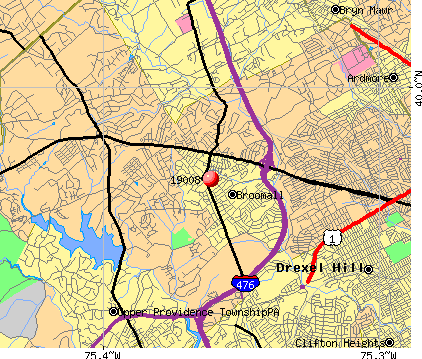
Notable locations in zip code 19008: Lawrences Mills (A), Paxon Hollow Golf Club (B), Marple Township Building (C), Lawrence Park Industrial Park (D), Broomall Fire Company Station 53 (E), Marple Township Library (F), Marple Township Police Department (G), Newtown Library (H). Display/hide their locations on the map
Churches in zip code 19008 include: Belmont Church (A), Marple Church (B), Trinity Church (C), Grace Church (D), Saint Lukes Church (E), Saint Marks Church (F), Saint Peters Church (G), Temple Sholom of Broomall (H), LDS Stake Center (I). Display/hide their locations on the map
In group quarters: 481 (-1 institutionalized population)
Size of family households: 2,387 2-persons, 1,280 3-persons, 1,056 4-persons, 538 5-persons, 212 6-persons, 126 7-or-more-persons
Size of nonfamily households: 1,173 1-person, 218 2-persons
3,960 married couples with children.
282 single-parent households (141 men, 141 women).
83.3% of residents of 19008 zip code speak English at home.
0.6% of residents speak Spanish at home (51% very well, 37% well, 12% not well).
7.7% of residents speak other Indo-European language at home (67% very well, 24% well, 7% not well, 2% not at all).
7.9% of residents speak Asian or Pacific Island language at home (47% very well, 33% well, 19% not well, 1% not at all).
0.8% of residents speak other language at home (82% very well, 15% well, 4% not well).
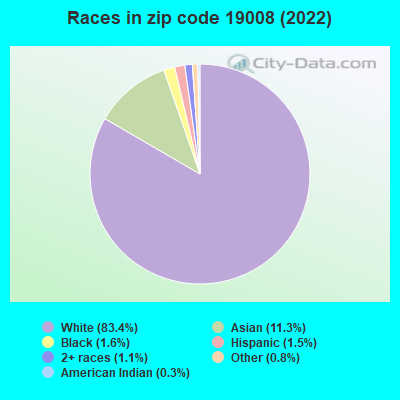
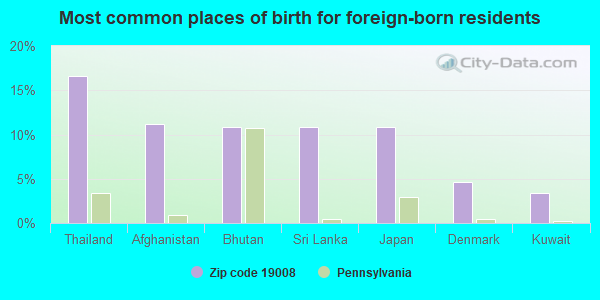
Foreign born population: 2,310 (11.3%) (73.8% of them are naturalized citizens)
This zip code:
11.3%
Whole state:
7.5%
17%Thailand
11%Afghanistan
11%Bhutan
11%Sri Lanka
11%Japan
5%Denmark
3%Kuwait
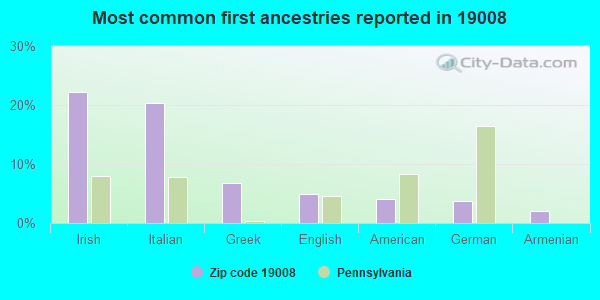
22%Irish
20%Italian
7%Greek
5%English
4%American
4%German
2%Armenian
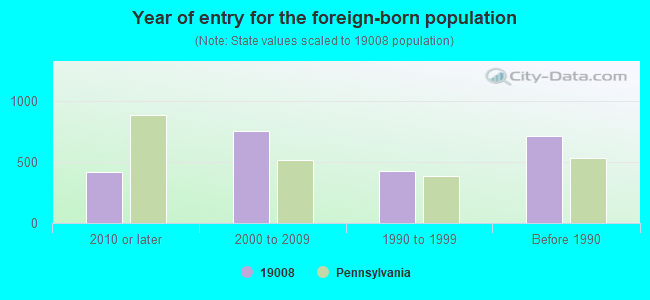
Year of entry for the foreign-born population
4202010 or later
7542000 to 2009
4281990 to 1999
712Before 1990
Facilities with environmental interests located in this zip code:
ALCOM PRINTING GROUP BROOMALL PLT (900 SUSSEX BLVD in BROOMALL, PA)
AIR MINOR (AIRS/AFS) STATE MASTER (Pennsylvania database) - AFS-23-1640799-1, AIR PROGRAM (Resource Conservation and Recovery Act (tracking hazardous waste)) Business SIC classification: COMMERCIAL PRINTING, LITHOGRAPHIC Business NAICS classification: COMMERCIAL LITHOGRAPHIC PRINTING.; COMMERCIAL LITHOGRAPHIC PRINTING.; TRADEBINDING AND RELATED WORK. Organizations: ALCOM PRINTING GROUP INC (CONTACT/OPERATOR)
, ONIMUS, GEORGE (CONTACT/OWNER)
, BILL KUPLEN (CONTACT/OWNER)
Alternative names: ALCOM PRINTING GROUP/BROOMALL, HAVERTOWN PRINTING CO, HAVERTOWN PRINTING COMPANY MANUFACTURING
ADVANCED PLATING TECHNOLOGY (1005 SUSSEX BLVD in BROOMALL, PA)
(Resource Conservation and Recovery Act (tracking hazardous waste)) Organizations: OPERNAME (CONTACT/OPERATOR)
, MCGEE, JOSEPH (CONTACT/OWNER)
Alternative names: ADVANCED PLATING TECHNIQUES
AREA TECH SCHOOL MARPLE (JAMES ROAD & MALIN ROAD in BROOMALL, PA)
Conditionally Exempt Small Quantity Generators, less than 100 kg/month of hazardous waste (Resource Conservation and Recovery Act (tracking hazardous waste)) - notification Organizations: OPERNAME (CONTACT/OPERATOR)
, DELAWARE COUNTY IU (CONTACT/OWNER)
BILLS BROOMALL EXXON (2105 S SPROUL RD in BROOMALL, PA)
Small Quantity Generators, between 100 kg and 1000 kg of hazardous waste/month (Resource Conservation and Recovery Act (tracking hazardous waste)) - notification Organizations: OPERNAME (CONTACT/OPERATOR)
AMOCO NO 14617 TANKS (2590 WEST CHESTER PIKE in BROOMALL, PA)
Small Quantity Generators, between 100 kg and 1000 kg of hazardous waste/month (Resource Conservation and Recovery Act (tracking hazardous waste)) - notification Organizations: AMOCO OIL CO (CONTACT/OWNER)
Housing units lacking complete plumbing facilities: 0.6% Housing units lacking complete kitchen facilities: 1.0%
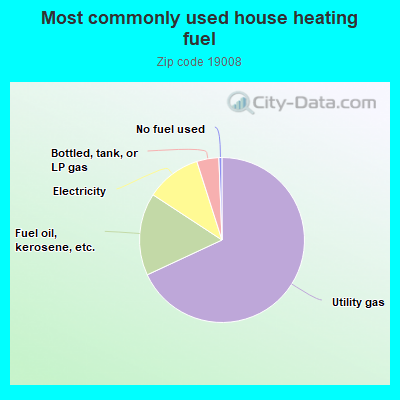
67.8%Utility gas
16.1%Fuel oil, kerosene, etc.
10.8%Electricity
4.3%Bottled, tank, or LP gas
0.6%No fuel used
Population in 1990: 20,432.
Place of birth for U.S.-born residents:
This state: 15,510
Northeast: 1,146
Midwest: 429
South: 729
West: 170
73% of the 19008 zip code residents lived in the same house 5 years ago. Out of people who lived in different houses, 57% lived in this county. Out of people who lived in different counties, 50% lived in Pennsylvania.
92% of the 19008 zip code residents lived in the same house 1 year ago. Out of people who lived in different houses, 53% moved from this county. Out of people who lived in different houses, 34% moved from different county within same state. Out of people who lived in different houses, 12% moved from different state. Out of people who lived in different houses, 2% moved from abroad.
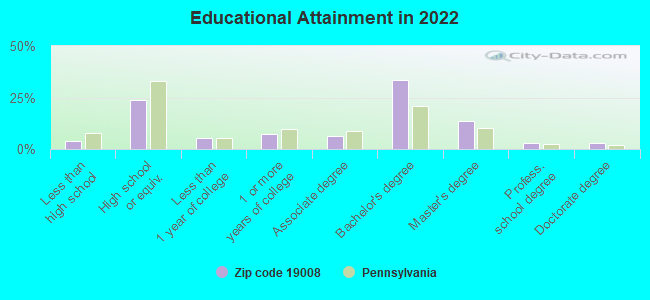
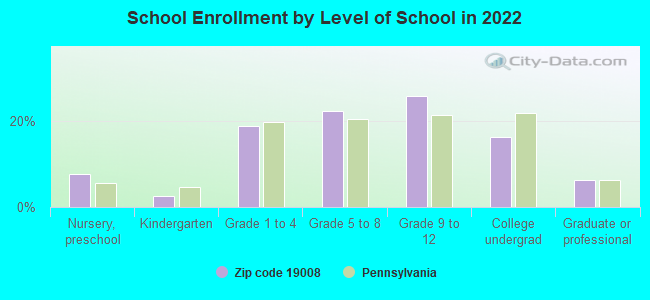
Private vs. public school enrollment:
Students in private schools in grades 1 to 8 (elementary and middle school): 412
Here:
23.1%
Pennsylvania:
15.7%
Students in private schools in grades 9 to 12 (high school): 260
Here:
23.3%
Pennsylvania:
13.4%
Students in private undergraduate colleges: 250
Here:
35.8%
Pennsylvania:
39.8%
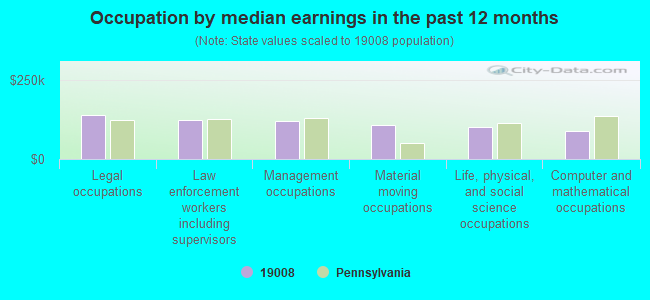
Occupation by median earnings in the past 12 months ($)
137,219Legal occupations
124,084Law enforcement workers including supervisors
119,826Management occupations
106,010Material moving occupations
99,300Life, physical, and social science occupations
88,761Computer and mathematical occupations
Companies with biggest federal contracts located in this zip code (BROOMALL, PA):
VJ SUPPLY INC (838 SUSSEX BLVD FL 2; small business) : $4,165,465 in 142 contractsfrom 1999 to 2006
Contracts for Vehicular Brake, Steering, Axle, Wheel, and Track Components, Vehicular Furniture and Accessories, Pipe, Tube and Rigid Tubing, Aircraft Ground Servicing Equipment, and moreby Army, Defense Logistics Agency, Navy Signed by year:2000: $507,134; 2001: $297,129; 2002: $549,461; 2003: $441,951; 2004: $536,013; 2005: $1,143,457; 2006: $352,428.
Biggest contracts:
$270,200 with Army for Vehicular Brake, Steering, Axle, Wheel, and Track Components. Signed on 2003-10-03. Completion date: 2007-07-30.
$217,230, same as above.Signed on 2005-09-13. Completion date: 2006-07-30.
$167,157 with Defense Logistics Agency for Vehicular Furniture and Accessories. Signed on 2004-11-29. Completion date: 2005-05-28.
$153,728 with Defense Logistics Agency for Pipe, Tube and Rigid Tubing. Signed on 2000-06-26. Completion date: 2001-03-13.
DAVIDSON FABRICATING CO INC (511 ABBOTT DR; small business) : $1,467,785 in 31 contractsfrom 2000 to 2006
Contracts for Aircraft Maintenance and Repair Shop Specialized Equipment, Degaussing and Mine Sweeping Equipment, Airframe Structural Components, Aircraft Ground Servicing Equipment, and moreby Defense Logistics Agency, Army Signed by year:2000: $32,382; 2001: $98,363; 2002: $280,776; 2003: $74,408; 2004: $361,543; 2005: $607,776; 2006: $12,537.
Biggest contracts:
$394,600 with Defense Logistics Agency for Aircraft Maintenance and Repair Shop Specialized Equipment. Signed on 2005-12-07. Completion date: 2006-08-20.
$98,363 with Defense Logistics Agency for Degaussing and Mine Sweeping Equipment. Signed on 2001-08-07. Completion date: 2001-12-05.
$85,120 with Defense Logistics Agency for Aircraft Maintenance and Repair Shop Specialized Equipment. Signed on 2005-12-08. Completion date: 2006-07-06.
$85,120, same as above.Signed on 2005-05-18. Completion date: 2005-11-14.
HIGH FIDELITY HOUSE, INC (1001 SUSSEX BOULEVARD; small business) : $711,181 in 18 contractsfrom 2000 to 2006
Contracts for Miscellaneous Electrical and Electronic Components, Phonographs, Radio and Television Sets: Home Type, Other ADP and Telecommunications Services (includes data storage on tapes, compact disks, etc.), Miscellaneous Communication Equipment, and moreby Department of Defense, Navy, Federal Supply Service, Defense Information Systems Agency, and others Signed by year:2000: $143,220; 2001: $40,119; 2002: $174,354; 2003: $267,894; 2004: $31,619; 2005: $0; 2006: $53,975.
Biggest contracts:
$195,525 with Department of Defense for Miscellaneous Electrical and Electronic Components. Signed on 2003-09-30. Completion date: 2003-11-30.
$75,578 with Navy for Phonographs, Radio and Television Sets: Home Type. Signed on 2002-07-25. Completion date: 2002-09-13.
$71,295, same as above.Signed on 2002-07-25. Completion date: 2002-12-02.
$51,906, same as above.Signed on 2000-02-10. Completion date: 2000-03-22.
RICHARD LANZA CONSTRUCTION INC (611 ROSE HILL RD; small business) : $515,141 in 34 contractsfrom 2000 to 2001
Contracts for Maintenance, Repair or Alteration of Real Property -- Miscellaneous Buildings by Navy Signed by year:2000: $513,789; 2001: $1,352; 2002: $0; 2003: $0; 2004: $0; 2005: $0; 2006: $0.
Biggest contracts:
$146,813 with Navy for Maintenance, Repair or Alteration of Real Property -- Miscellaneous Buildings. Taking place in FL. Signed on 2000-09-14. Completion date: 2001-03-13.
$139,890, same as above.Signed on 2000-11-20. Completion date: 2001-03-30.
$39,336, same as above.Signed on 2000-09-30. Completion date: 2000-11-15.
$32,618, same as above.Signed on 2000-09-30. Completion date: 2000-10-30.
VISUAL SOUND, INC (485 PARKWAY SOUTH; small business) : $438,939 in 27 contractsfrom 2001 to 2006
Contracts for Audio/Visual Services, Cable, Cord, and Wire Assemblies: Communications Equipment, Video Recording and Reproducing Equipment, ADP Input/Output and Storage Devices, and moreby Army, Navy, Department of State, Department of Defense, and others Signed by year:2000: $0; 2001: $221,730; 2002: $73,625; 2003: $45,337; 2004: $17,148; 2005: $72,785; 2006: $8,314.
Biggest contracts:
$62,008 with Army for Audio/Visual Services. Signed on 2001-03-14. Completion date: 2002-04-15.
$60,000, same as above.Signed on 2001-09-21. Completion date: 2002-09-23.
$57,722 with Army for Cable, Cord, and Wire Assemblies: Communications Equipment. Signed on 2001-03-20. Completion date: 2001-04-13.
$52,778 with Navy for Video Recording and Reproducing Equipment. Taking place in MD. Signed on 2002-06-13. Completion date: 2002-07-30.
SAFECOMM, INC (600 REED RD; small business) : $379,696 in 3 contractsfrom 2000 to 2001
$249,966 with Navy for Miscellaneous Items. Signed on 2001-09-19. Completion date: 2001-09-20.
$69,825, same as above.Signed on 2001-03-19. Completion date: 2000-10-20.
$59,905, same as above.Signed on 2000-09-12. Completion date: 2000-09-13.
RANKIN AUTOMATION COMPANY, LLC (888 SUSSEX BLVD; small business) : $52,840 in 7 contractsfrom 2001 to 2006
Contracts for Laboratory Equipment and Supplies, Other Defense -- Applied Research and Exploratory Development (R&D), Miscellaneous Special Industry Machinery, ADP Software by NASA, Consumer Product Safety Commission, Navy, Federal Highway Administration, and others Signed by year:2000: $0; 2001: $27,000; 2002: $0; 2003: $2,815; 2004: $8,512; 2005: $11,337; 2006: $3,176.
Biggest contracts:
$27,000 with NASA for Laboratory Equipment and Supplies. Signed on 2001-09-15. Completion date: 2001-11-15.
$8,512 with Consumer Product Safety Commission for Laboratory Equipment and Supplies. Taking place in MD. Signed on 2004-09-24. Completion date: 2004-10-24.
$4,496 with Navy for Other Defense -- Applied Research and Exploratory Development (R&D). Signed on 2005-09-06. Completion date: 2005-09-20.
$3,651, same as above.Signed on 2005-06-03. Completion date: 2005-06-17.
LOBEC INC (500 ABBOTT DR STE B; small business)
$52,533 with Army for Maintenance, Repair or Alteration of Real Property -- Recreational Buildings. Taking place in NJ. Signed on 2000-09-26. Completion date: 2000-10-31.
MADSEN, INC (2901 SPRINGFIELD ROAD; small business)
$43,510 with Army for Maintenance, Repair and Rebuilding of Equipment -- Plumbing, Heating, and Waste Disposal Equipment. Signed on 2000-12-29. Completion date: 2001-02-12.
AUDRU ENTERPRISES, INC (2035 SPROUL RD; small business) : $41,864 in 2 contractsfrom 2002 to 2003
$40,754 with Navy for Water Quality Support Services. Signed on 2002-07-31. Completion date: 2003-07-31.
$1,110, same as above.Signed on 2003-08-11. Completion date: 2003-09-11.
Top industries in this zip code by the number of employees in 2005:
Health Care and Social Assistance: Nursing Care Facilities (250-499 employees: 1 establishment, 100-249 employees: 1 establishment, 10-19 employees: 1 establishment, 5-9 employees: 1 establishment)
2004 - 2018 National Fire Incident Reporting System (NFIRS) incidents
According to the data from the years 2004 - 2018 the average number of fires per year is 80. The highest number of fires - 137 took place in 2011, and the least - 9 in 2004. The data has a rising trend.
When looking into fire subcategories, the most reports belonged to: Structure Fires (48.1%), and Outside Fires (22.9%).
Fire incident types reported to NFIRS in Zip Code 19008
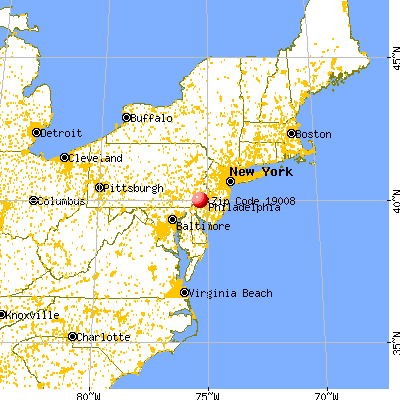


 Nearest zip codes: 19064, 19083, 19041, 19010, 19026, 19085.
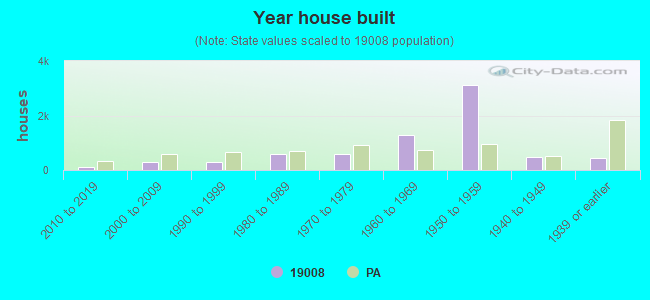


 According to the data from the years 2004 - 2018 the average number of fires per year is 80. The highest number of fires - 137 took place in 2011, and the least - 9 in 2004. The data has a rising trend.
 When looking into fire subcategories, the most reports belonged to: Structure Fires (48.1%), and Outside Fires (22.9%).