Philadelphia, PA (Pennsylvania) Houses and Residents
Estimated median house or condo value in 2022: $237,900 (it was $61,000 in 2000 )
Philadelphia:
$237,900Pennsylvania:
$245,500
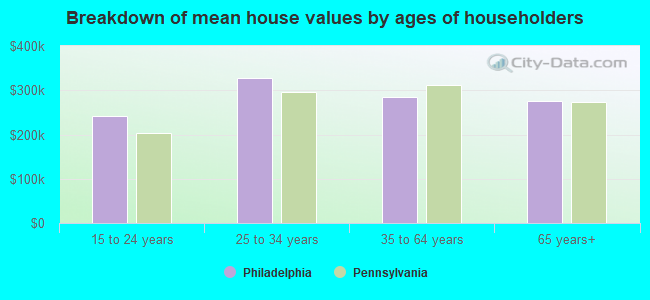
Lower value quartile - upper value quartile: $149,000 - $356,100Mean price in 2022: Detached houses: $382,521 Here:
$382,521State:
$317,202
Townhouses or other attached units: $260,733 Here:
$260,733State:
$254,369
In 2-unit structures: $270,436 Here:
$270,436State:
$249,182
In 3-to-4-unit structures: $324,453 Here:
$324,453State:
$297,446
In 5-or-more-unit structures: $444,254 Here:
$444,254State:
$320,068
Mobile homes: $57,703 Here:
$57,703State:
$92,414
Occupied boats, RVs, vans, etc.: $424,146 Here:
$424,146State:
$563,750
Total population: 1,560,297 (Urban population: 1,517,550, Rural population: 0)
Houses: 757,656 (695,320 occupied: 353,535 owner occupied, 341,785 renter occupied )
% of renters here:
49%State:
31%
Housing density: 5,609 houses/condos per square mile
Median price asked for vacant for-sale houses and condos in 2022: $302,937.
Median contract rent in 2022: $1,073 (lower quartile is $767, upper quartile is $1,456)
Median rent asked for vacant for-rent units in 2022: $1,226
Median gross rent in Philadelphia, PA in 2022: $1,281
Housing units in Philadelphia with a mortgage: 208,105 (21,812 second mortgage, 1,247 home equity loan, 17,373 both second mortgage and home equity loan )Houses without a mortgage: 9,702
Median household income for houses/condos with a mortgage: $88,577
Median household income for apartments without a mortgage: $49,008
Median monthly housing costs: $1,177
Data:
Median house or condo value ($)
Median house or condo value ($ change since 2000)
Median house or condo value ($) - White
Median house or condo value ($) - Black or African American
Median house or condo value ($) - Asian
Median house or condo value ($) - Hispanic or Latino
Median house or condo value ($) - American Indian and Alaska Native
Median house or condo value ($) - Multirace
Median house or condo value ($) - Other Race
Median price asked for mobile homes ($)
Household density (households per square mile)
Mean house or condo value by units in structure - 1, detached ($)
Mean house or condo value by units in structure - 1, attached ($)
Mean house or condo value by units in structure - 2 ($)
Mean house or condo value by units in structure by units in structure - 3 or 4 ($)
Mean house or condo value by units in structure - 5 or more ($)
Mean house or condo value by units in structure - Boat, RV, van, etc. ($)
Mean house or condo value by units in structure - Mobile home ($)
Median contract rent ($)
Median contract rent - Lower quartile ($)
Median contract rent - Upper quartile ($)
Median gross rent ($)
Urban houses (%)
Rural houses (%)
Houses occupied (%)
Houses occupied (% change since 2000)
Houses owner occupied (%)
Houses owner occupied (% change since 2000)
Houses renter occupied (%)
Houses renter occupied (% change since 2000)
Vacant housing units - For rent (%)
Vacant housing units - For rent (% change since 2000)
Vacant housing units - For sale only (%)
Vacant housing units - For sale only (% change since 2000)
Vacant housing units - Rented or sold, not occupied (%)
Vacant housing units - Rented or sold, not occupied (% change since 2000)
Vacant housing units - For seasonal, recreational, or occasional use (%)
Vacant housing units - For seasonal, recreational, or occasional use (% change since 2000)
Vacant housing units - For migrant workers (%)
Vacant housing units - For migrant workers (% change since 2000)
Vacant housing units - Other vacant (%)
Vacant housing units - Other vacant (% change since 2000)
Median monthly housing costs ($)
Median household income for houses/condos with a mortgage ($)
Median household income for houses/condos without a mortgage ($)
Median household income ($)
Median household income ($) - White
Median household income ($) - Black or African American
Median household income ($) - Asian
Median household income ($) - Hispanic or Latino
Median household income ($) - American Indian and Alaska Native
Median household income ($) - Multirace
Median household income ($) - Other Race
Mortgage status - with mortgage (%)
Mortgage status - with second mortgage (%)
Mortgage status - with home equity loan (%)
Mortgage status - with both second mortgage and home equity loan (%)
Mortgage status - without a mortgage (%)
Median year house/condo built
Median year apartment built
Household type by relationship - Male householder living alone (%)
Household type by relationship - Male householder not living alone (%)
Household type by relationship - Female householder living alone (%)
Household type by relationship - Female householder not living alone (%)
Household type by relationship - Opposite-Sex spouse (%)
Household type by relationship - Same-Sex spouse (%)
Household type by relationship - Opposite-Sex unmarried partner (%)
Household type by relationship - Same-Sex unmarried partner (%)
Household type by relationship - In group quarters (%)
Size of family households - 2-person household (%)
Size of family households - 3-person household (%)
Size of family households - 4-person household (%)
Size of family households - 5-person household (%)
Size of family households - 6-person household (%)
Size of family households - 7-or-more-person household (%)
Size of nonfamily households - 1-person household (%)
Size of nonfamily households - 2-person household (%)
Size of nonfamily households - 3-person household (%)
Size of nonfamily households - 4-person household (%)
Size of nonfamily households - 5-person household (%)
Size of nonfamily households - 6-person household (%)
Size of nonfamily households - 7-or-moreperson household (%)
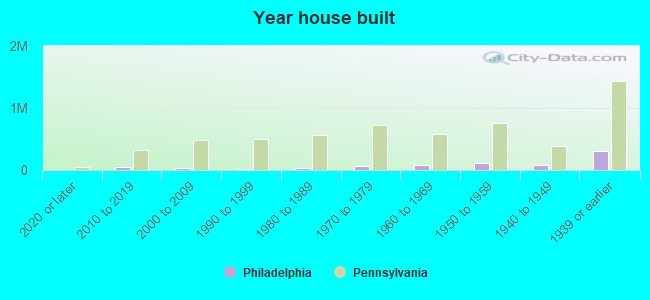
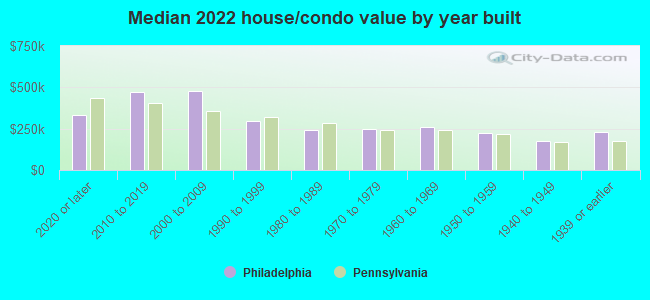
Year house built - Built 2010 or later (%)
Year house built - Built 2000 to 2009 (%)
Year house built - Built 1990 to 1999 (%)
Year house built - Built 1980 to 1989 (%)
Year house built - Built 1970 to 1979 (%)
Year house built - Built 1960 to 1969 (%)
Year house built - Built 1950 to 1959 (%)
Year house built - Built 1940 to 1949 (%)
Year house built - Built 1939 or earlier (%)
Median number of rooms in houses and condos
Median number of rooms in apartments
Median number of bedrooms in owner occupied houses
Mean number of bedrooms in owner occupied houses
Median number of bedrooms in renter occupied houses
Mean number of bedrooms in renter occupied houses
Median number of vehichles in owner occupied houses
Mean number of vehichles in owner occupied houses
Median number of vehichles in renter occupied houses
Mean number of vehichles in renter occupied houses
Rooms in owner-occupied houses - 1 room (%)
Rooms in owner-occupied houses - 2 rooms (%)
Rooms in owner-occupied houses - 3 rooms (%)
Rooms in owner-occupied houses - 4 rooms (%)
Rooms in owner-occupied houses - 5 rooms (%)
Rooms in owner-occupied houses - 6 rooms (%)
Rooms in owner-occupied houses - 7 rooms (%)
Rooms in owner-occupied houses - 8 rooms (%)
Rooms in owner-occupied houses - 9+ rooms (%)
Rooms in renter-occupied houses - 1 room (%)
Rooms in renter-occupied houses - 2 rooms (%)
Rooms in renter-occupied houses - 3 rooms (%)
Rooms in renter-occupied houses - 4 rooms (%)
Rooms in renter-occupied houses - 5 rooms (%)
Rooms in renter-occupied houses - 6 rooms (%)
Rooms in renter-occupied houses - 7 rooms (%)
Rooms in renter-occupied houses - 8 rooms (%)
Rooms in renter-occupied houses - 9+ rooms (%)
Bedrooms in owner-occupied houses - no bedrooms (%)
Bedrooms in owner-occupied houses - 1 bedroom (%)
Bedrooms in owner-occupied houses - 2 bedrooms (%)
Bedrooms in owner-occupied houses - 3 bedrooms (%)
Bedrooms in owner-occupied houses - 4 bedrooms (%)
Bedrooms in owner-occupied houses - 5+ bedrooms (%)
Bedrooms in renter-occupied houses - no bedrooms (%)
Bedrooms in renter-occupied houses - 1 bedroom (%)
Bedrooms in renter-occupied houses - 2 bedrooms (%)
Bedrooms in renter-occupied houses - 3 bedrooms (%)
Bedrooms in renter-occupied houses - 4 bedrooms (%)
Bedrooms in renter-occupied houses - 5+ bedrooms (%)
Vehicles available in owner-occupied houses - no vehicle available (%)
Vehicles available in owner-occupied houses - 1 vehicle available(%)
Vehicles available in owner-occupied houses - 2 Vehicles available (%)
Vehicles available in owner-occupied houses - 3 Vehicles available (%)
Vehicles available in owner-occupied houses - 4 Vehicles available (%)
Vehicles available in owner-occupied houses - 5+ Vehicles available (%)
Vehicles available in renter-occupied houses - no vehicle available (%)
Vehicles available in renter-occupied houses - 1 vehicle available (%)
Vehicles available in renter-occupied houses - 2 Vehicles available (%)
Vehicles available in renter-occupied houses - 3 Vehicles available (%)
Vehicles available in renter-occupied houses - 4 Vehicles available (%)
Vehicles available in renter-occupied houses - 5+ Vehicles available (%)
Housing units in structures - 1, detached (%)
Housing units in structures - 1, attached (%)
Housing units in structures - 2 (%)
Housing units in structures - 3 or 4 (%)
Housing units in structures - 5 to 9 (%)
Housing units in structures - 10 to 19 (%)
Housing units in structures - 20 to 49 (%)
Housing units in structures - 50 or more (%)
Housing units in structures - Mobile home (%)
Housing units in structures - Boat, RV, van, etc. (%)
Housing units in structures - Owners - 1, detached (%)
Housing units in structures - Owners - 1, attached (%)
Housing units in structures - Owners - 2 (%)
Housing units in structures - Owners - 3 or 4 (%)
Housing units in structures - Owners - 5 to 9 (%)
Housing units in structures - Owners - 10 to 19 (%)
Housing units in structures - Owners - 20 to 49 (%)
Housing units in structures - Owners - 50 or more (%)
Housing units in structures - Owners - Mobile home (%)
Housing units in structures - Owners - Boat, RV, van, etc. (%)
Housing units in structures - Renters - 1, detached (%)
Housing units in structures - Renters - 1, attached (%)
Housing units in structures - Renters - 2 (%)
Housing units in structures - Renters - 3 or 4 (%)
Housing units in structures - Renters - 5 to 9 (%)
Housing units in structures - Renters - 10 to 19 (%)
Housing units in structures - Renters - 20 to 49 (%)
Housing units in structures - Renters - 50 or more (%)
Housing units in structures - Renters - Mobile home (%)
Housing units in structures - Renters - Boat, RV, van, etc. (%)
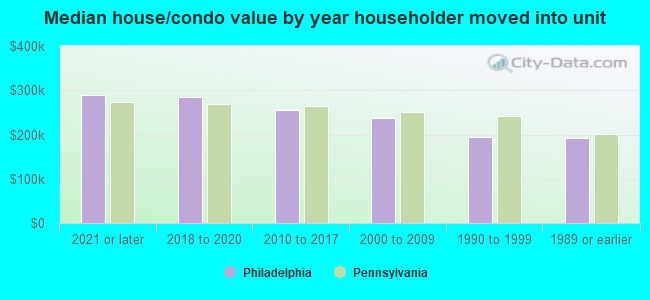
House/condo owner moved in on average (years ago)
Renter moved in on average (years ago)
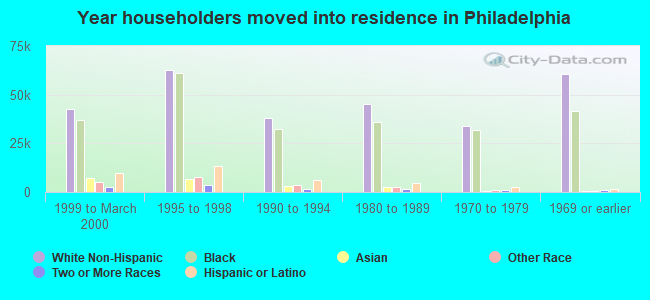
Year householder moved into unit - Moved in 1999 to March 2000 (%)
Year householder moved into unit - Moved in 1999 to March 2000 (%) - White
Year householder moved into unit - Moved in 1999 to March 2000 (%) - Black or African American
Year householder moved into unit - Moved in 1999 to March 2000 (%) - Asian
Year householder moved into unit - Moved in 1999 to March 2000 (%) - Hispanic or Latino
Year householder moved into unit - Moved in 1999 to March 2000 (%) - American Indian and Alaska Native
Year householder moved into unit - Moved in 1999 to March 2000 (%) - Multirace
Year householder moved into unit - Moved in 1999 to March 2000 (%) - Other Race
Year householder moved into unit - Moved in 1995 to 1998 (%)
Year householder moved into unit - Moved in 1995 to 1998 (%) - White
Year householder moved into unit - Moved in 1995 to 1998 (%) - Black or African American
Year householder moved into unit - Moved in 1995 to 1998 (%) - Asian
Year householder moved into unit - Moved in 1995 to 1998 (%) - Hispanic or Latino
Year householder moved into unit - Moved in 1995 to 1998 (%) - American Indian and Alaska Native
Year householder moved into unit - Moved in 1995 to 1998 (%) - Multirace
Year householder moved into unit - Moved in 1995 to 1998 (%) - Other Race
Year householder moved into unit - Moved in 1990 to 1994 (%)
Year householder moved into unit - Moved in 1990 to 1994 (%) - White
Year householder moved into unit - Moved in 1990 to 1994 (%) - Black or African American
Year householder moved into unit - Moved in 1990 to 1994 (%) - Asian
Year householder moved into unit - Moved in 1990 to 1994 (%) - Hispanic or Latino
Year householder moved into unit - Moved in 1990 to 1994 (%) - American Indian and Alaska Native
Year householder moved into unit - Moved in 1990 to 1994 (%) - Multirace
Year householder moved into unit - Moved in 1990 to 1994 (%) - Other Race
Year householder moved into unit - Moved in 1980 to 1989 (%)
Year householder moved into unit - Moved in 1980 to 1989 (%) - White
Year householder moved into unit - Moved in 1980 to 1989 (%) - Black or African American
Year householder moved into unit - Moved in 1980 to 1989 (%) - Asian
Year householder moved into unit - Moved in 1980 to 1989 (%) - Hispanic or Latino
Year householder moved into unit - Moved in 1980 to 1989 (%) - American Indian and Alaska Native
Year householder moved into unit - Moved in 1980 to 1989 (%) - Multirace
Year householder moved into unit - Moved in 1980 to 1989 (%) - Other Race
Year householder moved into unit - Moved in 1970 to 1979 (%)
Year householder moved into unit - Moved in 1970 to 1979 (%) - White
Year householder moved into unit - Moved in 1970 to 1979 (%) - Black or African American
Year householder moved into unit - Moved in 1970 to 1979 (%) - Asian
Year householder moved into unit - Moved in 1970 to 1979 (%) - Hispanic or Latino
Year householder moved into unit - Moved in 1970 to 1979 (%) - American Indian and Alaska Native
Year householder moved into unit - Moved in 1970 to 1979 (%) - Multirace
Year householder moved into unit - Moved in 1970 to 1979 (%) - Other Race
Year householder moved into unit - Moved in 1969 or earlier (%)
Year householder moved into unit - Moved in 1969 or earlier (%) - White
Year householder moved into unit - Moved in 1969 or earlier (%) - Black or African American
Year householder moved into unit - Moved in 1969 or earlier (%) - Asian
Year householder moved into unit - Moved in 1969 or earlier (%) - Hispanic or Latino
Year householder moved into unit - Moved in 1969 or earlier (%) - American Indian and Alaska Native
Year householder moved into unit - Moved in 1969 or earlier (%) - Multirace
Year householder moved into unit - Moved in 1969 or earlier (%) - Other Race
Housing units lacking complete plumbing facilities (%)
Housing units lacking complete kitchen facilities (%)
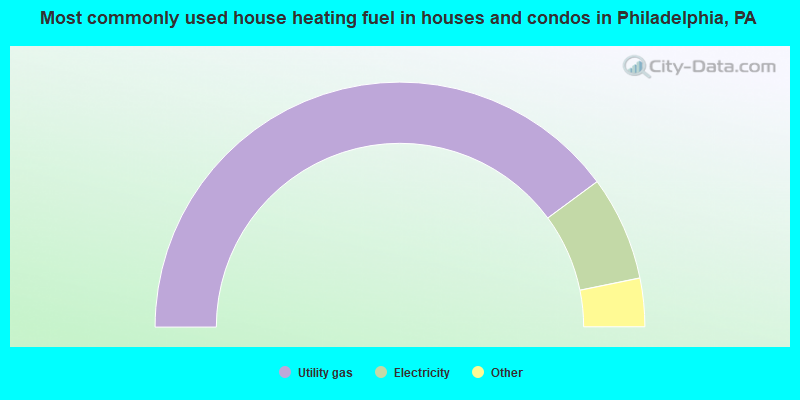
House heating fuel used in houses and condos - Utility gas (%)
House heating fuel used in houses and condos - Bottled, tank, or LP gas (%)
House heating fuel used in houses and condos - Electricity (%)
House heating fuel used in houses and condos - Fuel oil, kerosene, etc. (%)
House heating fuel used in houses and condos - Coal or coke (%)
House heating fuel used in houses and condos - Wood (%)
House heating fuel used in houses and condos - Solar energy (%)
House heating fuel used in houses and condos - Other fuel (%)
House heating fuel used in houses and condos - No fuel used (%)
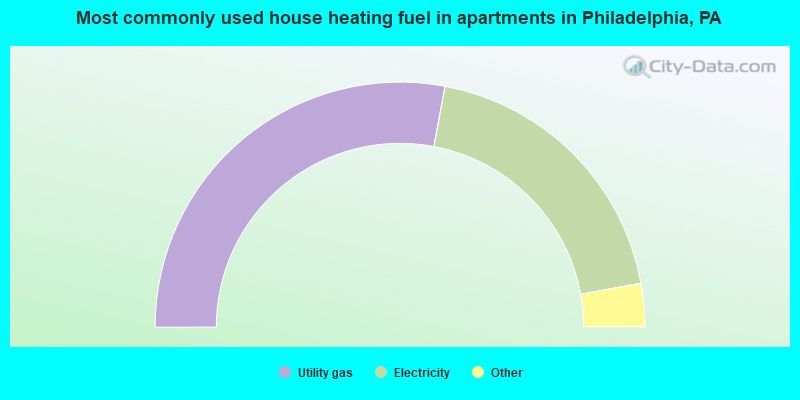
House heating fuel used in apartments - Utility gas (%)
House heating fuel used in apartments - Bottled, tank, or LP gas (%)
House heating fuel used in apartments - Electricity (%)
House heating fuel used in apartments - Fuel oil, kerosene, etc. (%)
House heating fuel used in apartments - Coal or coke (%)
House heating fuel used in apartments - Wood (%)
House heating fuel used in apartments - Solar energy (%)
House heating fuel used in apartments - Other fuel (%)
House heating fuel used in apartments - No fuel used (%)
Latest news about housing in Philadelphia, PA collected exclusively by city-data.com from local newspapers, TV, and radio stations
Median year house/condo built: 1947Median year apartment built: 1955Household type by relationship:
Households: 1,567,258
Male householders: 290,947 (113,210 living alone ), Female householders: 404,373 (153,782 living alone )193,879 spouses (187,751 opposite-sex spouses ), 56,907 unmarried partners , (51,771 opposite-sex unmarried partners ), 382,673 children (366,015 natural , 7,480 adopted , 9,178 stepchildren ), 68,713 grandchildren , 18,927 brothers or sisters , 16,325 parents , 1,034 foster children , 31,967 other relatives , 52,579 non-relatives In group quarters: 48,934
Size of family households: 153,648 2-persons , 85,337 3-persons , 62,101 4-persons , 33,267 5-persons , 11,958 6-persons , 8,743 7-or-more-persons .
Size of nonfamily households: 266,992 1-person , 58,963 2-persons , 10,448 3-persons , 2,648 4-persons , 831 5-persons , 335 6-persons , 49 7-or-more-persons .
135,167 married couples with children. single-parent households (18,660 men , 101,548 women ).
75.1% of residents of Philadelphia speak English at home. of residents speak Spanish at home (51% speak English very well , 18% speak English well , 20% speak English not well , 11% don't speak English at all ).of residents speak other Indo-European language at home (54% speak English very well , 26% speak English well , 15% speak English not well , 6% don't speak English at all ).of residents speak Asian or Pacific Island language at home (40% speak English very well , 25% speak English well , 27% speak English not well , 9% don't speak English at all ).of residents speak other language at home (62% speak English very well , 29% speak English well , 8% speak English not well , 1% don't speak English at all ).
Foreign born population: 246,579 (15.7%)of them are naturalized citizens )
Median number of rooms in houses and condos:
Median number of rooms in apartments
Owner-occupied Renter-occupied
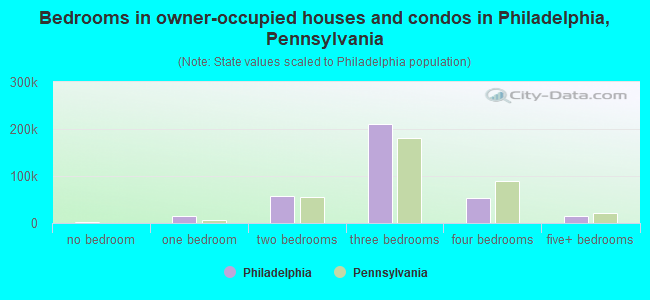
Bedrooms in owner-occupied houses and condos in Philadelphia, Pennsylvania
3,048 no bedroom 13,985 1 bedroom 56,966 2 bedrooms 210,669 3 bedrooms 54,072 4 bedrooms 14,795 5+ bedrooms
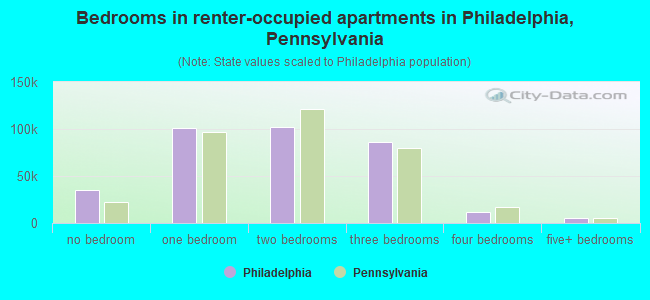
Bedrooms in renter-occupied apartments in Philadelphia, Pennsylvania
35,289 no bedroom 101,328 1 bedroom 101,648 2 bedrooms 86,452 3 bedrooms 12,205 4 bedrooms 4,863 5+ bedrooms
Owner-occupied Renter-occupied
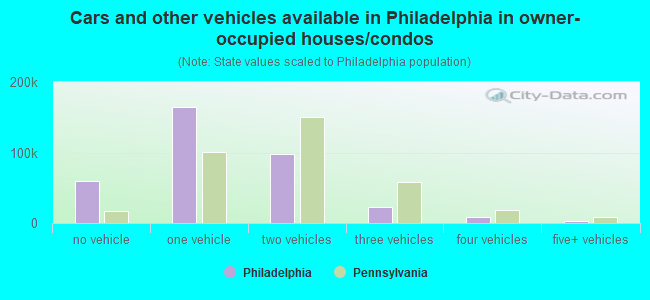
Cars and other vehicles available in Philadelphia in owner-occupied houses/condos
59,418 no vehicle 164,386 1 vehicle 97,167 2 vehicles 22,097 3 vehicles 8,242 4 vehicles 2,225 5+ vehicles
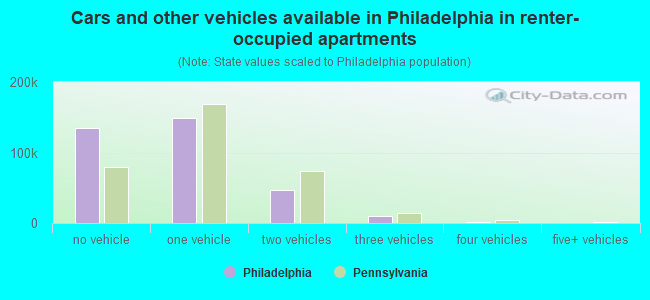
Cars and other vehicles available in Philadelphia in renter-occupied apartments
135,163 no vehicle 149,255 1 vehicle 46,299 2 vehicles 9,408 3 vehicles 1,130 4 vehicles 530 5+ vehicles
Owner-occupied Renter-occupied
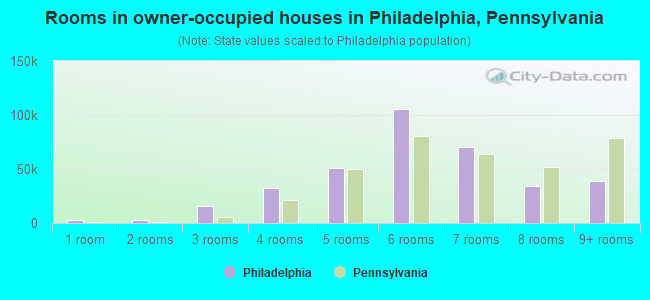
Rooms in owner-occupied houses in Philadelphia, Pennsylvania
2,504 1 room 2,890 2 rooms 15,607 3 rooms 32,555 4 rooms 50,518 5 rooms 105,628 6 rooms 70,324 7 rooms 34,631 8 rooms 38,878 9+ rooms
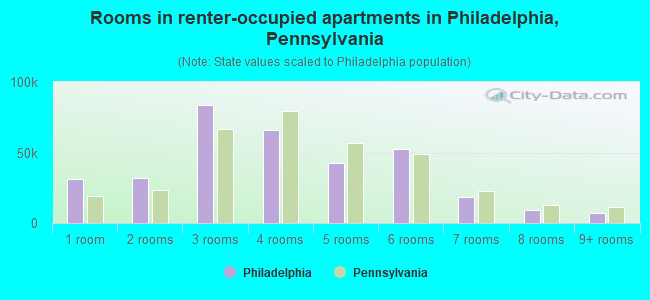
Rooms in renter-occupied apartments in Philadelphia, Pennsylvania
30,905 1 room 31,961 2 rooms 83,346 3 rooms 65,669 4 rooms 42,632 5 rooms 52,271 6 rooms 18,712 7 rooms 9,259 8 rooms 7,030 9+ rooms
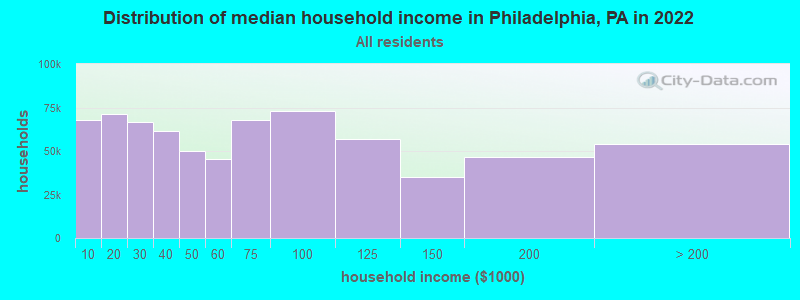
Philadelphia, PA household income distribution 67,579 Less than $10,00071,356 $10,000 to $19,99966,399 $20,000 to $29,99961,441 $30,000 to $39,99949,731 $40,000 to $49,99945,190 $50,000 to $59,99967,889 $60,000 to $74,99973,100 $75,000 to $99,99956,828 $100,000 to $124,99935,082 $125,000 to $149,99946,496 $150,000 to $199,99954,229 $200,000 or more
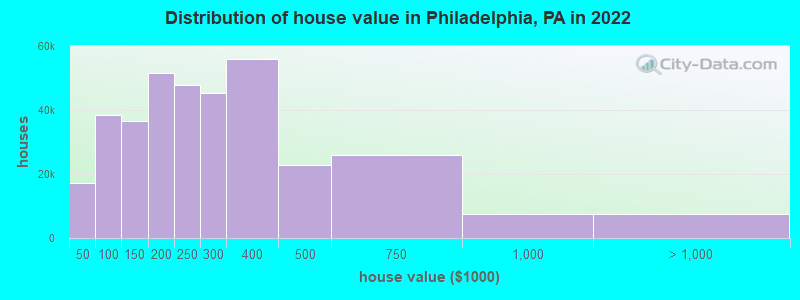
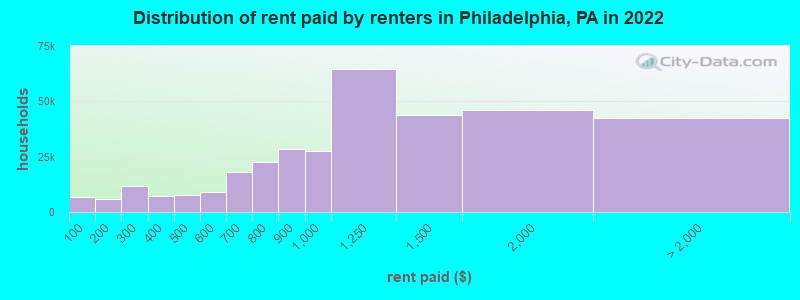
Home value of owner - occupied houses in 2022 in Philadelphia, PA 3,785 Less than $10,0001,880 $10,000 to $14,9991,628 $15,000 to $19,9991,437 $20,000 to $24,9991,448 $25,000 to $29,9991,328 $30,000 to $34,9992,776 $35,000 to $39,9992,777 $40,000 to $49,9994,940 $50,000 to $59,9994,328 $60,000 to $69,99910,857 $70,000 to $79,9997,828 $80,000 to $89,9997,566 $90,000 to $99,99921,298 $100,000 to $124,99915,114 $125,000 to $149,99928,101 $150,000 to $174,99923,486 $175,000 to $199,99947,783 $200,000 to $249,99945,375 $250,000 to $299,99956,017 $300,000 to $399,99922,739 $400,000 to $499,99926,025 $500,000 to $749,9997,581 $750,000 to $999,9993,906 $1,000,000 to $1,499,9991,081 $1,500,000 to $1,999,9992,451 $2,000,000 or moreRent paid by renters in 2022 in Philadelphia, PA 6,706 Less than $1002,939 $100 to $1492,774 $150 to $1999,418 $200 to $2492,185 $250 to $2994,459 $300 to $3492,625 $350 to $3994,043 $400 to $4493,597 $450 to $4995,494 $500 to $5493,670 $550 to $5998,126 $600 to $64910,025 $650 to $69912,279 $700 to $74910,338 $750 to $79928,288 $800 to $89927,755 $900 to $99964,829 $1,000 to $1,24943,677 $1,250 to $1,49946,047 $1,500 to $1,99916,103 $2,000 to $2,4995,155 $2,500 to $2,9992,420 $3,000 to $3,4994,335 $3,500 or more14,498 No cash rent
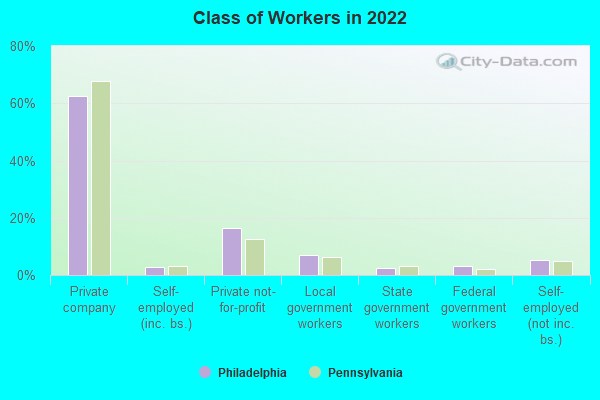
Percentage of workers working in this county: 79.2%Number of people working at home: 143,519 (19.4% of all workers )
Travel time to work (commute)
Less than 5 minutes: 8,7895 to 9 minutes: 33,07010 to 14 minutes: 54,01515 to 19 minutes: 72,62420 to 24 minutes: 79,64325 to 29 minutes: 40,34130 to 34 minutes: 106,31835 to 39 minutes: 21,98740 to 44 minutes: 34,21045 to 59 minutes: 68,43760 to 89 minutes: 57,04190 or more minutes: 19,078
Means of transportation to work:
Drove a car alone: 383,059 (47.8%)Carpooled: 51,755 (6.5%)Bus : 66,670 (8.3%)Subway or elevated rail : 39,841 (5.0%)Long-distance train or commuter rail : 24,215 (3.0%)Light rail, streetcar or trolley : 7,796 (1.0%)Ferryboat: 62 (0.0%)Taxi: 17,573 (2.2%)Bicycle: 17,309 (2.2%)Walked: 49,250 (6.1%)Worked at home: 143,519 (17.9%)
Unemployment by race in 2022
Unemployment rate for White non-Hispanic residents 3.4% Males3.1% FemalesUnemployment rate for Black residents 11.9% Males7.8% FemalesUnemployment rate for American Indian and Alaska Native residents 18.4% Males33.0% FemalesUnemployment rate for Asian residents 3.2% Males6.6% FemalesUnemployment rate for other race residents 11.1% Males5.9% FemalesUnemployment rate for two or more race residents 11.7% Males12.8% FemalesUnemployment rate for Hispanic or Latino residents 12.5% Males7.6% Females
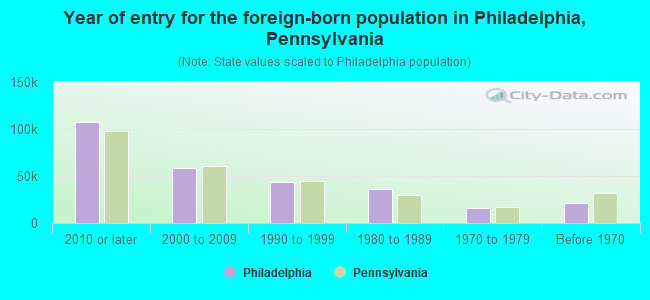
Year of entry for the foreign-born population in Philadelphia, Pennsylvania
106,976 2010 or later 58,442 2000 to 2009 43,192 1990 to 1999 36,563 1980 to 1989 15,700 1970 to 1979 21,318 Before 1970
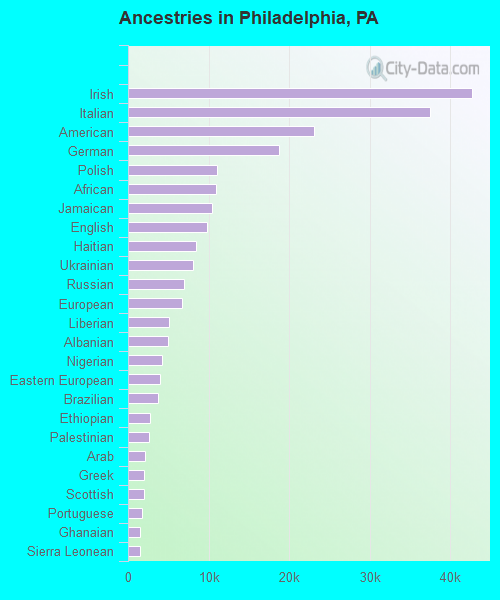
First ancestries reported:
Irish: 42,651 (4.6%)
Italian: 37,421 (4.1%)
American: 23,038 (2.5%)
German: 18,727 (2.0%)
Polish: 11,045 (1.2%)
African: 10,942 (1.2%)
Jamaican: 10,365 (1.1%)
English: 9,742 (1.1%)
Haitian: 8,418 (0.9%)
Ukrainian: 8,044 (0.9%)
Russian: 6,893 (0.7%)
European: 6,749 (0.7%)
Liberian: 5,088 (0.6%)
Albanian: 5,020 (0.5%)
Nigerian: 4,193 (0.5%)
Eastern European: 4,024 (0.4%)
Brazilian: 3,736 (0.4%)
Ethiopian: 2,708 (0.3%)
Palestinian: 2,596 (0.3%)
Arab: 2,096 (0.2%)
Greek: 2,040 (0.2%)
Scottish: 2,021 (0.2%)
Portuguese: 1,781 (0.2%)
Ghanaian: 1,486 (0.2%)
Sierra Leonean: 1,444 (0.2%)
Moroccan: 1,355 (0.1%)
Trinidadian and Tobagonian: 1,331 (0.1%)
West Indian: 1,287 (0.1%)
Egyptian: 1,274 (0.1%)
French: 1,250 (0.1%)
Lithuanian: 1,080 (0.1%)
Dutch: 1,018 (0.1%)
Hungarian: 1,015 (0.1%)
Turkish: 895 (0.10%)
Scotch-Irish: 856 (0.09%)
Armenian: 821 (0.09%)
Swedish: 722 (0.08%)
Pennsylvania German: 716 (0.08%)
Guyanese: 680 (0.07%)
Slavic: 631 (0.07%)
Romanian: 628 (0.07%)
British: 614 (0.07%)
Iranian: 534 (0.06%)
Czech: 525 (0.06%)
Slovak: 496 (0.05%)
Kenyan: 496 (0.05%)
Iraqi: 453 (0.05%)
Norwegian: 423 (0.05%)
Austrian: 401 (0.04%)
Danish: 396 (0.04%)
British West Indian: 378 (0.04%)
Lebanese: 367 (0.04%)
Barbadian: 359 (0.04%)
French Canadian: 355 (0.04%)
Welsh: 350 (0.04%)
Finnish: 321 (0.03%)
Canadian: 316 (0.03%)
Syrian: 301 (0.03%)
Afghan: 298 (0.03%)
Serbian: 285 (0.03%)
Bulgarian: 277 (0.03%)
Northern European: 257 (0.03%)
Israeli: 253 (0.03%)
Bahamian: 252 (0.03%)
Australian: 234 (0.03%)
Croatian: 227 (0.02%)
Jordanian: 225 (0.02%)
Swiss: 212 (0.02%)
Senegalese: 175 (0.02%)
Czechoslovakian: 156 (0.02%)
Somali: 113 (0.01%)
Ugandan: 106 (0.01%)
Scandinavian: 104 (0.01%)
South African: 92 (0.01%)
Estonian: 86 (0.01%)
Belgian: 77 (0.01%)
Sudanese: 75 (0.01%)
Yugoslavian: 62 (0.01%)
Cape Verdean: 58 (0.01%)
Belizean: 52 (0.01%)
Bermudan: 52 (0.01%)
Most common places of birth for foreign-born residents (%): Dominican Republic Philadelphia:
12.3% (29,841)Pennsylvania:
9.2% (86,544)
China, excluding Hong Kong and Taiwan Philadelphia:
10.3% (24,927)Pennsylvania:
7.2% (67,704)
Vietnam Philadelphia:
5.1% (12,312)Pennsylvania:
3.3% (31,542)
India Philadelphia:
4.8% (11,604)Pennsylvania:
10.7% (100,596)
Jamaica Philadelphia:
3.8% (9,186)Pennsylvania:
2.4% (22,612)
Mexico Philadelphia:
3.3% (8,052)Pennsylvania:
5.8% (54,190)
Brazil Philadelphia:
2.8% (6,760)Pennsylvania:
1.4% (13,077)
Ukraine Philadelphia:
2.7% (6,604)Pennsylvania:
2.1% (19,841)
Liberia Philadelphia:
2.4% (5,705)Pennsylvania:
1.4% (12,910)
Cambodia Philadelphia:
2.3% (5,572)Pennsylvania:
1.0% (9,386)
Haiti Philadelphia:
2.1% (5,159)Pennsylvania:
1.6% (15,224)
Albania Philadelphia:
2.0% (4,882)Pennsylvania:
0.7% (6,351)
Korea Philadelphia:
1.9% (4,633)Pennsylvania:
2.9% (27,433)
Philippines Philadelphia:
1.9% (4,521)Pennsylvania:
2.2% (21,039)
Bangladesh Philadelphia:
1.7% (4,169)Pennsylvania:
0.9% (8,772)
Nigeria Philadelphia:
1.5% (3,724)Pennsylvania:
1.1% (10,709)
Place of birth for U.S.-born residents:
This state: 965,459Other state: 296,454Northeast: 146,003Midwest: 32,325South: 94,748West: 23,378 86.7% of Philadelphia residents lived in the same house 1 years ago.
Out of people who lived in different houses, 37.8% lived in this county.
Out of people who lived in different counties, 38.7% lived in Pennsylvania.
Philadelphia:
86.7%State average:
89.3%
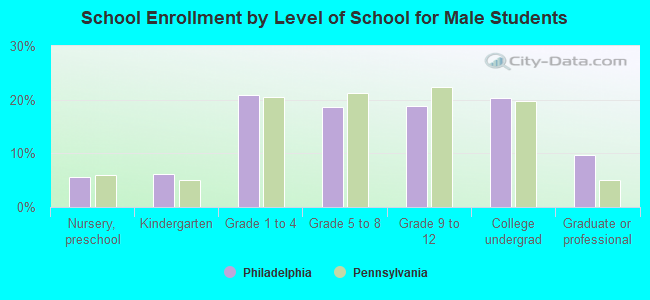
Education attainment for males 25 years and older:
No schooling: 13,875Nursery to 4th grade: 2,2225th and 6th grade: 4,8167th and 8th grade: 5,3119th grade: 6,58210th grade: 9,60011th grade: 9,86612th grade, no diploma: 14,461High school graduate (or equivalency): 148,865Less than 1 year of college: 24,965Some college more than 1 year, no degree: 57,162Associate degree: 27,192Bachelor's degree: 97,578Master's degree: 49,276Professional school degree: 15,503Doctorate degree: 10,155
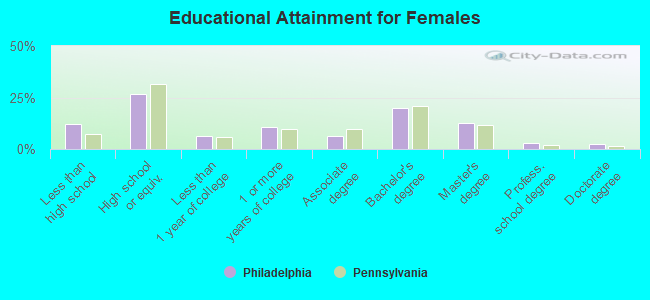
Education attainment for females 25 years and older:
No schooling: 13,631Nursery to 4th grade: 2,4795th and 6th grade: 4,2627th and 8th grade: 5,7549th grade: 7,86210th grade: 6,92911th grade: 13,30012th grade, no diploma: 15,851High school graduate (or equivalency): 155,589Less than 1 year of college: 36,209Some college more than 1 year, no degree: 61,624Associate degree: 37,609Bachelor's degree: 114,493Master's degree: 72,937Professional school degree: 16,630Doctorate degree: 13,602
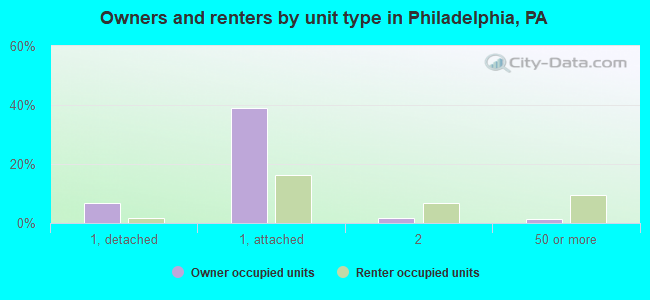
Housing units in structures:
One, detached: 59,887One, attached: 418,783Two: 64,6803 or 4: 50,0215 to 9: 27,80710 to 19: 21,15820 to 49: 27,29350 or more: 85,176Mobile homes: 2,816Boats, RVs, vans, etc.: 35Median worth of mobile homes: $63,200
Housing units lacking complete plumbing facilities in 2022: 2.7%Housing units lacking complete kitchen facilities in 2022: 2.9%House/condo owner moved in on average 15 years ago
Renter moved in on average 3 years ago
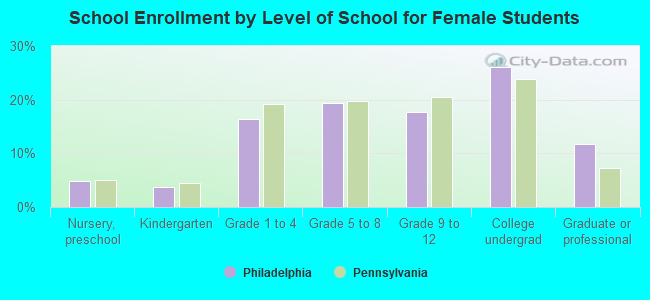
Private vs. public school enrollment:
Students in private schools in grades 1 to 8 (elementary and middle school): 35,244 Here:
24.1%Pennsylvania:
15.7%
Students in private schools in grades 9 to 12 (high school): 19,464 Here:
27.5%Pennsylvania:
13.4%
Students in private undergraduate colleges: 43,103 Here:
47.6%Pennsylvania:
39.8%