District of Columbia, District of Columbia (DC)
County owner-occupied free and clear houses and condos in 2010: 21,939
County owner-occupied houses and condos in 2000: 101,216
Renter-occupied apartments: 154,652 (it was 147,122 in 2000)
| % of renters here: | 59% |
| State: | 58% |
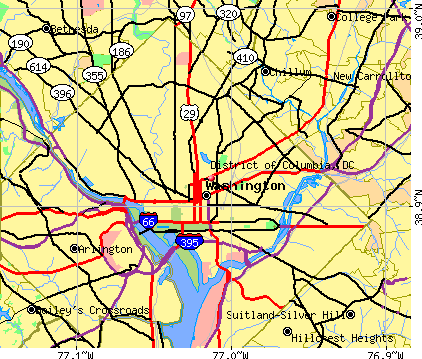
Land area: 61 sq. mi.
Water area: 6.9 sq. mi.
Population density: 10941 people per square mile (very high).
Industries providing employment: Professional, scientific, management, administrative, and waste management services (24.7%), Public administration (18.2%), Educational, health and social services (17.7%).
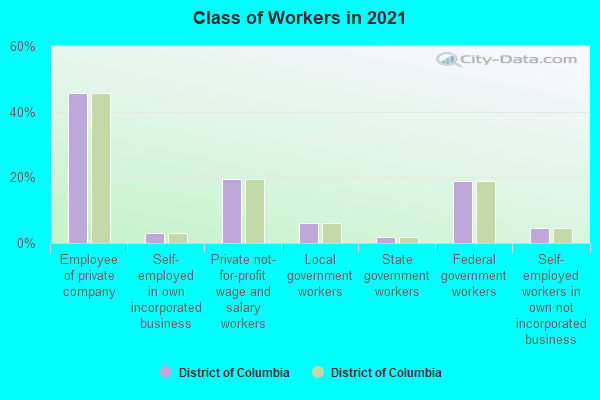
Type of workers:
- Private wage or salary: 69%
- Government: 27%
- Self-employed, not incorporated: 4%
- Unpaid family work: 0%
- OSM Map
- General Map
- Google Map
- MSN Map

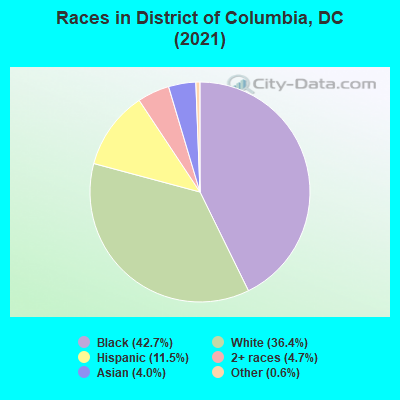
- 279,80941.7%Black Non-Hispanic Alone
- 246,74536.7%White Non-Hispanic Alone
- 78,91111.7%Hispanic or Latino
- 33,5445.0%Two or more races
- 27,2504.1%Asian alone
- 3,8230.6%Some other race alone
- 1,0120.2%American Indian and Alaska Native alone
- 7090.1%Native Hawaiian and Other
Pacific Islander alone
| Median resident age: | 34.9 years |
| District of Columbia median age: | 34.9 years |
| Males: 319,763 | |
| Females: 352,040 |

 | Wizards/Capitals moving to NOVA? (79 replies) |
| Racist Gentrifiers in DC (203 replies) |
| Is licensed handgun carry now legal in District of Columbia? (105 replies) |
| DC 2020 Census Numbers. (19 replies) |
| Single lady looking for safe DC and northern VA neighborhoods (13 replies) |
| Publix in the District of Columbia (21 replies) |
| District of Columbia: | 2.0 people |
| District of Columbia: | 2 people |
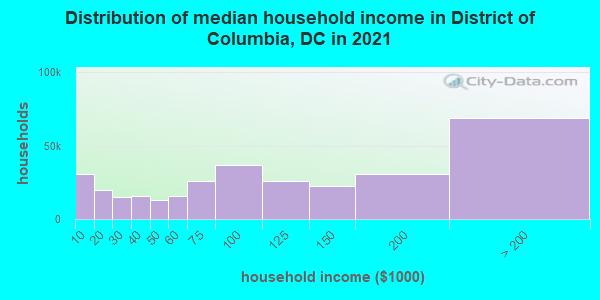
Estimated median household income in 2022: $101,027 ($40,127 in 1999)
| This county: | $101,027 |
| District of Columbia: | $101,027 |
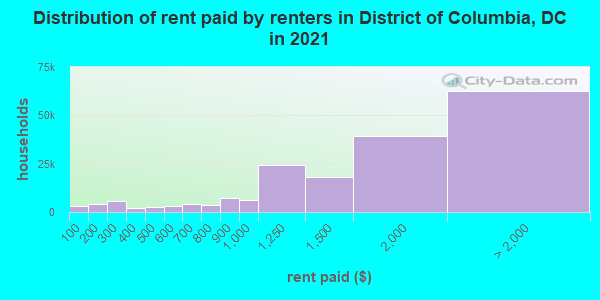
Median contract rent in 2022 for apartments: $1,768 (lower quartile is $1,195, upper quartile is $2,480)
| This county: | $1768 |
| State: | $1768 |
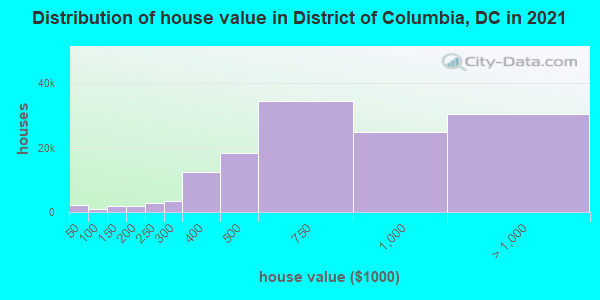
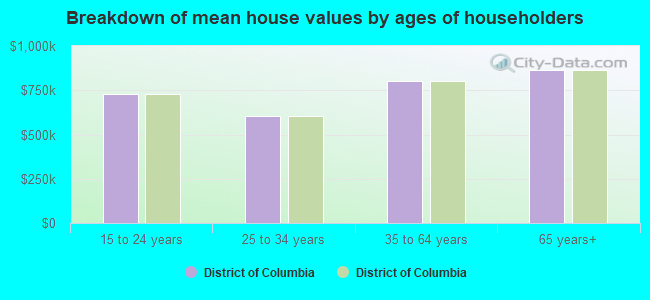
Estimated median house or condo value in 2022: $711,100 (it was $153,500 in 2000)
| District of Columbia: | $711,100 |
| District of Columbia: | $711,100 |
Mean price in 2022:
Median monthly housing costs for homes and condos with a mortgage: $2,893Detached houses: $1,228,031
Here: $1,228,031 State: $1,228,031 Townhouses or other attached units: $898,544
Here: $898,544 State: $898,544 In 2-unit structures: $898,746
Here: $898,746 State: $898,746 In 3-to-4-unit structures: $622,146
Here: $622,146 State: $622,146 In 5-or-more-unit structures: $614,699
Here: $614,699 State: $614,699
Median monthly housing costs for units without a mortgage: $784
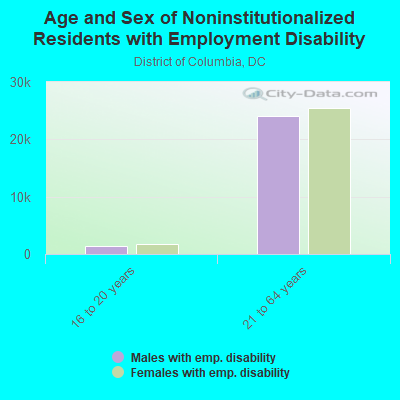
Institutionalized population: 7,339
Health of residents in District of Columbia based on CDC Behavioral Risk Factor Surveillance System Survey Questionnaires from 2003 to 2012:
General health status score of residents in this county from 1 (poor) to 5 (excellent) is 3.7. This is significantly better than average.79.2% of residents exercised in the past month. This is about average.
43.6% of residents smoked 100+ cigarettes in their lives. This is about average.
81.0% of adult residents drank alcohol in the past 30 days. This is more than average.
74.9% of residents visited a dentist within the past year. This is about average.
Average weight of males is 186 pounds. This is less than average.
Average weight of females is 161 pounds. This is about average.
4.0% of residents keep firearms around their homes. This is less than average.
Median real estate property taxes paid for housing units with mortgages in 2022: $4,268 (0.6%)
Median real estate property taxes paid for housing units with no mortgage in 2022: $3,567 (0.5%)
| District of Columbia: | 13.3% |
| District of Columbia: | 13.3% |
Median age of residents in 2022: 34.9 years old
(Males: 34.8 years old, Females: 34.9 years old)
(Median age for: White residents: 35.1 years old, Black residents: 37.0 years old, American Indian residents: 40.4 years old, Asian residents: 34.4 years old, Hispanic or Latino residents: 31.8 years old, Other race residents: 31.3 years old)
Area name: Washington-Arlington-Alexandria, DC-VA-MD HUD Metro FMR Area
Fair market rent in 2006 for a 1-bedroom apartment in District of Columbia is $1080 a month.
Fair market rent for a 2-bedroom apartment is $1225 a month.
Fair market rent for a 3-bedroom apartment is $1580 a month.
Cities in this county include: Washington.
2023 air pollution in District of Columbia:
Carbon Monoxide: 0.287 ppm (standard limit: 9 ppm). Near U.S. average.
Nitrogen Dioxide: 0.01 ppm (standard limit: 0.053 ppm). Above U.S. average.
Ozone (1-hour): 0.029 ppm (standard limit: 0.12 ppm). Below U.S. average.
Particulate Matter (PM10) Annual: 13.8 µg/m3. Near U.S. average.
Particulate Matter (PM2.5) Annual: 10.2 µg/m3(standard limit: 15.0 µg/m3). Near U.S. average.
Sulfur Oxides Annual: 0.001 ppm (standard limit: 0.03 ppm). Near U.S. average.
Neighboring counties: Amador County, California  , Nye County, Nevada , Lawrence County, Indiana , Jackson County, Missouri , Owen County, Kentucky .
Current college students: 59,498
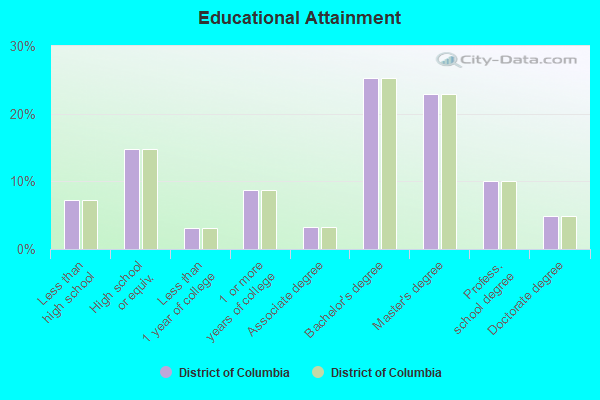
People 25 years of age or older with a high school degree or higher: 93.7%
People 25 years of age or older with a bachelor's degree or higher: 65.4%
Number of foreign born residents: 99,898 (50.9% naturalized citizens)
| District of Columbia: | 14.9% |
| Whole state: | 14.9% |
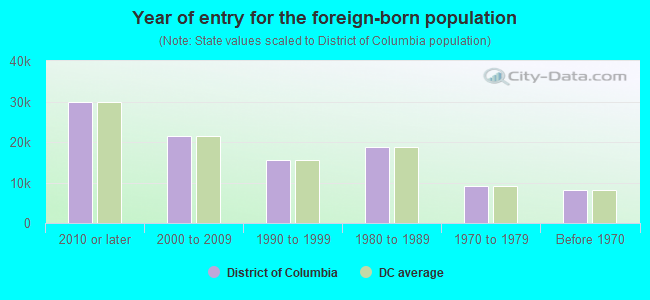
- Year of entry for the foreign-born population
- 40,0772010 or later
- 24,1722000 to 2009
- 13,5081990 to 1999
- 18,7121980 to 1989
- 9,0711970 to 1979
- 8,245Before 1970
Mean travel time to work (commute): minutes
Percentage of county residents living and working in this county: 83.9%
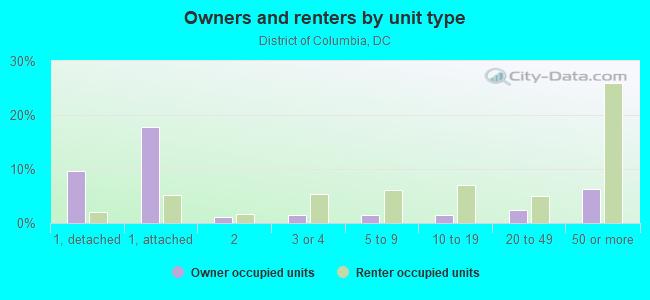
Housing units in structures:
- One, detached: 38,073
- One, attached: 77,994
- Two: 15,929
- 3 or 4: 27,583
- 5 to 9: 23,180
- 10 to 19: 28,402
- 20 to 49: 28,597
- 50 or more: 121,104
Housing units in District of Columbia with a mortgage: 99,094 (11,375 second mortgage, 671 home equity loan, 8,086 both second mortgage and home equity loan)
Houses without a mortgage: 1,614
| Here: | 99.0% with mortgage |
| State: | 98.4% with mortgage |
Religion statistics for District of Columbia
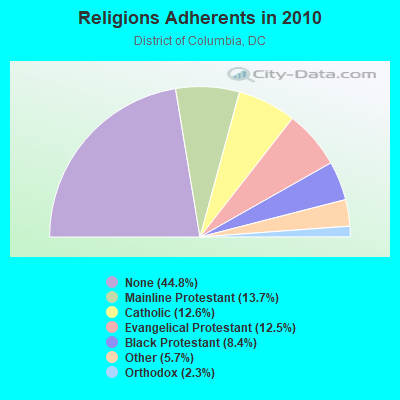
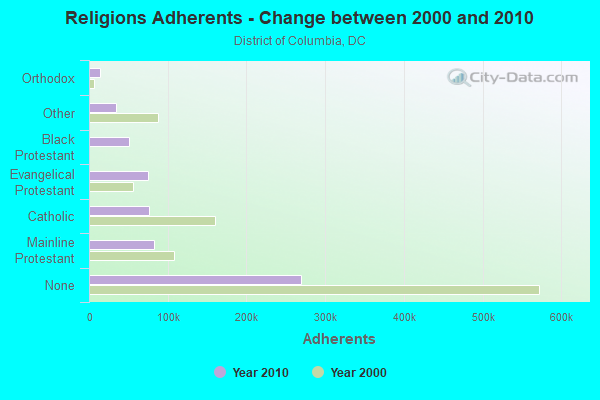
| Religion | Adherents | Congregations |
|---|---|---|
| Mainline Protestant | 82,388 | 181 |
| Catholic | 75,948 | 45 |
| Evangelical Protestant | 75,306 | 200 |
| Black Protestant | 50,602 | 109 |
| Other | 34,048 | 62 |
| Orthodox | 14,050 | 12 |
| None | 269,381 | - |
Source: Clifford Grammich, Kirk Hadaway, Richard Houseal, Dale E.Jones, Alexei Krindatch, Richie Stanley and Richard H.Taylor. 2012. 2010 U.S.Religion Census: Religious Congregations & Membership Study. Association of Statisticians of American Religious Bodies. Jones, Dale E., et al. 2002. Congregations and Membership in the United States 2000. Nashville, TN: Glenmary Research Center.
Food Environment Statistics:
| District of Columbia: | 3.22 / 10,000 pop. |
| State: | 3.22 / 10,000 pop. |
| This county: | 1.65 / 10,000 pop. |
| District of Columbia: | 1.65 / 10,000 pop. |
| District of Columbia: | 0.77 / 10,000 pop. |
| District of Columbia: | 0.77 / 10,000 pop. |
| This county: | 10.97 / 10,000 pop. |
| State: | 10.97 / 10,000 pop. |
| District of Columbia: | 8.5% |
| District of Columbia: | 8.5% |
| District of Columbia: | 22.0% |
| State: | 22.0% |
| Here: | 14.4% |
| State: | 14.4% |
Earthquake activity:
District of Columbia-area historical earthquake activity is significantly above District of Columbia state average. It is 57% smaller than the overall U.S. average.On 8/23/2011 at 17:51:04, a magnitude 5.8 (5.8 MW, Depth: 3.7 mi, Class: Moderate, Intensity: VI - VII) earthquake occurred 85.6 miles away from District of Columbia center
On 8/25/2011 at 05:07:52, a magnitude 4.5 (4.5 ML, Depth: 4.2 mi, Class: Light, Intensity: IV - V) earthquake occurred 84.5 miles away from the county center
On 1/16/1994 at 01:49:16, a magnitude 4.6 (4.6 MB, 4.6 LG, Depth: 3.1 mi) earthquake occurred 110.9 miles away from the county center
On 12/9/2003 at 20:59:18, a magnitude 4.5 (4.5 ML, Depth: 6.2 mi) earthquake occurred 98.4 miles away from the county center
On 12/9/2003 at 20:59:14, a magnitude 4.5 (4.5 MB, 4.5 LG) earthquake occurred 103.7 miles away from District of Columbia center
On 9/25/1998 at 19:52:52, a magnitude 5.2 (4.8 MB, 4.3 MS, 5.2 LG, 4.5 MW, Depth: 3.1 mi) earthquake occurred 252.4 miles away from the county center
Magnitude types: regional Lg-wave magnitude (LG), body-wave magnitude (MB), local magnitude (ML), surface-wave magnitude (MS), moment magnitude (MW)
Most recent natural disasters:
- District of Columbia, Incident Period: January 22, 2016 to January 23, 2016, Major Disaster (Presidential) Declared DC: March 04, 2016, FEMA Id: 4260, Natural disaster type: Other
- District of Columbia, Incident Period: October 28, 2012 to October 31, 2012, Emergency Declared DC: October 28, 2012, FEMA Id: 3352, Natural disaster type: Other
- District of Columbia, Incident Period: October 26, 2012 to October 31, 2012, Major Disaster (Presidential) Declared DC: December 05, 2012, FEMA Id: 4096, Natural disaster type: Other
- District of Columbia, Incident Period: June 29, 2012 to July 01, 2012, Major Disaster (Presidential) Declared DC: July 31, 2012, FEMA Id: 4073, Natural disaster type: Other
- District of Columbia, Incident Period: August 26, 2011 to September 01, 2011, Emergency Declared DC: August 28, 2011, FEMA Id: 3337, Natural disaster type: Other
- District of Columbia, Incident Period: August 26, 2011 to September 01, 2011, Major Disaster (Presidential) Declared DC: September 28, 2011, FEMA Id: 4036, Natural disaster type: Other
- District of Columbia, Incident Period: August 23, 2011 to August 28, 2011, Major Disaster (Presidential) Declared DC: November 08, 2011, FEMA Id: 4044, Natural disaster type: Other
- District of Columbia, Incident Period: February 05, 2010 to February 11, 2010, Major Disaster (Presidential) Declared DC: March 24, 2010, FEMA Id: 1890, Natural disaster type: Other
- District of Columbia, Incident Period: December 18, 2009 to December 20, 2009, Major Disaster (Presidential) Declared DC: March 03, 2010, FEMA Id: 1882, Natural disaster type: Other
- District of Columbia, Incident Period: January 17, 2009 to January 21, 2009, Emergency Declared DC: January 13, 2009, FEMA Id: 3300, Natural disaster type: Other
- 9 other natural disasters have been reported since 1953.
The number of natural disasters in District of Columbia (19) is greater than the US average (15).
Major Disasters (Presidential) Declared: 13
Emergencies Declared: 6
Causes of natural disasters: Other: 19 (Note: some incidents may be assigned to more than one category).
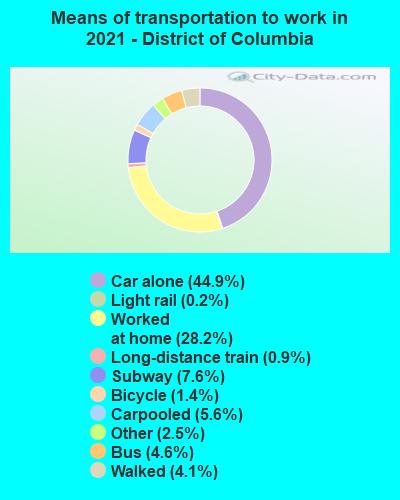
Means of transportation to work:
- Drove a car alone: 315,829 (45.6%)
- Carpooled: 45,462 (6.6%)
- Bus: 43,620 (6.3%)
- Subway or elevated rail: 83,205 (12.0%)
- Long-distance train or commuter rail: 10,732 (1.5%)
- Light rail, streetcar or trolley: 1,588 (0.2%)
- Ferryboat: 45 (0.0%)
- Taxicab, motorcycle, or other means: 15,077 (2.2%)
- Bicycle: 12,831 (1.9%)
- Walked: 38,447 (5.5%)
- Worked at home: 126,259 (18.2%)
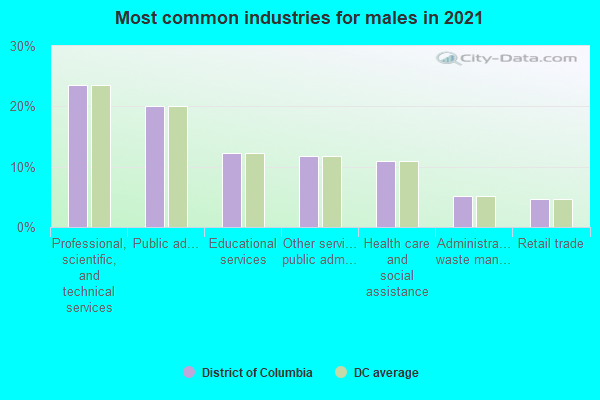
- Professional, scientific, and technical services (21%)
- Public administration (20%)
- Other services, except public administration (13%)
- Educational services (13%)
- Health care and social assistance (13%)
- Retail trade (6%)
- Accommodation and food services (4%)

- Professional, scientific, and technical services (19%)
- Public administration (18%)
- Other services, except public administration (12%)
- Educational services (12%)
- Health care and social assistance (12%)
- Retail trade (6%)
- Accommodation and food services (4%)
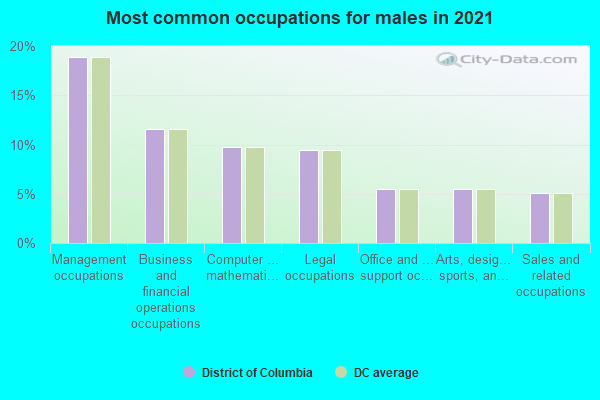
- Management occupations (20%)
- Business and financial operations occupations (13%)
- Computer and mathematical occupations (10%)
- Legal occupations (8%)
- Arts, design, entertainment, sports, and media occupations (6%)
- Office and administrative support occupations (6%)
- Sales and related occupations (5%)
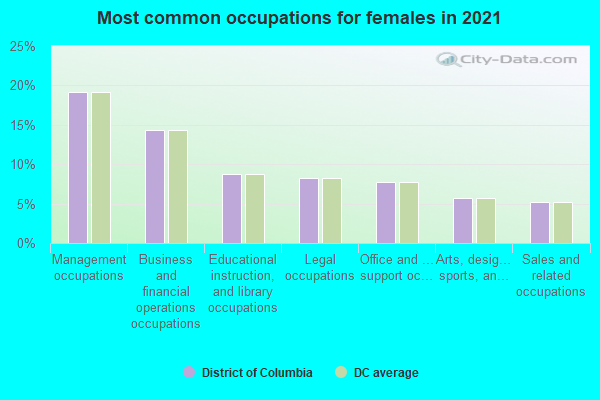
- Management occupations (18%)
- Business and financial operations occupations (13%)
- Office and administrative support occupations (9%)
- Legal occupations (8%)
- Educational instruction, and library occupations (8%)
- Arts, design, entertainment, sports, and media occupations (6%)
- Sales and related occupations (5%)
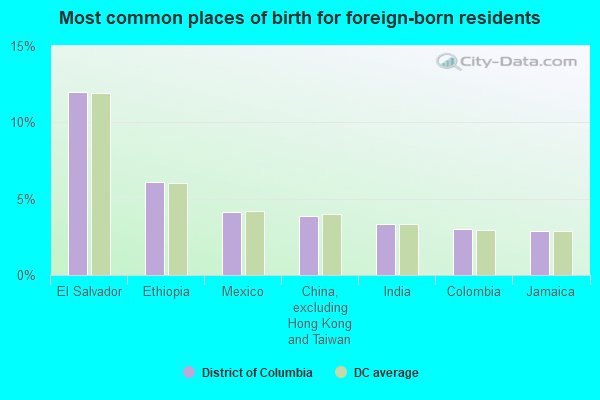
- El Salvador (11%)
- Ethiopia (7%)
- Mexico (4%)
- China, excluding Hong Kong and Taiwan (4%)
- India (3%)
- Colombia (3%)
- Jamaica (3%)
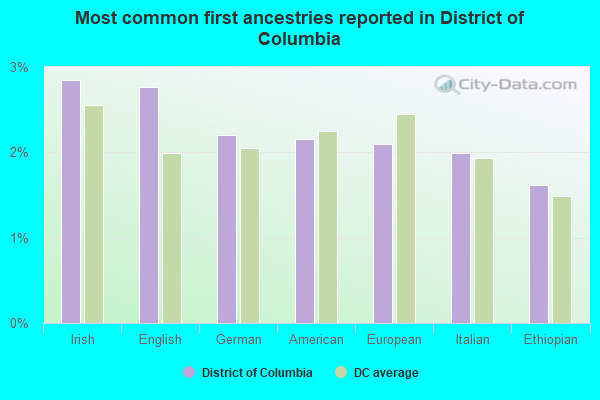
- Ethiopian (4%)
- Irish (3%)
- English (3%)
- German (2%)
- American (2%)
- African (2%)
- European (2%)
People in group quarters in District of Columbia, District of Columbia in 2010:
- 24,087 people in college/university student housing
- 3,134 people in local jails and other municipal confinement facilities
- 3,064 people in nursing facilities/skilled-nursing facilities
- 2,211 people in emergency and transitional shelters (with sleeping facilities) for people experiencing homelessness
- 2,131 people in other noninstitutional facilities
- 1,504 people in military barracks and dormitories (nondisciplinary)
- 1,021 people in workers' group living quarters and job corps centers
- 959 people in group homes intended for adults
- 769 people in residential treatment centers for adults
- 380 people in mental (psychiatric) hospitals and psychiatric units in other hospitals
- 334 people in correctional residential facilities
- 133 people in group homes for juveniles (non-correctional)
- 130 people in state prisons
- 63 people in correctional facilities intended for juveniles
- 55 people in residential schools for people with disabilities
- 42 people in residential treatment centers for juveniles (non-correctional)
- 4 people in in-patient hospice facilities
People in group quarters in District of Columbia, District of Columbia in 2000:
- 19,322 people in college dormitories (includes college quarters off campus)
- 3,759 people in nursing homes
- 3,448 people in other noninstitutional group quarters
- 1,383 people in local jails and other confinement facilities (including police lockups)
- 877 people in homes for the mentally retarded
- 815 people in other types of correctional institutions
- 782 people in other group homes
- 756 people in homes or halfway houses for drug/alcohol abuse
- 655 people in mental (psychiatric) hospitals or wards
- 640 people in halfway houses
- 593 people in military barracks, etc.
- 509 people in religious group quarters
- 376 people in job corps and vocational training facilities
- 358 people in hospitals/wards and hospices for chronically ill
- 334 people in military transient quarters for temporary residents
- 314 people in homes for the mentally ill
- 284 people in other hospitals or wards for chronically ill
- 190 people in other nonhousehold living situations
- 180 people in hospitals or wards for drug/alcohol abuse
- 104 people in orthopedic wards and institutions for the physically handicapped
- 78 people in homes for the physically handicapped
- 74 people in hospices or homes for chronically ill
- 33 people in short-term care, detention or diagnostic centers for delinquent children
- 19 people in other workers' dormitories
- 16 people in homes for abused, dependent, and neglected children
- 10 people in training schools for juvenile delinquents
- 8 people in unknown juvenile institutions
- 3 people in schools, hospitals, or wards for the intellectually disabled
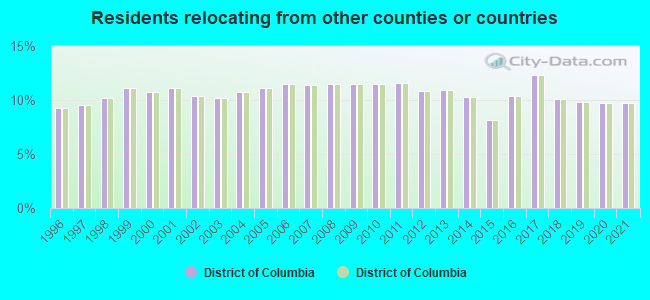
9.69% of this county's 2021 resident taxpayers lived in other counties in 2020 ($95,333 average adjusted gross income)
| Here: | 9.69% |
| District of Columbia average: | 9.69% |
0.11% of residents moved from foreign countries ($1,295 average AGI)
District of Columbia: 0.11% District of Columbia average: 0.11%
10 or fewer of this county's residents relocated from other counties in District of Columbia.
9.59% relocated from other states ($94,038 average AGI)
District of Columbia: 9.59% District of Columbia average: 9.59%
Top counties from which taxpayers relocated into this county between 2020 and 2021:
| from Prince George's County, MD | |
| from Montgomery County, MD | |
| from Arlington County, VA | |
| from Fairfax County, VA | |
| from New York County, NY | |
| from Alexandria city, VA | |
| from Cook County, IL |
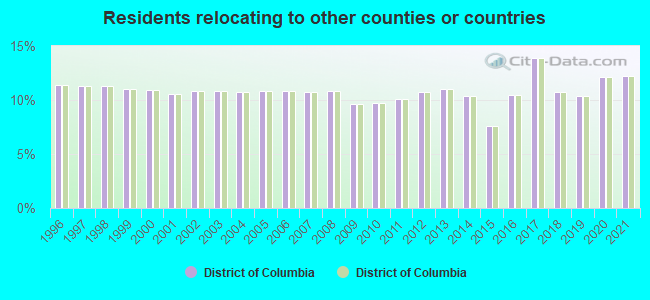
12.26% of this county's 2020 resident taxpayers moved to other counties in 2021 ($117,932 average adjusted gross income)
| Here: | 12.26% |
| District of Columbia average: | 12.26% |
0.11% of residents moved to foreign countries ($1,330 average AGI)
District of Columbia: 0.11% District of Columbia average: 0.11%
10 or fewer of this county's residents relocated to other counties in District of Columbia.
12.14% relocated to other states ($116,601 average AGI)
District of Columbia: 12.14% District of Columbia average: 12.14%
Top counties to which taxpayers relocated from this county between 2020 and 2021:
| to Prince George's County, MD | |
| to Montgomery County, MD | |
| to Arlington County, VA | |
| to Fairfax County, VA | |
| to Alexandria city, VA | |
| to New York County, NY | |
| to Los Angeles County, CA |
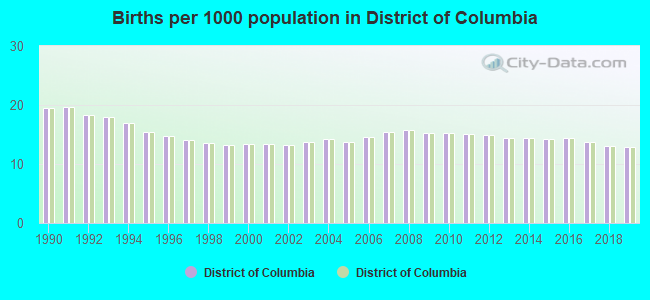
Births per 1000 population from 1990 to 1999: 16.3
Births per 1000 population from 2000 to 2009: 14.3
Births per 1000 population from 2010 to 2022: 11.9
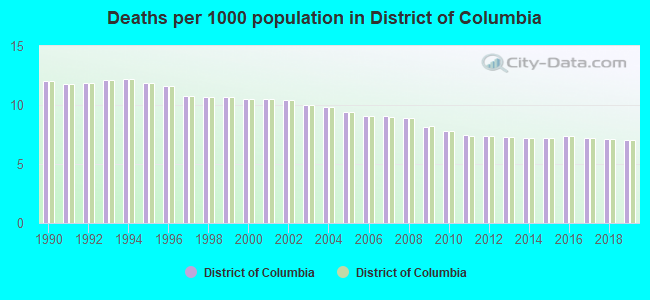
Deaths per 1000 population from 1990 to 1999: 11.6
Deaths per 1000 population from 2000 to 2009: 9.6
Deaths per 1000 population from 2010 to 2020: 7.4
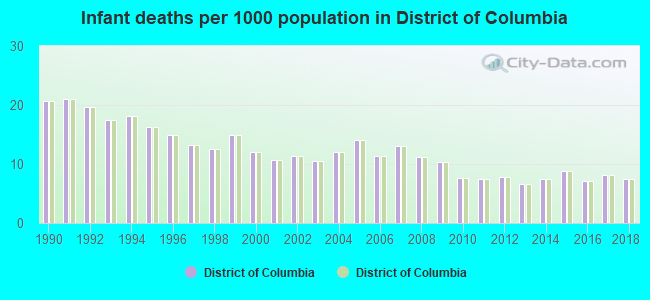
Infant deaths per 1000 live births from 1990 to 1999: 16.9
Infant deaths per 1000 live births from 2000 to 2009: 11.6
Infant deaths per 1000 live births from 2010 to 2021: 7.1
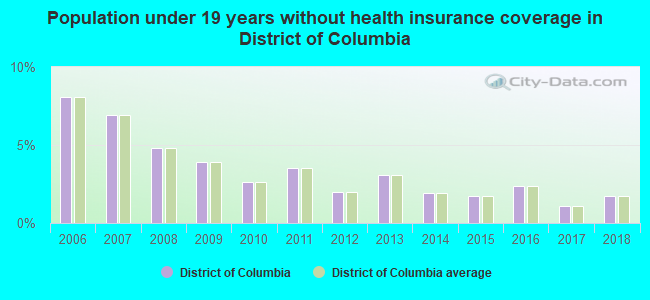
Persons under 19 years old without health insurance coverage in 2018: 1.7%

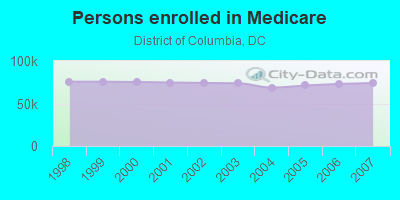
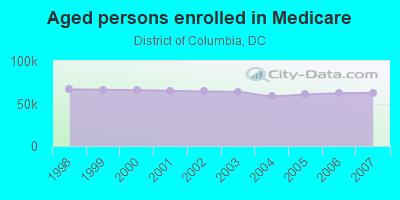
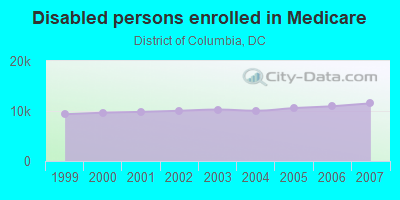
Persons enrolled in hospital insurance and/or supplemental medical insurance (Medicare) in July 1, 2007: 74,112 (62,575 aged, 11,537 disabled)
Children under 18 without health insurance coverage in 2007: 7,637 (6%)
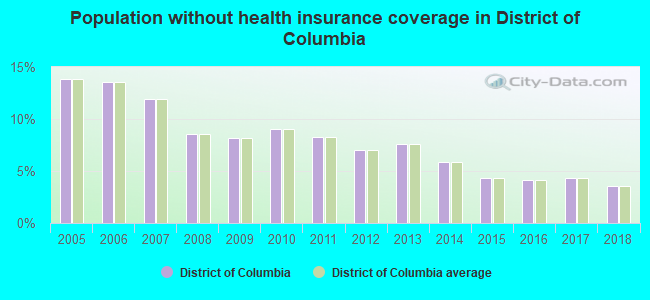
Population without health insurance coverage in 2000: 14%
Children under 18 without health insurance coverage in 2000: 12%
Short term general hospital admissions per 100,000 population in 2004: 25,813
Short term general hospital beds per 100,000 population in 2004: 633
Emergency room visits per 100,000 population in 2004: 62,770
General practice office based MDs per 100,000 population in 2005: 1,456
Medical specialist MDs per 100,000 population in 2005: 1,015
Dentists per 100,000 population in 1998: 31
Total births per 100,000 population, July 2005 - July 2006 : 95
Total deaths per 100,000 population, July 2005 - July 2006: 158
Limited-service eating places per 100,000 population in 2005 : 13
Beer, wine & liquor stores per 100,000 population in 2005: 1
Fitness & recreation sports centers per 100,000 population in 2005: 11,927
EPA green book nonattainment status in 2004-2006: 1
Homicides per 1,000,000 population from 2000 to 2006: 322.7. This is about state average.
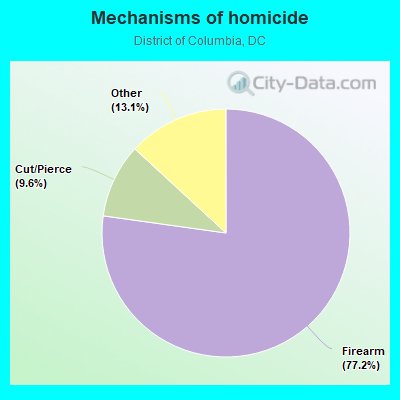
- Firearm - 249.2
- Cut/Pierce - 31.1
- Other - 42.4
Suicides per 1,000,000 population from 2000 to 2006: 55.8. This is about state average.
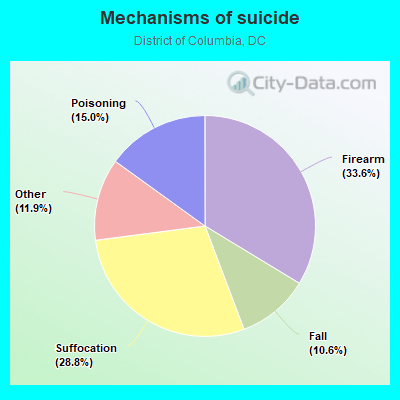
- Firearm - 18.8
- Suffocation - 16.0
- Poisoning - 8.4
- Fall - 5.9
- Other - 6.7
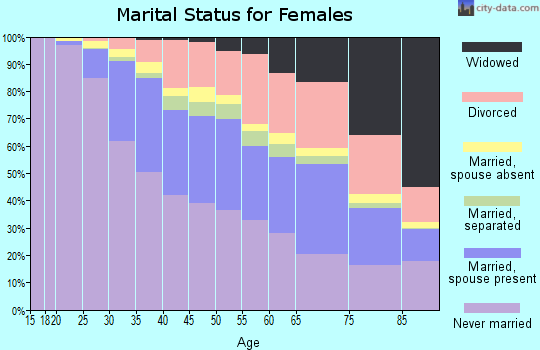
Household type by relationship:
Households: 671,803- Male householders: 146,838 (71,513 living alone), Female householders: 180,132 (87,327 living alone)
77,514 spouses (71,463 opposite-sex spouses), 29,825 unmarried partners, (24,026 opposite-sex unmarried partners), 137,000 children (132,171 natural, 2,667 adopted, 2,162 stepchildren), 17,226 grandchildren, 7,507 brothers or sisters, 3,846 parents, 260 foster children, 6,774 other relatives, 26,906 non-relatives
- In group quarters: 37,975
Size of family households: 62,095 2-persons, 27,149 3-persons, 21,075 4-persons, 8,212 5-persons, 3,455 6-persons, 1,882 7-or-more-persons.
Size of nonfamily households: 158,840 1-person, 37,049 2-persons, 3,972 3-persons, 1,659 4-persons, 1,041 5-persons, 382 6-persons, 159 7-or-more-persons.
60,153 married couples with children.
46,421 single-parent households (4,439 men, 41,982 women).
79.4% of residents of District of Columbia speak English at home.
9.4% of residents speak Spanish at home (75% speak English very well, 13% speak English well, 10% speak English not well, 2% don't speak English at all).
5.1% of residents speak other Indo-European language at home (89% speak English very well, 8% speak English well, 2% speak English not well).
2.4% of residents speak Asian or Pacific Island language at home (74% speak English very well, 20% speak English well, 5% speak English not well, 1% don't speak English at all).
3.6% of residents speak other language at home (55% speak English very well, 28% speak English well, 15% speak English not well, 2% don't speak English at all).
In fiscal year 2004:
Federal Government expenditure: $37,629,655,000 ($67,982 per capita)
Department of Defense expenditure: $5,263,566,000
Federal direct payments to individuals for retirement and disability: $1,882,456,000
Federal other direct payments to individuals: $1,350,541,000
Federal direct payments not to individuals: $1,319,271,000
Federal grants: $4,204,862,000
Federal procurement contracts: $13,346,641,000 ($3,516,694,000 Department of Defense)
Federal salaries and wages: $15,525,884,000 ($1,634,400,000 Department of Defense)
Federal Government direct loans: $266,192,000
Federal guaranteed/insured loans: $1,035,486,000
Federal Government insurance: $141,558,000
Population change from April 1, 2000 to July 1, 2005:
Births: 42,502| Here: | 77 per 1000 residents |
| State: | 77 per 1000 residents |
Deaths: 30,109
| Here: | 55 per 1000 residents |
| State: | 55 per 1000 residents |
Net international migration: +20,618
| Here: | +37 per 1000 residents |
| State: | +37 per 1000 residents |
Net internal migration: -53,550
| Here: | |
| State: |
Total withdrawal of fresh water for public supply: 0.00 millions of gallons per day (all from surface)
| Here: | 5.9 |
| State: | 5.9 |
| Here: | 3.2 |
| State: | 3.2 |
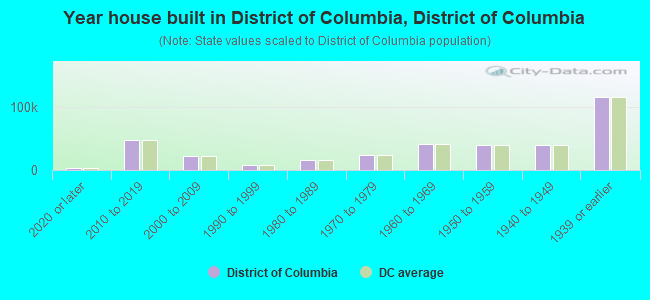
- Year house built in District of Columbia, District of Columbia
- 10,8132020 or later
- 48,2612010 to 2019
- 23,9112000 to 2009
- 12,0321990 to 1999
- 17,8911980 to 1989
- 24,2921970 to 1979
- 34,2731960 to 1969
- 41,5921950 to 1959
- 34,3611940 to 1949
- 113,4361939 or earlier
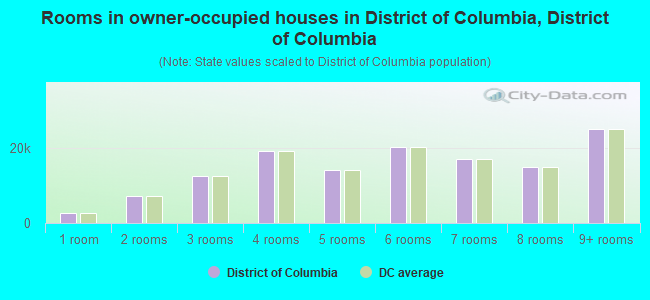
- Rooms in owner-occupied houses in District of Columbia, District of Columbia
- 2,5631 room
- 7,6642 rooms
- 17,0943 rooms
- 17,5874 rooms
- 15,4775 rooms
- 18,6716 rooms
- 15,0607 rooms
- 15,2578 rooms
- 24,7479+ rooms
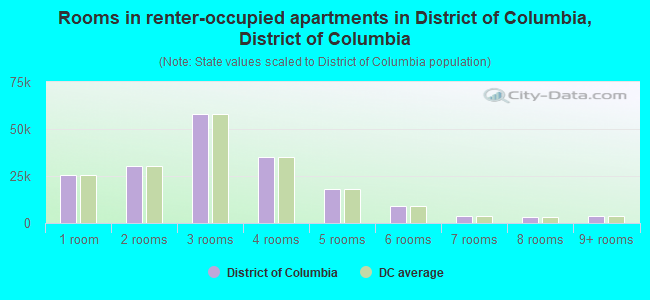
- Rooms in renter-occupied apartments in District of Columbia, District of Columbia
- 23,8521 room
- 31,8272 rooms
- 55,6443 rooms
- 39,0664 rooms
- 20,5445 rooms
- 12,2006 rooms
- 3,4557 rooms
- 2,3078 rooms
- 3,9559+ rooms
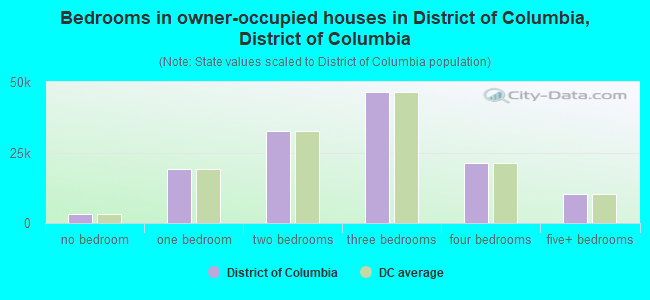
- Bedrooms in owner-occupied houses in District of Columbia, District of Columbia
- 3,212no bedroom
- 20,9291 bedroom
- 36,4182 bedrooms
- 44,1163 bedrooms
- 19,6204 bedrooms
- 9,8255+ bedrooms
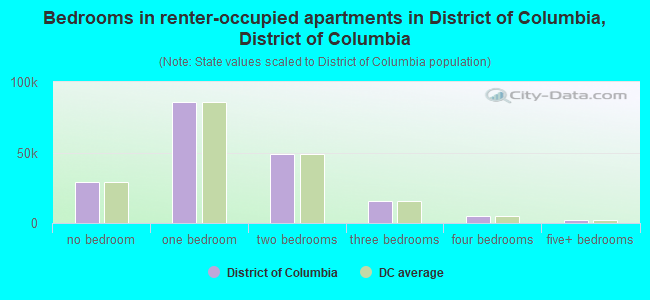
- Bedrooms in renter-occupied apartments in District of Columbia, District of Columbia
- 29,620no bedroom
- 79,2721 bedroom
- 59,8592 bedrooms
- 16,6663 bedrooms
- 5,5714 bedrooms
- 1,8625+ bedrooms
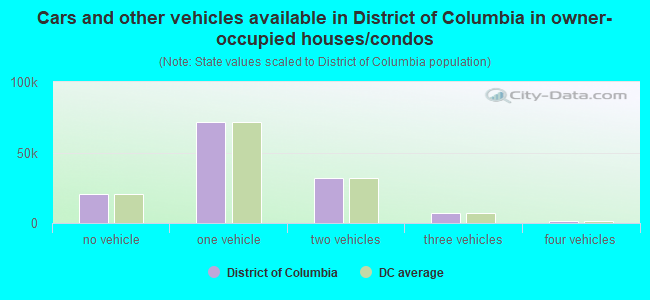
- Cars and other vehicles available in District of Columbia in owner-occupied houses/condos
- 25,381no vehicle
- 72,3361 vehicle
- 31,1992 vehicles
- 3,8663 vehicles
- 9714 vehicles
- 3675+ vehicles
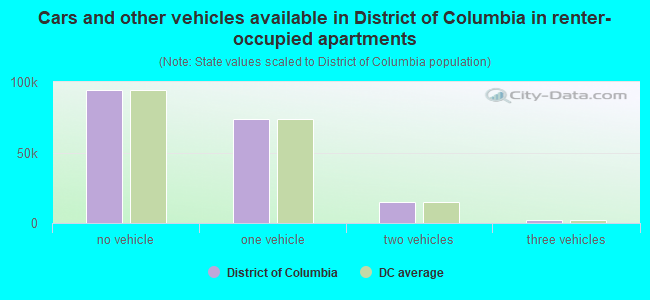
- Cars and other vehicles available in District of Columbia in renter-occupied apartments
- 86,857no vehicle
- 86,4691 vehicle
- 16,1472 vehicles
- 2,7173 vehicles
- 4254 vehicles
- 2355+ vehicles
78.0% of District of Columbia residents lived in the same house 1 years ago.
Out of people who lived in different houses, 34% lived in this county.
Out of people who lived in different counties, 0% lived in District of Columbia.
| District of Columbia: | 78.0% |
| State average: | 78.0% |
Place of birth for U.S.-born residents:
- This state: 227,795
- Other state: 330,290
- Northeast: 96,453
- Midwest: 55,044
- South: 139,433
- West: 39,360
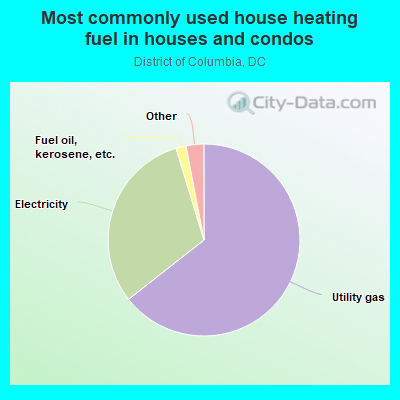
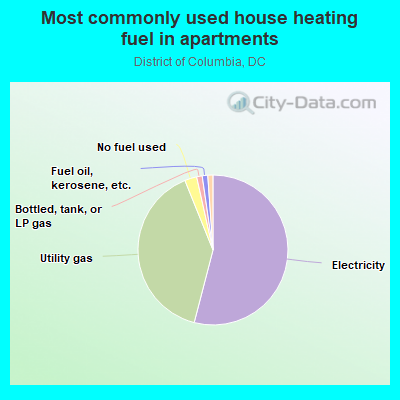
- 61.2%Utility gas
- 34.9%Electricity
- 1.2%Bottled, tank, or LP gas
- 0.8%No fuel used
- 0.7%Other fuel
- 0.7%Fuel oil, kerosene, etc.
- 0.5%Solar energy
- 55.2%Electricity
- 37.9%Utility gas
- 3.6%No fuel used
- 1.4%Bottled, tank, or LP gas
- 0.8%Other fuel
- 0.8%Fuel oil, kerosene, etc.
- 0.2%Solar energy
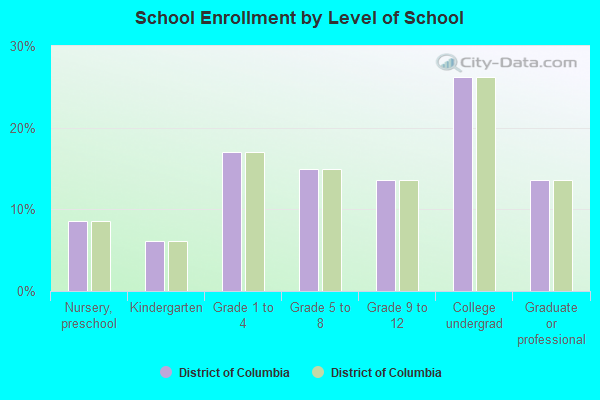
Private vs. public school enrollment:
| Here: | 22.5% |
| District of Columbia: | 22.5% |
| Here: | 21.7% |
| District of Columbia: | 21.7% |
| Here: | 75.9% |
| District of Columbia: | 75.9% |
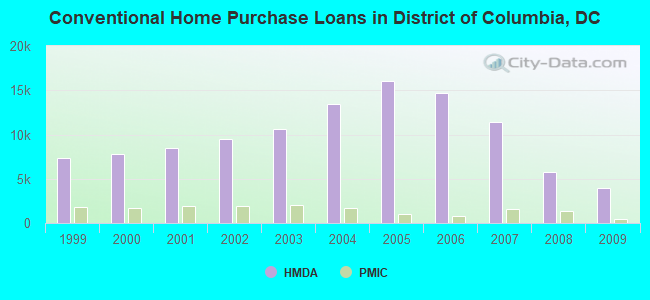
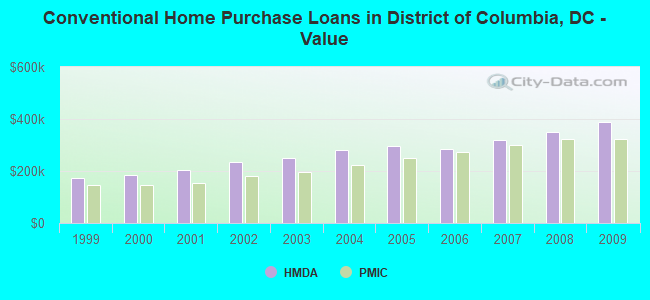
| Home Mortgage Disclosure Act Aggregated Statistics For Year 2009 (Based on 183 full tracts) | ||||||||||||||
| A) FHA, FSA/RHS & VA Home Purchase Loans | B) Conventional Home Purchase Loans | C) Refinancings | D) Home Improvement Loans | E) Loans on Dwellings For 5+ Families | F) Non-occupant Loans on < 5 Family Dwellings (A B C & D) | G) Loans On Manufactured Home Dwelling (A B C & D) | ||||||||
|---|---|---|---|---|---|---|---|---|---|---|---|---|---|---|
| Number | Average Value | Number | Average Value | Number | Average Value | Number | Average Value | Number | Average Value | Number | Average Value | Number | Average Value | |
| LOANS ORIGINATED | 2,532 | $342,539 | 3,968 | $386,623 | 13,002 | $358,016 | 642 | $200,534 | 73 | $6,449,726 | 1,329 | $295,548 | 2 | $176,500 |
| APPLICATIONS APPROVED, NOT ACCEPTED | 117 | $299,393 | 233 | $374,468 | 957 | $325,456 | 87 | $108,207 | 5 | $517,800 | 113 | $280,319 | 1 | $33,000 |
| APPLICATIONS DENIED | 393 | $290,300 | 514 | $352,494 | 4,681 | $335,018 | 455 | $104,237 | 19 | $2,534,105 | 688 | $247,539 | 8 | $148,125 |
| APPLICATIONS WITHDRAWN | 458 | $316,225 | 699 | $366,029 | 3,186 | $351,002 | 139 | $230,381 | 10 | $5,888,100 | 382 | $275,652 | 2 | $370,000 |
| FILES CLOSED FOR INCOMPLETENESS | 48 | $298,854 | 100 | $337,380 | 793 | $314,348 | 29 | $227,172 | 3 | $1,468,000 | 97 | $273,567 | 1 | $165,000 |
| Private Mortgage Insurance Companies Aggregated Statistics For Year 2009 (Based on 148 full tracts) | ||||||||
| A) Conventional Home Purchase Loans | B) Refinancings | C) Non-occupant Loans on < 5 Family Dwellings (A & B) | D) Loans On Manufactured Home Dwelling (A & B) | |||||
|---|---|---|---|---|---|---|---|---|
| Number | Average Value | Number | Average Value | Number | Average Value | Number | Average Value | |
| LOANS ORIGINATED | 482 | $321,743 | 160 | $354,538 | 8 | $268,000 | 0 | $0 |
| APPLICATIONS APPROVED, NOT ACCEPTED | 138 | $347,377 | 77 | $348,766 | 6 | $270,500 | 1 | $368,000 |
| APPLICATIONS DENIED | 101 | $336,713 | 69 | $363,130 | 6 | $255,667 | 0 | $0 |
| APPLICATIONS WITHDRAWN | 33 | $321,455 | 24 | $337,958 | 1 | $227,000 | 0 | $0 |
| FILES CLOSED FOR INCOMPLETENESS | 31 | $363,774 | 6 | $281,667 | 6 | $278,333 | 0 | $0 |
| Most common first names in District of Columbia, DC among deceased individuals | ||
| Name | Count | Lived (average) |
|---|---|---|
| James | 6,071 | 69.9 years |
| Mary | 5,844 | 78.9 years |
| John | 5,394 | 73.0 years |
| William | 5,366 | 72.8 years |
| Robert | 3,080 | 70.1 years |
| Charles | 2,984 | 71.8 years |
| George | 2,845 | 73.4 years |
| Joseph | 2,403 | 72.4 years |
| Helen | 1,830 | 79.5 years |
| Margaret | 1,829 | 78.8 years |
| Most common last names in District of Columbia, DC among deceased individuals | ||
| Last name | Count | Lived (average) |
|---|---|---|
| Johnson | 3,136 | 72.2 years |
| Smith | 2,863 | 72.4 years |
| Williams | 2,657 | 71.8 years |
| Brown | 2,577 | 72.5 years |
| Jones | 2,343 | 71.7 years |
| Jackson | 1,938 | 72.2 years |
| Davis | 1,535 | 72.2 years |
| Thomas | 1,283 | 72.6 years |
| Harris | 1,178 | 72.7 years |
| Robinson | 1,141 | 72.3 years |
| Businesses in District of Columbia, DC | ||||
| Name | Count | Name | Count | |
|---|---|---|---|---|
| 7-Eleven | 22 | Johnny Rockets | 2 | |
| ALDO | 1 | Jones New York | 4 | |
| AT&T | 8 | KFC | 5 | |
| Abercrombie & Fitch | 1 | LA Fitness | 1 | |
| Ace Hardware | 4 | LensCrafters | 1 | |
| Aerosoles | 2 | Levi Strauss & Co. | 1 | |
| Ann Taylor | 7 | Macy's | 1 | |
| Apple Store | 1 | Marriott | 16 | |
| Ashley Furniture | 5 | Marshalls | 1 | |
| AutoZone | 6 | MasterBrand Cabinets | 8 | |
| Baja Fresh Mexican Grill | 2 | McDonald's | 34 | |
| Bally Total Fitness | 1 | Men's Wearhouse | 1 | |
| Banana Republic | 2 | Motel 6 | 2 | |
| Barnes & Noble | 1 | Motherhood Maternity | 1 | |
| Baskin-Robbins | 4 | New Balance | 14 | |
| Bed Bath & Beyond | 2 | Nike | 58 | |
| Ben & Jerry's | 4 | Office Depot | 1 | |
| Best Western | 1 | Panda Express | 2 | |
| Blockbuster | 1 | Panera Bread | 1 | |
| Brooks Brothers | 3 | Papa John's Pizza | 7 | |
| Brookstone | 1 | Payless | 8 | |
| Budget Car Rental | 2 | Penske | 1 | |
| Burger King | 3 | Pier 1 Imports | 1 | |
| CVS | 51 | Pizza Hut | 7 | |
| Caribou Coffee | 6 | Popeyes | 9 | |
| Chick-Fil-A | 2 | Pottery Barn | 1 | |
| Chico's | 1 | Qdoba Mexican Grill | 3 | |
| Chipotle | 7 | Quality | 1 | |
| Cinnabon | 2 | Quiznos | 18 | |
| Circle K | 1 | RadioShack | 13 | |
| Comfort Inn | 2 | Rite Aid | 7 | |
| Crate & Barrel | 1 | Ruby Tuesday | 3 | |
| Cricket Wireless | 20 | SAS Shoes | 1 | |
| Curves | 1 | Safeway | 15 | |
| DHL | 11 | Saks Fifth Avenue | 1 | |
| Days Inn | 2 | Sears | 1 | |
| Dennys | 1 | Sephora | 1 | |
| Domino's Pizza | 7 | Sprint Nextel | 5 | |
| DressBarn | 3 | Staples | 3 | |
| Dressbarn | 2 | Starbucks | 75 | |
| Dunkin Donuts | 7 | Subway | 61 | |
| Express | 2 | T-Mobile | 1 | |
| FedEx | 295 | T.G.I. Driday's | 2 | |
| Firestone Complete Auto Care | 1 | T.J.Maxx | 1 | |
| Foot Locker | 4 | Taco Bell | 3 | |
| Forever 21 | 1 | Target | 1 | |
| GNC | 7 | The Cheesecake Factory | 1 | |
| GameStop | 3 | Trader Joe's | 1 | |
| Gap | 3 | True Value | 5 | |
| Giant | 5 | U-Haul | 5 | |
| Goodwill | 4 | UPS | 184 | |
| H&M | 2 | Urban Outfitters | 2 | |
| H&R Block | 17 | Vans | 2 | |
| Haagen-Dazs | 2 | Verizon Wireless | 5 | |
| Haworth | 2 | Victoria's Secret | 3 | |
| Hilton | 5 | Volkswagen | 1 | |
| Holiday Inn | 6 | Vons | 15 | |
| Home Depot | 1 | Walgreens | 2 | |
| Howard Johnson | 1 | Wendy's | 4 | |
| IHOP | 2 | Westin | 2 | |
| J.Crew | 2 | Wet Seal | 1 | |
| Jimmy John's | 10 | Whole Foods Market | 3 | |
| JoS. A. Bank | 5 | YMCA | 3 | |
District of Columbia on our top lists:
- #1 on the list of "Top 101 counties with the highest Nitrogen Dioxide air pollution readings in 2012 (ppm)"
- #2 on the list of "Top 101 counties with highest percentage of residents voting for Obama (Democrat) in the 2012 Presidential Election (pop. 50,000+)"
- #3 on the list of "Top 101 counties with the largest increase in the number of births per 1000 residents 2000-2006 to 2007-2013 (pop 50,000+)"
- #3 on the list of "Top 101 counties with highest percentage of residents voting for Obama (Democrat) in the 2012 Presidential Election"
- #4 on the list of "Top 101 counties with the lowest percentage of residents that keep firearms around their homes"
- #4 on the list of "Top 101 counties with the largest decrease in the number of deaths per 1000 residents 2000-2006 to 2007-2013 (pop. 50,000+)"
- #8 on the list of "Top 101 counties with the highest carbon monoxide air pollution readings in 2012 (ppm)"
- #11 on the list of "Top 101 counties with the most Black Protestant congregations"
- #11 on the list of "Top 101 counties with the most Black Protestant congregations (pop. 50,000+)"
- #12 on the list of "Top 101 counties with the most Orthodox adherents (pop. 50,000+)"
- #12 on the list of "Top 101 counties with the most Orthodox adherents"
- #13 on the list of "Top 101 counties with the most Black Protestant adherents (pop. 50,000+)"
- #13 on the list of "Top 101 counties with the most Black Protestant adherents"
- #13 on the list of "Top 101 counties with the highest number of infant deaths per 1000 residents 2007-2013 (pop. 50,000+)"
- #20 on the list of "Top 101 counties with the best general health status score of residents (1-5), 3 years of data"
- #27 on the list of "Top 101 counties with the most Mainline Protestant adherents"
- #27 on the list of "Top 101 counties with the most Mainline Protestant adherents (pop. 50,000+)"
- #31 on the list of "Top 101 counties with the highest percentage of residents relocating from other counties between 2010 and 2011 (pop. 50,000+)"
- #33 on the list of "Top 101 counties with the most Mainline Protestant congregations"
- #33 on the list of "Top 101 counties with the most Mainline Protestant congregations (pop. 50,000+)"