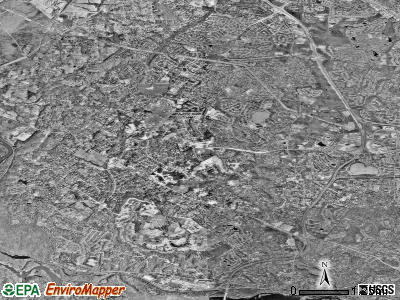
Potomac, Maryland

Potomac: Potomac

Potomac: Swains Lock, Potomac, Maruyland

Potomac: Aquaduct on the Potomac River

Potomac: Fall Foliage in Great Falls

Potomac

Potomac: The river

Potomac: kayaks on the Potomac River

Potomac: Cherry Blossoms
- add
your
Submit your own pictures of this place and show them to the world
- OSM Map
- General Map
- Google Map
- MSN Map

Population change since 2000: +0.3%
| Males: 21,773 | |
| Females: 23,192 |
| Median resident age: | 48.0 years |
| Maryland median age: | 39.7 years |
Zip codes: 20854.
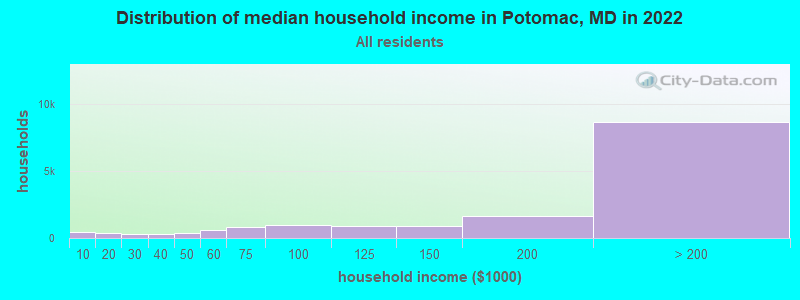
| Potomac: | over $200,000 |
| MD: | $94,991 |
Estimated per capita income in 2022: $99,976 (it was $64,875 in 2000)
Potomac CDP income, earnings, and wages data
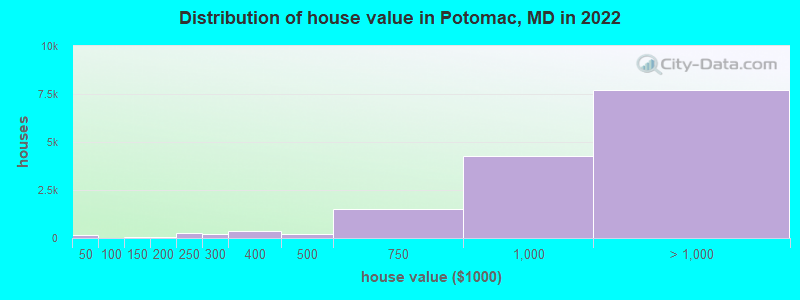
Estimated median house or condo value in 2022: over $1,000,000 (it was $439,200 in 2000)
| Potomac: | over $1,000,000 |
| MD: | $398,100 |
Mean prices in 2022: all housing units: over $1,000,000; detached houses: over $1,000,000; townhouses or other attached units: $944,075; in 5-or-more-unit structures: $436,433
Median gross rent in 2022: $2,445.
(2.6% for White Non-Hispanic residents, 13.5% for Black residents, 2.2% for Hispanic or Latino residents, 16.1% for other race residents, 5.1% for two or more races residents)
Detailed information about poverty and poor residents in Potomac, MD


Compare current foreclosures near Potomac, MD:
| Photo | Address | Area | Beds / Baths | Price | Details |
|---|---|---|---|---|---|

|
#1
Tribunal Ln
Potomac, MD 20854
|
11,869 sq. feet
|
7 baths - beds |
show details | |

|
#2
Tuckerman Ln
Potomac, MD 20854
|
3,358 sq. feet
|
2 baths - beds |
show details | |

|
#3
Wilkesboro Ln
Potomac, MD 20854
|
2,456 sq. feet
|
2 baths - beds |
show details | |

|
#4
Copenhaver Dr
Potomac, MD 20854
|
3,886 sq. feet
|
3 baths - beds |
show details | |

|
#5
Smoketree Rd
Potomac, MD 20854
|
2,311 sq. feet
|
2 baths - beds |
show details | |

|
#6
Inglewood Dr
Potomac, MD 20854
|
9,760 sq. feet
|
8 baths - beds |
show details | |

|
#7
Piney Meetinghouse Ct
Potomac, MD 20854
|
9,254 sq. feet
|
5 baths - beds |
show details | |

|
#8
Falls Rd
Potomac, MD 20854
|
2,363 sq. feet
|
3 baths - beds |
show details | |

|
#9
River Rd Unit 60694
Potomac, MD 20859
|
- sq. feet
|
- baths - beds |
show details | |

|
#10
Bentridge Pl
Potomac, MD 20854
|
- sq. feet
|
- baths - beds |
show details |
| Photo | Address | Area | Beds / Baths | Price | Details |
|---|---|---|---|---|---|

|
#11
Seven Locks Rd Ste 360
Potomac, MD 20854
|
- sq. feet
|
- baths - beds |
show details | |

|
#12
Scotland Dr
Potomac, MD 20854
|
- sq. feet
|
- baths - beds |
show details | |

|
#13
Picasso Ln
Potomac, MD 20854
|
- sq. feet
|
- baths - beds |
show details | |

|
#14
Pooks Hill Rd Apt 1612s
Bethesda, MD 20814
|
1,250 sq. feet
|
1 baths 2 beds |
$289,000
|
show details |

|
#15
19th St NW
Washington, DC 20036
|
2,515 sq. feet
|
6 baths 8 beds |
$1,684,800
|
show details |

|
#16
Brooke Knolls Rd
Gaithersburg, MD 20882
|
1,704 sq. feet
|
3 baths 4 beds |
$681,500
|
show details |

|
#17
Addison Rd
Capitol Heights, MD 20743
|
1,400 sq. feet
|
1 baths 3 beds |
$260,000
|
show details |

|
#18
17th St NW Apt 504
Washington, DC 20009
|
800 sq. feet
|
1 baths 1 beds |
$419,900
|
show details |

|
#19
Interlachen Dr Apt 111
Silver Spring, MD 20906
|
965 sq. feet
|
1 baths 2 beds |
$148,000
|
show details |

|
#20
Hammersmith Cir
Silver Spring, MD 20906
|
1,152 sq. feet
|
1 baths 3 beds |
$353,600
|
show details |
| Photo | Address | Area | Beds / Baths | Price | Details |
|---|---|---|---|---|---|

|
#21
Cathedral Ave NW Apt 108
Washington, DC 20016
|
765 sq. feet
|
1 baths 1 beds |
$279,900
|
show details |

|
#22
Eastern Ave NE
Washington, DC 20011
|
1,024 sq. feet
|
1 baths 3 beds |
$395,000
|
show details |

|
#23
River Rd
Potomac, MD 20854
|
- sq. feet
|
- baths - beds |
show details | |

|
#24
Delaware Ave SW Apt N720
Washington, DC 20024
|
- sq. feet
|
1 baths 1 beds |
$155,000
|
show details |

|
#25
T St SE Apt 3
Washington, DC 20020
|
- sq. feet
|
2 baths 4 beds |
$339,900
|
show details |

|
#26
4th St NE Apt 2
Washington, DC 20002
|
1,061 sq. feet
|
2 baths 2 beds |
show details | |

|
#27
Caledonia Ct Apt K
Germantown, MD 20874
|
1,087 sq. feet
|
2 baths 2 beds |
show details | |

|
#28
Pearl Fog Way
Dunn Loring, VA 22027
|
3,356 sq. feet
|
4 baths 4 beds |
show details | |

|
#29
Dubois Pl SE
Washington, DC 20019
|
1,024 sq. feet
|
2 baths 3 beds |
show details | |

|
#30
S George Mason Dr Unit 918n
Falls Church, VA 22041
|
752 sq. feet
|
1 baths 1 beds |
show details |
| Photo | Address | Area | Beds / Baths | Price | Details |
|---|---|---|---|---|---|

|
#31
Cove Ledge Ct
Montgomery Village, MD 20886
|
- sq. feet
|
3 baths 4 beds |
show details | |

|
#32
T Pl SE
Washington, DC 20020
|
900 sq. feet
|
2 baths 2 beds |
show details | |

|
#33
Schwenger Pl
Herndon, VA 20170
|
1,530 sq. feet
|
2 baths 3 beds |
show details | |

|
#34
Floral Dr
Hyattsville, MD 20783
|
1,178 sq. feet
|
3 baths 5 beds |
show details | |

|
#35
Ridgeline Dr
Montgomery Village, MD 20886
|
1,794 sq. feet
|
2 baths 3 beds |
show details | |

|
#36
Prosperity Ave
Fairfax, VA 22031
|
2,090 sq. feet
|
3 baths 4 beds |
show details | |

|
#37
Brassie Pl Apt 201
Montgomery Village, MD 20886
|
1,050 sq. feet
|
2 baths 2 beds |
show details | |

|
#38
N Glebe Rd Apt 2001
Arlington, VA 22203
|
898 sq. feet
|
1 baths 1 beds |
show details | |

|
#39
Ridge Rd SE
Washington, DC 20019
|
720 sq. feet
|
2 baths 1 beds |
show details | |

|
#40
Canfield Ter
Sterling, VA 20164
|
1,680 sq. feet
|
3 baths 3 beds |
show details |
| Photo | Address | Area | Beds / Baths | Price | Details |
|---|---|---|---|---|---|

|
#41
Scott Ave
Rockville, MD 20851
|
1,188 sq. feet
|
1 baths 3 beds |
show details | |

|
#42
Clovermeadow Dr
Vienna, VA 22182
|
3,767 sq. feet
|
4 baths 6 beds |
show details | |

|
#43
Deanwood Dr
Capitol Heights, MD 20743
|
640 sq. feet
|
1 baths 1 beds |
show details | |

|
#44
Aquarius Ave
Silver Spring, MD 20906
|
1,407 sq. feet
|
2 baths 4 beds |
show details | |

|
#45
16th St S Apt 696
Arlington, VA 22204
|
1,008 sq. feet
|
1 baths 2 beds |
show details | |

|
#46
Lees Corner Rd
Chantilly, VA 20151
|
1,216 sq. feet
|
1 baths 3 beds |
show details | |

|
#47
Glen Eagles Dr
Silver Spring, MD 20906
|
3,328 sq. feet
|
3 baths 4 beds |
show details | |

|
#48
1918 M Street NE
Washington, DC 20002
|
5,487 sq. feet
|
12 baths 18 beds |
show details | |

|
#49
Peppertree Ln
Silver Spring, MD 20906
|
1,309 sq. feet
|
2 baths 3 beds |
show details | |

|
Check over 1 million property listings on Foreclosure.com!
|
browse all offers | |||


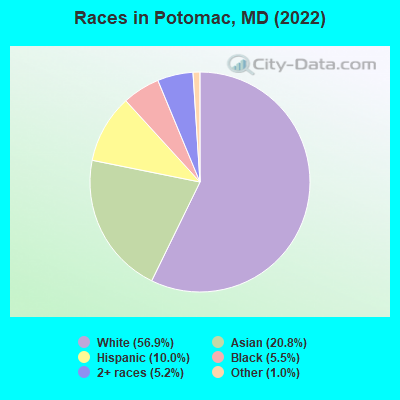
- 26,35656.9%White alone
- 9,60920.8%Asian alone
- 4,61210.0%Hispanic
- 2,5495.5%Black alone
- 2,3945.2%Two or more races
- 4781.0%Other race alone
- 120.03%Native Hawaiian and Other
Pacific Islander alone
Races in Potomac detailed stats: ancestries, foreign born residents, place of birth
According to our research of Maryland and other state lists, there were 7 registered sex offenders living in Potomac, Maryland as of April 27, 2024.
The ratio of all residents to sex offenders in Potomac is 6,666 to 1.
The ratio of registered sex offenders to all residents in this city is much lower than the state average.
 Recent articles from our blog. Our writers, many of them Ph.D. graduates or candidates, create easy-to-read articles on a wide variety of topics.

 | Asians in North Potomac/Rockville (21 replies) |
| Potomac MD to Capitol Hill Commute Time (3 replies) |
| TPC Potomac Membership (1 reply) |
| Washington post article highlights Lake Arbor in PG County (53 replies) |
| King Farm or Potomac? (4 replies) |
| Relocating to the Potomac area (5 replies) |
Latest news from Potomac, MD collected exclusively by city-data.com from local newspapers, TV, and radio stations
Potomac, MD City Guides:
Ancestries: American (5.9%), German (4.8%), Iranian (4.7%), Irish (3.9%), Russian (3.3%), European (3.2%).
Current Local Time: EST time zone
Land area: 25.2 square miles.
Population density: 1,786 people per square mile (low).
14,107 residents are foreign born (17.1% Asia, 5.1% Europe, 4.6% Latin America).
| This place: | 30.5% |
| Maryland: | 15.7% |
Median real estate property taxes paid for housing units with mortgages in 2022: $9,218 (0.9%)
Median real estate property taxes paid for housing units with no mortgage in 2022: $10,419 (0.9%)
Nearest city with pop. 50,000+: Bethesda, MD  (4.7 miles , pop. 55,277).
Nearest city with pop. 200,000+: Washington, DC (12.0 miles , pop. 572,059).
Nearest city with pop. 1,000,000+: Philadelphia, PA (128.1 miles , pop. 1,517,550).
Nearest cities:
), ), ), ), ), Latitude: 39.02 N, Longitude: 77.19 W
Daytime population change due to commuting: -2,515 (-5.4%)
Workers who live and work in this place: 9,473 (43.3%)
Property values in Potomac, MD
| Here: | 1.8% |
| Maryland: | 2.0% |
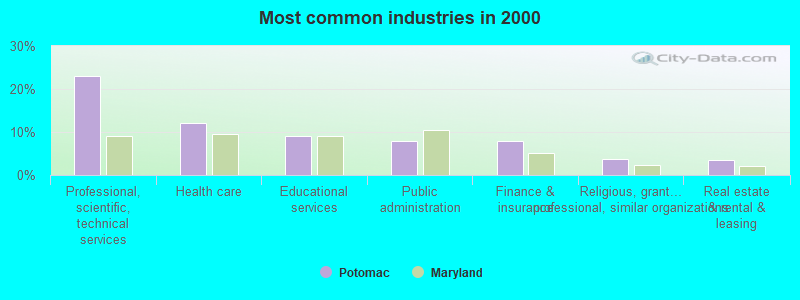
- Professional, scientific, technical services (23.0%)
- Health care (12.0%)
- Educational services (9.0%)
- Public administration (7.8%)
- Finance & insurance (7.8%)
- Religious, grantmaking, civic, professional, similar organizations (3.6%)
- Real estate & rental & leasing (3.6%)
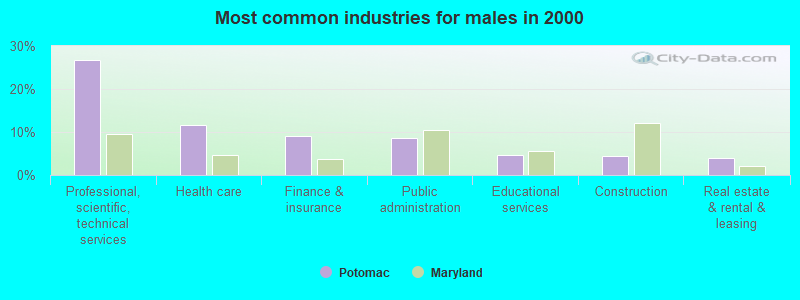
- Professional, scientific, technical services (26.8%)
- Health care (11.7%)
- Finance & insurance (9.0%)
- Public administration (8.7%)
- Educational services (4.6%)
- Construction (4.4%)
- Real estate & rental & leasing (4.0%)
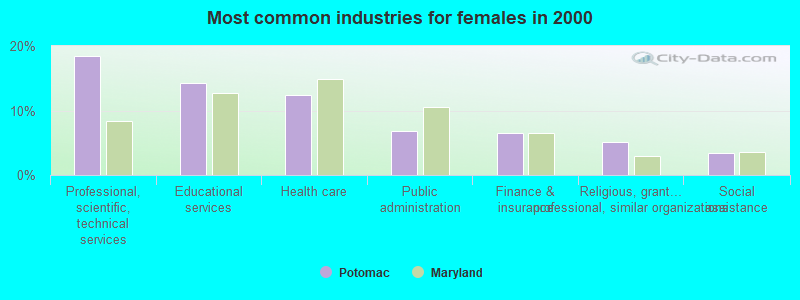
- Professional, scientific, technical services (18.5%)
- Educational services (14.3%)
- Health care (12.4%)
- Public administration (6.8%)
- Finance & insurance (6.5%)
- Religious, grantmaking, civic, professional, similar organizations (5.1%)
- Social assistance (3.5%)
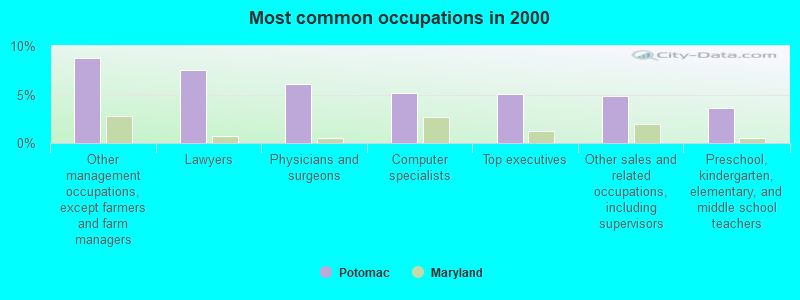
- Other management occupations, except farmers and farm managers (8.8%)
- Lawyers (7.6%)
- Physicians and surgeons (6.1%)
- Computer specialists (5.2%)
- Top executives (5.1%)
- Other sales and related occupations, including supervisors (4.9%)
- Preschool, kindergarten, elementary, and middle school teachers (3.6%)
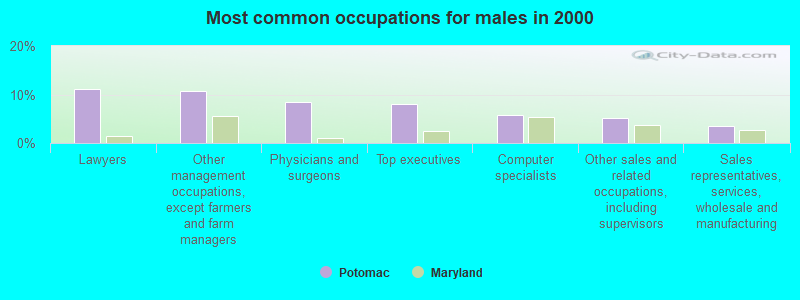
- Lawyers (11.2%)
- Other management occupations, except farmers and farm managers (10.7%)
- Physicians and surgeons (8.4%)
- Top executives (8.1%)
- Computer specialists (5.8%)
- Other sales and related occupations, including supervisors (5.1%)
- Sales representatives, services, wholesale and manufacturing (3.6%)
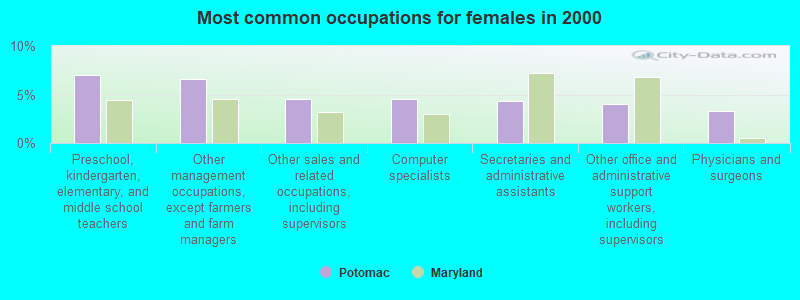
- Preschool, kindergarten, elementary, and middle school teachers (7.0%)
- Other management occupations, except farmers and farm managers (6.5%)
- Other sales and related occupations, including supervisors (4.5%)
- Computer specialists (4.5%)
- Secretaries and administrative assistants (4.4%)
- Other office and administrative support workers, including supervisors (4.0%)
- Physicians and surgeons (3.3%)
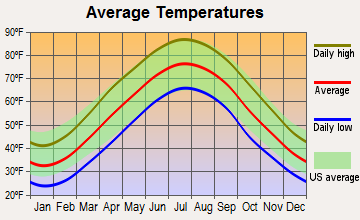
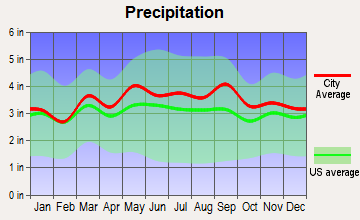
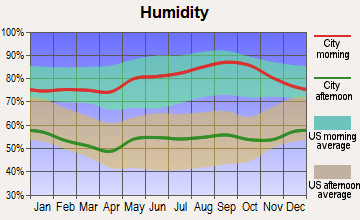
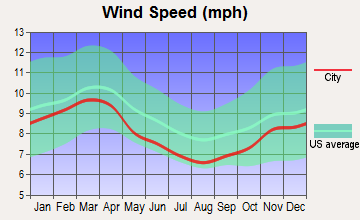
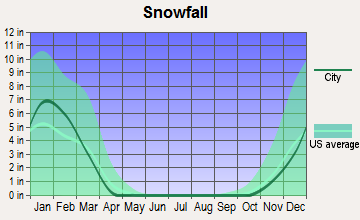
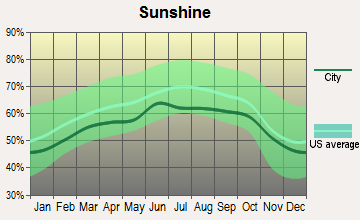
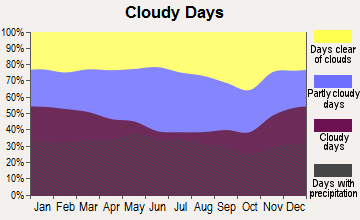
Average climate in Potomac, Maryland
Based on data reported by over 4,000 weather stations
|
|

(lower is better)
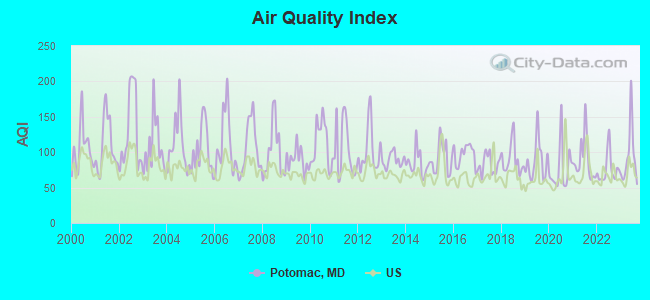
Air Quality Index (AQI) level in 2023 was 93.7. This is worse than average.
| City: | 93.7 |
| U.S.: | 72.6 |
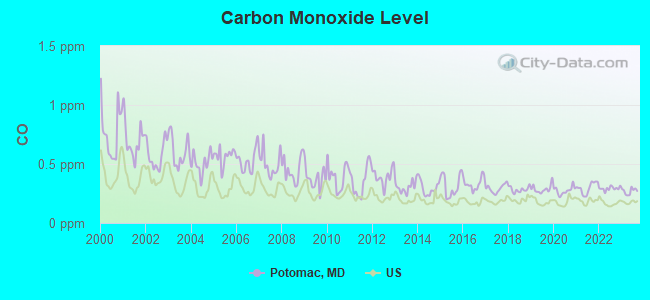
Carbon Monoxide (CO) [ppm] level in 2023 was 0.269. This is about average. Closest monitor was 4.8 miles away from the city center.
| City: | 0.269 |
| U.S.: | 0.251 |
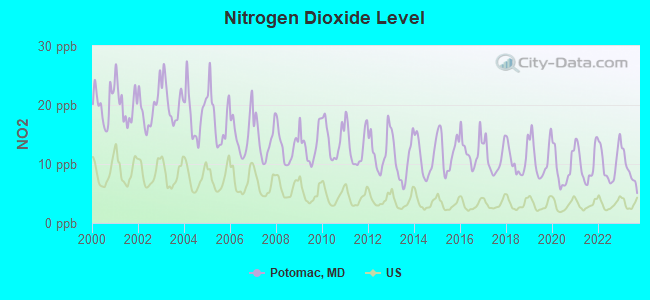
Nitrogen Dioxide (NO2) [ppb] level in 2023 was 8.91. This is significantly worse than average. Closest monitor was 4.5 miles away from the city center.
| City: | 8.91 |
| U.S.: | 5.11 |
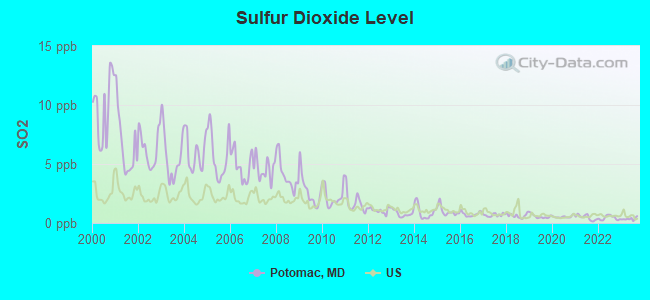
Sulfur Dioxide (SO2) [ppb] level in 2023 was 0.355. This is significantly better than average. Closest monitor was 4.5 miles away from the city center.
| City: | 0.355 |
| U.S.: | 1.515 |
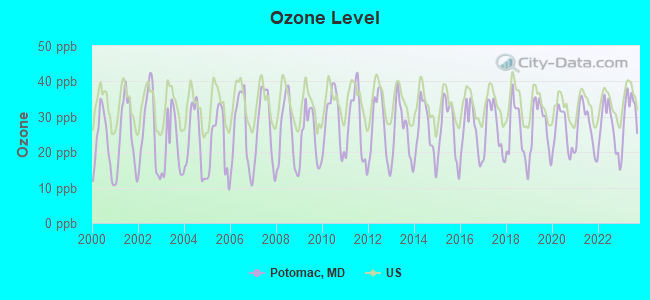
Ozone [ppb] level in 2023 was 31.2. This is about average. Closest monitor was 4.8 miles away from the city center.
| City: | 31.2 |
| U.S.: | 33.3 |
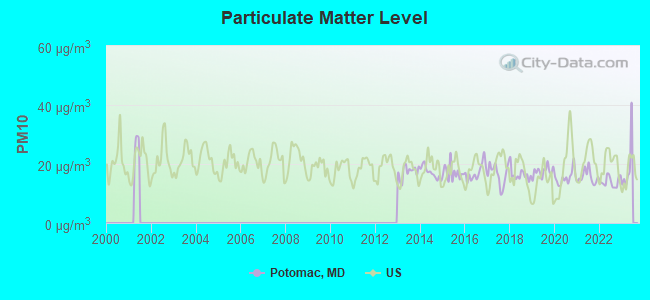
Particulate Matter (PM10) [µg/m3] level in 2022 was 14.0. This is better than average. Closest monitor was 4.3 miles away from the city center.
| City: | 14.0 |
| U.S.: | 19.2 |
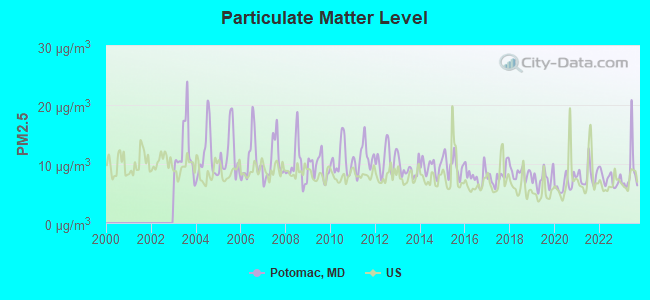
Particulate Matter (PM2.5) [µg/m3] level in 2023 was 8.71. This is about average. Closest monitor was 6.3 miles away from the city center.
| City: | 8.71 |
| U.S.: | 8.11 |
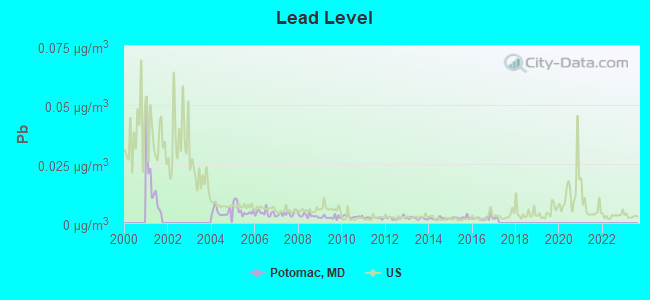
Lead (Pb) [µg/m3] level in 2016 was 0.00212. This is significantly better than average. Closest monitor was 4.5 miles away from the city center.
| City: | 0.00212 |
| U.S.: | 0.00931 |
Tornado activity:
Potomac-area historical tornado activity is slightly above Maryland state average. It is 11% greater than the overall U.S. average.
On 9/5/1979, a category F3 (max. wind speeds 158-206 mph) tornado 4.8 miles away from the Potomac place center killed one person and injured 6 people and caused between $500,000 and $5,000,000 in damages.
On 4/28/2002, a category F4 (max. wind speeds 207-260 mph) tornado 32.7 miles away from the place center killed 3 people and injured 122 people and caused $124 million in damages.
Earthquake activity:
Potomac-area historical earthquake activity is significantly above Maryland state average. It is 56% smaller than the overall U.S. average.On 8/23/2011 at 17:51:04, a magnitude 5.8 (5.8 MW, Depth: 3.7 mi, Class: Moderate, Intensity: VI - VII) earthquake occurred 87.0 miles away from Potomac center
On 8/25/2011 at 05:07:52, a magnitude 4.5 (4.5 ML, Depth: 4.2 mi, Class: Light, Intensity: IV - V) earthquake occurred 85.6 miles away from Potomac center
On 1/16/1994 at 01:49:16, a magnitude 4.6 (4.6 MB, 4.6 LG, Depth: 3.1 mi) earthquake occurred 109.2 miles away from Potomac center
On 12/9/2003 at 20:59:18, a magnitude 4.5 (4.5 ML, Depth: 6.2 mi) earthquake occurred 99.6 miles away from Potomac center
On 9/25/1998 at 19:52:52, a magnitude 5.2 (4.8 MB, 4.3 MS, 5.2 LG, 4.5 MW, Depth: 3.1 mi) earthquake occurred 240.5 miles away from Potomac center
On 12/9/2003 at 20:59:14, a magnitude 4.5 (4.5 MB, 4.5 LG) earthquake occurred 106.6 miles away from the city center
Magnitude types: regional Lg-wave magnitude (LG), body-wave magnitude (MB), local magnitude (ML), surface-wave magnitude (MS), moment magnitude (MW)
Natural disasters:
The number of natural disasters in Montgomery County (19) is greater than the US average (15).Major Disasters (Presidential) Declared: 14
Emergencies Declared: 5
Causes of natural disasters: Hurricanes: 5, Winter Storms: 5, Snowstorms: 4, Storms: 4, Floods: 3, Winds: 2, Blizzard: 1, Heavy Rain: 1, Snowfall: 1, Tornado: 1, Tropical Storm: 1, Other: 1 (Note: some incidents may be assigned to more than one category).

Hospitals and medical centers in Potomac:
Other hospitals and medical centers near Potomac:
- PROFESSIONAL HEALTHCARE RESOURCES OF MARYLAND (Home Health Center, about 3 miles away; BETHESDA, MD)
- MANORCARE HEALTH SERVICES - BETHESDA (Nursing Home, about 3 miles away; BETHESDA, MD)
- BMA - BETHESDA (Dialysis Facility, about 3 miles away; BETHESDA, MD)
- MAPLEWOOD PARK PLACE (Nursing Home, about 4 miles away; BETHESDA, MD)
- BRIGHTON GARDEN TUCKERMAN LANE (Nursing Home, about 4 miles away; NORTH BETHESDA, MD)
- POTOMAC VALLEY NSG AND WELLNESS (Nursing Home, about 4 miles away; ROCKVILLE, MD)
- BETHESDA HEALTH AND REHABILITATION (Nursing Home, about 4 miles away; BETHESDA, MD)
Amtrak stations near Potomac:
- 5 miles: ROCKVILLE (HUNGERFORD DR. & PARK ST.) . Services: partially wheelchair accessible, public payphones, paid short-term parking, paid long-term parking, call for taxi service, public transit connection.
- 13 miles: WASHINGTON (50 MASSACHUSETTS AVE. N.E.) . Services: ticket office, fully wheelchair accessible, enclosed waiting area, public restrooms, public payphones, full-service food facilities and snack bar, ATM, paid short-term parking, paid long-term parking, car rental agency, taxi stand, public transit connection.
- 15 miles: DULLES INTERNATIONAL AP'T (HERNDON, DULLES INTERNATIONAL AIRPORT) - Bus Station . Services: enclosed waiting area, public restrooms, public payphones, full-service food facilities, paid short-term parking, paid long-term parking, car rental agency, taxi stand, public transit connection.
Colleges/universities with over 2000 students nearest to Potomac:
- Montgomery College (about 6 miles; Rockville, MD; Full-time enrollment: 17,999)
- American University (about 8 miles; Washington, DC; FT enrollment: 9,850)
- University of the District of Columbia (about 9 miles; Washington, DC; FT enrollment: 3,675)
- Marymount University (about 9 miles; Arlington, VA; FT enrollment: 3,361)
- Georgetown University (about 10 miles; Washington, DC; FT enrollment: 12,535)
- Medtech Institute (about 11 miles; Falls Church, VA; FT enrollment: 2,900)
- Strayer University-Virginia (about 11 miles; Arlington, VA; FT enrollment: 7,005)
Public high school in Potomac:
- WINSTON CHURCHILL HIGH (Location: 11300 GAINSBOROUGH RD, Grades: 9-12)
Private high schools in Potomac:
- THE BULLIS SCHOOL (Students: 649, Location: 10601 FALLS RD, Grades: 3-12)
- GERMAN SCHOOL WASHINGTON DC (Students: 566, Location: 8617 CHATEAU DR, Grades: PK-12)
- ST ANDREW'S EPISCOPAL SCHOOL (Students: 550, Location: 8804 POSTOAK RD, Grades: PK-12)
- THE HEIGHTS SCHOOL (Students: 465, Location: 10400 SEVEN LOCKS RD, Grades: 3-12, Boys only)
- MC LEAN SCHOOL OF MARYLAND (Students: 374, Location: 8224 LOCHINVER LN, Grades: KG-12)
- CONNELLY SCHOOL OF THE HOLY CHILD (Students: 305, Location: 9029 BRADLEY BLVD, Grades: 6-12, Girls only)
- MUSLIM COMMUNITY SCHOOL (Students: 111, Location: 7917 MONTROSE RD, Grades: PK-12)
Public elementary/middle schools in Potomac:
- BELLS MILL ELEMENTARY (Location: 8225 BELLS MILL RD, Grades: PK-5)
- COLD SPRING ELEMENTARY (Location: 9201 FALLS CHAPEL WAY, Grades: KG-5)
- HERBERT HOOVER MIDDLE (Location: 8810 POST OAK RD, Grades: 6-8)
- POTOMAC ELEMENTARY (Location: 10311 RIVER RD, Grades: PK-5)
- WAYSIDE ELEMENTARY (Location: 10011 GLEN RD, Grades: PK-5)
- CABIN JOHN MIDDLE SCHOOL (Location: 10701 GAINSBOROUGH ROAD, Grades: 6-8)
Private elementary/middle schools in Potomac:
- OUR LADY OF MERCY SCHOOL (Students: 276, Location: 9222 KENTSDALE DR, Grades: KG-8)
- THE MANOR MONTESSORI SCHOOL (Students: 117, Location: 10500 OAKLYN DR, Grades: PK-3)
- THE FOURTH PRESBYTERIAN SCHOOL (Students: 104, Location: 10701 S GLEN RD, Grades: PK-8)
- THE DIENER SCHOOL (Students: 41, Location: 11510 FALLS RD, Grades: KG-5)
User-submitted facts and corrections:
- there is also herbert hoover middle school
Points of interest:
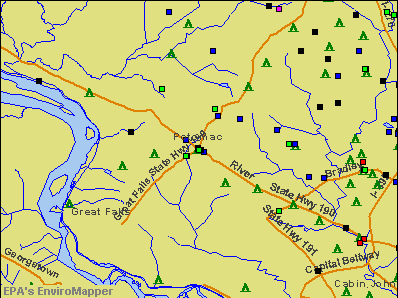
Notable locations in Potomac: Bethesda Country Club (A), Congressional Country Club (B), TPC at Avenel Golf Course (C), Falls Road Golf Course (D), Fortune Parc Industrial Park (E), Rock Spring Industrial Park (F), United States Postal Training Facility (G), Rockville Water Plant (H), Cabin John Park Volunteer Fire Department Station 10 (I), Heights Playhouse (J), Cabin John Park Volunteer Fire Department Station 30 (K), Rockville Volunteer Fire Department Station 33 (L), Potomac Park Community Center (M), State Police Station (N), Potomac Library (O), Arden Courts Assisted Living Center (P), Great Falls Tavern Visitor Center (Q), Navel Ship Research and Development Fire Department (R). Display/hide their locations on the map
Shopping Centers: Potomac Village Shopping Center (1), Potomac Place Shopping Center (2), Montgomery Mall Shopping Center (3). Display/hide their locations on the map
Churches in Potomac include: Congregation Har Shalom Synagogue (A), Beth Sholom Congregational and Talmud Torah Synagogue (B), Congressional Heights Baptist Church (C), Geneva United Presbyterian Church (D), Latter Day Saints Church (E), Potomac United Presbyterian Church (F), Saint James Episcopal Church (G), Washington Hebrew Congreational Julia Bindman Center (H), Our Lady of Mercy Catholic Church (I). Display/hide their locations on the map
Cemetery: Saint Gabriel Cemetery (1). Display/hide its location on the map
Reservoir: Great Falls Estate Lake (A). Display/hide its location on the map
Streams, rivers, and creeks: Bogley Branch (A), Buck Branch (B), Carroll Branch (C), Old Farm Creek (D), Cool Spring Branch (E), Snakeden Branch (F), Rock Run (G), Limekiln Branch (H), Thomas Branch (I). Display/hide their locations on the map
Parks in Potomac include: Buck Branch Park (1), Cabin John Regional Park (2), Highland Stone Park (3), Kilgour Branch Park (4), Falls Road Park (5), Beverly Farms Park (6), Bedfordshire Park (7), Cabin John Creek Stream Valley Park (8). Display/hide their locations on the map
Tourist attractions: MINO Publications (9009 Paddock Lane) (1), Pocket Guide To Washington DC (9009 Paddock Lane) (2). Display/hide their approximate locations on the map
Court: Maryland State Government - Courts- District Courts- District 6 Maryland- Court Commissio (1451 Seven Locks Road) (1). Display/hide its approximate location on the map
Birthplace of: Jeff Halpern - NHL player (Washington Capitals, born: May 3, 1976), Maggie Rose - Country singer, Dan Veatch - Swimmer, Darren Star - Screenwriter, Jimmy Kemp - Football player, Lori Alan - Voice actress, Marcus Mason - Football player, Rachel Nichols (journalist) - Sportswriter, C. J. Kemp - Lacrosse player, David Louis Band - US astronomer.
Drinking water stations with addresses in Potomac and their reported violations in the past:
ECONO LODGE (Serves PA, Population served: 100, Groundwater):Past monitoring violations:WOODLAND CONDO ASSOC (Serves ME, Population served: 36, Groundwater):
- One routine major monitoring violation
- 6 regular monitoring violations
Past health violations:Past monitoring violations:
- MCL, Monthly (TCR) - In MAY-2014, Contaminant: Coliform. Follow-up actions: St Public Notif requested (MAY-30-2014), St Formal NOV issued (MAY-30-2014), St Public Notif received (MAY-31-2014), St Compliance achieved (JUN-23-2014)
- 8 routine major monitoring violations
- 2 regular monitoring violations
| This place: | 2.8 people |
| Maryland: | 2.6 people |
| This place: | 81.1% |
| Whole state: | 67.1% |
| This place: | 1.9% |
| Whole state: | 6.4% |
Likely homosexual households (counted as self-reported same-sex unmarried-partner households)
- Lesbian couples: 0.2% of all households
- Gay men: 0.2% of all households
People in group quarters in Potomac in 2010:
- 259 people in nursing facilities/skilled-nursing facilities
- 29 people in group homes intended for adults
- 21 people in college/university student housing
- 6 people in workers' group living quarters and job corps centers
- 5 people in residential treatment centers for adults
People in group quarters in Potomac in 2000:
- 145 people in nursing homes
- 94 people in other noninstitutional group quarters
- 34 people in homes for the mentally retarded
- 27 people in other group homes
- 3 people in other workers' dormitories
- 2 people in religious group quarters
Banks with most branches in Potomac (2011 data):
- Bank of America, National Association: Potomac Branch at 10000 Falls Road, branch established on 1972/08/15; Potomac Drive In Branch at 10000 Falls Road, branch established on 1999/08/01. Info updated 2009/11/18: Bank assets: $1,451,969.3 mil, Deposits: $1,077,176.8 mil, headquarters in Charlotte, NC, positive income, 5782 total offices, Holding Company: Bank Of America Corporation
- Capital One, National Association: 10211 River Road Branch at 10211 River Road, branch established on 1986/06/30; Cabin John Mall Branch at 7941 Tuckerman Lane, branch established on 1985/06/30. Info updated 2011/07/01: Bank assets: $133,477.8 mil, Deposits: $97,063.7 mil, headquarters in Mclean, VA, positive income, 984 total offices, Holding Company: Capital One Financial Corporation
- SunTrust Bank: Potomac/Falls Road Branch at 9812 Falls Road, branch established on 1986/06/30; Cabin John Branch at 7969 Tuckerman Lane, branch established on 1986/06/30. Info updated 2010/05/27: Bank assets: $171,291.7 mil, Deposits: $129,833.2 mil, headquarters in Atlanta, GA, positive income, Commercial Lending Specialization, 1716 total offices, Holding Company: Suntrust Banks, Inc.
- Manufacturers and Traders Trust Company: Cabin John Mall Branch at 11325 Seven Locks Road, branch established on 1979/05/14; Potomac Village Branch at 10100 River Road, branch established on 1929/01/01. Info updated 2011/08/08: Bank assets: $76,887.1 mil, Deposits: $60,064.2 mil, headquarters in Buffalo, NY, positive income, Commercial Lending Specialization, 808 total offices, Holding Company: M&T Bank Corporation
- Wells Fargo Bank, National Association: Potomac Promenade Branch at 9812 Falls Road, branch established on 1989/04/03. Info updated 2011/04/05: Bank assets: $1,161,490.0 mil, Deposits: $905,653.0 mil, headquarters in Sioux Falls, SD, positive income, 6395 total offices, Holding Company: Wells Fargo & Company
- Citibank, National Association: Potomac Promenade Branch at 9812 Falls Road, branch established on 1989/09/05. Info updated 2012/01/10: Bank assets: $1,288,658.0 mil, Deposits: $882,541.0 mil, headquarters in Sioux Falls, SD, positive income, International Specialization, 1048 total offices, Holding Company: Citigroup Inc.
- EagleBank: Park Potomac Branch at 12505 Park Potomac Ave, branch established on 2009/11/02. Info updated 2011/02/07: Bank assets: $2,821.1 mil, Deposits: $2,400.7 mil, headquarters in Bethesda, MD, positive income, Commercial Lending Specialization, 14 total offices, Holding Company: Eagle Bancorp, Inc.
- Sandy Spring Bank: Potomac Branch at 9822 Falls Road, branch established on 1995/10/10. Info updated 2007/07/17: Bank assets: $3,709.4 mil, Deposits: $2,664.0 mil, headquarters in Olney, MD, positive income, Commercial Lending Specialization, 43 total offices, Holding Company: Sandy Spring Bancorp, Inc.
- Branch Banking and Trust Company: Potomac Promenade Branch at 9812 Falls Rd, branch established on 2006/08/14. Info updated 2010/03/29: Bank assets: $168,867.6 mil, Deposits: $127,549.5 mil, headquarters in Winston Salem, NC, positive income, Commercial Lending Specialization, 1793 total offices, Holding Company: Bb&T Corporation
- 3 other banks with 3 local branches
For population 15 years and over in Potomac:
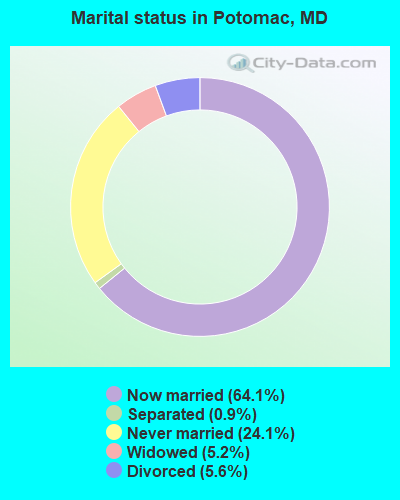
- Never married: 24.1%
- Now married: 64.1%
- Separated: 0.9%
- Widowed: 5.2%
- Divorced: 5.6%
For population 25 years and over in Potomac:
- High school or higher: 97.5%
- Bachelor's degree or higher: 84.8%
- Graduate or professional degree: 54.6%
- Unemployed: 2.0%
- Mean travel time to work (commute): 20.0 minutes
| Here: | 9.2 |
| Maryland average: | 12.7 |
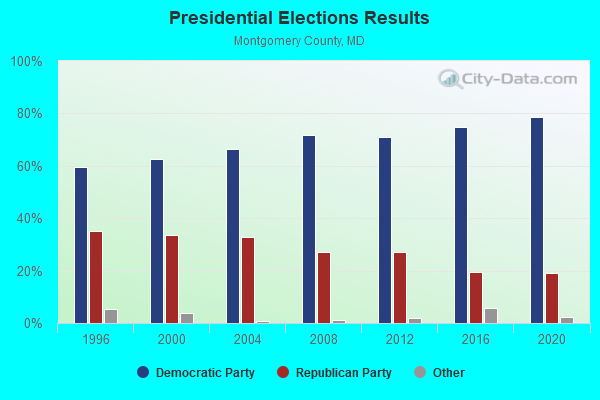
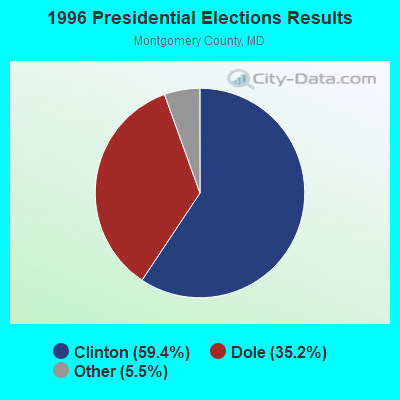
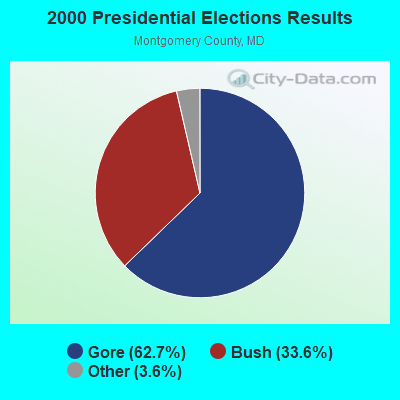
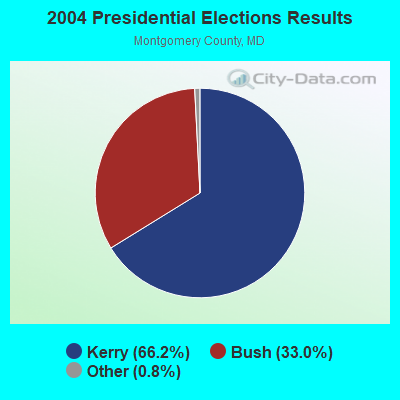
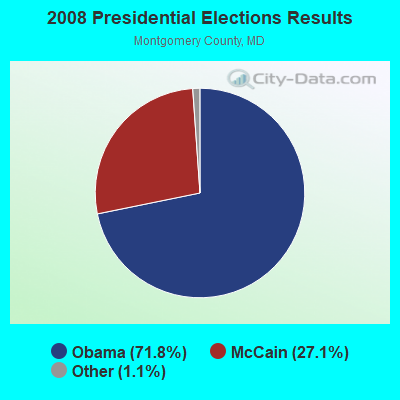
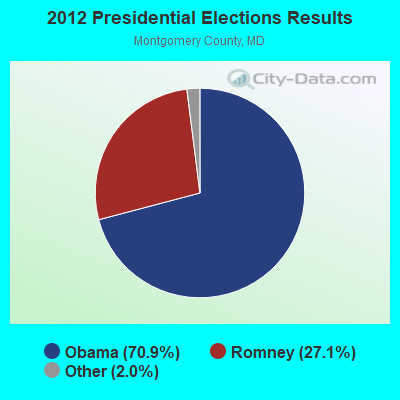
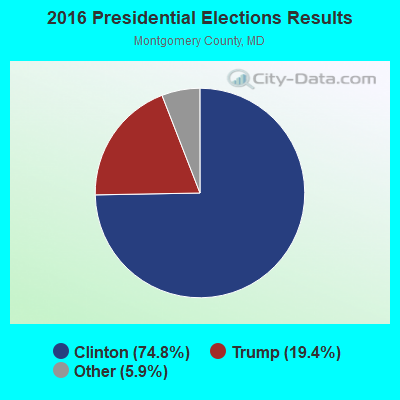
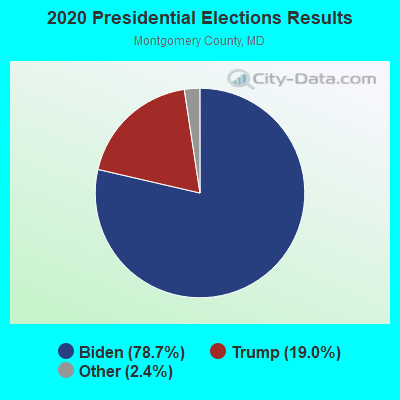
Graphs represent county-level data. Detailed 2008 Election Results
Religion statistics for Potomac, MD (based on Montgomery County data)
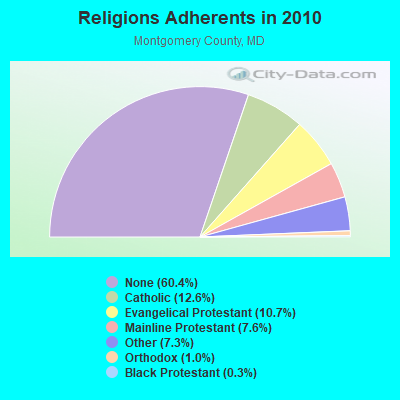
| Religion | Adherents | Congregations |
|---|---|---|
| Catholic | 122,569 | 39 |
| Evangelical Protestant | 104,377 | 319 |
| Mainline Protestant | 73,637 | 186 |
| Other | 70,946 | 153 |
| Orthodox | 9,889 | 14 |
| Black Protestant | 3,189 | 22 |
| None | 587,170 | - |
Food Environment Statistics:
| This county: | 2.16 / 10,000 pop. |
| Maryland: | 1.96 / 10,000 pop. |
| This county: | 0.02 / 10,000 pop. |
| Maryland: | 0.07 / 10,000 pop. |
| Montgomery County: | 1.00 / 10,000 pop. |
| Maryland: | 1.22 / 10,000 pop. |
| Montgomery County: | 1.42 / 10,000 pop. |
| Maryland: | 2.05 / 10,000 pop. |
| This county: | 5.91 / 10,000 pop. |
| Maryland: | 5.40 / 10,000 pop. |
| Here: | 6.7% |
| Maryland: | 9.1% |
| This county: | 18.8% |
| State: | 26.7% |
| This county: | 19.9% |
| State: | 15.5% |
Health and Nutrition:
| This city: | 58.7% |
| Maryland: | 50.1% |
| Here: | 58.6% |
| State: | 47.6% |
| Here: | 27.6 |
| Maryland: | 28.8 |
| Potomac: | 16.5% |
| State: | 20.0% |
| Potomac: | 9.5% |
| State: | 11.3% |
| Potomac: | 7.0 |
| Maryland: | 6.8 |
| Here: | 34.3% |
| State: | 34.1% |
| This city: | 62.9% |
| Maryland: | 56.5% |
| This city: | 81.0% |
| Maryland: | 80.5% |
More about Health and Nutrition of Potomac, MD Residents
6.39% of this county's 2021 resident taxpayers lived in other counties in 2020 ($98,213 average adjusted gross income)
| Here: | 6.39% |
| Maryland average: | 7.42% |
0.04% of residents moved from foreign countries ($657 average AGI)
Montgomery County: 0.04% Maryland average: 0.05%
Top counties from which taxpayers relocated into this county between 2020 and 2021:
| from Prince George's County, MD | |
| from District of Columbia, DC | |
| from Fairfax County, VA |
7.69% of this county's 2020 resident taxpayers moved to other counties in 2021 ($102,008 average adjusted gross income)
| Here: | 7.69% |
| Maryland average: | 7.91% |
0.05% of residents moved to foreign countries ($861 average AGI)
Montgomery County: 0.05% Maryland average: 0.04%
Top counties to which taxpayers relocated from this county between 2020 and 2021:
| to Prince George's County, MD | |
| to Frederick County, MD | |
| to District of Columbia, DC |
| Businesses in Potomac, MD | ||||
| Name | Count | Name | Count | |
|---|---|---|---|---|
| Baskin-Robbins | 1 | Nike | 2 | |
| Chico's | 1 | RadioShack | 1 | |
| Decora Cabinetry | 2 | Rite Aid | 1 | |
| Domino's Pizza | 2 | Safeway | 1 | |
| Dunkin Donuts | 1 | Starbucks | 2 | |
| FedEx | 5 | True Value | 1 | |
| GNC | 1 | UPS | 5 | |
| Giant | 2 | Vons | 1 | |
| MasterBrand Cabinets | 4 | Walgreens | 1 | |
| McDonald's | 1 | |||
Strongest AM radio stations in Potomac:
- WTNT (570 AM; 5 kW; BETHESDA, MD; Owner: AMFM RADIO LICENSES, L.L.C.)
- WCTN (950 AM; 2 kW; POTOMAC-CABIN JOHN, MD; Owner: SEVEN LOCKS BROADCASTING COMPANY, INC.)
- WMAL (630 AM; 5 kW; WASHINGTON, DC; Owner: WMAL, INC.)
- WTOP (1500 AM; 50 kW; WASHINGTON, DC; Owner: BONNEVILLE HOLDING COMPANY)
- WTEM (980 AM; 50 kW; WASHINGTON, DC; Owner: AMFM RADIO LICENSES, L.L.C.)
- WMET (1150 AM; 50 kW; GAITHERSBURG, MD; Owner: BELTWAY ACQUISITION CORPORATION)
- WUST (1120 AM; daytime; 20 kW; WASHINGTON, DC)
- WPGC (1580 AM; 50 kW; MORNINGSIDE, MD; Owner: INFINITY WPGC(AM), INC.)
- WWRC (1260 AM; 5 kW; WASHINGTON, DC; Owner: AMFM RADIO LICENSES, L.L.C.)
- WCBM (680 AM; 50 kW; BALTIMORE, MD; Owner: WCBM MARYLAND, INC.)
- WABS (780 AM; daytime; 5 kW; ARLINGTON, VA; Owner: SALEM MEDIA OF VIRGINIA, INC.)
- WZHF (1390 AM; 5 kW; ARLINGTON, VA; Owner: WAY BROADCASTING, INC.)
- WACA (1540 AM; daytime; 5 kW; WHEATON, MD; Owner: AC ACQUISITION, LLC)
Strongest FM radio stations in Potomac:
- WARW (94.7 FM; BETHESDA, MD; Owner: INFINITY BROADCASTING OPERATIONS, INC.)
- WIHT (99.5 FM; WASHINGTON, DC; Owner: AMFM RADIO LICENSES, L.L.C.)
- WASH (97.1 FM; WASHINGTON, DC; Owner: AMFM RADIO LICENSES, L.L.C.)
- WWDC-FM (101.1 FM; WASHINGTON, DC; Owner: AMFM RADIO LICENSES, L.L.C.)
- WRQX (107.3 FM; WASHINGTON, DC; Owner: WMAL, INC.)
- WHUR-FM (96.3 FM; WASHINGTON, DC; Owner: THE HOWARD UNIVERSITY)
- WKYS (93.9 FM; WASHINGTON, DC; Owner: RADIO ONE LICENSES, LLC)
- WGMS-FM (103.5 FM; WASHINGTON, DC; Owner: BONNEVILLE HOLDING COMPANY)
- WJFK-FM (106.7 FM; MANASSAS, VA; Owner: INFINITY BROADCASTING CORP. OF WASHINGTON, DC)
- WAMU (88.5 FM; WASHINGTON, DC; Owner: THE EXEC. COMM. OF THE BD. OF TRUSTEES OF AMERICAN UNIV.)
- WGTS (91.9 FM; TAKOMA PARK, MD; Owner: COLUMBIA UNION COLLEGE BROADCASTING, INC.)
- WMMJ (102.3 FM; BETHESDA, MD; Owner: RADIO ONE LICENSES, LLC)
- WETA (90.9 FM; WASHINGTON, DC; Owner: GREATER WASHINGTON EDUCATIONAL TELECOMMUNICATIONS ASSN.)
- WMZQ-FM (98.7 FM; WASHINGTON, DC; Owner: AMFM RADIO LICENSES, L.L.C.)
- WJZW (105.9 FM; WOODBRIDGE, VA; Owner: WMAL, INC.)
- WCSP-FM (90.1 FM; WASHINGTON, DC; Owner: NATIONAL CABLE SATELLITE CORPORATION)
- WAVA (105.1 FM; ARLINGTON, VA; Owner: SALEM MEDIA OF VIRGINIA, INC.)
- WPFW (89.3 FM; WASHINGTON, DC; Owner: PACIFICA FOUNDATION, INC.)
- WBIG-FM (100.3 FM; WASHINGTON, DC; Owner: AMFM RADIO LICENSES, L.L.C.)
- WPGC-FM (95.5 FM; MORNINGSIDE, MD; Owner: INFINITY BROADCASTING CORPORATION OF MARYLAND)
TV broadcast stations around Potomac:
- WETA-TV (Channel 26; WASHINGTON, DC; Owner: THE GREATER WASHINGTON ED TELECOMM. ASSOC)
- WDCA (Channel 20; WASHINGTON, DC; Owner: FOX TELEVISION STATIONS, INC.)
- WTTG (Channel 5; WASHINGTON, DC; Owner: FOX TELEVISION STATIONS, INC.)
- WJLA-TV (Channel 7; WASHINGTON, DC; Owner: ACC LICENSEE, INC.)
- WUSA (Channel 9; WASHINGTON, DC; Owner: THE DETROIT NEWS, INC.)
- WHUT-TV (Channel 32; WASHINGTON, DC; Owner: HOWARD UNIVERSITY)
- WRC-TV (Channel 4; WASHINGTON, DC; Owner: NBC SUBSIDIARY (WRC-TV), INC.)
- WBDC-TV (Channel 50; WASHINGTON, DC; Owner: WBDC BROADCASTING, INC.)
- WNVC (Channel 56; FAIRFAX, VA; Owner: COMMONWEALTH PUBLIC BROADCASTING CORPORATION)
- W28BY (Channel 63; BALTIMORE, MD; Owner: INFORMATION SUPER STATION, L.L.C.)
- WMDO-CA (Channel 30; WASHINGTON, DC; Owner: ENTRAVISION HOLDINGS, LLC)
- WZDC-LP (Channel 64; WASHINGTON, DC; Owner: ONDA CAPITAL, INC.)
- WKRP-LP (Channel 42; WASHINGTON, DC; Owner: CAPITAL MEDIA, LLC)
- WBAL-TV (Channel 11; BALTIMORE, MD; Owner: WBAL HEARST-ARGYLE TV, INC. (CA CORP.))
- WMAR-TV (Channel 2; BALTIMORE, MD; Owner: SCRIPPS HOWARD BROADCASTING COMPANY)
- WBFF (Channel 45; BALTIMORE, MD; Owner: CHESAPEAKE TELEVISION LICENSEE, LLC)
- WNUV (Channel 54; BALTIMORE, MD; Owner: BALTIMORE (WNUV-TV) LICENSEE, INC.)
- WUTB (Channel 24; BALTIMORE, MD; Owner: FOX TELEVISION STATIONS, INC.)
- WPXW (Channel 66; MANASSAS, VA; Owner: PAXSON WASHINGTON LICENSE, INC.)
- WMPT (Channel 22; ANNAPOLIS, MD; Owner: MARYLAND PUBLIC BROADCASTING COMMISSION)
- WMPB (Channel 67; BALTIMORE, MD; Owner: MARYLAND PUBLIC BROADCASTING COMMISSION)
- WFPT (Channel 62; FREDERICK, MD; Owner: MARYLAND PUBLIC BROADCASTING COMMISSION)
- WJZ-TV (Channel 13; BALTIMORE, MD; Owner: VIACOM INC.)
- W42BE (Channel 42; FAIRFAX, VA; Owner: FAIRFAX LOW POWER CO.)
- WIAV-LP (Channel 58; WASHINGTON, DC; Owner: ASIAVISION, INC.)
- National Bridge Inventory (NBI) Statistics
- 35Number of bridges
- 299ft / 90.8mTotal length
- $2,248,000Total costs
- 1,019,980Total average daily traffic
- 38,358Total average daily truck traffic
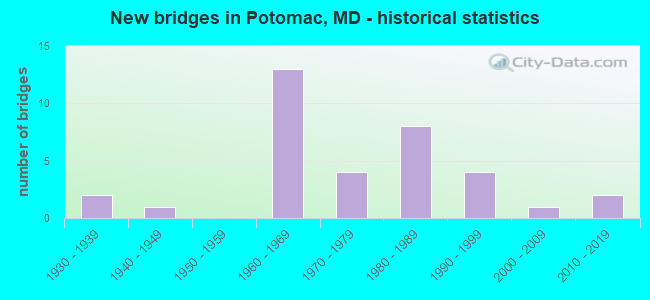
- New bridges - historical statistics
- 21930-1939
- 11940-1949
- 131960-1969
- 41970-1979
- 81980-1989
- 41990-1999
- 12000-2009
- 22010-2019
FCC Registered Antenna Towers:
6- Mehran Nazari, 9404 Falls Road (Lat: 39.010028 Lon: -77.220694), Type: 61.9, Structure height: 24031 m, Overall height: 56.4 m, Registrant: County Of Montgomery, Gerry.Adcock@montgomerycountymd.Gov, , Rockv-ille, Phone: (240) 773-8000
- Mehran Nazari, 9404 Falls Road (Lat: 39.010028 Lon: -77.220694), Type: 61.9, Structure height: 24031 m, Overall height: 56.4 m, Registrant: County Of Montgomery, Gerry.Adcock@montgomerycountymd.Gov, , Rockv-ille, Phone: (240) 773-8000
- Mehran Nazari, 9404 Falls Road (Lat: 39.010028 Lon: -77.220694), Type: 61.9, Structure height: 24031 m, Overall height: 56.4 m, Licensee ID: G, Registrant: County Of Montgomery, Gerry.Adcock@montgomerycountymd.Gov, , Rockv-ille, Phone: (240) 773-8000
- Mehran Nazari, 9404 Falls Road (Lat: 39.010028 Lon: -77.220694), Type: 61.9, Structure height: 24031 m, Overall height: 56.4 m, Licensee ID: G, Registrant: County Of Montgomery, Gerry.Adcock@montgomerycountymd.Gov, , Rockv-ille, Phone: (240) 773-8000
- Mehran Nazari, 9404 Falls Road (Lat: 39.010056 Lon: -77.220694), Type: 57.6, Structure height: 24031 m, Overall height: 56.4 m, Registrant: County Of Montgomery, Gerry.Adcock@montgomerycountymd.Gov, , Rockv-ille, Phone: (240) 773-8000
- Mehran Nazari, 9404 Falls Road (Lat: 39.010056 Lon: -77.220694), Type: 57.6, Structure height: 24031 m, Overall height: 56.4 m, Registrant: County Of Montgomery, Gerry.Adcock@montgomerycountymd.Gov, , Rockv-ille, Phone: (240) 773-8000
FCC Registered Broadcast Land Mobile Towers:
19 (See the full list of FCC Registered Broadcast Land Mobile Towers in Potomac, MD)FCC Registered Microwave Towers:
14 (See the full list of FCC Registered Microwave Towers in this town)FCC Registered Maritime Coast & Aviation Ground Towers:
1 (See the full list of FCC Registered Maritime Coast & Aviation Ground Towers)FCC Registered Amateur Radio Licenses:
243 (See the full list of FCC Registered Amateur Radio Licenses in Potomac)FAA Registered Aircraft Manufacturers and Dealers:
1 (See the full list of FAA Registered Manufacturers and Dealers in Potomac)FAA Registered Aircraft:
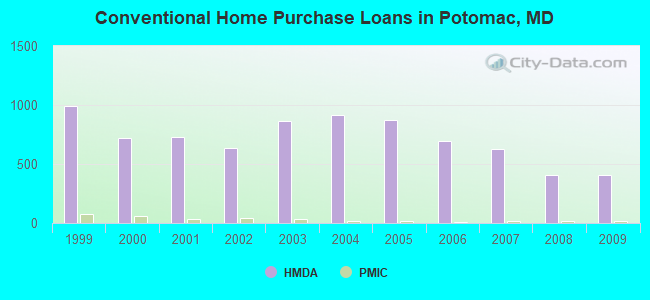
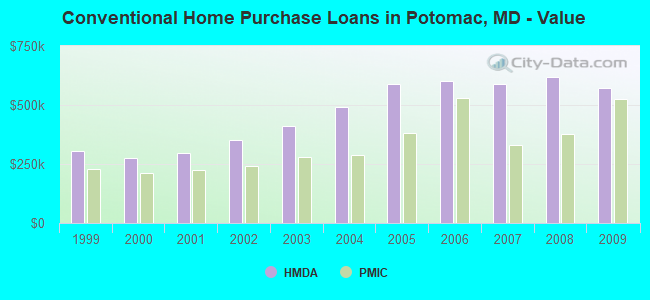
33 (See the full list of FAA Registered Aircraft)| Home Mortgage Disclosure Act Aggregated Statistics For Year 2009 (Based on 5 full and 4 partial tracts) | ||||||||||||
| A) FHA, FSA/RHS & VA Home Purchase Loans | B) Conventional Home Purchase Loans | C) Refinancings | D) Home Improvement Loans | E) Loans on Dwellings For 5+ Families | F) Non-occupant Loans on < 5 Family Dwellings (A B C & D) | |||||||
|---|---|---|---|---|---|---|---|---|---|---|---|---|
| Number | Average Value | Number | Average Value | Number | Average Value | Number | Average Value | Number | Average Value | Number | Average Value | |
| LOANS ORIGINATED | 48 | $509,331 | 410 | $573,279 | 2,083 | $463,618 | 42 | $354,314 | 0 | $0 | 54 | $364,615 |
| APPLICATIONS APPROVED, NOT ACCEPTED | 2 | $499,000 | 29 | $560,218 | 139 | $488,962 | 5 | $473,836 | 0 | $0 | 6 | $374,733 |
| APPLICATIONS DENIED | 7 | $419,523 | 44 | $625,675 | 350 | $587,678 | 15 | $250,273 | 1 | $50,000 | 26 | $312,287 |
| APPLICATIONS WITHDRAWN | 10 | $418,796 | 70 | $583,451 | 346 | $502,074 | 12 | $385,884 | 0 | $0 | 27 | $420,780 |
| FILES CLOSED FOR INCOMPLETENESS | 0 | $0 | 11 | $370,372 | 83 | $450,972 | 2 | $165,500 | 0 | $0 | 6 | $277,892 |
Detailed mortgage data for all 9 tracts in Potomac, MD
| Private Mortgage Insurance Companies Aggregated Statistics For Year 2009 (Based on 4 full and 4 partial tracts) | ||||
| A) Conventional Home Purchase Loans | B) Refinancings | |||
|---|---|---|---|---|
| Number | Average Value | Number | Average Value | |
| LOANS ORIGINATED | 15 | $527,119 | 6 | $533,135 |
| APPLICATIONS APPROVED, NOT ACCEPTED | 2 | $759,950 | 4 | $503,178 |
| APPLICATIONS DENIED | 2 | $730,000 | 0 | $0 |
| APPLICATIONS WITHDRAWN | 2 | $547,000 | 0 | $0 |
| FILES CLOSED FOR INCOMPLETENESS | 0 | $0 | 0 | $0 |
2004 - 2018 National Fire Incident Reporting System (NFIRS) incidents
- Fire incident types reported to NFIRS in Potomac, MD
- 19645.3%Structure Fires
- 15235.1%Outside Fires
- 6013.9%Mobile Property/Vehicle Fires
- 255.8%Other
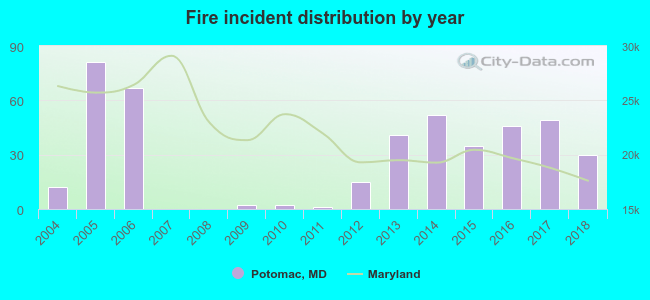 Based on the data from the years 2004 - 2018 the average number of fire incidents per year is 29. The highest number of fires - 81 took place in 2005, and the least - 0 in 2007. The data has an increasing trend.
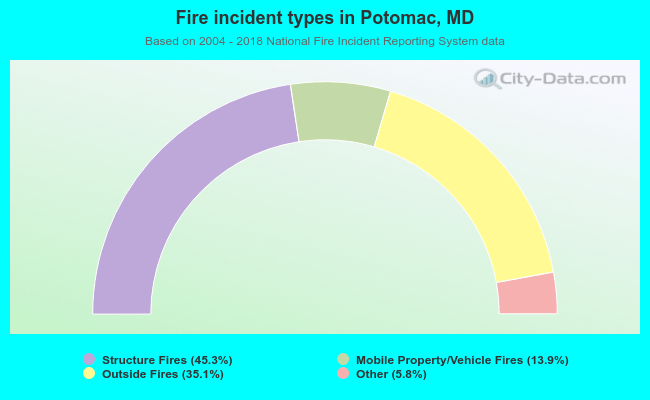 When looking into fire subcategories, the most reports belonged to: Structure Fires (45.3%), and Outside Fires (35.1%).
| Most common first names in Potomac, MD among deceased individuals | ||
| Name | Count | Lived (average) |
|---|---|---|
| John | 136 | 74.2 years |
| William | 126 | 75.0 years |
| Mary | 124 | 81.7 years |
| Robert | 88 | 73.0 years |
| Helen | 80 | 83.8 years |
| Charles | 68 | 75.1 years |
| James | 68 | 74.9 years |
| Ruth | 59 | 83.4 years |
| Margaret | 59 | 81.8 years |
| George | 53 | 79.0 years |
| Most common last names in Potomac, MD among deceased individuals | ||
| Last name | Count | Lived (average) |
|---|---|---|
| Smith | 36 | 79.2 years |
| Davis | 29 | 78.0 years |
| Brown | 28 | 83.2 years |
| Johnson | 28 | 81.3 years |
| Miller | 24 | 80.1 years |
| Anderson | 16 | 74.4 years |
| Martin | 16 | 72.7 years |
| Williams | 15 | 78.2 years |
| Goldberg | 14 | 79.4 years |
| Cohen | 14 | 82.6 years |
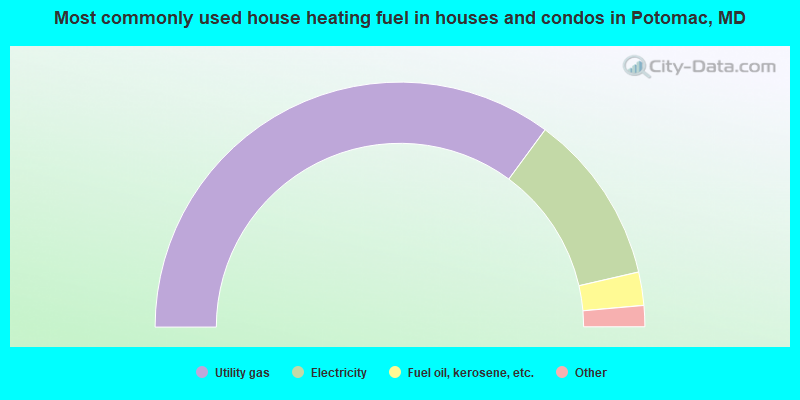
- 70.2%Utility gas
- 22.6%Electricity
- 4.4%Fuel oil, kerosene, etc.
- 1.6%Bottled, tank, or LP gas
- 0.5%Other fuel
- 0.3%Solar energy
- 0.3%No fuel used
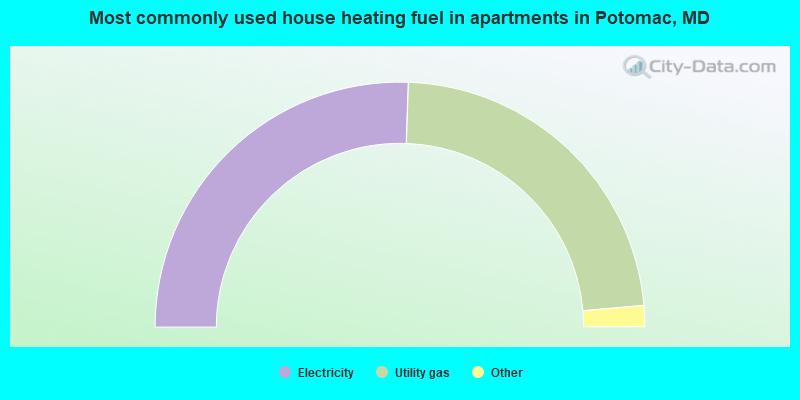
- 51.1%Electricity
- 46.1%Utility gas
- 1.4%No fuel used
- 0.6%Bottled, tank, or LP gas
- 0.4%Fuel oil, kerosene, etc.
- 0.4%Other fuel
Potomac compared to Maryland state average:
- Median household income above state average.
- Median house value significantly above state average.
- Unemployed percentage significantly below state average.
- Black race population percentage significantly below state average.
- Median age significantly above state average.
- Foreign-born population percentage above state average.
- Renting percentage significantly below state average.
- Length of stay since moving in significantly above state average.
- Number of rooms per house significantly above state average.
- Percentage of population with a bachelor's degree or higher significantly above state average.
Potomac on our top lists:
- #9 on the list of "Top 101 cities with largest percentage of males in occupations: legal occupations (population 5,000+)"
- #12 on the list of "Top 101 cities with the largest percentage of elementary and middle school students in private schools (5,000+ students)"
- #26 on the list of "Top 101 cities where residents moved in more then 10 years ago (10,000+ households)"
- #28 on the list of "Top 101 cities with largest percentage of males in industries: professional, scientific, and technical services (population 5,000+)"
- #36 on the list of "Top 100 cities with biggest houses"
- #37 on the list of "Top 101 cities with the most people having Master's or Doctorate degrees (population 5,000+)"
- #38 on the list of "Top 101 cities with largest percentage of females in industries: professional, scientific, and technical services (population 5,000+)"
- #41 on the list of "Top 101 cities with the most residents born in Iran (population 500+)"
- #79 on the list of "Top 101 cities with the most residents born in Taiwan (population 500+)"
- #79 on the list of "Top 101 cities with the most people having professional degrees (population 500+)"
- #80 on the list of "Top 101 cities with largest percentage of males in occupations: life, physical, and social science occupations (population 5,000+)"
- #86 on the list of "Top 100 cities with highest median household income"
- #89 on the list of "Top 101 cities with largest percentage of females in occupations: legal occupations (population 5,000+)"
- #93 on the list of "Top 100 cities with highest median house value (pop. 5,000+)"
- #100 on the list of "Top 101 cities with the highest percentage of workers working at home, population 5,000+"
- #100 on the list of "Top 100 best educated cities (highest percentage of bachelor degree holding residents)"
- #16 (20854) on the list of "Top 101 zip codes with the largest percentage of taxpayers reporting taxable interest in 2012 (pop 5,000+)"
- #23 (20854) on the list of "Top 101 zip codes with the largest percentage of taxpayers using charity contributions deductions in 2012 (pop 5,000+)"
- #47 (20854) on the list of "Top 101 zip codes with the highest 2012 average reported profit/loss from business (pop 5,000+)"
- #54 (20854) on the list of "Top 101 zip codes with the largest percentage of taxpayers reporting net capital gain/loss in 2012 (pop 5,000+)"
- #4 on the list of "Top 101 counties with the largest number of people without health insurance coverage in 2000 (pop. 50,000+)"
- #6 on the list of "Top 101 counties with the best general health status score of residents (1-5), 3 years of data"
- #10 on the list of "Top 101 counties with the highest surface withdrawal of fresh water for public supply"
- #13 on the list of "Top 101 counties with the highest total withdrawal of fresh water for public supply"
- #14 on the list of "Top 101 counties with the highest percentage of residents that visited a dentist within the past year"

|
|
Total of 2411 patent applications in 2008-2024.