Great Falls, Virginia

Great Falls: Great Falls

Great Falls: Great Falls

Great Falls: I was hiking at the great falls when I spotted this beautiful sight and did not miss the opportunity to click it. Hope you guys like it.

Great Falls: "The Falls" at Great Falls Park
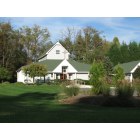
Great Falls: St. Francis Episcopal Church on Georgetown Pike welcomes all visitors
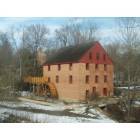
Great Falls: the old mill near Leesburg Pike

Great Falls: Mountain,sky,water and tress, NATURE AT ITS FULLEST at GREAT FALLS

Great Falls: Great Falls

Great Falls: This green picture is an amazing collection I have from Great falls
- add
your
Submit your own pictures of this place and show them to the world
- OSM Map
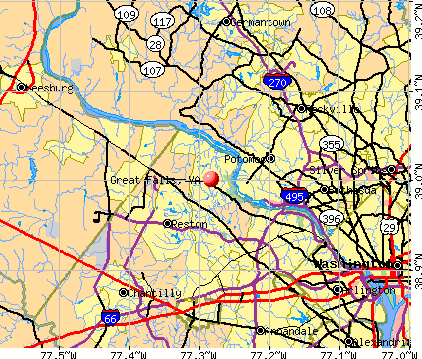
- General Map
- Google Map
- MSN Map
Population change since 2000: +80.5%
| Males: 7,891 | |
| Females: 7,536 |
| Median resident age: | 48.9 years |
| Virginia median age: | 39.0 years |
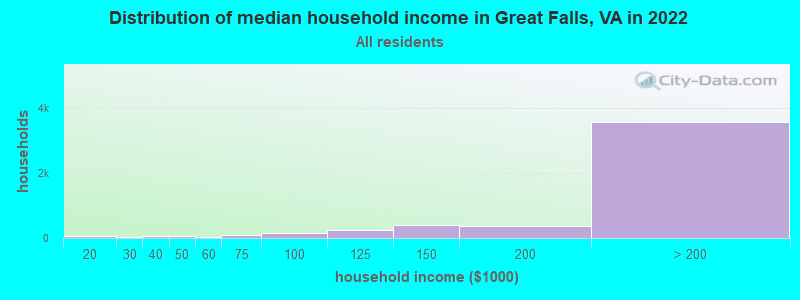
| Great Falls: | over $200,000 |
| VA: | $85,873 |
Estimated per capita income in 2022: $126,242 (it was $78,149 in 2000)
Great Falls CDP income, earnings, and wages data
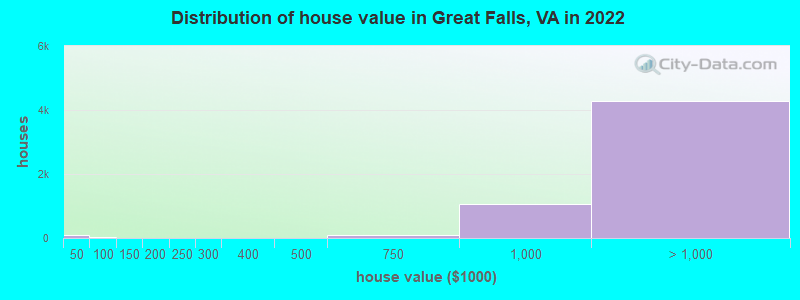
Estimated median house or condo value in 2022: over $1,000,000 (it was $599,900 in 2000)
| Great Falls: | over $1,000,000 |
| VA: | $365,700 |
Mean prices in 2022: all housing units: $784,862; detached houses: $948,347; townhouses or other attached units: $562,658; in 2-unit structures: $348,824; in 3-to-4-unit structures: $312,117; in 5-or-more-unit structures: $395,675; mobile homes: $69,451
Median gross rent in 2022: $3,025.
(1.2% for White Non-Hispanic residents, 7.4% for Hispanic or Latino residents, 7.1% for other race residents, 4.2% for two or more races residents)
Detailed information about poverty and poor residents in Great Falls, VA

Compare current foreclosures near Great Falls, VA:
| Photo | Address | Area | Beds / Baths | Price | Details |
|---|---|---|---|---|---|

|
#1
Schindel Ct
Great Falls, VA 22066
|
2,779 sq. feet
|
2 baths 4 beds |
show details | |

|
#2
Walker Rd
Great Falls, VA 22066
|
3,584 sq. feet
|
5 baths 5 beds |
show details | |

|
#3
Georgetown Pike
Great Falls, VA 22066
|
3,965 sq. feet
|
4 baths 4 beds |
show details | |

|
#4
Wood Glade Dr
Great Falls, VA 22066
|
2,696 sq. feet
|
3 baths 5 beds |
show details | |

|
#5
Cavalcade St
Great Falls, VA 22066
|
2,134 sq. feet
|
2 baths 4 beds |
show details | |

|
#6
Nedra Dr
Great Falls, VA 22066
|
4,988 sq. feet
|
5 baths 4 beds |
show details | |

|
#7
Georgetown Pike Unit 1170
Great Falls, VA 22066
|
- sq. feet
|
- baths - beds |
show details | |

|
#8
Seneca Rd
Great Falls, VA 22066
|
- sq. feet
|
- baths - beds |
show details | |

|
#9
17th St NW Apt 504
Washington, DC 20009
|
800 sq. feet
|
1 baths 1 beds |
$419,900
|
show details |

|
#10
19th St NW
Washington, DC 20036
|
2,515 sq. feet
|
6 baths 8 beds |
$1,684,800
|
show details |
| Photo | Address | Area | Beds / Baths | Price | Details |
|---|---|---|---|---|---|

|
#11
Hammersmith Cir
Silver Spring, MD 20906
|
1,152 sq. feet
|
1 baths 3 beds |
$353,600
|
show details |

|
#12
Cathedral Ave NW Apt 108
Washington, DC 20016
|
765 sq. feet
|
1 baths 1 beds |
$279,900
|
show details |

|
#13
Eastern Ave NE
Washington, DC 20011
|
1,024 sq. feet
|
1 baths 3 beds |
$395,000
|
show details |

|
#14
Brooke Knolls Rd
Gaithersburg, MD 20882
|
1,704 sq. feet
|
3 baths 4 beds |
$681,500
|
show details |

|
#15
Pooks Hill Rd Apt 1612s
Bethesda, MD 20814
|
1,250 sq. feet
|
1 baths 2 beds |
$289,000
|
show details |

|
#16
Interlachen Dr Apt 111
Silver Spring, MD 20906
|
965 sq. feet
|
1 baths 2 beds |
$148,000
|
show details |

|
#17
Delaware Ave SW Apt N720
Washington, DC 20024
|
- sq. feet
|
1 baths 1 beds |
$155,000
|
show details |

|
#18
Caledonia Ct Apt K
Germantown, MD 20874
|
1,087 sq. feet
|
2 baths 2 beds |
show details | |

|
#19
4th St NE Apt 2
Washington, DC 20002
|
1,061 sq. feet
|
2 baths 2 beds |
show details | |

|
#20
Cambria Ter NE
Leesburg, VA 20176
|
1,984 sq. feet
|
2 baths 3 beds |
show details |
| Photo | Address | Area | Beds / Baths | Price | Details |
|---|---|---|---|---|---|

|
#21
Rockville Pike Unit 712
Rockville, MD 20852
|
505 sq. feet
|
1 baths 1 beds |
show details | |

|
#22
Ridgeline Dr
Montgomery Village, MD 20886
|
1,794 sq. feet
|
2 baths 3 beds |
show details | |

|
#23
Cove Ledge Ct
Montgomery Village, MD 20886
|
- sq. feet
|
3 baths 4 beds |
show details | |

|
#24
Connecticut Ave NW Apt 606
Washington, DC 20008
|
160 sq. feet
|
1 baths 1 beds |
show details | |

|
#25
Underwood Pl NW
Washington, DC 20012
|
1,088 sq. feet
|
3 baths 3 beds |
show details | |

|
#26
Lee Landing Dr
Falls Church, VA 22043
|
900 sq. feet
|
1 baths 2 beds |
show details | |

|
#27
Wedgedale Dr
Sterling, VA 20164
|
1,540 sq. feet
|
2 baths 4 beds |
show details | |

|
#28
Brassie Pl Apt 201
Montgomery Village, MD 20886
|
1,050 sq. feet
|
2 baths 2 beds |
show details | |

|
#29
Pearl Fog Way
Dunn Loring, VA 22027
|
3,356 sq. feet
|
4 baths 4 beds |
show details | |

|
#30
E Timber Branch Pkwy
Alexandria, VA 22302
|
1,743 sq. feet
|
2 baths 3 beds |
show details |
| Photo | Address | Area | Beds / Baths | Price | Details |
|---|---|---|---|---|---|

|
#31
Scott Ave
Rockville, MD 20851
|
1,188 sq. feet
|
1 baths 3 beds |
show details | |

|
#32
Prosperity Ave
Fairfax, VA 22031
|
2,090 sq. feet
|
3 baths 4 beds |
show details | |

|
#33
Commonwealth Blvd
Fairfax, VA 22032
|
2,103 sq. feet
|
2 baths 4 beds |
show details | |

|
#34
Fern Pl NW
Washington, DC 20012
|
1,920 sq. feet
|
1 baths 4 beds |
show details | |

|
#35
Lees Corner Rd
Chantilly, VA 20151
|
1,216 sq. feet
|
1 baths 3 beds |
show details | |

|
#36
Tremayne Pl Apt 309
Mc Lean, VA 22102
|
1,180 sq. feet
|
2 baths 2 beds |
show details | |

|
#37
Buhrstone Dr
Montgomery Village, MD 20886
|
1,060 sq. feet
|
3 baths 3 beds |
show details | |

|
#38
Rockton Ct
Centreville, VA 20121
|
1,440 sq. feet
|
2 baths 3 beds |
show details | |

|
#39
Kalmia Rd NW
Washington, DC 20012
|
2,382 sq. feet
|
4 baths 4 beds |
show details | |

|
#40
Glen Eagles Dr
Silver Spring, MD 20906
|
3,328 sq. feet
|
3 baths 4 beds |
show details |
| Photo | Address | Area | Beds / Baths | Price | Details |
|---|---|---|---|---|---|

|
#41
Collis Oak Ct
Fairfax, VA 22033
|
1,362 sq. feet
|
3 baths 3 beds |
show details | |

|
#42
Schwenger Pl
Herndon, VA 20170
|
1,530 sq. feet
|
2 baths 3 beds |
show details | |

|
#43
Tayack Pl Unit 203
Alexandria, VA 22312
|
1,322 sq. feet
|
2 baths 2 beds |
show details | |

|
#44
S George Mason Dr Unit 918n
Falls Church, VA 22041
|
752 sq. feet
|
1 baths 1 beds |
show details | |

|
#45
Saddlehorn Ct
Burke, VA 22015
|
1,138 sq. feet
|
2 baths 3 beds |
show details | |

|
#46
Kincheloe Rd
Clifton, VA 20124
|
4,492 sq. feet
|
4 baths 5 beds |
show details | |

|
#47
Peppertree Ln
Silver Spring, MD 20906
|
1,309 sq. feet
|
2 baths 3 beds |
show details | |

|
#48
Canfield Ter
Sterling, VA 20164
|
1,680 sq. feet
|
3 baths 3 beds |
show details | |

|
#49
Counsellor Dr
Vienna, VA 22181
|
1,916 sq. feet
|
2 baths 5 beds |
show details | |

|
Check over 1 million property listings on Foreclosure.com!
|
browse all offers | |||


- 9,28462.4%White alone
- 3,69924.9%Asian alone
- 6864.6%Two or more races
- 5743.9%Hispanic
- 3562.4%Other race alone
- 1601.1%Black alone
- 30.02%Native Hawaiian and Other
Pacific Islander alone
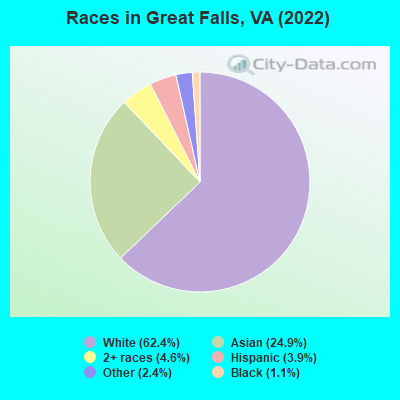
Races in Great Falls detailed stats: ancestries, foreign born residents, place of birth
According to our research of Virginia and other state lists, there was 1 registered sex offender living in Great Falls, Virginia as of April 27, 2024.
The ratio of all residents to sex offenders in Great Falls is 15,866 to 1.
The ratio of registered sex offenders to all residents in this city is much lower than the state average.
 Recent articles from our blog. Our writers, many of them Ph.D. graduates or candidates, create easy-to-read articles on a wide variety of topics.

 | Is Arlington losing its charm? (63 replies) |
| Moving to DC area, looking for best NoVa city recommendation: Great Falls? (56 replies) |
| Is NoVA worth the price? Richmond VS NoVA (McLean, Great Falls) (31 replies) |
| Towns/Cities to look at moving to (25 replies) |
| Commute Great Falls to Tysons Corner -- what to consider (6 replies) |
| Great Falls/Vienna Teens at Langley High School (6 replies) |
Latest news from Great Falls, VA collected exclusively by city-data.com from local newspapers, TV, and radio stations
Ancestries: English (7.4%), Iranian (7.1%), Irish (5.1%), German (5.0%), American (4.8%), Italian (3.7%).
Current Local Time: EST time zone
Elevation: 341 feet
Land area: 17.9 square miles.
Population density: 863 people per square mile (low).
3,644 residents are foreign born (18.7% Asia, 2.8% Europe).
| This place: | 24.5% |
| Virginia: | 12.6% |
Median real estate property taxes paid for housing units with mortgages in 2022: $10,018 (0.8%)
Median real estate property taxes paid for housing units with no mortgage in 2022: $9,885 (0.8%)
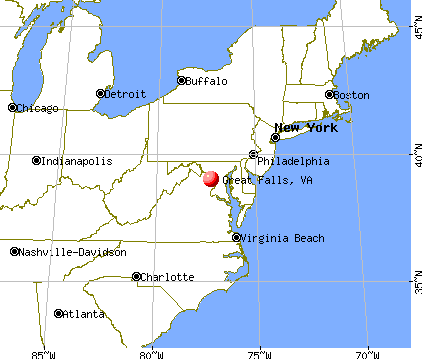
Nearest city with pop. 50,000+: Reston, VA  (4.7 miles , pop. 56,407).
Nearest city with pop. 200,000+: Washington, DC (15.7 miles , pop. 572,059).
Nearest city with pop. 1,000,000+: Philadelphia, PA (133.3 miles , pop. 1,517,550).
Nearest cities:
), ), ), ), Latitude: 39.00 N, Longitude: 77.28 W
Daytime population change due to commuting: -2,316 (-15.6%)
Workers who live and work in this place: 3,440 (48.8%)
Property values in Great Falls, VA
| Here: | 2.3% |
| Virginia: | 2.7% |
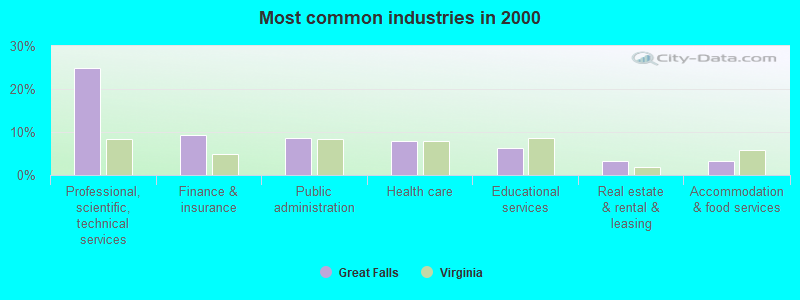
- Professional, scientific, technical services (24.9%)
- Finance & insurance (9.3%)
- Public administration (8.7%)
- Health care (7.9%)
- Educational services (6.2%)
- Real estate & rental & leasing (3.3%)
- Accommodation & food services (3.2%)
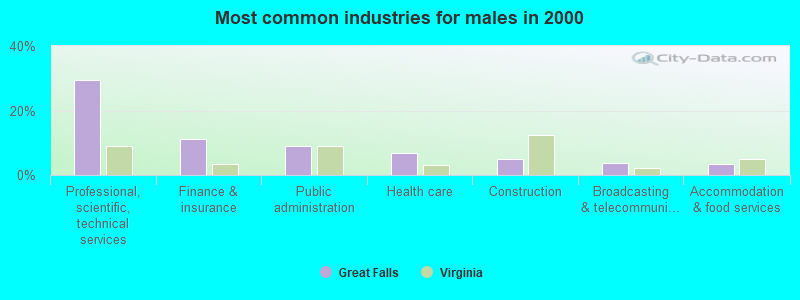
- Professional, scientific, technical services (29.5%)
- Finance & insurance (11.1%)
- Public administration (9.1%)
- Health care (7.0%)
- Construction (4.8%)
- Broadcasting & telecommunications (3.7%)
- Accommodation & food services (3.5%)
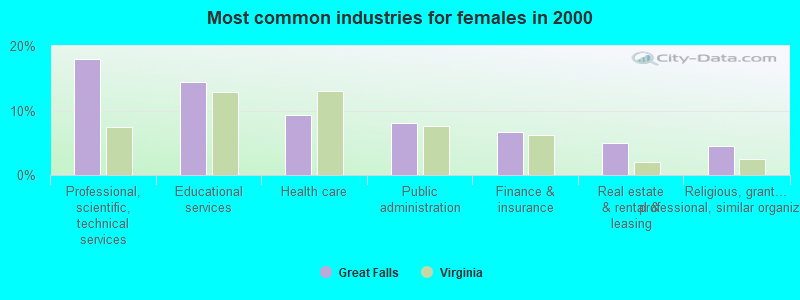
- Professional, scientific, technical services (17.9%)
- Educational services (14.5%)
- Health care (9.4%)
- Public administration (8.0%)
- Finance & insurance (6.7%)
- Real estate & rental & leasing (5.0%)
- Religious, grantmaking, civic, professional, similar organizations (4.5%)
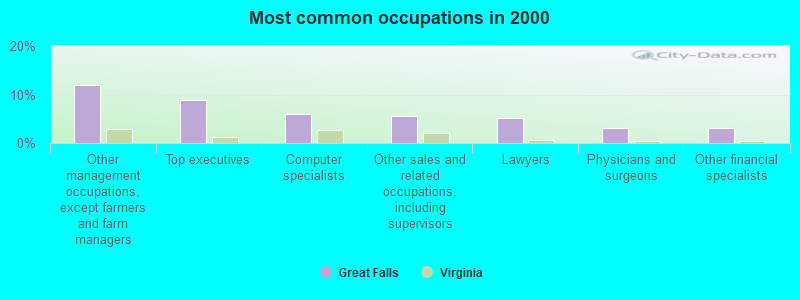
- Other management occupations, except farmers and farm managers (11.9%)
- Top executives (8.9%)
- Computer specialists (6.1%)
- Other sales and related occupations, including supervisors (5.7%)
- Lawyers (5.2%)
- Physicians and surgeons (3.2%)
- Other financial specialists (3.1%)
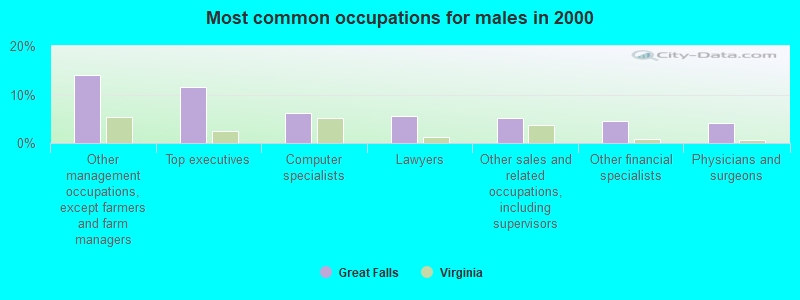
- Other management occupations, except farmers and farm managers (14.0%)
- Top executives (11.6%)
- Computer specialists (6.3%)
- Lawyers (5.6%)
- Other sales and related occupations, including supervisors (5.1%)
- Other financial specialists (4.5%)
- Physicians and surgeons (4.1%)
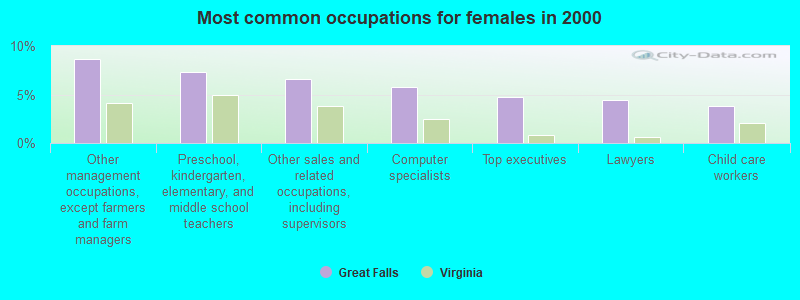
- Other management occupations, except farmers and farm managers (8.7%)
- Preschool, kindergarten, elementary, and middle school teachers (7.3%)
- Other sales and related occupations, including supervisors (6.6%)
- Computer specialists (5.8%)
- Top executives (4.8%)
- Lawyers (4.5%)
- Child care workers (3.9%)
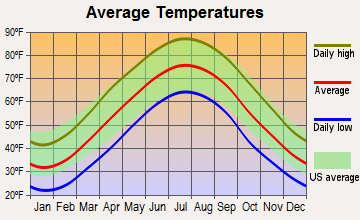
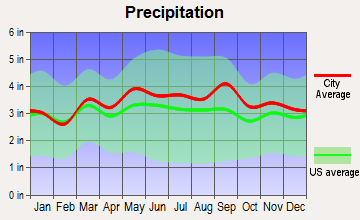
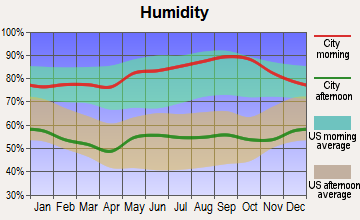
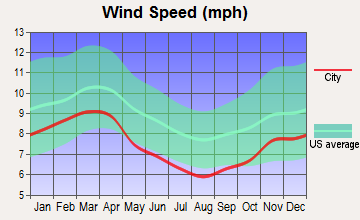
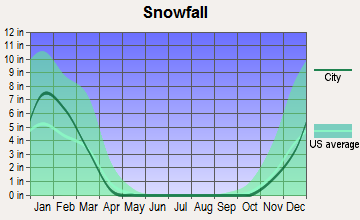
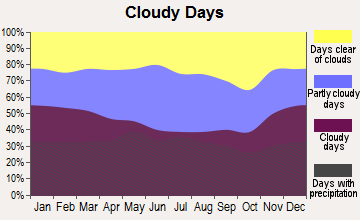
Average climate in Great Falls, Virginia
Based on data reported by over 4,000 weather stations
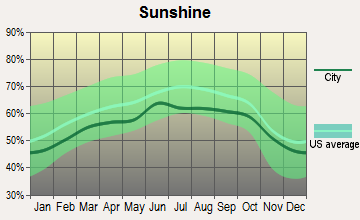
(lower is better)
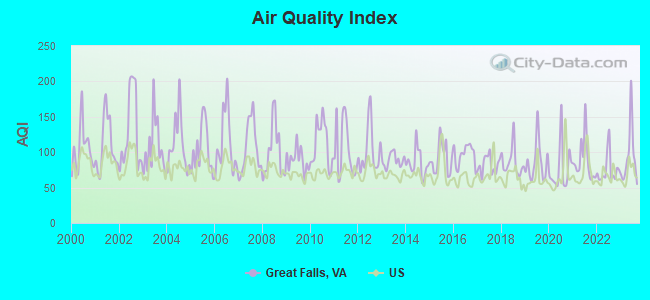
Air Quality Index (AQI) level in 2023 was 93.5. This is worse than average.
| City: | 93.5 |
| U.S.: | 72.6 |
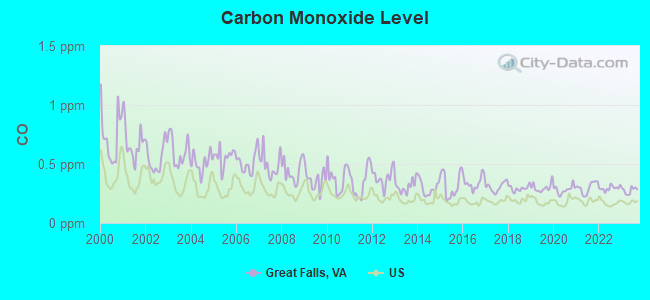
Carbon Monoxide (CO) [ppm] level in 2023 was 0.276. This is about average. Closest monitor was 6.6 miles away from the city center.
| City: | 0.276 |
| U.S.: | 0.251 |
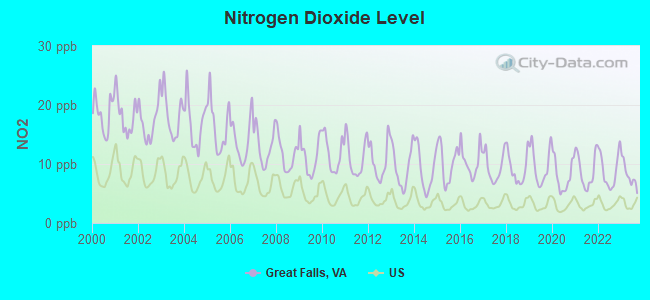
Nitrogen Dioxide (NO2) [ppb] level in 2023 was 8.10. This is significantly worse than average. Closest monitor was 1.7 miles away from the city center.
| City: | 8.10 |
| U.S.: | 5.11 |
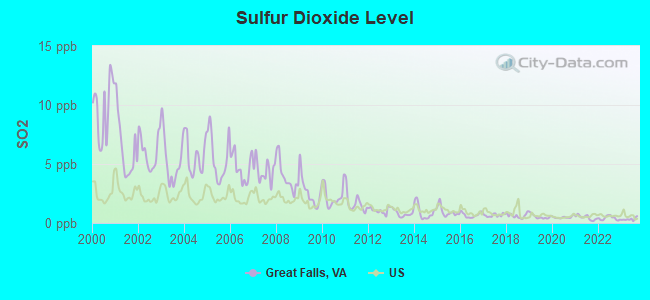
Sulfur Dioxide (SO2) [ppb] level in 2023 was 0.329. This is significantly better than average. Closest monitor was 1.7 miles away from the city center.
| City: | 0.329 |
| U.S.: | 1.515 |
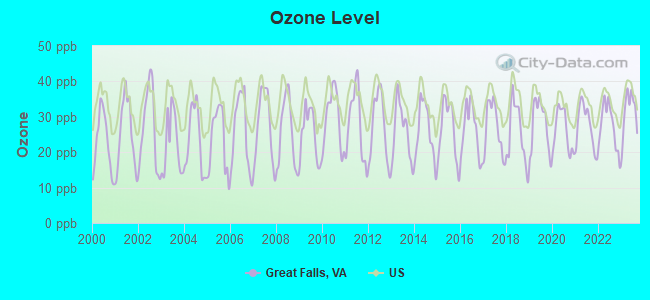
Ozone [ppb] level in 2023 was 31.4. This is about average. Closest monitor was 6.6 miles away from the city center.
| City: | 31.4 |
| U.S.: | 33.3 |
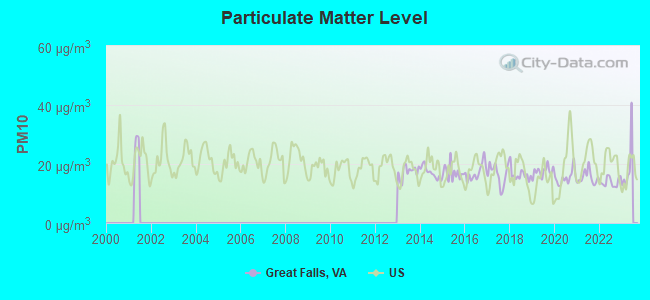
Particulate Matter (PM10) [µg/m3] level in 2022 was 13.9. This is better than average. Closest monitor was 6.2 miles away from the city center.
| City: | 13.9 |
| U.S.: | 19.2 |

Particulate Matter (PM2.5) [µg/m3] level in 2023 was 9.05. This is about average. Closest monitor was 6.6 miles away from the city center.
| City: | 9.05 |
| U.S.: | 8.11 |
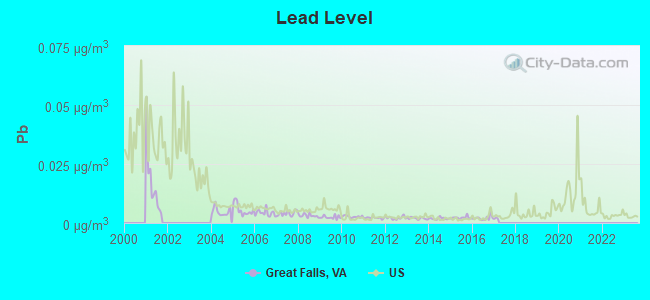
Lead (Pb) [µg/m3] level in 2016 was 0.00212. This is significantly better than average. Closest monitor was 1.7 miles away from the city center.
| City: | 0.00212 |
| U.S.: | 0.00931 |
Tornado activity:
Great Falls-area historical tornado activity is above Virginia state average. It is 10% greater than the overall U.S. average.
On 9/5/1979, a category F3 (max. wind speeds 158-206 mph) tornado 0.7 miles away from the Great Falls place center killed one person and injured 6 people and caused between $500,000 and $5,000,000 in damages.
On 4/28/2002, a category F4 (max. wind speeds 207-260 mph) tornado 31.7 miles away from the place center killed 3 people and injured 122 people and caused $124 million in damages.
Earthquake activity:
Great Falls-area historical earthquake activity is significantly above Virginia state average. It is 56% smaller than the overall U.S. average.On 8/23/2011 at 17:51:04, a magnitude 5.8 (5.8 MW, Depth: 3.7 mi, Class: Moderate, Intensity: VI - VII) earthquake occurred 83.4 miles away from the city center
On 8/25/2011 at 05:07:52, a magnitude 4.5 (4.5 ML, Depth: 4.2 mi, Class: Light, Intensity: IV - V) earthquake occurred 81.8 miles away from the city center
On 1/16/1994 at 01:49:16, a magnitude 4.6 (4.6 MB, 4.6 LG, Depth: 3.1 mi) earthquake occurred 113.3 miles away from the city center
On 12/9/2003 at 20:59:18, a magnitude 4.5 (4.5 ML, Depth: 6.2 mi) earthquake occurred 95.8 miles away from Great Falls center
On 9/25/1998 at 19:52:52, a magnitude 5.2 (4.8 MB, 4.3 MS, 5.2 LG, 4.5 MW, Depth: 3.1 mi) earthquake occurred 238.0 miles away from the city center
On 12/9/2003 at 20:59:14, a magnitude 4.5 (4.5 MB, 4.5 LG) earthquake occurred 103.5 miles away from the city center
Magnitude types: regional Lg-wave magnitude (LG), body-wave magnitude (MB), local magnitude (ML), surface-wave magnitude (MS), moment magnitude (MW)
Natural disasters:
The number of natural disasters in Fairfax County (15) is near the US average (15).Major Disasters (Presidential) Declared: 12
Emergencies Declared: 3
Causes of natural disasters: Winter Storms: 5, Hurricanes: 4, Snowstorms: 3, Storms: 2, Tropical Storms: 2, Blizzard: 1, Flood: 1, Tornado: 1, Wind: 1, Other: 1 (Note: some incidents may be assigned to more than one category).

Hospitals and medical centers near Great Falls:
- RESTON DIALYSIS CENTER (Dialysis Facility, about 5 miles away; RESTON, VA)
- THE MEDICAL TEAM INC (Home Health Center, about 5 miles away; RESTON, VA)
- CAMERON GLEN HEALTH AND REHAB CENTER (Nursing Home, about 5 miles away; HERNDON, VA)
- RESTON HOSPITAL CENTER Acute Care Hospitals (about 6 miles away; RESTON, VA)
- RESTON SURGERY CENTER (Hospital, about 6 miles away; RESTON, VA)
- TRANS-CARE HOME HEALTH LLC (Home Health Center, about 6 miles away; STERLING, VA)
- AMERICAN HEALTH CARE PROFESSIONALS (Home Health Center, about 6 miles away; VIENNA, VA)
Amtrak stations near Great Falls:
- 10 miles: ROCKVILLE (HUNGERFORD DR. & PARK ST.) . Services: partially wheelchair accessible, public payphones, paid short-term parking, paid long-term parking, call for taxi service, public transit connection.
- 10 miles: DULLES INTERNATIONAL AP'T (HERNDON, DULLES INTERNATIONAL AIRPORT) - Bus Station . Services: enclosed waiting area, public restrooms, public payphones, full-service food facilities, paid short-term parking, paid long-term parking, car rental agency, taxi stand, public transit connection.
- 17 miles: WASHINGTON (50 MASSACHUSETTS AVE. N.E.) . Services: ticket office, fully wheelchair accessible, enclosed waiting area, public restrooms, public payphones, full-service food facilities and snack bar, ATM, paid short-term parking, paid long-term parking, car rental agency, taxi stand, public transit connection.
College/University in Great Falls:
Colleges/universities with over 2000 students nearest to Great Falls:
- Stratford University (about 9 miles; Fairfax, VA; Full-time enrollment: 2,570)
- Montgomery College (about 10 miles; Rockville, MD; FT enrollment: 17,999)
- Marymount University (about 11 miles; Arlington, VA; FT enrollment: 3,361)
- Medtech Institute (about 11 miles; Falls Church, VA; FT enrollment: 2,900)
- American University (about 12 miles; Washington, DC; FT enrollment: 9,850)
- Northern Virginia Community College (about 12 miles; Annandale, VA; FT enrollment: 35,721)
- George Mason University (about 12 miles; Fairfax, VA; FT enrollment: 26,002)
Public elementary/middle schools in Great Falls:
- FORESTVILLE ELEM (Students: 756, Location: 1085 UTTERBACK STORE RD, Grades: PK-6)
- GREAT FALLS ELEM (Students: 581, Location: 701 WALKER RD, Grades: PK-6)
Private elementary/middle schools in Great Falls:
Points of interest:
Notable locations in Great Falls: Colvin Run (A), River Bend Country Club (B), Shady Oak (C), Browns Chapel (D), River Bend (E), Riverbend Regional Park Visitor Center (F), Riverbend Nature Center (G), Fairfax County Fire and Rescue Department Station 12 Great Falls (H), Colvin Run Mill (I), Great Falls Library (J). Display/hide their locations on the map
Shopping Centers: Great Falls Center Shopping Center (1), Village Centre Shopping Center (2). Display/hide their locations on the map
Churches in Great Falls include: Great Falls United Methodist Church (A), Forestville Church (B), Calvary Baptist Church (C), House of God Church (D), Saint Francis Episcopal Church (E), Christ the King Lutheran Church (F). Display/hide their locations on the map
Cemeteries: Forestville Cemetery (1), Arnon Cemetery (2). Display/hide their locations on the map
Lakes and reservoirs: Black Pond (A), Impoundment on Piney Run (B), Lake Werowance (C). Display/hide their locations on the map
Streams, rivers, and creeks: Rocky Run (A), Piney Run (B), Mine Run Branch (C), Jefferson Branch (D), Difficult Run (E). Display/hide their locations on the map
Parks in Great Falls include: Lexington Estates Park (1), Riverbend Regional Park (2), Northern Virginia Regional Park (3), Riverview Park (4). Display/hide their locations on the map
Tourist attraction: Fairfax County - Libraries- Regional Libraries- Community Libraries- Great F (Cultural Attractions- Events- & Facilities; 9830 Georgetown Pike) (1). Display/hide its approximate location on the map
Hotel: Helms Briscoe Performace (774 Walker Road) (1). Display/hide its approximate location on the map
Birthplace of: Kate Ziegler - International swimmer, Paula Cale - Television actor.
Drinking water stations with addresses in Great Falls and their reported violations in the past:
RIVERBEND GOLF-BACK NINE FAC (Population served: 110, Groundwater):Past monitoring violations:RIVERBEND PARK NATURE CENTER (Address: 8700 POTOMAC HILLS STREET , Population served: 25, Groundwater):
- 4 routine major monitoring violations
Past monitoring violations:RIVERBEND PARK (Address: 8700 POTOMAC HILLS STREET , Population served: 25, Groundwater):
- 2 routine major monitoring violations
Past health violations:Past monitoring violations:
- MCL, Monthly (TCR) - In JAN-2010, Contaminant: Coliform. Follow-up actions: St Formal NOV issued (JAN-22-2010), St Public Notif requested (JAN-22-2010), St Compliance achieved (MAR-22-2010)
- MCL, Monthly (TCR) - In DEC-2009, Contaminant: Coliform. Follow-up actions: St Formal NOV issued (DEC-18-2009), St Public Notif requested (DEC-18-2009), St Public Notif received (DEC-28-2009), St Compliance achieved (MAR-22-2010)
- MCL, Monthly (TCR) - In OCT-2009, Contaminant: Coliform. Follow-up actions: St Public Notif requested (OCT-14-2009), St Formal NOV issued (OCT-14-2009), St Public Notif received (OCT-26-2009), St Compliance achieved (MAR-22-2010)
- MCL, Monthly (TCR) - In JUL-2009, Contaminant: Coliform. Follow-up actions: St Public Notif requested (JUL-29-2009), St Formal NOV issued (JUL-29-2009), St Public Notif received (AUG-14-2009), St Compliance achieved (MAR-22-2010)
- MCL, Monthly (TCR) - In AUG-2007, Contaminant: Coliform. Follow-up actions: St Formal NOV issued (SEP-06-2007), St Public Notif requested (SEP-06-2007), St Compliance achieved (SEP-24-2007), St Public Notif received (AUG-26-2009)
- MCL, Monthly (TCR) - In JUL-2007, Contaminant: Coliform. Follow-up actions: St Formal NOV issued (JUL-26-2007), St Public Notif requested (JUL-26-2007), St Public Notif received (AUG-03-2007), St Compliance achieved (SEP-24-2007)
- MCL, Monthly (TCR) - Between AUG-2005 and OCT-2005, Contaminant: Coliform. Follow-up actions: St Public Notif requested (OCT-12-2005), St Formal NOV issued (OCT-12-2005)
- One routine major monitoring violation
- 3 minor monitoring violations
| This place: | 3.1 people |
| Virginia: | 2.5 people |
| This place: | 89.2% |
| Whole state: | 67.0% |
| This place: | 1.7% |
| Whole state: | 5.7% |
Likely homosexual households (counted as self-reported same-sex unmarried-partner households)
- Lesbian couples: 0.2% of all households
- Gay men: 0.2% of all households
Banks with branches in Great Falls (2011 data):
- Wells Fargo Bank, National Association: Great Falls Branch at 750 Walker Road, branch established on 1979/03/13. Info updated 2011/04/05: Bank assets: $1,161,490.0 mil, Deposits: $905,653.0 mil, headquarters in Sioux Falls, SD, positive income, 6395 total offices, Holding Company: Wells Fargo & Company
- WashingtonFirst Bank: Great Falls Branch at 9851 Georgetown Pike, branch established on 2007/09/12. Info updated 2008/05/30: Bank assets: $559.4 mil, Deposits: $483.4 mil, headquarters in Reston, VA, positive income, Commercial Lending Specialization, 10 total offices, Holding Company: Washingtonfirst Bankshares, Inc.
- Capital One, National Association: Great Falls Branch at 9863 Georgetown Pike, branch established on 2000/02/10. Info updated 2011/07/01: Bank assets: $133,477.8 mil, Deposits: $97,063.7 mil, headquarters in Mclean, VA, positive income, 984 total offices, Holding Company: Capital One Financial Corporation
- SunTrust Bank: Great Falls Branch at 9912 Georgetown Pike, branch established on 1961/09/23. Info updated 2010/05/27: Bank assets: $171,291.7 mil, Deposits: $129,833.2 mil, headquarters in Atlanta, GA, positive income, Commercial Lending Specialization, 1716 total offices, Holding Company: Suntrust Banks, Inc.
- Bank of America, National Association: Great Falls Banking Center at 748 Walker Road, branch established on 2004/12/20. Info updated 2009/11/18: Bank assets: $1,451,969.3 mil, Deposits: $1,077,176.8 mil, headquarters in Charlotte, NC, positive income, 5782 total offices, Holding Company: Bank Of America Corporation
- Branch Banking and Trust Company: Great Falls Branch at 9915 Georgetown Pike, branch established on 1983/04/25. Info updated 2010/03/29: Bank assets: $168,867.6 mil, Deposits: $127,549.5 mil, headquarters in Winston Salem, NC, positive income, Commercial Lending Specialization, 1793 total offices, Holding Company: Bb&T Corporation
For population 15 years and over in Great Falls:
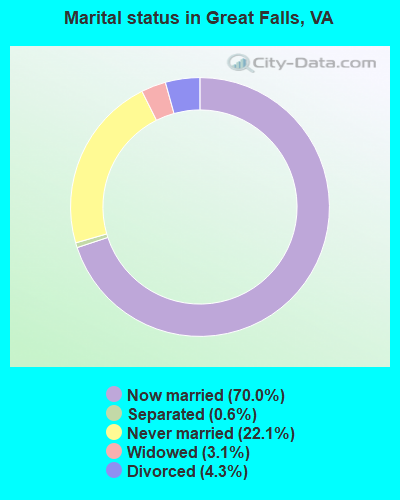
- Never married: 22.1%
- Now married: 70.0%
- Separated: 0.6%
- Widowed: 3.1%
- Divorced: 4.3%
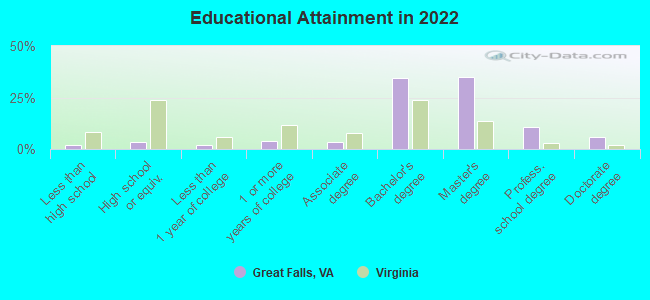
For population 25 years and over in Great Falls:
- High school or higher: 97.8%
- Bachelor's degree or higher: 84.5%
- Graduate or professional degree: 50.0%
- Unemployed: 1.3%
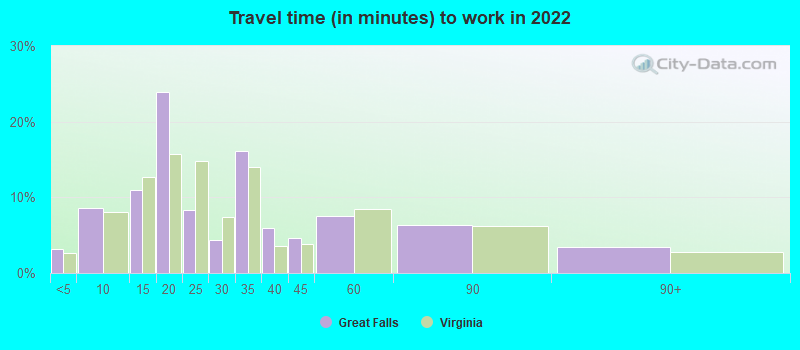
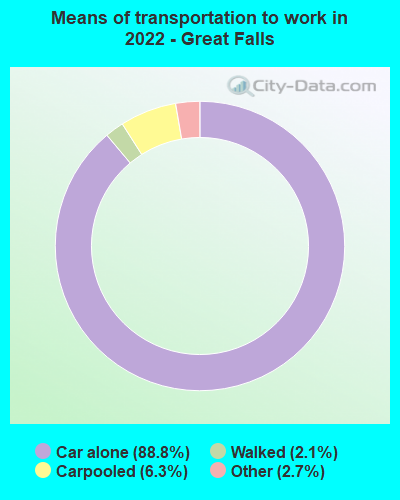
- Mean travel time to work (commute): 18.9 minutes
| Here: | 7.8 |
| Virginia average: | 12.1 |
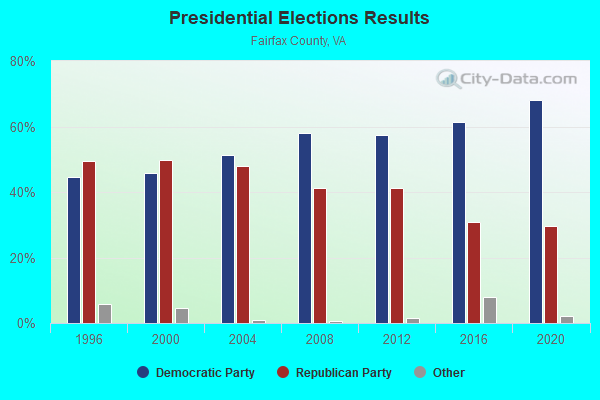
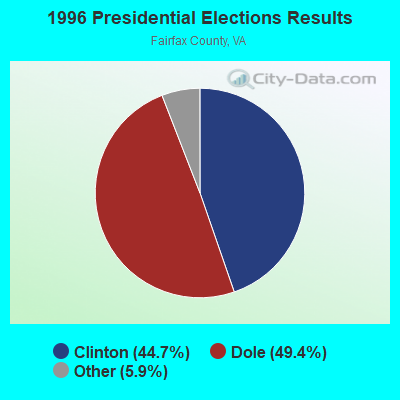
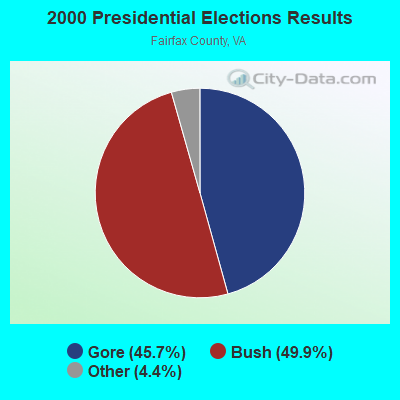
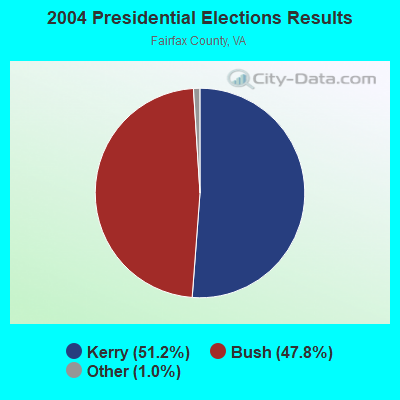
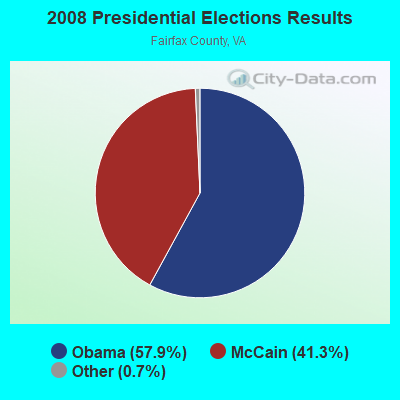
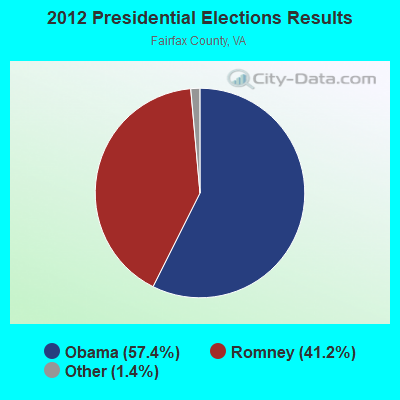
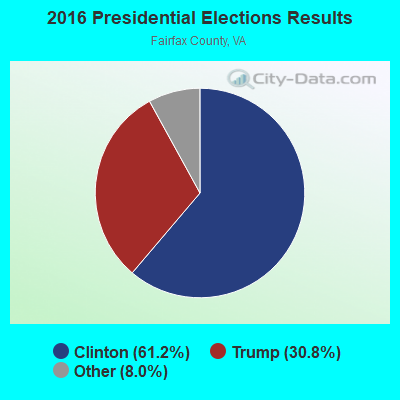
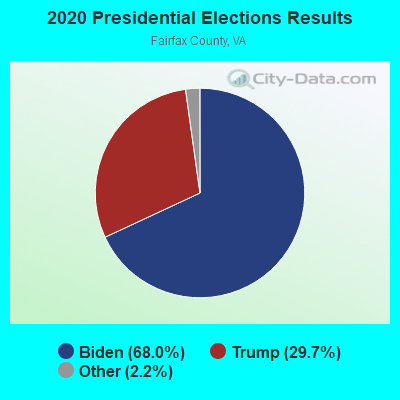
Graphs represent county-level data. Detailed 2008 Election Results
Religion statistics for Great Falls, VA (based on Fairfax County data)
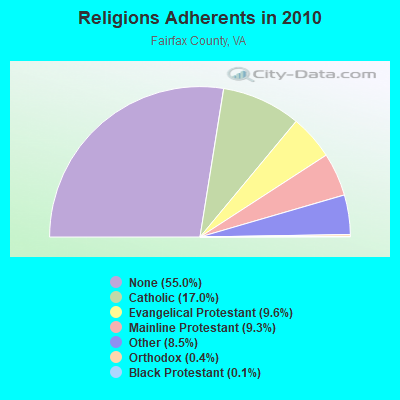
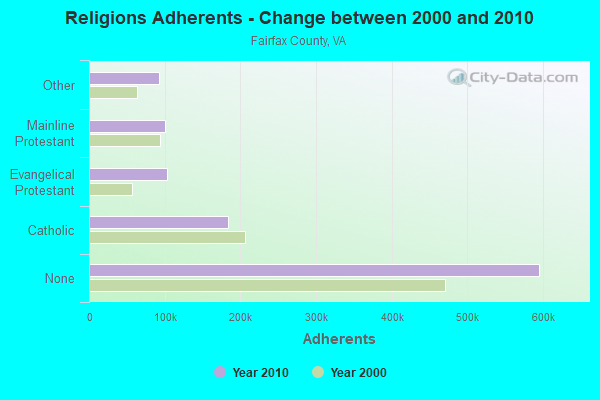
| Religion | Adherents | Congregations |
|---|---|---|
| Catholic | 184,183 | 29 |
| Evangelical Protestant | 103,522 | 316 |
| Mainline Protestant | 100,525 | 146 |
| Other | 91,925 | 119 |
| Orthodox | 4,694 | 8 |
| Black Protestant | 1,509 | 9 |
| None | 595,368 | - |
Food Environment Statistics:
| Fairfax County: | 1.81 / 10,000 pop. |
| Virginia: | 2.03 / 10,000 pop. |
| Fairfax County: | 0.03 / 10,000 pop. |
| Virginia: | 0.17 / 10,000 pop. |
| This county: | 1.29 / 10,000 pop. |
| Virginia: | 1.43 / 10,000 pop. |
| This county: | 1.62 / 10,000 pop. |
| Virginia: | 4.03 / 10,000 pop. |
| This county: | 6.90 / 10,000 pop. |
| Virginia: | 7.65 / 10,000 pop. |
| Here: | 7.2% |
| Virginia: | 9.3% |
| Fairfax County: | 22.2% |
| Virginia: | 26.7% |
| Fairfax County: | 27.6% |
| Virginia: | 18.6% |
Health and Nutrition:
| This city: | 58.7% |
| State: | 50.6% |
| Here: | 59.5% |
| State: | 48.6% |
| This city: | 27.7 |
| State: | 28.6 |
| Here: | 17.7% |
| Virginia: | 20.2% |
| Here: | 8.0% |
| State: | 10.5% |
| This city: | 7.0 |
| State: | 6.8 |
| Here: | 34.2% |
| Virginia: | 33.5% |
| Here: | 64.1% |
| Virginia: | 57.4% |
| Here: | 81.4% |
| Virginia: | 80.5% |
More about Health and Nutrition of Great Falls, VA Residents
8.87% of this county's 2021 resident taxpayers lived in other counties in 2020 ($108,323 average adjusted gross income)
| Here: | 8.87% |
| Virginia average: | 10.16% |
0.19% of residents moved from foreign countries ($2,634 average AGI)
Fairfax County: 0.19% Virginia average: 0.12%
Top counties from which taxpayers relocated into this county between 2020 and 2021:
| from Arlington County, VA | |
| from Alexandria city, VA | |
| from Loudoun County, VA |
10.12% of this county's 2020 resident taxpayers moved to other counties in 2021 ($118,643 average adjusted gross income)
| Here: | 10.12% |
| Virginia average: | 10.20% |
0.16% of residents moved to foreign countries ($2,238 average AGI)
Fairfax County: 0.16% Virginia average: 0.09%
Top counties to which taxpayers relocated from this county between 2020 and 2021:
| to Loudoun County, VA | |
| to Prince William County, VA | |
| to Arlington County, VA |
| Businesses in Great Falls, VA | ||||
| Name | Count | Name | Count | |
|---|---|---|---|---|
| 7-Eleven | 1 | Safeway | 1 | |
| Arby's | 1 | Subway | 1 | |
| Domino's Pizza | 1 | UPS | 2 | |
| FedEx | 4 | Vons | 1 | |
Strongest AM radio stations in Great Falls:
- WMET (1150 AM; 50 kW; GAITHERSBURG, MD; Owner: BELTWAY ACQUISITION CORPORATION)
- WUST (1120 AM; daytime; 20 kW; WASHINGTON, DC)
- WTOP (1500 AM; 50 kW; WASHINGTON, DC; Owner: BONNEVILLE HOLDING COMPANY)
- WTNT (570 AM; 5 kW; BETHESDA, MD; Owner: AMFM RADIO LICENSES, L.L.C.)
- WTEM (980 AM; 50 kW; WASHINGTON, DC; Owner: AMFM RADIO LICENSES, L.L.C.)
- WMAL (630 AM; 5 kW; WASHINGTON, DC; Owner: WMAL, INC.)
- WCTN (950 AM; 2 kW; POTOMAC-CABIN JOHN, MD; Owner: SEVEN LOCKS BROADCASTING COMPANY, INC.)
- WPGC (1580 AM; 50 kW; MORNINGSIDE, MD; Owner: INFINITY WPGC(AM), INC.)
- WCBM (680 AM; 50 kW; BALTIMORE, MD; Owner: WCBM MARYLAND, INC.)
- WABS (780 AM; daytime; 5 kW; ARLINGTON, VA; Owner: SALEM MEDIA OF VIRGINIA, INC.)
- WZHF (1390 AM; 5 kW; ARLINGTON, VA; Owner: WAY BROADCASTING, INC.)
- WKCW (1420 AM; 50 kW; WARRENTON, VA; Owner: WAY BROADCASTING, INC.)
- WFAX (1220 AM; 5 kW; FALLS CHURCH, VA; Owner: NEWCOMB BROADCASTING CORP.)
Strongest FM radio stations in Great Falls:
- WJFK-FM (106.7 FM; MANASSAS, VA; Owner: INFINITY BROADCASTING CORP. OF WASHINGTON, DC)
- WARW (94.7 FM; BETHESDA, MD; Owner: INFINITY BROADCASTING OPERATIONS, INC.)
- WIHT (99.5 FM; WASHINGTON, DC; Owner: AMFM RADIO LICENSES, L.L.C.)
- WJZW (105.9 FM; WOODBRIDGE, VA; Owner: WMAL, INC.)
- WASH (97.1 FM; WASHINGTON, DC; Owner: AMFM RADIO LICENSES, L.L.C.)
- WMZQ-FM (98.7 FM; WASHINGTON, DC; Owner: AMFM RADIO LICENSES, L.L.C.)
- WRQX (107.3 FM; WASHINGTON, DC; Owner: WMAL, INC.)
- WHUR-FM (96.3 FM; WASHINGTON, DC; Owner: THE HOWARD UNIVERSITY)
- WWDC-FM (101.1 FM; WASHINGTON, DC; Owner: AMFM RADIO LICENSES, L.L.C.)
- WKYS (93.9 FM; WASHINGTON, DC; Owner: RADIO ONE LICENSES, LLC)
- WGTS (91.9 FM; TAKOMA PARK, MD; Owner: COLUMBIA UNION COLLEGE BROADCASTING, INC.)
- WETA (90.9 FM; WASHINGTON, DC; Owner: GREATER WASHINGTON EDUCATIONAL TELECOMMUNICATIONS ASSN.)
- WAVA (105.1 FM; ARLINGTON, VA; Owner: SALEM MEDIA OF VIRGINIA, INC.)
- WGMS-FM (103.5 FM; WASHINGTON, DC; Owner: BONNEVILLE HOLDING COMPANY)
- WAMU (88.5 FM; WASHINGTON, DC; Owner: THE EXEC. COMM. OF THE BD. OF TRUSTEES OF AMERICAN UNIV.)
- WMMJ (102.3 FM; BETHESDA, MD; Owner: RADIO ONE LICENSES, LLC)
- WCSP-FM (90.1 FM; WASHINGTON, DC; Owner: NATIONAL CABLE SATELLITE CORPORATION)
- WPFW (89.3 FM; WASHINGTON, DC; Owner: PACIFICA FOUNDATION, INC.)
- WBIG-FM (100.3 FM; WASHINGTON, DC; Owner: AMFM RADIO LICENSES, L.L.C.)
- W228BA (93.5 FM; LEESBURG, VA; Owner: CSN INTERNATIONAL)
TV broadcast stations around Great Falls:
- WETA-TV (Channel 26; WASHINGTON, DC; Owner: THE GREATER WASHINGTON ED TELECOMM. ASSOC)
- WTTG (Channel 5; WASHINGTON, DC; Owner: FOX TELEVISION STATIONS, INC.)
- WDCA (Channel 20; WASHINGTON, DC; Owner: FOX TELEVISION STATIONS, INC.)
- WJLA-TV (Channel 7; WASHINGTON, DC; Owner: ACC LICENSEE, INC.)
- WUSA (Channel 9; WASHINGTON, DC; Owner: THE DETROIT NEWS, INC.)
- WNVC (Channel 56; FAIRFAX, VA; Owner: COMMONWEALTH PUBLIC BROADCASTING CORPORATION)
- WHUT-TV (Channel 32; WASHINGTON, DC; Owner: HOWARD UNIVERSITY)
- WRC-TV (Channel 4; WASHINGTON, DC; Owner: NBC SUBSIDIARY (WRC-TV), INC.)
- WBDC-TV (Channel 50; WASHINGTON, DC; Owner: WBDC BROADCASTING, INC.)
- W28BY (Channel 63; BALTIMORE, MD; Owner: INFORMATION SUPER STATION, L.L.C.)
- WPXW (Channel 66; MANASSAS, VA; Owner: PAXSON WASHINGTON LICENSE, INC.)
- WMDO-CA (Channel 30; WASHINGTON, DC; Owner: ENTRAVISION HOLDINGS, LLC)
- WZDC-LP (Channel 64; WASHINGTON, DC; Owner: ONDA CAPITAL, INC.)
- W42BE (Channel 42; FAIRFAX, VA; Owner: FAIRFAX LOW POWER CO.)
- WBAL-TV (Channel 11; BALTIMORE, MD; Owner: WBAL HEARST-ARGYLE TV, INC. (CA CORP.))
- WMAR-TV (Channel 2; BALTIMORE, MD; Owner: SCRIPPS HOWARD BROADCASTING COMPANY)
- WBFF (Channel 45; BALTIMORE, MD; Owner: CHESAPEAKE TELEVISION LICENSEE, LLC)
- WNUV (Channel 54; BALTIMORE, MD; Owner: BALTIMORE (WNUV-TV) LICENSEE, INC.)
- WFPT (Channel 62; FREDERICK, MD; Owner: MARYLAND PUBLIC BROADCASTING COMMISSION)
- WUTB (Channel 24; BALTIMORE, MD; Owner: FOX TELEVISION STATIONS, INC.)
- WMPB (Channel 67; BALTIMORE, MD; Owner: MARYLAND PUBLIC BROADCASTING COMMISSION)
- WKRP-LP (Channel 42; WASHINGTON, DC; Owner: CAPITAL MEDIA, LLC)
- WMPT (Channel 22; ANNAPOLIS, MD; Owner: MARYLAND PUBLIC BROADCASTING COMMISSION)
- WNVT (Channel 53; GOLDVEIN, VA; Owner: COMMONWEALTH PUBLIC BROADCASTING CORPORATION)
- WJZ-TV (Channel 13; BALTIMORE, MD; Owner: VIACOM INC.)
- National Bridge Inventory (NBI) Statistics
- 6Number of bridges
- 23ft / 7.5mTotal length
- $864,000Total costs
- 34,001Total average daily traffic
- 1,010Total average daily truck traffic
- 47,412Total future (year 2040) average daily traffic
FCC Registered Antenna Towers:
26 (See the full list of FCC Registered Antenna Towers in Great Falls)FCC Registered Broadcast Land Mobile Towers:
2- Great Falls Library, 9830 Georgetown Pike (Lat: 38.998167 Lon: -77.286722), Type: Pole, Structure height: 0 m, Overall height: 15 m, Call Sign: WQHS749,
Assigned Frequencies: 1.67000 MHz, Grant Date: 10/21/2017, Expiration Date: 10/26/2027, Certifier: Anthony H Griffin, Registrant: Jep Telecom Licensing Services, 20210 Ragazza Circle, Unit 201, Venice, FL 34293-3354, Phone: (941) 441-6830, Email:
- Lat: 38.998889 Lon: -77.313889, Call Sign: WQSB515,
Assigned Frequencies: 451.687 MHz, 452.287 MHz, Grant Date: 08/27/2013, Expiration Date: 08/27/2023, Cancellation Date: 10/28/2023, Certifier: John F Burke, Registrant: National License, 12591 Brompton Road, Carmel, IN 46033, Phone: (317) 564-8018, Fax: (317) 564-8335, Email:
FCC Registered Microwave Towers:
2- VA-WSH092A, 9916 Georgetown Pike (Lat: 38.999083 Lon: -77.291806), Type: Tower, Structure height: 61 m, Call Sign: WQGT570,
Assigned Frequencies: 17960.0 MHz, 21875.0 MHz, 11445.0 MHz, Grant Date: 04/12/2007, Expiration Date: 04/12/2017, Cancellation Date: 10/16/2008, Certifier: Nadja S Sodos-Wallace, Registrant: Clearwire Corporation, 815 Connecticut Avenue, Nw, Suite 610, Washington, DC 20006, Phone: (202) 330-4011, Fax: (202) 330-4008, Email:
- CCI806806, 9916 Georgetown Pike (Lat: 38.999083 Lon: -77.291806), Type: Ltower, Structure height: 60.4 m, Overall height: 60.9 m, Call Sign: WQRA398, Licensee ID: L01604521,
Assigned Frequencies: 6256.54 MHz, 6315.84 MHz, 6404.79 MHz, Grant Date: 04/03/2013, Expiration Date: 04/03/2023, Cancellation Date: 06/03/2023, Certifier: Brian Sullivan, Registrant: Fundamental Broadcasting LLC, 1209 Orange Street, Wilmington, DE 19801, Phone: (302) 658-7581
FCC Registered Amateur Radio Licenses:
153 (See the full list of FCC Registered Amateur Radio Licenses in Great Falls)FAA Registered Aircraft:
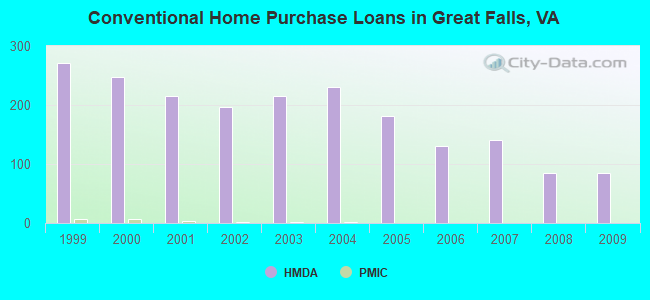
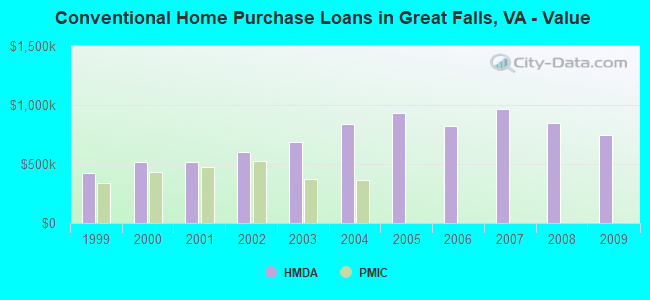
29 (See the full list of FAA Registered Aircraft in Great Falls)| Home Mortgage Disclosure Act Aggregated Statistics For Year 2009 (Based on 3 partial tracts) | ||||||||||
| A) FHA, FSA/RHS & VA Home Purchase Loans | B) Conventional Home Purchase Loans | C) Refinancings | D) Home Improvement Loans | F) Non-occupant Loans on < 5 Family Dwellings (A B C & D) | ||||||
|---|---|---|---|---|---|---|---|---|---|---|
| Number | Average Value | Number | Average Value | Number | Average Value | Number | Average Value | Number | Average Value | |
| LOANS ORIGINATED | 8 | $671,490 | 84 | $744,805 | 422 | $544,831 | 9 | $274,260 | 10 | $819,441 |
| APPLICATIONS APPROVED, NOT ACCEPTED | 0 | $0 | 11 | $937,050 | 30 | $537,995 | 1 | $9,880 | 1 | $580,400 |
| APPLICATIONS DENIED | 1 | $772,590 | 11 | $777,345 | 90 | $699,569 | 1 | $118,820 | 2 | $467,435 |
| APPLICATIONS WITHDRAWN | 2 | $781,795 | 16 | $943,405 | 74 | $777,474 | 4 | $326,275 | 1 | $213,000 |
| FILES CLOSED FOR INCOMPLETENESS | 0 | $0 | 4 | $1,829,200 | 19 | $766,988 | 1 | $162,370 | 0 | $0 |
Detailed HMDA statistics for the following Tracts: 4801.00 , 4803.00, 4804.00
| Private Mortgage Insurance Companies Aggregated Statistics For Year 2009 (Based on 2 partial tracts) | ||||
| A) Conventional Home Purchase Loans | B) Refinancings | |||
|---|---|---|---|---|
| Number | Average Value | Number | Average Value | |
| LOANS ORIGINATED | 0 | $0 | 1 | $580,380 |
| APPLICATIONS APPROVED, NOT ACCEPTED | 0 | $0 | 0 | $0 |
| APPLICATIONS DENIED | 1 | $484,620 | 0 | $0 |
| APPLICATIONS WITHDRAWN | 0 | $0 | 0 | $0 |
| FILES CLOSED FOR INCOMPLETENESS | 0 | $0 | 0 | $0 |
Detailed PMIC statistics for the following Tracts: 4801.00 , 4803.00, 4804.00
2006 - 2018 National Fire Incident Reporting System (NFIRS) incidents
- Fire incident types reported to NFIRS in Great Falls, VA
- 13544.0%Outside Fires
- 12841.7%Structure Fires
- 3611.7%Mobile Property/Vehicle Fires
- 82.6%Other
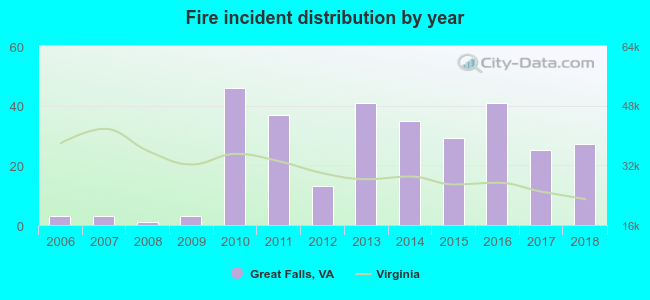 According to the data from the years 2006 - 2018 the average number of fire incidents per year is 23. The highest number of fire incidents - 46 took place in 2010, and the least - 1 in 2008. The data has a growing trend.
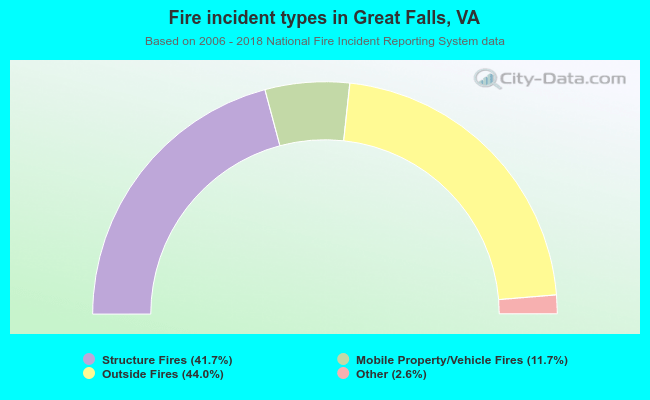 When looking into fire subcategories, the most reports belonged to: Outside Fires (44.0%), and Structure Fires (41.7%).
| Most common first names in Great Falls, VA among deceased individuals | ||
| Name | Count | Lived (average) |
|---|---|---|
| Mary | 49 | 83.0 years |
| John | 40 | 74.2 years |
| William | 28 | 75.6 years |
| James | 26 | 72.6 years |
| Robert | 24 | 78.3 years |
| Margaret | 22 | 85.8 years |
| Charles | 20 | 78.9 years |
| Helen | 20 | 85.3 years |
| Joseph | 19 | 76.1 years |
| Ruth | 18 | 79.3 years |
| Most common last names in Great Falls, VA among deceased individuals | ||
| Last name | Count | Lived (average) |
|---|---|---|
| Thompson | 13 | 76.2 years |
| Jackson | 8 | 79.7 years |
| Smith | 8 | 83.5 years |
| Burgess | 7 | 78.4 years |
| Jones | 7 | 84.3 years |
| Lee | 6 | 79.4 years |
| Johnson | 6 | 77.2 years |
| Oliver | 6 | 81.3 years |
| Rose | 6 | 75.7 years |
| Thomas | 6 | 82.7 years |
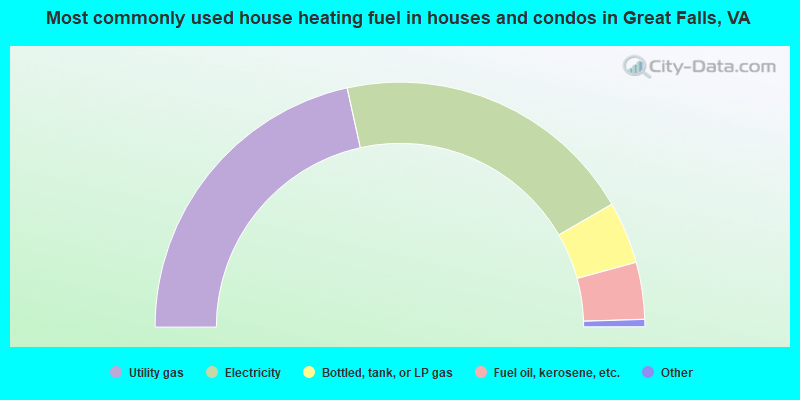
- 43.1%Utility gas
- 40.2%Electricity
- 8.2%Bottled, tank, or LP gas
- 7.5%Fuel oil, kerosene, etc.
- 0.8%Other fuel
- 0.2%Solar energy
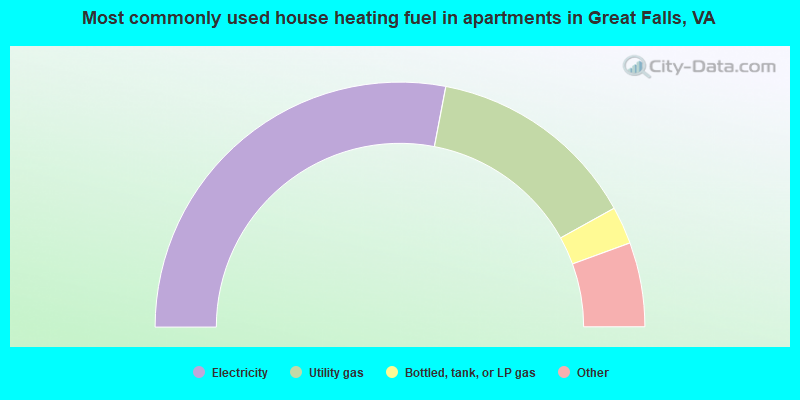
- 56.3%Electricity
- 28.0%Utility gas
- 5.0%Bottled, tank, or LP gas
- 3.8%No fuel used
- 3.4%Fuel oil, kerosene, etc.
- 3.4%Other fuel
Great Falls compared to Virginia state average:
- Median household income significantly above state average.
- Median house value significantly above state average.
- Unemployed percentage significantly below state average.
- Black race population percentage significantly below state average.
- Median age significantly above state average.
- Foreign-born population percentage significantly above state average.
- Renting percentage significantly below state average.
- Length of stay since moving in significantly above state average.
- Number of rooms per house significantly above state average.
- Percentage of population with a bachelor's degree or higher significantly above state average.
Great Falls on our top lists:
- #3 on the list of "Top 101 cities with largest percentage of females in industries: professional, scientific, and technical services (population 5,000+)"
- #5 on the list of "Top 101 cities with largest percentage of males in industries: professional, scientific, and technical services (population 5,000+)"
- #6 on the list of "Top 101 cities with largest percentage of males in occupations: management occupations (population 5,000+)"
- #6 on the list of "Top 100 cities with highest median household income"
- #8 on the list of "Top 101 cities with largest percentage of females in occupations: legal occupations (population 5,000+)"
- #8 on the list of "Top 101 cities with the largest percentage of one, detached housing units in structures (2,000+ housing units)"
- #14 on the list of "Top 101 cities with largest percentage of females in industries: construction (population 5,000+)"
- #18 on the list of "Top 101 cities with the most residents born in Iran (population 500+)"
- #23 on the list of "Top 101 cities with the highest percentage of workers working at home, population 5,000+"
- #26 on the list of "Top 101 cities with largest percentage of females in occupations: management occupations (population 5,000+)"
- #31 on the list of "Top 100 best educated cities (highest percentage of bachelor degree holding residents) (pop. 5,000+)"
- #33 on the list of "Top 100 cities with highest median house value"
- #44 on the list of "Top 101 cities with largest percentage of females in occupations: computer and mathematical occupations (population 5,000+)"
- #48 on the list of "Top 101 cities with the highest percentage of family households, population 10,000+"
- #51 on the list of "Top 101 cities with largest percentage of males in occupations: legal occupations (population 5,000+)"
- #54 on the list of "Top 101 cities with the most people having Master's or Doctorate degrees (population 5,000+)"
- #58 on the list of "Top 100 cities with biggest houses (pop. 5,000+)"
- #72 on the list of "Top 101 cities with the smallest percentage of divorced people (15+ years)(population 5,000+)"
- #100 on the list of "Top 101 cities with the most residents born in Afghanistan (population 500+)"
- #17 (22102) on the list of "Top 101 zip codes with the most big companies in 2005 (at least 1000 employees)"
- #43 (22102) on the list of "Top 101 zip codes with the most medium-big companies in 2005 (at least 100 employees)"
- #60 (22102) on the list of "Top 101 zip codes with the most Internet business establishments in 2005"
- #69 (22066) on the list of "Top 101 zip codes with the largest percentage of taxpayers using charity contributions deductions in 2012 (pop 5,000+)"
- #70 (22066) on the list of "Top 101 zip codes with the highest average reported salary/wage in 2012 (pop 5,000+)"
- #71 (22102) on the list of "Top 101 zip codes with the largest percentage of Arab first ancestries"
- #75 (22102) on the list of "Top 101 zip codes with the highest 2012 average reported profit/loss from business (pop 5,000+)"
- #76 (22066) on the list of "Top 101 zip codes with the highest 2012 average Adjusted Gross Income (AGI) for individuals (pop 5,000+)"
- #94 (22066) on the list of "Top 101 zip codes with the largest percentage of taxpayers reporting net capital gain/loss in 2012 (pop 5,000+)"
- #3 on the list of "Top 101 counties with the largest number of children under 18 without health insurance coverage in 2000 (pop. 50,000+)"
- #4 on the list of "Top 101 counties with the lowest lead air pollution readings in 2012 (µg/m3)"
- #5 on the list of "Top 101 counties with the largest number of people without health insurance coverage in 2000 (pop. 50,000+)"
- #7 on the list of "Top 101 counties with the largest increase in the number of infant deaths per 1000 residents 2000-2006 to 2007-2013 (pop. 50,000+)"
- #13 on the list of "Top 101 counties with the lowest number of deaths per 1000 residents 2007-2013 (pop. 50,000+)"

|
|
Total of 792 patent applications in 2008-2024.