Herndon, Virginia Submit your own pictures of this town and show them to the world
OSM Map
General Map
Google Map
MSN Map
OSM Map
General Map
Google Map
MSN Map
OSM Map
General Map
Google Map
MSN Map
OSM Map
General Map
Google Map
MSN Map
Please wait while loading the map...
Population in 2022: 24,167 (100% urban, 0% rural). Population change since 2000: +11.6%Males: 12,843 Females: 11,324
March 2022 cost of living index in Herndon: 163.4 (very high, U.S. average is 100) Percentage of residents living in poverty in 2022: 7.1%for White Non-Hispanic residents , 8.0% for Black residents , 9.3% for Hispanic or Latino residents , 78.0% for American Indian residents , 8.5% for other race residents , 11.0% for two or more races residents )
Profiles of local businesses
Business Search - 14 Million verified businesses
Data:
Median household income ($)
Median household income (% change since 2000)
Household income diversity
Ratio of average income to average house value (%)
Ratio of average income to average rent
Median household income ($) - White
Median household income ($) - Black or African American
Median household income ($) - Asian
Median household income ($) - Hispanic or Latino
Median household income ($) - American Indian and Alaska Native
Median household income ($) - Multirace
Median household income ($) - Other Race
Median household income for houses/condos with a mortgage ($)
Median household income for apartments without a mortgage ($)
Races - White alone (%)
Races - White alone (% change since 2000)
Races - Black alone (%)
Races - Black alone (% change since 2000)
Races - American Indian alone (%)
Races - American Indian alone (% change since 2000)
Races - Asian alone (%)
Races - Asian alone (% change since 2000)
Races - Hispanic (%)
Races - Hispanic (% change since 2000)
Races - Native Hawaiian and Other Pacific Islander alone (%)
Races - Native Hawaiian and Other Pacific Islander alone (% change since 2000)
Races - Two or more races (%)
Races - Two or more races (% change since 2000)
Races - Other race alone (%)
Races - Other race alone (% change since 2000)
Racial diversity
Unemployment (%)
Unemployment (% change since 2000)
Unemployment (%) - White
Unemployment (%) - Black or African American
Unemployment (%) - Asian
Unemployment (%) - Hispanic or Latino
Unemployment (%) - American Indian and Alaska Native
Unemployment (%) - Multirace
Unemployment (%) - Other Race
Population density (people per square mile)
Population - Males (%)
Population - Females (%)
Population - Males (%) - White
Population - Males (%) - Black or African American
Population - Males (%) - Asian
Population - Males (%) - Hispanic or Latino
Population - Males (%) - American Indian and Alaska Native
Population - Males (%) - Multirace
Population - Males (%) - Other Race
Population - Females (%) - White
Population - Females (%) - Black or African American
Population - Females (%) - Asian
Population - Females (%) - Hispanic or Latino
Population - Females (%) - American Indian and Alaska Native
Population - Females (%) - Multirace
Population - Females (%) - Other Race
Coronavirus confirmed cases (Apr 27, 2024)
Deaths caused by coronavirus (Apr 27, 2024)
Coronavirus confirmed cases (per 100k population) (Apr 27, 2024)
Deaths caused by coronavirus (per 100k population) (Apr 27, 2024)
Daily increase in number of cases (Apr 27, 2024)
Weekly increase in number of cases (Apr 27, 2024)
Cases doubled (in days) (Apr 27, 2024)
Hospitalized patients (Apr 18, 2022)
Negative test results (Apr 18, 2022)
Total test results (Apr 18, 2022)
COVID Vaccine doses distributed (per 100k population) (Sep 19, 2023)
COVID Vaccine doses administered (per 100k population) (Sep 19, 2023)
COVID Vaccine doses distributed (Sep 19, 2023)
COVID Vaccine doses administered (Sep 19, 2023)
Likely homosexual households (%)
Likely homosexual households (% change since 2000)
Likely homosexual households - Lesbian couples (%)
Likely homosexual households - Lesbian couples (% change since 2000)
Likely homosexual households - Gay men (%)
Likely homosexual households - Gay men (% change since 2000)
Cost of living index
Median gross rent ($)
Median contract rent ($)
Median monthly housing costs ($)
Median house or condo value ($)
Median house or condo value ($ change since 2000)
Mean house or condo value by units in structure - 1, detached ($)
Mean house or condo value by units in structure - 1, attached ($)
Mean house or condo value by units in structure - 2 ($)
Mean house or condo value by units in structure by units in structure - 3 or 4 ($)
Mean house or condo value by units in structure - 5 or more ($)
Mean house or condo value by units in structure - Boat, RV, van, etc. ($)
Mean house or condo value by units in structure - Mobile home ($)
Median house or condo value ($) - White
Median house or condo value ($) - Black or African American
Median house or condo value ($) - Asian
Median house or condo value ($) - Hispanic or Latino
Median house or condo value ($) - American Indian and Alaska Native
Median house or condo value ($) - Multirace
Median house or condo value ($) - Other Race
Median resident age
Resident age diversity
Median resident age - Males
Median resident age - Females
Median resident age - White
Median resident age - Black or African American
Median resident age - Asian
Median resident age - Hispanic or Latino
Median resident age - American Indian and Alaska Native
Median resident age - Multirace
Median resident age - Other Race
Median resident age - Males - White
Median resident age - Males - Black or African American
Median resident age - Males - Asian
Median resident age - Males - Hispanic or Latino
Median resident age - Males - American Indian and Alaska Native
Median resident age - Males - Multirace
Median resident age - Males - Other Race
Median resident age - Females - White
Median resident age - Females - Black or African American
Median resident age - Females - Asian
Median resident age - Females - Hispanic or Latino
Median resident age - Females - American Indian and Alaska Native
Median resident age - Females - Multirace
Median resident age - Females - Other Race
Commute - mean travel time to work (minutes)
Travel time to work - Less than 5 minutes (%)
Travel time to work - Less than 5 minutes (% change since 2000)
Travel time to work - 5 to 9 minutes (%)
Travel time to work - 5 to 9 minutes (% change since 2000)
Travel time to work - 10 to 19 minutes (%)
Travel time to work - 10 to 19 minutes (% change since 2000)
Travel time to work - 20 to 29 minutes (%)
Travel time to work - 20 to 29 minutes (% change since 2000)
Travel time to work - 30 to 39 minutes (%)
Travel time to work - 30 to 39 minutes (% change since 2000)
Travel time to work - 40 to 59 minutes (%)
Travel time to work - 40 to 59 minutes (% change since 2000)
Travel time to work - 60 to 89 minutes (%)
Travel time to work - 60 to 89 minutes (% change since 2000)
Travel time to work - 90 or more minutes (%)
Travel time to work - 90 or more minutes (% change since 2000)
Marital status - Never married (%)
Marital status - Now married (%)
Marital status - Separated (%)
Marital status - Widowed (%)
Marital status - Divorced (%)
Median family income ($)
Median family income (% change since 2000)
Median non-family income ($)
Median non-family income (% change since 2000)
Median per capita income ($)
Median per capita income (% change since 2000)
Median family income ($) - White
Median family income ($) - Black or African American
Median family income ($) - Asian
Median family income ($) - Hispanic or Latino
Median family income ($) - American Indian and Alaska Native
Median family income ($) - Multirace
Median family income ($) - Other Race
Median year house/condo built
Median year apartment built
Year house built - Built 2005 or later (%)
Year house built - Built 2000 to 2004 (%)
Year house built - Built 1990 to 1999 (%)
Year house built - Built 1980 to 1989 (%)
Year house built - Built 1970 to 1979 (%)
Year house built - Built 1960 to 1969 (%)
Year house built - Built 1950 to 1959 (%)
Year house built - Built 1940 to 1949 (%)
Year house built - Built 1939 or earlier (%)
Average household size
Household density (households per square mile)
Average household size - White
Average household size - Black or African American
Average household size - Asian
Average household size - Hispanic or Latino
Average household size - American Indian and Alaska Native
Average household size - Multirace
Average household size - Other Race
Occupied housing units (%)
Vacant housing units (%)
Owner occupied housing units (%)
Renter occupied housing units (%)
Vacancy status - For rent (%)
Vacancy status - For sale only (%)
Vacancy status - Rented or sold, not occupied (%)
Vacancy status - For seasonal, recreational, or occasional use (%)
Vacancy status - For migrant workers (%)
Vacancy status - Other vacant (%)
Residents with income below the poverty level (%)
Residents with income below 50% of the poverty level (%)
Children below poverty level (%)
Poor families by family type - Married-couple family (%)
Poor families by family type - Male, no wife present (%)
Poor families by family type - Female, no husband present (%)
Poverty status for native-born residents (%)
Poverty status for foreign-born residents (%)
Poverty among high school graduates not in families (%)
Poverty among people who did not graduate high school not in families (%)
Residents with income below the poverty level (%) - White
Residents with income below the poverty level (%) - Black or African American
Residents with income below the poverty level (%) - Asian
Residents with income below the poverty level (%) - Hispanic or Latino
Residents with income below the poverty level (%) - American Indian and Alaska Native
Residents with income below the poverty level (%) - Multirace
Residents with income below the poverty level (%) - Other Race
Air pollution - Air Quality Index (AQI)
Air pollution - CO
Air pollution - NO2
Air pollution - SO2
Air pollution - Ozone
Air pollution - PM10
Air pollution - PM25
Air pollution - Pb
Crime - Murders per 100,000 population
Crime - Rapes per 100,000 population
Crime - Robberies per 100,000 population
Crime - Assaults per 100,000 population
Crime - Burglaries per 100,000 population
Crime - Thefts per 100,000 population
Crime - Auto thefts per 100,000 population
Crime - Arson per 100,000 population
Crime - City-data.com crime index
Crime - Violent crime index
Crime - Property crime index
Crime - Murders per 100,000 population (5 year average)
Crime - Rapes per 100,000 population (5 year average)
Crime - Robberies per 100,000 population (5 year average)
Crime - Assaults per 100,000 population (5 year average)
Crime - Burglaries per 100,000 population (5 year average)
Crime - Thefts per 100,000 population (5 year average)
Crime - Auto thefts per 100,000 population (5 year average)
Crime - Arson per 100,000 population (5 year average)
Crime - City-data.com crime index (5 year average)
Crime - Violent crime index (5 year average)
Crime - Property crime index (5 year average)
1996 Presidential Elections Results (%) - Democratic Party (Clinton)
1996 Presidential Elections Results (%) - Republican Party (Dole)
1996 Presidential Elections Results (%) - Other
2000 Presidential Elections Results (%) - Democratic Party (Gore)
2000 Presidential Elections Results (%) - Republican Party (Bush)
2000 Presidential Elections Results (%) - Other
2004 Presidential Elections Results (%) - Democratic Party (Kerry)
2004 Presidential Elections Results (%) - Republican Party (Bush)
2004 Presidential Elections Results (%) - Other
2008 Presidential Elections Results (%) - Democratic Party (Obama)
2008 Presidential Elections Results (%) - Republican Party (McCain)
2008 Presidential Elections Results (%) - Other
2012 Presidential Elections Results (%) - Democratic Party (Obama)
2012 Presidential Elections Results (%) - Republican Party (Romney)
2012 Presidential Elections Results (%) - Other
2016 Presidential Elections Results (%) - Democratic Party (Clinton)
2016 Presidential Elections Results (%) - Republican Party (Trump)
2016 Presidential Elections Results (%) - Other
2020 Presidential Elections Results (%) - Democratic Party (Biden)
2020 Presidential Elections Results (%) - Republican Party (Trump)
2020 Presidential Elections Results (%) - Other
Ancestries Reported - Arab (%)
Ancestries Reported - Czech (%)
Ancestries Reported - Danish (%)
Ancestries Reported - Dutch (%)
Ancestries Reported - English (%)
Ancestries Reported - French (%)
Ancestries Reported - French Canadian (%)
Ancestries Reported - German (%)
Ancestries Reported - Greek (%)
Ancestries Reported - Hungarian (%)
Ancestries Reported - Irish (%)
Ancestries Reported - Italian (%)
Ancestries Reported - Lithuanian (%)
Ancestries Reported - Norwegian (%)
Ancestries Reported - Polish (%)
Ancestries Reported - Portuguese (%)
Ancestries Reported - Russian (%)
Ancestries Reported - Scotch-Irish (%)
Ancestries Reported - Scottish (%)
Ancestries Reported - Slovak (%)
Ancestries Reported - Subsaharan African (%)
Ancestries Reported - Swedish (%)
Ancestries Reported - Swiss (%)
Ancestries Reported - Ukrainian (%)
Ancestries Reported - United States (%)
Ancestries Reported - Welsh (%)
Ancestries Reported - West Indian (%)
Ancestries Reported - Other (%)
Educational Attainment - No schooling completed (%)
Educational Attainment - Less than high school (%)
Educational Attainment - High school or equivalent (%)
Educational Attainment - Less than 1 year of college (%)
Educational Attainment - 1 or more years of college (%)
Educational Attainment - Associate degree (%)
Educational Attainment - Bachelor's degree (%)
Educational Attainment - Master's degree (%)
Educational Attainment - Professional school degree (%)
Educational Attainment - Doctorate degree (%)
School Enrollment - Nursery, preschool (%)
School Enrollment - Kindergarten (%)
School Enrollment - Grade 1 to 4 (%)
School Enrollment - Grade 5 to 8 (%)
School Enrollment - Grade 9 to 12 (%)
School Enrollment - College undergrad (%)
School Enrollment - Graduate or professional (%)
School Enrollment - Not enrolled in school (%)
School enrollment - Public schools (%)
School enrollment - Private schools (%)
School enrollment - Not enrolled (%)
Median number of rooms in houses and condos
Median number of rooms in apartments
Housing units lacking complete plumbing facilities (%)
Housing units lacking complete kitchen facilities (%)
Density of houses
Urban houses (%)
Rural houses (%)
Households with people 60 years and over (%)
Households with people 65 years and over (%)
Households with people 75 years and over (%)
Households with one or more nonrelatives (%)
Households with no nonrelatives (%)
Population in households (%)
Family households (%)
Nonfamily households (%)
Population in families (%)
Family households with own children (%)
Median number of bedrooms in owner occupied houses
Mean number of bedrooms in owner occupied houses
Median number of bedrooms in renter occupied houses
Mean number of bedrooms in renter occupied houses
Median number of vehichles in owner occupied houses
Mean number of vehichles in owner occupied houses
Median number of vehichles in renter occupied houses
Mean number of vehichles in renter occupied houses
Mortgage status - with mortgage (%)
Mortgage status - with second mortgage (%)
Mortgage status - with home equity loan (%)
Mortgage status - with both second mortgage and home equity loan (%)
Mortgage status - without a mortgage (%)
Average family size
Average family size - White
Average family size - Black or African American
Average family size - Asian
Average family size - Hispanic or Latino
Average family size - American Indian and Alaska Native
Average family size - Multirace
Average family size - Other Race
Geographical mobility - Same house 1 year ago (%)
Geographical mobility - Moved within same county (%)
Geographical mobility - Moved from different county within same state (%)
Geographical mobility - Moved from different state (%)
Geographical mobility - Moved from abroad (%)
Place of birth - Born in state of residence (%)
Place of birth - Born in other state (%)
Place of birth - Native, outside of US (%)
Place of birth - Foreign born (%)
Housing units in structures - 1, detached (%)
Housing units in structures - 1, attached (%)
Housing units in structures - 2 (%)
Housing units in structures - 3 or 4 (%)
Housing units in structures - 5 to 9 (%)
Housing units in structures - 10 to 19 (%)
Housing units in structures - 20 to 49 (%)
Housing units in structures - 50 or more (%)
Housing units in structures - Mobile home (%)
Housing units in structures - Boat, RV, van, etc. (%)
House/condo owner moved in on average (years ago)
Renter moved in on average (years ago)
Year householder moved into unit - Moved in 1999 to March 2000 (%)
Year householder moved into unit - Moved in 1995 to 1998 (%)
Year householder moved into unit - Moved in 1990 to 1994 (%)
Year householder moved into unit - Moved in 1980 to 1989 (%)
Year householder moved into unit - Moved in 1970 to 1979 (%)
Year householder moved into unit - Moved in 1969 or earlier (%)
Means of transportation to work - Drove car alone (%)
Means of transportation to work - Carpooled (%)
Means of transportation to work - Public transportation (%)
Means of transportation to work - Bus or trolley bus (%)
Means of transportation to work - Streetcar or trolley car (%)
Means of transportation to work - Subway or elevated (%)
Means of transportation to work - Railroad (%)
Means of transportation to work - Ferryboat (%)
Means of transportation to work - Taxicab (%)
Means of transportation to work - Motorcycle (%)
Means of transportation to work - Bicycle (%)
Means of transportation to work - Walked (%)
Means of transportation to work - Other means (%)
Working at home (%)
Industry diversity
Most Common Industries - Agriculture, forestry, fishing and hunting, and mining (%)
Most Common Industries - Agriculture, forestry, fishing and hunting (%)
Most Common Industries - Mining, quarrying, and oil and gas extraction (%)
Most Common Industries - Construction (%)
Most Common Industries - Manufacturing (%)
Most Common Industries - Wholesale trade (%)
Most Common Industries - Retail trade (%)
Most Common Industries - Transportation and warehousing, and utilities (%)
Most Common Industries - Transportation and warehousing (%)
Most Common Industries - Utilities (%)
Most Common Industries - Information (%)
Most Common Industries - Finance and insurance, and real estate and rental and leasing (%)
Most Common Industries - Finance and insurance (%)
Most Common Industries - Real estate and rental and leasing (%)
Most Common Industries - Professional, scientific, and management, and administrative and waste management services (%)
Most Common Industries - Professional, scientific, and technical services (%)
Most Common Industries - Management of companies and enterprises (%)
Most Common Industries - Administrative and support and waste management services (%)
Most Common Industries - Educational services, and health care and social assistance (%)
Most Common Industries - Educational services (%)
Most Common Industries - Health care and social assistance (%)
Most Common Industries - Arts, entertainment, and recreation, and accommodation and food services (%)
Most Common Industries - Arts, entertainment, and recreation (%)
Most Common Industries - Accommodation and food services (%)
Most Common Industries - Other services, except public administration (%)
Most Common Industries - Public administration (%)
Occupation diversity
Most Common Occupations - Management, business, science, and arts occupations (%)
Most Common Occupations - Management, business, and financial occupations (%)
Most Common Occupations - Management occupations (%)
Most Common Occupations - Business and financial operations occupations (%)
Most Common Occupations - Computer, engineering, and science occupations (%)
Most Common Occupations - Computer and mathematical occupations (%)
Most Common Occupations - Architecture and engineering occupations (%)
Most Common Occupations - Life, physical, and social science occupations (%)
Most Common Occupations - Education, legal, community service, arts, and media occupations (%)
Most Common Occupations - Community and social service occupations (%)
Most Common Occupations - Legal occupations (%)
Most Common Occupations - Education, training, and library occupations (%)
Most Common Occupations - Arts, design, entertainment, sports, and media occupations (%)
Most Common Occupations - Healthcare practitioners and technical occupations (%)
Most Common Occupations - Health diagnosing and treating practitioners and other technical occupations (%)
Most Common Occupations - Health technologists and technicians (%)
Most Common Occupations - Service occupations (%)
Most Common Occupations - Healthcare support occupations (%)
Most Common Occupations - Protective service occupations (%)
Most Common Occupations - Fire fighting and prevention, and other protective service workers including supervisors (%)
Most Common Occupations - Law enforcement workers including supervisors (%)
Most Common Occupations - Food preparation and serving related occupations (%)
Most Common Occupations - Building and grounds cleaning and maintenance occupations (%)
Most Common Occupations - Personal care and service occupations (%)
Most Common Occupations - Sales and office occupations (%)
Most Common Occupations - Sales and related occupations (%)
Most Common Occupations - Office and administrative support occupations (%)
Most Common Occupations - Natural resources, construction, and maintenance occupations (%)
Most Common Occupations - Farming, fishing, and forestry occupations (%)
Most Common Occupations - Construction and extraction occupations (%)
Most Common Occupations - Installation, maintenance, and repair occupations (%)
Most Common Occupations - Production, transportation, and material moving occupations (%)
Most Common Occupations - Production occupations (%)
Most Common Occupations - Transportation occupations (%)
Most Common Occupations - Material moving occupations (%)
People in Group quarters - Institutionalized population (%)
People in Group quarters - Correctional institutions (%)
People in Group quarters - Federal prisons and detention centers (%)
People in Group quarters - Halfway houses (%)
People in Group quarters - Local jails and other confinement facilities (including police lockups) (%)
People in Group quarters - Military disciplinary barracks (%)
People in Group quarters - State prisons (%)
People in Group quarters - Other types of correctional institutions (%)
People in Group quarters - Nursing homes (%)
People in Group quarters - Hospitals/wards, hospices, and schools for the handicapped (%)
People in Group quarters - Hospitals/wards and hospices for chronically ill (%)
People in Group quarters - Hospices or homes for chronically ill (%)
People in Group quarters - Military hospitals or wards for chronically ill (%)
People in Group quarters - Other hospitals or wards for chronically ill (%)
People in Group quarters - Hospitals or wards for drug/alcohol abuse (%)
People in Group quarters - Mental (Psychiatric) hospitals or wards (%)
People in Group quarters - Schools, hospitals, or wards for the mentally retarded (%)
People in Group quarters - Schools, hospitals, or wards for the physically handicapped (%)
People in Group quarters - Institutions for the deaf (%)
People in Group quarters - Institutions for the blind (%)
People in Group quarters - Orthopedic wards and institutions for the physically handicapped (%)
People in Group quarters - Wards in general hospitals for patients who have no usual home elsewhere (%)
People in Group quarters - Wards in military hospitals for patients who have no usual home elsewhere (%)
People in Group quarters - Juvenile institutions (%)
People in Group quarters - Long-term care (%)
People in Group quarters - Homes for abused, dependent, and neglected children (%)
People in Group quarters - Residential treatment centers for emotionally disturbed children (%)
People in Group quarters - Training schools for juvenile delinquents (%)
People in Group quarters - Short-term care, detention or diagnostic centers for delinquent children (%)
People in Group quarters - Type of juvenile institution unknown (%)
People in Group quarters - Noninstitutionalized population (%)
People in Group quarters - College dormitories (includes college quarters off campus) (%)
People in Group quarters - Military quarters (%)
People in Group quarters - On base (%)
People in Group quarters - Barracks, unaccompanied personnel housing (UPH), (Enlisted/Officer), ;and similar group living quarters for military personnel (%)
People in Group quarters - Transient quarters for temporary residents (%)
People in Group quarters - Military ships (%)
People in Group quarters - Group homes (%)
People in Group quarters - Homes or halfway houses for drug/alcohol abuse (%)
People in Group quarters - Homes for the mentally ill (%)
People in Group quarters - Homes for the mentally retarded (%)
People in Group quarters - Homes for the physically handicapped (%)
People in Group quarters - Other group homes (%)
People in Group quarters - Religious group quarters (%)
People in Group quarters - Dormitories (%)
People in Group quarters - Agriculture workers' dormitories on farms (%)
People in Group quarters - Job Corps and vocational training facilities (%)
People in Group quarters - Other workers' dormitories (%)
People in Group quarters - Crews of maritime vessels (%)
People in Group quarters - Other nonhousehold living situations (%)
People in Group quarters - Other noninstitutional group quarters (%)
Residents speaking English at home (%)
Residents speaking English at home - Born in the United States (%)
Residents speaking English at home - Native, born elsewhere (%)
Residents speaking English at home - Foreign born (%)
Residents speaking Spanish at home (%)
Residents speaking Spanish at home - Born in the United States (%)
Residents speaking Spanish at home - Native, born elsewhere (%)
Residents speaking Spanish at home - Foreign born (%)
Residents speaking other language at home (%)
Residents speaking other language at home - Born in the United States (%)
Residents speaking other language at home - Native, born elsewhere (%)
Residents speaking other language at home - Foreign born (%)
Class of Workers - Employee of private company (%)
Class of Workers - Self-employed in own incorporated business (%)
Class of Workers - Private not-for-profit wage and salary workers (%)
Class of Workers - Local government workers (%)
Class of Workers - State government workers (%)
Class of Workers - Federal government workers (%)
Class of Workers - Self-employed workers in own not incorporated business and Unpaid family workers (%)
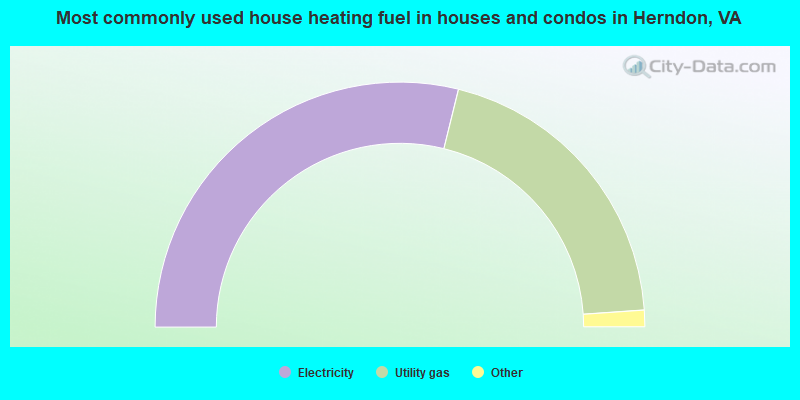
House heating fuel used in houses and condos - Utility gas (%)
House heating fuel used in houses and condos - Bottled, tank, or LP gas (%)
House heating fuel used in houses and condos - Electricity (%)
House heating fuel used in houses and condos - Fuel oil, kerosene, etc. (%)
House heating fuel used in houses and condos - Coal or coke (%)
House heating fuel used in houses and condos - Wood (%)
House heating fuel used in houses and condos - Solar energy (%)
House heating fuel used in houses and condos - Other fuel (%)
House heating fuel used in houses and condos - No fuel used (%)
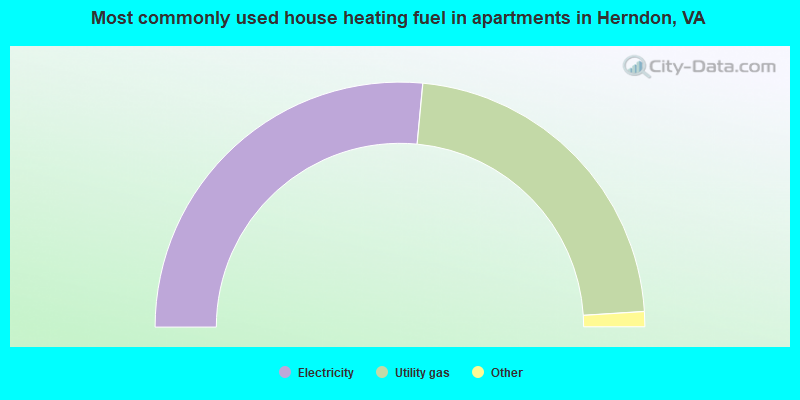
House heating fuel used in apartments - Utility gas (%)
House heating fuel used in apartments - Bottled, tank, or LP gas (%)
House heating fuel used in apartments - Electricity (%)
House heating fuel used in apartments - Fuel oil, kerosene, etc. (%)
House heating fuel used in apartments - Coal or coke (%)
House heating fuel used in apartments - Wood (%)
House heating fuel used in apartments - Solar energy (%)
House heating fuel used in apartments - Other fuel (%)
House heating fuel used in apartments - No fuel used (%)
Armed forces status - In Armed Forces (%)
Armed forces status - Civilian (%)
Armed forces status - Civilian - Veteran (%)
Armed forces status - Civilian - Nonveteran (%)
Fatal accidents locations in years 2005-2021
Fatal accidents locations in 2005
Fatal accidents locations in 2006
Fatal accidents locations in 2007
Fatal accidents locations in 2008
Fatal accidents locations in 2009
Fatal accidents locations in 2010
Fatal accidents locations in 2011
Fatal accidents locations in 2012
Fatal accidents locations in 2013
Fatal accidents locations in 2014
Fatal accidents locations in 2015
Fatal accidents locations in 2016
Fatal accidents locations in 2017
Fatal accidents locations in 2018
Fatal accidents locations in 2019
Fatal accidents locations in 2020
Fatal accidents locations in 2021
Alcohol use - People drinking some alcohol every month (%)
Alcohol use - People not drinking at all (%)
Alcohol use - Average days/month drinking alcohol
Alcohol use - Average drinks/week
Alcohol use - Average days/year people drink much
Audiometry - Average condition of hearing (%)
Audiometry - People that can hear a whisper from across a quiet room (%)
Audiometry - People that can hear normal voice from across a quiet room (%)
Audiometry - Ears ringing, roaring, buzzing (%)
Audiometry - Had a job exposure to loud noise (%)
Audiometry - Had off-work exposure to loud noise (%)
Blood Pressure & Cholesterol - Has high blood pressure (%)
Blood Pressure & Cholesterol - Checking blood pressure at home (%)
Blood Pressure & Cholesterol - Frequently checking blood cholesterol (%)
Blood Pressure & Cholesterol - Has high cholesterol level (%)
Consumer Behavior - Money monthly spent on food at supermarket/grocery store
Consumer Behavior - Money monthly spent on food at other stores
Consumer Behavior - Money monthly spent on eating out
Consumer Behavior - Money monthly spent on carryout/delivered foods
Consumer Behavior - Income spent on food at supermarket/grocery store (%)
Consumer Behavior - Income spent on food at other stores (%)
Consumer Behavior - Income spent on eating out (%)
Consumer Behavior - Income spent on carryout/delivered foods (%)
Current Health Status - General health condition (%)
Current Health Status - Blood donors (%)
Current Health Status - Has blood ever tested for HIV virus (%)
Current Health Status - Left-handed people (%)
Dermatology - People using sunscreen (%)
Diabetes - Diabetics (%)
Diabetes - Had a blood test for high blood sugar (%)
Diabetes - People taking insulin (%)
Diet Behavior & Nutrition - Diet health (%)
Diet Behavior & Nutrition - Milk product consumption (# of products/month)
Diet Behavior & Nutrition - Meals not home prepared (#/week)
Diet Behavior & Nutrition - Meals from fast food or pizza place (#/week)
Diet Behavior & Nutrition - Ready-to-eat foods (#/month)
Diet Behavior & Nutrition - Frozen meals/pizza (#/month)
Drug Use - People that ever used marijuana or hashish (%)
Drug Use - Ever used hard drugs (%)
Drug Use - Ever used any form of cocaine (%)
Drug Use - Ever used heroin (%)
Drug Use - Ever used methamphetamine (%)
Health Insurance - People covered by health insurance (%)
Kidney Conditions-Urology - Avg. # of times urinating at night
Medical Conditions - People with asthma (%)
Medical Conditions - People with anemia (%)
Medical Conditions - People with psoriasis (%)
Medical Conditions - People with overweight (%)
Medical Conditions - Elderly people having difficulties in thinking or remembering (%)
Medical Conditions - People who ever received blood transfusion (%)
Medical Conditions - People having trouble seeing even with glass/contacts (%)
Medical Conditions - People with arthritis (%)
Medical Conditions - People with gout (%)
Medical Conditions - People with congestive heart failure (%)
Medical Conditions - People with coronary heart disease (%)
Medical Conditions - People with angina pectoris (%)
Medical Conditions - People who ever had heart attack (%)
Medical Conditions - People who ever had stroke (%)
Medical Conditions - People with emphysema (%)
Medical Conditions - People with thyroid problem (%)
Medical Conditions - People with chronic bronchitis (%)
Medical Conditions - People with any liver condition (%)
Medical Conditions - People who ever had cancer or malignancy (%)
Mental Health - People who have little interest in doing things (%)
Mental Health - People feeling down, depressed, or hopeless (%)
Mental Health - People who have trouble sleeping or sleeping too much (%)
Mental Health - People feeling tired or having little energy (%)
Mental Health - People with poor appetite or overeating (%)
Mental Health - People feeling bad about themself (%)
Mental Health - People who have trouble concentrating on things (%)
Mental Health - People moving or speaking slowly or too fast (%)
Mental Health - People having thoughts they would be better off dead (%)
Oral Health - Average years since last visit a dentist
Oral Health - People embarrassed because of mouth (%)
Oral Health - People with gum disease (%)
Oral Health - General health of teeth and gums (%)
Oral Health - Average days a week using dental floss/device
Oral Health - Average days a week using mouthwash for dental problem
Oral Health - Average number of teeth
Pesticide Use - Households using pesticides to control insects (%)
Pesticide Use - Households using pesticides to kill weeds (%)
Physical Activity - People doing vigorous-intensity work activities (%)
Physical Activity - People doing moderate-intensity work activities (%)
Physical Activity - People walking or bicycling (%)
Physical Activity - People doing vigorous-intensity recreational activities (%)
Physical Activity - People doing moderate-intensity recreational activities (%)
Physical Activity - Average hours a day doing sedentary activities
Physical Activity - Average hours a day watching TV or videos
Physical Activity - Average hours a day using computer
Physical Functioning - People having limitations keeping them from working (%)
Physical Functioning - People limited in amount of work they can do (%)
Physical Functioning - People that need special equipment to walk (%)
Physical Functioning - People experiencing confusion/memory problems (%)
Physical Functioning - People requiring special healthcare equipment (%)
Prescription Medications - Average number of prescription medicines taking
Preventive Aspirin Use - Adults 40+ taking low-dose aspirin (%)
Reproductive Health - Vaginal deliveries (%)
Reproductive Health - Cesarean deliveries (%)
Reproductive Health - Deliveries resulted in a live birth (%)
Reproductive Health - Pregnancies resulted in a delivery (%)
Reproductive Health - Women breastfeeding newborns (%)
Reproductive Health - Women that had a hysterectomy (%)
Reproductive Health - Women that had both ovaries removed (%)
Reproductive Health - Women that have ever taken birth control pills (%)
Reproductive Health - Women taking birth control pills (%)
Reproductive Health - Women that have ever used Depo-Provera or injectables (%)
Reproductive Health - Women that have ever used female hormones (%)
Sexual Behavior - People 18+ that ever had sex (vaginal, anal, or oral) (%)
Sexual Behavior - Males 18+ that ever had vaginal sex with a woman (%)
Sexual Behavior - Males 18+ that ever performed oral sex on a woman (%)
Sexual Behavior - Males 18+ that ever had anal sex with a woman (%)
Sexual Behavior - Males 18+ that ever had any sex with a man (%)
Sexual Behavior - Females 18+ that ever had vaginal sex with a man (%)
Sexual Behavior - Females 18+ that ever performed oral sex on a man (%)
Sexual Behavior - Females 18+ that ever had anal sex with a man (%)
Sexual Behavior - Females 18+ that ever had any kind of sex with a woman (%)
Sexual Behavior - Average age people first had sex
Sexual Behavior - Average number of female sex partners in lifetime (males 18+)
Sexual Behavior - Average number of female vaginal sex partners in lifetime (males 18+)
Sexual Behavior - Average age people first performed oral sex on a woman (18+)
Sexual Behavior - Average number of woman performed oral sex on in lifetime (18+)
Sexual Behavior - Average number of male sex partners in lifetime (males 18+)
Sexual Behavior - Average number of male anal sex partners in lifetime (males 18+)
Sexual Behavior - Average age people first performed oral sex on a man (18+)
Sexual Behavior - Average number of male oral sex partners in lifetime (18+)
Sexual Behavior - People using protection when performing oral sex (%)
Sexual Behavior - Average number of times people have vaginal or anal sex a year
Sexual Behavior - People having sex without condom (%)
Sexual Behavior - Average number of male sex partners in lifetime (females 18+)
Sexual Behavior - Average number of male vaginal sex partners in lifetime (females 18+)
Sexual Behavior - Average number of female sex partners in lifetime (females 18+)
Sexual Behavior - Circumcised males 18+ (%)
Sleep Disorders - Average hours sleeping at night
Sleep Disorders - People that has trouble sleeping (%)
Smoking-Cigarette Use - People smoking cigarettes (%)
Taste & Smell - People 40+ having problems with smell (%)
Taste & Smell - People 40+ having problems with taste (%)
Taste & Smell - People 40+ that ever had wisdom teeth removed (%)
Taste & Smell - People 40+ that ever had tonsils teeth removed (%)
Taste & Smell - People 40+ that ever had a loss of consciousness because of a head injury (%)
Taste & Smell - People 40+ that ever had a broken nose or other serious injury to face or skull (%)
Taste & Smell - People 40+ that ever had two or more sinus infections (%)
Weight - Average height (inches)
Weight - Average weight (pounds)
Weight - Average BMI
Weight - People that are obese (%)
Weight - People that ever were obese (%)
Weight - People trying to lose weight (%)
According to our research of Virginia and other state lists, there were 39 registered sex offenders living in Herndon, Virginia as of April 26, 2024 . The ratio of all residents to sex offenders in Herndon is 629 to 1.The ratio of registered sex offenders to all residents in this city is lower than the state average.
Officers per 1,000 residents here:
1.98Virginia average:
2.24
Latest news from Herndon, VA collected exclusively by city-data.com from local newspapers, TV, and radio stations
Ancestries: Irish (3.6%), German (3.2%), American (3.1%), English (2.1%), European (1.7%), Italian (1.4%).
Current Local Time:
Land area: 4.22 square miles.
Population density: 5,725 people per square mile (average).
10,188 residents are foreign born (24.0% Latin America , 12.9% Asia ).
This town:
41.9%Virginia:
12.6%
Median real estate property taxes paid for housing units with mortgages in 2022: $5,899 (1.1%)Median real estate property taxes paid for housing units with no mortgage in 2022: $6,144 (1.1%)
Nearest city with pop. 50,000+: Reston, VA
Nearest city with pop. 200,000+: Washington, DC
Nearest city with pop. 1,000,000+: Philadelphia, PA
Nearest cities:
Latitude: 38.97 N, Longitude: 77.39 W
Daytime population change due to commuting: +7,403 (+30.5%)Workers who live and work in this town: 5,686 (38.8%)
Property values in Herndon, VA
Herndon tourist attractions:
Single-family new house construction building permits:
2022: 2 buildings , average cost: $375,0002021: 2 buildings , average cost: $300,0002020: 2 buildings , average cost: $250,0002019: 5 buildings , average cost: $316,0002018: 4 buildings , average cost: $253,3002017: 25 buildings , average cost: $220,6002016: 29 buildings , average cost: $216,0002015: 18 buildings , average cost: $218,4002014: 14 buildings , average cost: $183,7002013: 9 buildings , average cost: $213,1002011: 45 buildings , average cost: $156,3002010: 41 buildings , average cost: $159,8002009: 29 buildings , average cost: $153,6002008: 38 buildings , average cost: $151,1002007: 48 buildings , average cost: $170,8002006: 44 buildings , average cost: $158,6002005: 21 buildings , average cost: $189,4002004: 119 buildings , average cost: $169,7002003: 21 buildings , average cost: $190,4002002: 2 buildings , average cost: $192,5002001: 13 buildings , average cost: $47,7002000: 47 buildings , average cost: $120,9001999: 45 buildings , average cost: $121,7001998: 48 buildings , average cost: $118,7001997: 38 buildings , average cost: $97,200Unemployment in December 2023:
Population change in the 1990s: +5,601 (+34.9%).
Most common occupations in Herndon, VA (%)
Both Males Females
Computer specialists (8.8%)
Other management occupations, except farmers and farm managers (6.5%)
Building and grounds cleaning and maintenance occupations (4.9%)
Other office and administrative support workers, including supervisors (3.8%)
Cooks and food preparation workers (3.0%)
Retail sales workers, except cashiers (2.8%)
Other sales and related occupations, including supervisors (2.7%)
Computer specialists (11.4%)
Other management occupations, except farmers and farm managers (6.8%)
Construction laborers (4.3%)
Engineers (3.5%)
Building and grounds cleaning and maintenance occupations (3.4%)
Retail sales workers, except cashiers (3.2%)
Driver/sales workers and truck drivers (3.2%)
Building and grounds cleaning and maintenance occupations (7.0%)
Other management occupations, except farmers and farm managers (6.2%)
Other office and administrative support workers, including supervisors (5.9%)
Computer specialists (5.4%)
Secretaries and administrative assistants (4.8%)
Preschool, kindergarten, elementary, and middle school teachers (4.6%)
Accountants and auditors (3.7%)
Tornado activity:
Herndon-area historical tornado activity is above Virginia state average. It is 7% greater than the overall U.S. average.
On 9/24/2001, a category F4 (max. wind speeds 207-260 mph) tornado 29.5 miles away from the Herndon town center injured 2 people and caused $2 million in damages.
On 9/5/1979, a category F3 (max. wind speeds 158-206 mph) tornado 6.7 miles away from the town center killed one person and injured 6 people and caused between $500,000 and $5,000,000 in damages.
Earthquake activity:
Herndon-area historical earthquake activity is significantly above Virginia state average. It is 55% smaller than the overall U.S. average. On 8/23/2011 at 17:51:04, a magnitude 5.8 (5.8 MW, Depth: 3.7 mi, Class: Moderate, Intensity: VI - VII) earthquake occurred 79.2 miles away from the city center On 8/25/2011 at 05:07:52, a magnitude 4.5 (4.5 ML, Depth: 4.2 mi, Class: Light, Intensity: IV - V) earthquake occurred 77.5 miles away from Herndon center On 12/9/2003 at 20:59:18, a magnitude 4.5 (4.5 ML, Depth: 6.2 mi) earthquake occurred 91.4 miles away from Herndon center On 9/25/1998 at 19:52:52, a magnitude 5.2 (4.8 MB, 4.3 MS, 5.2 LG, 4.5 MW, Depth: 3.1 mi) earthquake occurred 235.7 miles away from Herndon center On 1/16/1994 at 01:49:16, a magnitude 4.6 (4.6 MB, 4.6 LG, Depth: 3.1 mi) earthquake occurred 118.4 miles away from the city center On 12/9/2003 at 20:59:14, a magnitude 4.5 (4.5 MB, 4.5 LG) earthquake occurred 99.7 miles away from the city center Magnitude types: regional Lg-wave magnitude (LG), body-wave magnitude (MB), local magnitude (ML), surface-wave magnitude (MS), moment magnitude (MW) Natural disasters: The number of natural disasters in Fairfax County (15) is near the US average (15).Major Disasters (Presidential) Declared: 12Emergencies Declared: 3Winter Storms: 5, Hurricanes: 4, Snowstorms: 3, Storms: 2, Tropical Storms: 2, Blizzard: 1, Flood: 1, Tornado: 1, Wind: 1, Other: 1 (Note: some incidents may be assigned to more than one category). Main business address for: NATIONAL RURAL UTILITIES COOPERATIVE FINANCE CORP /DC/ MISCELLANEOUS BUSINESS CREDIT INSTITUTION ), DIGITALNET HOLDINGS INC SERVICES-COMPUTER PROGRAMMING SERVICES ), LAFARGE NORTH AMERICA INC CEMENT, HYDRAULIC ), EPLUS INC FINANCE LESSORS ).
Hospitals and medical centers in Herndon: VITAS INNOVATIVE HOSPICE CARE (2325 DULLES CORNER BOULEVARD, SUITE 500) NATIONAL HOME HEALTH CARE INC (459 HERNDON PARKWAY, SUITE 17)
NORVA HOME HEALTH CARE, LLC (1041 STERLING ROAD, SUITE 105)
ORTHOCARERN, INC (441-B CARLISLE DRIVE, SUITE 100)
CAMERON GLEN HEALTH AND REHAB CENTER (1800 CAMERON GLEN DRIVE)
Amtrak station: DULLES INTERNATIONAL AP'T (DULLES INTERNATIONAL AIRPORT) - Bus Station
.
Services: enclosed waiting area, public restrooms, public payphones, full-service food facilities, paid short-term parking, paid long-term parking, car rental agency, taxi stand, public transit connection.
Colleges/universities with over 2000 students nearest to Herndon:
Stratford University (about 8 miles; Fairfax, VA ; Full-time enrollment: 2,570)
George Mason University (about 11 miles; Fairfax, VA ; FT enrollment: 26,002)
Northern Virginia Community College (about 13 miles; Annandale, VA ; FT enrollment: 35,721)
Medtech Institute (about 14 miles; Falls Church, VA ; FT enrollment: 2,900)
Marymount University (about 15 miles; Arlington, VA ; FT enrollment: 3,361)
Montgomery College (about 16 miles; Rockville, MD ; FT enrollment: 17,999)
American University (about 17 miles; Washington, DC ; FT enrollment: 9,850)
Public high school in Herndon: HERNDON HIGH Students: 2,262, Location: 700 BENNETT ST, Grades: 9-12)Private high schools in Herndon: TEMPLE BAPTIST SCHOOL Students: 205, Location: 1545 DRANESVILLE RD, Grades: PK-12)
THE AUBURN SCHOOL Students: 39, Location: 13525 DULLES TECHNOLOGY DR STE 101, Grades: 1-9)Biggest public elementary/middle schools in Herndon: CARSON MIDDLE Students: 1,178, Location: 13618 MCLEAREN RD, Grades: 7-8)HERNDON MIDDLE Students: 1,028, Location: 901 LOCUST ST, Grades: 7-8)OAK HILL ELEM Students: 970, Location: 3210 KINROSS CIRCLE, Grades: PK-6)MCNAIR ELEM Students: 942, Location: 2499 THOMAS JEFFERSON DR., Grades: PK-6)FLORIS ELEM Students: 811, Location: 2708 CENTREVILLE RD, Grades: PK-6)CROSSFIELD ELEM Students: 775, Location: 2791 FOX MILL RD, Grades: PK-6)HERNDON ELEM Students: 715, Location: 630 DRANESVILLE RD, Grades: PK-6)FOX MILL ELEM Students: 710, Location: 2611 VIKING DR, Grades: PK-6)DRANESVILLE ELEM Students: 659, Location: 1515 POWELLS TAVERN PL, Grades: PK-6)HUTCHISON ELEM Students: 591, Location: 13209 PARCHER AVE, Grades: PK-6)Private elementary/middle schools in Herndon: ST JOSEPH ELEMENTARY SCHOOL Students: 593, Location: 750 PEACHTREE ST, Grades: KG-8)
NYSMITH SCHOOL FOR THE GIFTED Students: 588, Location: 13625 EDS DR, Grades: PK-8)
MONTESSORI SCHOOL OF HERNDON Students: 133, Location: 840 DRANESVILLE RD, Grades: PK-4)
RESTON DAY SCHOOL Students: 114, Location: 3005 DOWER HOUSE DR, Grades: PK-4)
AMBLESIDE SCHOOL Students: 99, Location: 1089 LIBERTY MEETING CT, Grades: KG-8)
THE BOYD SCHOOL-RESTON CAMPUS Students: 88, Location: 11579 CEDAR CHASE RD, Grades: PK-1)
MT PLEASANT BAPTIST CHURCH CHRISTIAN ACADEMY Students: 45, Location: 2516 SQUIRREL HILL RD, Grades: PK-1)
DULLES MONTESSORI SCHOOL Students: 41, Location: 898 CRESTVIEW DR, Grades: PK-T1)
See full list of schools located in Herndon
Notable locations in Herndon: (A) , Herndon Industrial Venture Park (B) , Worldgate Industrial Park (C) , Grove Corporate Plaza (D) , Hendon Corporate Center (E) , Spring Park Technical Center (F) , Stuart Professional Center (G) , Baron Cameron Office Park (H) , Sugarland Industrial Park (I) , Corporate Oaks Business Park (J) , Crossroads at Dulles Office Park (K) , Fairbrook Business Park (L) , Enterprise Industrial Park (M) , Parkway Trade Center (N) , Sunset Business Park (O) , Monroe Business Center (P) , New Dominion Technology Park (Q) , Fairfax County Fire and Rescue Department Station 4 Herndon (R) , Herndon Town Hall (S) , Herndon Police Station (T) . Display/hide their locations on the map
Shopping Centers: (1) , Dulles Park Shopping Center (2) , President Plaza Shopping Center (3) , Parkway Shopping Center (4) , Bank of Potomac Shopping Center (5) , Elden Street Marketplace Shopping Center (6) . Display/hide their locations on the map
Main business address in Herndon include: (A) , EPLUS INC (B) . Display/hide their locations on the map
Churches in Herndon include: (A) , Community Christian Church (B) , First Baptist Church (C) , Holy Cross Lutheran Church (D) , Trinity Presbyterian Church (E) , Saint Timothys Episcopal Church (F) , Saint Josephs Church (G) . Display/hide their locations on the map
Cemetery: (1) . Display/hide its location on the map
Parks in Herndon include: (1) , Herndon Historic District (2) , Chandon Park (3) , Bruin Park (4) , Alabama Drive Park (5) , Runnymeade Park (6) , Haley M. Smith Park (7) , Cutter Mill Park (8) , Bready Park (9) . Display/hide their locations on the map
Tourist attractions:
Hotels:
Courts:
Birthplace of: Wesley L. Fox, Brad Farrell - College basketball player (Loyola MD Greyhounds), Brian Woodson - College basketball player (Liberty Flames), Jason Thomas - College basketball player (American Eagles), Ricky Lucas - College basketball player (George Washington Colonials), Jon Carman - Football player.
Fairfax County has a predicted average indoor radon screening level greater than 4 pCi/L (pico curies per liter) - Highest Potential Drinking water stations with addresses in Herndon and their reported violations in the past:
HERNDON, TOWN OF (Population served: 23,496, Purch surface water):
Past health violations:
MCL, Monthly (TCR) - In SEP-2007, Contaminant: Coliform. Follow-up actions: St Formal NOV issued (OCT-04-2007), St Public Notif requested (OCT-04-2007), St Compliance achieved (OCT-31-2007), St Public Notif received (OCT-31-2007)
Address: SUITE 100 Serves NC, Population served: 86, Groundwater):
Past health violations:
MCL, Monthly (TCR) - In OCT-2012, Contaminant: Coliform. Follow-up actions: St Public Notif requested (OCT-10-2012), St Formal NOV issued (OCT-10-2012), St AO (w/o penalty) issued (OCT-10-2012), St Public Notif received (NOV-06-2012), St Compliance achieved (NOV-30-2012)
Past monitoring violations:
Monitoring and Reporting (DBP) - Between JUL-2014 and SEP-2014, Contaminant: Chlorine. Follow-up actions: St AO (w/o penalty) issued (SEP-25-2014), St Public Notif requested (SEP-25-2014), St Formal NOV issued (SEP-25-2014)
Monitoring and Reporting (DBP) - Between JUL-2014 and SEP-2014, Contaminant: Chlorine. Follow-up actions: St AO (w/o penalty) issued (AUG-26-2014), St Public Notif requested (AUG-26-2014), St Formal NOV issued (AUG-26-2014)
Monitoring and Reporting (DBP) - Between APR-2014 and JUN-2014, Contaminant: Chlorine. Follow-up actions: St AO (w/o penalty) issued (JUN-26-2014), St Public Notif requested (JUN-26-2014), St Formal NOV issued (JUN-26-2014)
Monitoring and Reporting (DBP) - Between JAN-2014 and MAR-2014, Contaminant: Chlorine. Follow-up actions: St AO (w/o penalty) issued (MAY-13-2014), St Public Notif requested (MAY-13-2014), St Formal NOV issued (MAY-13-2014)
Monitoring and Reporting (DBP) - Between OCT-2013 and DEC-2013, Contaminant: Chlorine. Follow-up actions: St AO (w/o penalty) issued (FEB-19-2014), St Public Notif requested (FEB-19-2014), St Formal NOV issued (FEB-19-2014)
16 routine major monitoring violations
50 regular monitoring violations
3 other older monitoring violations
Average household size: This town:
3.1 peopleVirginia:
2.5 people
Percentage of family households: This town:
71.7%Whole state:
67.0%
Percentage of households with unmarried partners: This town:
5.7%Whole state:
5.7%
Likely homosexual households (counted as self-reported same-sex unmarried-partner households)
Lesbian couples: 0.4% of all households Gay men: 0.4% of all households
4 people in other noninstitutional facilities in 2010
Banks with most branches in Herndon (2011 data):
PNC Bank, National Association: Herndon Branch, Franklin Farm Branch, Dulles Coppermine Road Branch, Fox Mill @ Giant Branch. Info updated 2012/03/20: Bank assets: $263,309.6 mil, Deposits: $197,343.0 mil, headquarters in Wilmington, DE, positive income , Commercial Lending Specialization, 3085 total offices , Holding Company: Pnc Financial Services Group, Inc., The
Fulton Bank, National Association: Herndon Branch, Fultdirect.Com Branch, 208 Elden Street Branch. Info updated 2010/12/30: Bank assets: $9,041.7 mil, Deposits: $6,700.3 mil, headquarters in Lancaster, PA, positive income , Commercial Lending Specialization, 122 total offices , Holding Company: Fulton Financial Corporation
Wells Fargo Bank, National Association: Fox Mill Branch, Elden & Alabama, Grant & Eldon Branch. Info updated 2011/04/05: Bank assets: $1,161,490.0 mil, Deposits: $905,653.0 mil, headquarters in Sioux Falls, SD, positive income , 6395 total offices , Holding Company: Wells Fargo & Company
Branch Banking and Trust Company: Franklin Farm Branch, Herndon West Branch, Herndon Parkway Main Branch. Info updated 2010/03/29: Bank assets: $168,867.6 mil, Deposits: $127,549.5 mil, headquarters in Winston Salem, NC, positive income , Commercial Lending Specialization, 1793 total offices , Holding Company: Bb&T Corporation
Capital One, National Association: 13344-A Franklin Farm Road Branch, Woodland Crossing/Herndon Branch, Elden Branch. Info updated 2011/07/01: Bank assets: $133,477.8 mil, Deposits: $97,063.7 mil, headquarters in Mclean, VA, positive income , 984 total offices , Holding Company: Capital One Financial Corporation
Bank of America, National Association: Herndon Branch at 1100 Herndon Pkwy, branch established on 1976/04/26; Denovo Herndon Clocktower Branch at 2555 Centreville Road, branch established on 2004/06/14. Info updated 2009/11/18: Bank assets: $1,451,969.3 mil, Deposits: $1,077,176.8 mil, headquarters in Charlotte, NC, positive income , 5782 total offices , Holding Company: Bank Of America Corporation
Manufacturers and Traders Trust Company: Herndon Branch at 1025 Herndon Parkway, branch established on 1999/10/29; Dulles Branch at 2545 Centreville Road, branch established on 1995/04/12. Info updated 2011/08/08: Bank assets: $76,887.1 mil, Deposits: $60,064.2 mil, headquarters in Buffalo, NY, positive income , Commercial Lending Specialization, 808 total offices , Holding Company: M&T Bank Corporation
SunTrust Bank: Dulles Village Centerbranch at 2401 Centreville Road, branch established on 1991/10/28; Herndon Safeway Branch at 413 Elden St, branch established on 2005/06/23. Info updated 2010/05/27: Bank assets: $171,291.7 mil, Deposits: $129,833.2 mil, headquarters in Atlanta, GA, positive income , Commercial Lending Specialization, 1716 total offices , Holding Company: Suntrust Banks, Inc.
Cardinal Bank: Herndon Branch at 199 Elden Street, branch established on 2004/02/27. Info updated 2006/11/03: Bank assets: $2,594.6 mil, Deposits: $1,808.7 mil, headquarters in Mc Lean, VA, positive income , Commercial Lending Specialization, 28 total offices , Holding Company: Cardinal Financial Corporation
3 other banks with 3 local branches
For population 15 years and over in Herndon:
Never married: 36.7%Now married: 52.9%Separated: 1.2%Widowed: 2.2%Divorced: 6.9% For population 25 years and over in Herndon:
High school or higher: 85.2%Bachelor's degree or higher: 52.5%Graduate or professional degree: 20.9%Unemployed: 2.2%Mean travel time to work (commute): 18.1 minutes
Education Gini index (Inequality in education) Here:
15.6Virginia average:
12.1
Religion statistics for Herndon, VA (based on Fairfax County data)
Religion Adherents Congregations Catholic 184,183 29 Evangelical Protestant 103,522 316 Mainline Protestant 100,525 146 Other 91,925 119 Orthodox 4,694 8 Black Protestant 1,509 9 None 595,368 -
Source: Clifford Grammich, Kirk Hadaway, Richard Houseal, Dale E.Jones, Alexei Krindatch, Richie Stanley and Richard H.Taylor. 2012. 2010 U.S.Religion Census: Religious Congregations & Membership Study. Association of Statisticians of American Religious Bodies. Jones, Dale E., et al. 2002. Congregations and Membership in the United States 2000. Nashville, TN: Glenmary Research Center. Graphs represent county-level data
Food Environment Statistics: Number of grocery stores : 182Fairfax County :
1.81 / 10,000 pop.State :
2.03 / 10,000 pop.
Number of supercenters and club stores : 3This county :
0.03 / 10,000 pop.Virginia :
0.17 / 10,000 pop.
Number of convenience stores (no gas) : 130Fairfax County :
1.29 / 10,000 pop.Virginia :
1.43 / 10,000 pop.
Number of convenience stores (with gas) : 163Fairfax County :
1.62 / 10,000 pop.State :
4.03 / 10,000 pop.
Number of full-service restaurants : 693This county :
6.90 / 10,000 pop.Virginia :
7.65 / 10,000 pop.
Adult diabetes rate : This county :
7.2%State :
9.3%
Adult obesity rate : Fairfax County :
22.2%Virginia :
26.7%
Low-income preschool obesity rate : Health and Nutrition:
Average overall health of teeth and gums : Herndon:
48.0%Virginia:
48.6%
People feeling badly about themselves : People not drinking alcohol at all : Herndon:
10.1%Virginia:
10.5%
Average hours sleeping at night : General health condition : Herndon:
57.8%Virginia:
57.4%
Average condition of hearing : More about Health and Nutrition of Herndon, VA Residents
Local government employment and payroll (March 2022)
Function
Full-time employees
Monthly full-time payroll
Average yearly full-time wage
Part-time employees
Monthly part-time payroll
Other and Unallocable
55 $354,803 $77,412 0 $0 Police Protection - Officers
52 $497,014 $114,696 0 $0 Other Government Administration
39 $55,620 $17,114 3 $12,080 Parks and Recreation
26 $162,431 $74,968 63 $55,301 Financial Administration
18 $152,741 $101,827 1 $2,669 Streets and Highways
18 $116,847 $77,898 0 $0 Police - Other
17 $103,946 $73,374 0 $0 Housing and Community Development (Local)
15 $120,669 $96,535 0 $0 Solid Waste Management
14 $57,555 $49,333 0 $0 Sewerage
7 $36,832 $63,141 0 $0 Water Supply
5 $30,414 $72,994 0 $0 Judicial and Legal
4 $40,810 $122,430 1 $4,557
Totals for Government
270 $1,729,683 $76,875 68 $74,607
Herndon government finances - Expenditure in 2021 (per resident):
Construction - Regular Highways: $801,000 ($33.14)
Water Utilities: $205,000 ($8.48)Current Operations - Police Protection: $9,761,000 ($403.90)
Central Staff Services: $5,086,000 ($210.45)Parks and Recreation: $4,117,000 ($170.36)General - Other: $3,201,000 ($132.45)General Public Buildings: $2,113,000 ($87.43)Regular Highways: $2,035,000 ($84.21)Financial Administration: $1,478,000 ($61.16)Solid Waste Management: $1,279,000 ($52.92)Miscellaneous Commercial Activities - Other: $835,000 ($34.55)Judicial and Legal Services: $727,000 ($30.08)Sewerage: $692,000 ($28.63)Water Utilities: $651,000 ($26.94)Protective Inspection and Regulation - Other: $458,000 ($18.95)Housing and Community Development: $67,000 ($2.77)Parking Facilities: $64,000 ($2.65)General - Interest on Debt: $772,000 ($31.94)
Intergovernmental to Local - Other - Sewerage: $2,804,000 ($116.03)
Other - Water Utilities: $938,000 ($38.81)Other - Solid Waste Management: $392,000 ($16.22)Other - Local Fire Protection: $89,000 ($3.68)Other Capital Outlay - Regular Highways: $718,000 ($29.71)
Miscellaneous Commercial Activities - Other: $104,000 ($4.30)Police Protection: $88,000 ($3.64)Central Staff Services: $44,000 ($1.82)Parking Facilities: $38,000 ($1.57)General - Other: $37,000 ($1.53)Total Salaries and Wages: $19,963,000 ($826.04)
Herndon government finances - Revenue in 2021 (per resident):
Charges - Sewerage: $3,490,000 ($144.41)
Parks and Recreation: $2,751,000 ($113.83)Miscellaneous Commercial Activities: $1,210,000 ($50.07)Solid Waste Management: $387,000 ($16.01)Other: $92,000 ($3.81)Parking Facilities: $15,000 ($0.62)Federal Intergovernmental - Other: $2,417,000 ($100.01)
General Local Government Support: $65,000 ($2.69)Local Intergovernmental - General Local Government Support: $2,033,000 ($84.12)
Miscellaneous - Rents: $450,000 ($18.62)
Fines and Forfeits: $282,000 ($11.67)Interest Earnings: $128,000 ($5.30)Sale of Property: $85,000 ($3.52)Special Assessments: $49,000 ($2.03)Revenue - Water Utilities: $3,220,000 ($133.24)
State Intergovernmental - Highways: $3,181,000 ($131.63)
General Local Government Support: $1,952,000 ($80.77)Other: $247,000 ($10.22)Housing and Community Development: $207,000 ($8.57)Tax - Property: $13,229,000 ($547.40)
Occupation and Business License - Other: $6,680,000 ($276.41)Other Selective Sales: $3,694,000 ($152.85)Public Utilities Sales: $1,029,000 ($42.58)Other License: $566,000 ($23.42)Motor Vehicle License: $433,000 ($17.92)Tobacco Products Sales: $179,000 ($7.41)
Herndon government finances - Debt in 2021 (per resident):
Long Term Debt - Beginning Outstanding - Unspecified Public Purpose: $22,989,000 ($951.26)
Outstanding Unspecified Public Purpose: $21,808,000 ($902.39)Retired Unspecified Public Purpose: $8,508,000 ($352.05)Issue, Unspecified Public Purpose: $7,327,000 ($303.18)
Herndon government finances - Cash and Securities in 2021 (per resident):
Bond Funds - Cash and Securities: $4,436,000 ($183.56)
Other Funds - Cash and Securities: $60,392,000 ($2498.94)
8.87% of this county's 2021 resident taxpayers lived in other counties in 2020 ($108,323 average adjusted gross income )
Here:
8.87%Virginia average:
10.16%
0.19% of residents moved from foreign countries ($2,634 average AGI )Fairfax County:
0.19%Virginia average:
0.12%
Top counties from which taxpayers relocated into this county between 2020 and 2021:
10.12% of this county's 2020 resident taxpayers moved to other counties in 2021 ($118,643 average adjusted gross income )
Here:
10.12%Virginia average:
10.20%
0.16% of residents moved to foreign countries ($2,238 average AGI )Fairfax County:
0.16%Virginia average:
0.09%
Top counties to which taxpayers relocated from this county between 2020 and 2021:
Businesses in Herndon, VA
Name Count Name Count
7-Eleven 5 Marriott 3 AT&T 2 MasterBrand Cabinets 2 Advance Auto Parts 1 McDonald's 3 AutoZone 1 Nike 2 Baskin-Robbins 2 Outback 1 Blockbuster 1 Outback Steakhouse 1 Burger King 1 Panera Bread 2 CVS 3 Penske 1 Chipotle 2 Pizza Hut 2 Chuck E. Cheese's 1 Popeyes 2 Circle K 3 Qdoba Mexican Grill 1 Cold Stone Creamery 1 Quiznos 3 Comfort Inn 1 RadioShack 2 Cricket Wireless 1 Safeway 1 Curves 1 Sears 1 DHL 2 Sheraton 1 Dairy Queen 1 Sprint Nextel 1 Decora Cabinetry 2 Staples 1 Domino's Pizza 1 Starbucks 6 Dunkin Donuts 1 Subaru 1 Extended Stay America 1 Subway 6 FedEx 14 T-Mobile 2 GNC 2 T.G.I. Driday's 1 GameStop 1 Taco Bell 1 Giant 3 The Room Place 1 H&R Block 2 U-Haul 1 Hilton 4 UPS 18 Holiday Inn 4 Vons 1 Houlihan's 1 Walgreens 1 Hyatt 2 Wendy's 1 Kmart 1 Westin 1 Kohl's 1
Strongest AM radio stations in Herndon:
WMET (1150 AM; 50 kW; GAITHERSBURG, MD; Owner: BELTWAY ACQUISITION CORPORATION)
WUST (1120 AM; daytime; 20 kW; WASHINGTON, DC)
WTEM (980 AM; 50 kW; WASHINGTON, DC; Owner: AMFM RADIO LICENSES, L.L.C.)
WTOP (1500 AM; 50 kW; WASHINGTON, DC; Owner: BONNEVILLE HOLDING COMPANY)
WKCW (1420 AM; 50 kW; WARRENTON, VA; Owner: WAY BROADCASTING, INC.)
WTNT (570 AM; 5 kW; BETHESDA, MD; Owner: AMFM RADIO LICENSES, L.L.C.)
WDCT (1310 AM; 5 kW; FAIRFAX, VA; Owner: FAMILY RADIO, LTD.)
WCBM (680 AM; 50 kW; BALTIMORE, MD; Owner: WCBM MARYLAND, INC.)
WPGC (1580 AM; 50 kW; MORNINGSIDE, MD; Owner: INFINITY WPGC(AM), INC.)
WMAL (630 AM; 5 kW; WASHINGTON, DC; Owner: WMAL, INC.)
WABS (780 AM; daytime; 5 kW; ARLINGTON, VA; Owner: SALEM MEDIA OF VIRGINIA, INC.)
WWGB (1030 AM; daytime; 50 kW; INDIAN HEAD, MD; Owner: GOOD BODY MEDIA, LLC)
WBAL (1090 AM; 50 kW; BALTIMORE, MD; Owner: HEARST RADIO, INC.)
Strongest FM radio stations in Herndon:
WJFK-FM (106.7 FM; MANASSAS, VA; Owner: INFINITY BROADCASTING CORP. OF WASHINGTON, DC)
WJZW (105.9 FM; WOODBRIDGE, VA; Owner: WMAL, INC.)
WMZQ-FM (98.7 FM; WASHINGTON, DC; Owner: AMFM RADIO LICENSES, L.L.C.)
WARW (94.7 FM; BETHESDA, MD; Owner: INFINITY BROADCASTING OPERATIONS, INC.)
WIHT (99.5 FM; WASHINGTON, DC; Owner: AMFM RADIO LICENSES, L.L.C.)
WRQX (107.3 FM; WASHINGTON, DC; Owner: WMAL, INC.)
WASH (97.1 FM; WASHINGTON, DC; Owner: AMFM RADIO LICENSES, L.L.C.)
WHUR-FM (96.3 FM; WASHINGTON, DC; Owner: THE HOWARD UNIVERSITY)
WGTS (91.9 FM; TAKOMA PARK, MD; Owner: COLUMBIA UNION COLLEGE BROADCASTING, INC.)
WETA (90.9 FM; WASHINGTON, DC; Owner: GREATER WASHINGTON EDUCATIONAL TELECOMMUNICATIONS ASSN.)
WKYS (93.9 FM; WASHINGTON, DC; Owner: RADIO ONE LICENSES, LLC)
WWDC-FM (101.1 FM; WASHINGTON, DC; Owner: AMFM RADIO LICENSES, L.L.C.)
WAVA (105.1 FM; ARLINGTON, VA; Owner: SALEM MEDIA OF VIRGINIA, INC.)
W228BA (93.5 FM; LEESBURG, VA; Owner: CSN INTERNATIONAL)
WINC-FM (92.5 FM; WINCHESTER, VA; Owner: MID ATLANTIC NETWORK, INC.)
WGMS-FM (103.5 FM; WASHINGTON, DC; Owner: BONNEVILLE HOLDING COMPANY)
WAMU (88.5 FM; WASHINGTON, DC; Owner: THE EXEC. COMM. OF THE BD. OF TRUSTEES OF AMERICAN UNIV.)
WMMJ (102.3 FM; BETHESDA, MD; Owner: RADIO ONE LICENSES, LLC)
WPER (89.9 FM; CULPEPER, VA; Owner: POSITIVE ALTERNATIVE RADIO INC.)
WCSP-FM (90.1 FM; WASHINGTON, DC; Owner: NATIONAL CABLE SATELLITE CORPORATION)
TV broadcast stations around Herndon:
WNVC (Channel 56; FAIRFAX, VA; Owner: COMMONWEALTH PUBLIC BROADCASTING CORPORATION)
WTTG (Channel 5; WASHINGTON, DC; Owner: FOX TELEVISION STATIONS, INC.)
WETA-TV (Channel 26; WASHINGTON, DC; Owner: THE GREATER WASHINGTON ED TELECOMM. ASSOC)
WJLA-TV (Channel 7; WASHINGTON, DC; Owner: ACC LICENSEE, INC.)
WUSA (Channel 9; WASHINGTON, DC; Owner: THE DETROIT NEWS, INC.)
WDCA (Channel 20; WASHINGTON, DC; Owner: FOX TELEVISION STATIONS, INC.)
WHUT-TV (Channel 32; WASHINGTON, DC; Owner: HOWARD UNIVERSITY)
WRC-TV (Channel 4; WASHINGTON, DC; Owner: NBC SUBSIDIARY (WRC-TV), INC.)
WPXW (Channel 66; MANASSAS, VA; Owner: PAXSON WASHINGTON LICENSE, INC.)
WBDC-TV (Channel 50; WASHINGTON, DC; Owner: WBDC BROADCASTING, INC.)
W42BE (Channel 42; FAIRFAX, VA; Owner: FAIRFAX LOW POWER CO.)
W28BY (Channel 63; BALTIMORE, MD; Owner: INFORMATION SUPER STATION, L.L.C.)
WNVT (Channel 53; GOLDVEIN, VA; Owner: COMMONWEALTH PUBLIC BROADCASTING CORPORATION)
WMDO-CA (Channel 30; WASHINGTON, DC; Owner: ENTRAVISION HOLDINGS, LLC)
WBFF (Channel 45; BALTIMORE, MD; Owner: CHESAPEAKE TELEVISION LICENSEE, LLC)
WFPT (Channel 62; FREDERICK, MD; Owner: MARYLAND PUBLIC BROADCASTING COMMISSION)
WNUV (Channel 54; BALTIMORE, MD; Owner: BALTIMORE (WNUV-TV) LICENSEE, INC.)
WZDC-LP (Channel 64; WASHINGTON, DC; Owner: ONDA CAPITAL, INC.)
WMPB (Channel 67; BALTIMORE, MD; Owner: MARYLAND PUBLIC BROADCASTING COMMISSION)
WUTB (Channel 24; BALTIMORE, MD; Owner: FOX TELEVISION STATIONS, INC.)
WMPT (Channel 22; ANNAPOLIS, MD; Owner: MARYLAND PUBLIC BROADCASTING COMMISSION)
WIAV-LP (Channel 58; WASHINGTON, DC; Owner: ASIAVISION, INC.)
WKRP-LP (Channel 42; WASHINGTON, DC; Owner: CAPITAL MEDIA, LLC)
Medal of Honor Recipients
Medal of Honor Recipient born in Herndon: Wesley L. Fox.
National Bridge Inventory (NBI) Statistics 6 Number of bridges20ft / 6.3m Total length $30,000 Total costs79,768 Total average daily traffic654 Total average daily truck traffic97,976 Total future (year 2035) average daily traffic
Home Mortgage Disclosure Act Aggregated Statistics For Year 2009(Based on 2 full tracts) A) FHA, FSA/RHS & VA B) Conventional C) Refinancings D) Home Improvement Loans E) Loans on Dwellings For 5+ Families F) Non-occupant Loans on G) Loans On Manufactured Number Average Value Number Average Value Number Average Value Number Average Value Number Average Value Number Average Value Number Average Value
LOANS ORIGINATED 168 $281,787 150 $235,470 404 $270,046 12 $123,402 1 $10,000,000 53 $148,076 0 $0 APPLICATIONS APPROVED, NOT ACCEPTED 7 $319,324 14 $251,321 36 $233,132 2 $11,500 0 $0 8 $165,931 0 $0 APPLICATIONS DENIED 23 $223,716 33 $185,031 142 $270,597 10 $85,820 0 $0 16 $158,618 1 $151,000 APPLICATIONS WITHDRAWN 24 $275,819 31 $242,657 123 $266,500 2 $69,000 0 $0 14 $188,300 0 $0 FILES CLOSED FOR INCOMPLETENESS 5 $192,978 5 $194,508 38 $267,646 2 $143,630 0 $0 3 $188,817 0 $0
Aggregated Statistics For Year 2008(Based on 2 full tracts) A) FHA, FSA/RHS & VA B) Conventional C) Refinancings D) Home Improvement Loans F) Non-occupant Loans on Number Average Value Number Average Value Number Average Value Number Average Value Number Average Value
LOANS ORIGINATED 224 $253,306 364 $216,565 199 $247,998 33 $72,295 121 $146,199 APPLICATIONS APPROVED, NOT ACCEPTED 23 $255,474 63 $248,251 49 $265,196 5 $54,670 8 $227,594 APPLICATIONS DENIED 43 $251,400 110 $223,431 194 $281,216 21 $94,094 34 $197,137 APPLICATIONS WITHDRAWN 35 $259,144 73 $240,700 81 $293,056 4 $249,208 19 $141,936 FILES CLOSED FOR INCOMPLETENESS 6 $244,522 15 $223,415 12 $236,184 5 $96,558 1 $176,000
Aggregated Statistics For Year 2007(Based on 2 full tracts) A) FHA, FSA/RHS & VA B) Conventional C) Refinancings D) Home Improvement Loans F) Non-occupant Loans on Number Average Value Number Average Value Number Average Value Number Average Value Number Average Value
LOANS ORIGINATED 8 $263,702 375 $272,512 445 $257,956 46 $136,527 54 $282,709 APPLICATIONS APPROVED, NOT ACCEPTED 0 $0 37 $346,762 120 $260,835 11 $152,512 14 $315,634 APPLICATIONS DENIED 3 $261,957 117 $290,870 344 $297,366 37 $190,843 26 $276,582 APPLICATIONS WITHDRAWN 1 $368,000 51 $290,353 192 $303,420 12 $174,138 19 $244,854 FILES CLOSED FOR INCOMPLETENESS 0 $0 6 $345,320 46 $337,954 0 $0 2 $183,500
Aggregated Statistics For Year 2006(Based on 2 full tracts) A) FHA, FSA/RHS & VA B) Conventional C) Refinancings D) Home Improvement Loans F) Non-occupant Loans on G) Loans On Manufactured Number Average Value Number Average Value Number Average Value Number Average Value Number Average Value Number Average Value
LOANS ORIGINATED 2 $237,920 713 $241,287 801 $264,557 95 $159,055 84 $240,358 1 $12,000 APPLICATIONS APPROVED, NOT ACCEPTED 0 $0 54 $243,538 114 $242,802 14 $117,647 6 $248,210 1 $85,000 APPLICATIONS DENIED 0 $0 189 $261,260 319 $279,807 54 $103,271 23 $246,768 2 $270,000 APPLICATIONS WITHDRAWN 1 $111,260 83 $270,883 249 $277,043 10 $170,071 25 $257,793 0 $0 FILES CLOSED FOR INCOMPLETENESS 0 $0 17 $255,425 50 $304,004 2 $169,175 1 $287,090 0 $0
Aggregated Statistics For Year 2005(Based on 2 full tracts) A) FHA, FSA/RHS & VA B) Conventional C) Refinancings D) Home Improvement Loans F) Non-occupant Loans on G) Loans On Manufactured Number Average Value Number Average Value Number Average Value Number Average Value Number Average Value Number Average Value
LOANS ORIGINATED 13 $260,035 1,126 $256,083 1,098 $252,339 94 $160,092 180 $251,276 0 $0 APPLICATIONS APPROVED, NOT ACCEPTED 0 $0 113 $244,081 143 $245,112 12 $171,139 19 $288,823 1 $33,780 APPLICATIONS DENIED 0 $0 214 $251,826 298 $264,537 35 $130,798 47 $242,855 1 $132,120 APPLICATIONS WITHDRAWN 0 $0 94 $286,822 232 $249,838 30 $150,586 31 $292,107 0 $0 FILES CLOSED FOR INCOMPLETENESS 1 $264,240 27 $247,938 67 $275,587 1 $42,000 3 $241,127 0 $0
Aggregated Statistics For Year 2004(Based on 2 full tracts) A) FHA, FSA/RHS & VA B) Conventional C) Refinancings D) Home Improvement Loans F) Non-occupant Loans on G) Loans On Manufactured Number Average Value Number Average Value Number Average Value Number Average Value Number Average Value Number Average Value
LOANS ORIGINATED 69 $219,231 959 $229,951 1,064 $209,889 61 $101,730 141 $213,856 1 $59,600 APPLICATIONS APPROVED, NOT ACCEPTED 3 $191,187 92 $195,205 154 $197,054 19 $52,306 14 $173,498 0 $0 APPLICATIONS DENIED 2 $269,210 163 $227,296 320 $204,952 42 $64,845 27 $195,668 0 $0 APPLICATIONS WITHDRAWN 4 $173,598 108 $233,380 241 $205,819 15 $178,733 12 $200,372 1 $44,700 FILES CLOSED FOR INCOMPLETENESS 1 $246,000 19 $313,916 49 $212,312 4 $161,428 6 $208,142 0 $0
Aggregated Statistics For Year 2003(Based on 2 full tracts) A) FHA, FSA/RHS & VA B) Conventional C) Refinancings D) Home Improvement Loans F) Non-occupant Loans on Number Average Value Number Average Value Number Average Value Number Average Value Number Average Value
LOANS ORIGINATED 134 $196,622 611 $188,990 1,916 $180,114 47 $45,290 112 $128,915 APPLICATIONS APPROVED, NOT ACCEPTED 2 $183,850 46 $173,747 218 $168,369 23 $82,193 6 $118,358 APPLICATIONS DENIED 9 $187,998 77 $176,013 288 $174,878 42 $30,424 19 $146,823 APPLICATIONS WITHDRAWN 18 $169,606 55 $186,898 227 $183,196 10 $53,808 13 $136,385 FILES CLOSED FOR INCOMPLETENESS 6 $209,520 12 $273,226 78 $180,416 2 $15,895 6 $134,590
Aggregated Statistics For Year 2002(Based on 2 full tracts) A) FHA, FSA/RHS & VA B) Conventional C) Refinancings D) Home Improvement Loans F) Non-occupant Loans on Number Average Value Number Average Value Number Average Value Number Average Value Number Average Value
LOANS ORIGINATED 131 $172,938 439 $233,010 1,241 $181,463 35 $59,999 75 $123,625 APPLICATIONS APPROVED, NOT ACCEPTED 6 $142,268 25 $183,222 130 $157,782 18 $45,392 5 $107,740 APPLICATIONS DENIED 7 $159,983 48 $161,741 229 $134,517 46 $25,600 8 $99,752 APPLICATIONS WITHDRAWN 6 $151,263 44 $789,464 206 $156,897 16 $82,982 21 $136,890 FILES CLOSED FOR INCOMPLETENESS 1 $183,000 13 $149,372 43 $180,630 2 $28,395 1 $96,000
Aggregated Statistics For Year 2001(Based on 2 full tracts) A) FHA, FSA/RHS & VA B) Conventional C) Refinancings D) Home Improvement Loans F) Non-occupant Loans on Number Average Value Number Average Value Number Average Value Number Average Value Number Average Value
LOANS ORIGINATED 162 $158,930 417 $171,549 924 $163,579 59 $36,226 51 $128,879 APPLICATIONS APPROVED, NOT ACCEPTED 5 $113,756 27 $148,366 80 $164,385 21 $27,992 6 $164,842 APPLICATIONS DENIED 5 $135,698 66 $135,754 176 $107,294 71 $26,140 9 $109,798 APPLICATIONS WITHDRAWN 6 $190,828 37 $157,836 141 $125,508 14 $35,430 3 $118,737 FILES CLOSED FOR INCOMPLETENESS 1 $72,520 3 $145,667 33 $129,560 3 $24,923 0 $0
Aggregated Statistics For Year 2000(Based on 2 full tracts) A) FHA, FSA/RHS & VA B) Conventional C) Refinancings D) Home Improvement Loans F) Non-occupant Loans on Number Average Value Number Average Value Number Average Value Number Average Value Number Average Value
LOANS ORIGINATED 171 $142,698 340 $152,866 155 $120,175 48 $44,880 25 $96,289 APPLICATIONS APPROVED, NOT ACCEPTED 3 $129,227 25 $138,061 27 $113,291 18 $20,958 0 $0 APPLICATIONS DENIED 11 $136,054 40 $130,239 141 $79,952 59 $27,528 10 $49,298 APPLICATIONS WITHDRAWN 11 $144,405 28 $172,719 71 $72,296 15 $55,199 3 $74,333 FILES CLOSED FOR INCOMPLETENESS 2 $73,800 3 $106,843 13 $96,865 5 $21,854 1 $88,410
Aggregated Statistics For Year 1999(Based on 1 full and 2 partial tracts) A) FHA, FSA/RHS & VA B) Conventional C) Refinancings D) Home Improvement Loans F) Non-occupant Loans on Number Average Value Number Average Value Number Average Value Number Average Value Number Average Value
LOANS ORIGINATED 187 $135,067 314 $160,670 339 $126,044 51 $18,323 37 $89,321 APPLICATIONS APPROVED, NOT ACCEPTED 6 $124,318 21 $135,080 48 $105,609 11 $15,090 5 $70,666 APPLICATIONS DENIED 15 $109,944 38 $143,288 100 $105,711 38 $20,880 7 $101,543 APPLICATIONS WITHDRAWN 12 $149,908 10 $177,424 72 $101,965 17 $81,214 1 $69,580 FILES CLOSED FOR INCOMPLETENESS 0 $0 8 $108,620 14 $120,158 2 $28,990 0 $0
Detailed HMDA statistics for the following Tracts:
4808.00
, 4809.00
Private Mortgage Insurance Companies Aggregated Statistics For Year 2009(Based on 2 full tracts) A) Conventional B) Refinancings Number Average Value Number Average Value
LOANS ORIGINATED 24 $243,446 9 $309,152 APPLICATIONS APPROVED, NOT ACCEPTED 11 $227,019 1 $268,220 APPLICATIONS DENIED 5 $209,806 1 $394,000 APPLICATIONS WITHDRAWN 1 $384,450 0 $0 FILES CLOSED FOR INCOMPLETENESS 2 $299,875 0 $0
Aggregated Statistics For Year 2008(Based on 2 full tracts) A) Conventional B) Refinancings C) Non-occupant Loans on Number Average Value Number Average Value Number Average Value
LOANS ORIGINATED 103 $270,722 15 $307,378 4 $210,910 APPLICATIONS APPROVED, NOT ACCEPTED 41 $308,362 17 $294,341 3 $326,280 APPLICATIONS DENIED 18 $240,202 1 $253,320 3 $268,217 APPLICATIONS WITHDRAWN 5 $335,472 2 $323,500 0 $0 FILES CLOSED FOR INCOMPLETENESS 5 $314,908 0 $0 1 $258,280
Aggregated Statistics For Year 2007(Based on 2 full tracts) A) Conventional B) Refinancings C) Non-occupant Loans on Number Average Value Number Average Value Number Average Value
LOANS ORIGINATED 82 $316,952 29 $325,394 4 $388,500 APPLICATIONS APPROVED, NOT ACCEPTED 10 $327,953 13 $353,792 0 $0 APPLICATIONS DENIED 6 $332,392 3 $231,680 2 $247,520 APPLICATIONS WITHDRAWN 9 $318,841 4 $301,135 0 $0 FILES CLOSED FOR INCOMPLETENESS 2 $428,650 0 $0 0 $0
Aggregated Statistics For Year 2006(Based on 2 full tracts) A) Conventional B) Refinancings C) Non-occupant Loans on Number Average Value Number Average Value Number Average Value
LOANS ORIGINATED 20 $332,618 17 $379,122 1 $357,620 APPLICATIONS APPROVED, NOT ACCEPTED 9 $412,063 4 $399,782 1 $361,600 APPLICATIONS DENIED 5 $386,036 1 $411,270 0 $0 APPLICATIONS WITHDRAWN 3 $279,010 3 $417,063 0 $0 FILES CLOSED FOR INCOMPLETENESS 0 $0 0 $0 0 $0
Aggregated Statistics For Year 2005(Based on 2 full tracts) A) Conventional B) Refinancings C) Non-occupant Loans on D) Loans On Manufactured Number Average Value Number Average Value Number Average Value Number Average Value
LOANS ORIGINATED 69 $321,370 15 $320,674 9 $304,222 0 $0 APPLICATIONS APPROVED, NOT ACCEPTED 8 $295,175 3 $255,623 1 $172,000 1 $172,000 APPLICATIONS DENIED 1 $325,840 2 $224,510 1 $325,840 0 $0 APPLICATIONS WITHDRAWN 4 $267,970 5 $268,284 1 $251,000 0 $0 FILES CLOSED FOR INCOMPLETENESS 1 $350,000 0 $0 0 $0 0 $0
Aggregated Statistics For Year 2004(Based on 2 full tracts) A) Conventional B) Refinancings C) Non-occupant Loans on D) Loans On Manufactured Number Average Value Number Average Value Number Average Value Number Average Value
LOANS ORIGINATED 99 $253,600 41 $225,338 13 $224,706 2 $250,120 APPLICATIONS APPROVED, NOT ACCEPTED 13 $242,717 8 $239,334 1 $257,000 0 $0 APPLICATIONS DENIED 2 $394,380 0 $0 0 $0 0 $0 APPLICATIONS WITHDRAWN 7 $209,860 3 $258,937 3 $188,973 0 $0 FILES CLOSED FOR INCOMPLETENESS 0 $0 0 $0 0 $0 0 $0
Aggregated Statistics For Year 2003(Based on 2 full tracts) A) Conventional B) Refinancings C) Non-occupant Loans on Number Average Value Number Average Value Number Average Value
LOANS ORIGINATED 112 $201,995 87 $206,653 5 $144,420 APPLICATIONS APPROVED, NOT ACCEPTED 17 $187,138 30 $229,647 1 $99,340 APPLICATIONS DENIED 1 $330,800 3 $228,150 0 $0 APPLICATIONS WITHDRAWN 4 $165,175 7 $235,800 0 $0 FILES CLOSED FOR INCOMPLETENESS 0 $0 3 $138,967 1 $213,580
Aggregated Statistics For Year 2002(Based on 2 full tracts) A) Conventional B) Refinancings C) Non-occupant Loans on Number Average Value Number Average Value Number Average Value
LOANS ORIGINATED 118 $201,722 39 $198,669 9 $161,471 APPLICATIONS APPROVED, NOT ACCEPTED 15 $181,978 5 $170,516 0 $0 APPLICATIONS DENIED 2 $165,455 1 $91,390 0 $0 APPLICATIONS WITHDRAWN 4 $212,340 6 $164,783 0 $0 FILES CLOSED FOR INCOMPLETENESS 2 $185,000 0 $0 0 $0
Aggregated Statistics For Year 2001(Based on 2 full tracts) A) Conventional B) Refinancings C) Non-occupant Loans on Number Average Value Number Average Value Number Average Value
LOANS ORIGINATED 99 $170,331 50 $177,979 6 $86,378 APPLICATIONS APPROVED, NOT ACCEPTED 12 $153,115 9 $186,689 2 $83,940 APPLICATIONS DENIED 2 $133,455 4 $166,692 1 $163,910 APPLICATIONS WITHDRAWN 0 $0 0 $0 0 $0 FILES CLOSED FOR INCOMPLETENESS 0 $0 1 $168,880 0 $0
Aggregated Statistics For Year 2000(Based on 2 full tracts) A) Conventional B) Refinancings C) Non-occupant Loans on Number Average Value Number Average Value Number Average Value
LOANS ORIGINATED 85 $169,575 13 $159,425 6 $115,848 APPLICATIONS APPROVED, NOT ACCEPTED 5 $144,346 6 $144,033 0 $0 APPLICATIONS DENIED 7 $178,814 1 $77,490 0 $0 APPLICATIONS WITHDRAWN 1 $197,690 0 $0 0 $0 FILES CLOSED FOR INCOMPLETENESS 3 $289,253 0 $0 0 $0
Aggregated Statistics For Year 1999(Based on 1 full and 2 partial tracts) A) Conventional B) Refinancings C) Non-occupant Loans on Number Average Value Number Average Value Number Average Value
LOANS ORIGINATED 79 $162,317 57 $145,899 2 $89,925 APPLICATIONS APPROVED, NOT ACCEPTED 3 $239,150 8 $126,221 0 $0 APPLICATIONS DENIED 4 $219,502 2 $143,295 0 $0 APPLICATIONS WITHDRAWN 8 $131,402 1 $214,330 0 $0 FILES CLOSED FOR INCOMPLETENESS 0 $0 1 $95,740 0 $0
Detailed PMIC statistics for the following Tracts:
4808.00
, 4809.00 Fire-safe hotels and motels in Herndon, Virginia:
Crowne Plaza Dulles Airport, 2200 Centreville Rd, Herndon, Virginia 20170 Phone: (703) 471-6700, Fax: (703) 471-8284
Hyatt Dulles, 2300 Dulles Corner Blvd, Herndon, Virginia 20171 Phone: (703) 713-1234, Fax: (703) 793-6894
Staybridge Suites - Herndon/Dulles, 13700 Coppermine Rd, Herndon, Virginia 20171 Phone: (703) 713-6800, Fax: (703) 713-6824
Fairfield Inn & Suites Dulles Airport Herndon Reston, 485 Elden St, Herndon, Virginia 20170 Phone: (703) 478-9777, Fax: (703) 471-4624
Comfort Inn Dulles Int'l Airport, 200 Elden St, Herndon, Virginia 20170 Phone: (703) 437-7555, Fax: (703) 437-7572
Hyatt Summerfield Suites, 467 Herndon Pkwy, Herndon, Virginia 20170 Phone: (703) 437-5000, Fax: (703) 464-5808
Embassy Suites Dulles Airport, 13341 Woodland Park Dr, Herndon, Virginia 20171 Phone: (703) 464-0200, Fax: (703) 464-4699
Candlewood Suites - Herndon, 13845 Sunrise Valley Dr, Herndon, Virginia 20171 Phone: (703) 793-7100, Fax: (703) 793-7111
9 other hotels and motels
All 17 fire-safe hotels and motels in Herndon, Virginia
Most common first names in Herndon, VA among deceased individuals Name Count Lived (average)
Mary 50 82.5 years William 49 75.7 years John 38 73.4 years Robert 33 74.0 years James 31 74.5 years Joseph 29 82.0 years Margaret 27 79.1 years Thomas 24 78.3 years Dorothy 23 85.5 years Ruth 22 85.3 years
Most common last names in Herndon, VA among deceased individuals Last name Count Lived (average)
Jones 12 71.3 years Brown 11 76.9 years Williams 10 84.9 years Lee 9 93.9 years Miller 9 79.0 years Justis 8 88.4 years Post 8 84.5 years Launders 8 89.0 years Green 8 75.0 years Davis 8 75.1 years
Herndon compared to Virginia state average:
Median household income above state average. Unemployed percentage significantly below state average. Black race population percentage below state average. Hispanic race population percentage significantly above state average. Foreign-born population percentage significantly above state average. Length of stay since moving in significantly above state average. Percentage of population with a bachelor's degree or higher above state average.
#10 on the list of "Top 101 cities with the most residents born in Honduras (population 500+)"
#24 on the list of "Top 101 cities with the most residents born in Ethiopia (population 500+)"
#31 on the list of "Top 100 high-educated but low-earning cities (pop. 5,000+)"
#48 on the list of "Top 101 cities with the most residents born in El Salvador (population 500+)"
#55 on the list of "Top 101 cities with the most residents born in Eastern Africa (population 500+)"
#59 on the list of "Top 101 cities with the most residents born in Pakistan (population 500+)"
#81 on the list of "Top 100 cities with highest median household income and median resident age less than 35"
#87 on the list of "Top 101 cities with the most residents born in Peru (population 500+)"
#95 on the list of "Top 101 cities with the most residents born in Bolivia (population 500+)"
#3 on the list of "Top 101 counties with the largest number of children under 18 without health insurance coverage in 2000 (pop. 50,000+)"
#4 on the list of "Top 101 counties with the lowest lead air pollution readings in 2012 (µg/m3 )"
#5 on the list of "Top 101 counties with the largest number of people without health insurance coverage in 2000 (pop. 50,000+)"
#7 on the list of "Top 101 counties with the largest increase in the number of infant deaths per 1000 residents 2000-2006 to 2007-2013 (pop. 50,000+)"
#13 on the list of "Top 101 counties with the lowest number of deaths per 1000 residents 2007-2013 (pop. 50,000+)"
Top Patent Applicants
Esmael Hejazi Dinan (185)
Jack C. Rains, Jr. (78)
Hua Zhou (74)
Kai Xu (58)
Ali Cagatay Cirik (41)
Weihua Qiao (30)
Martin W. Mckee (29)
David James Hutz (25)
Hitesh Batra (25)
Zhijun Cai (25)
Total of 1721 patent applications in 2008-2024.
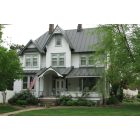


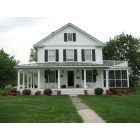
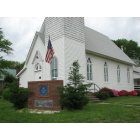
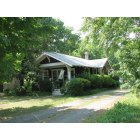
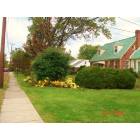
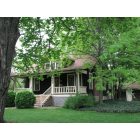
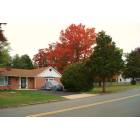
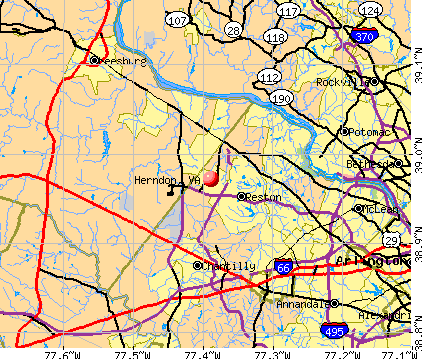


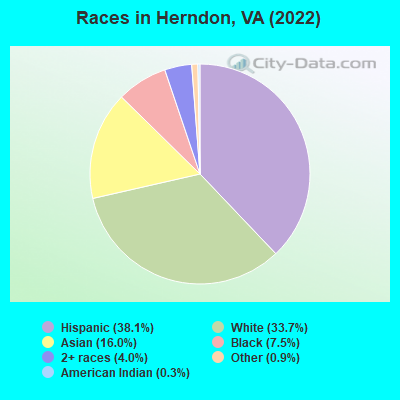
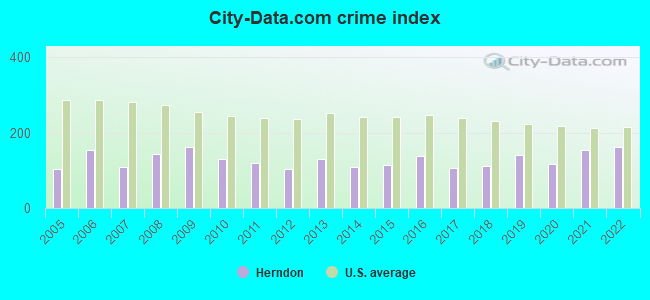
 Recent articles from our blog. Our writers, many of them Ph.D. graduates or candidates, create easy-to-read articles on a wide variety of topics.

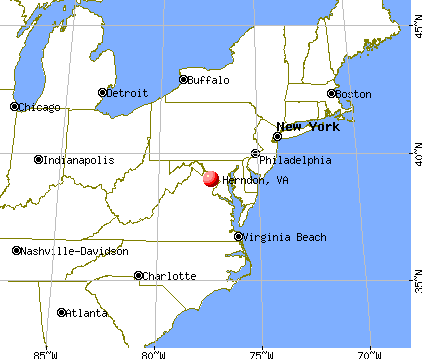
 (2.6 miles
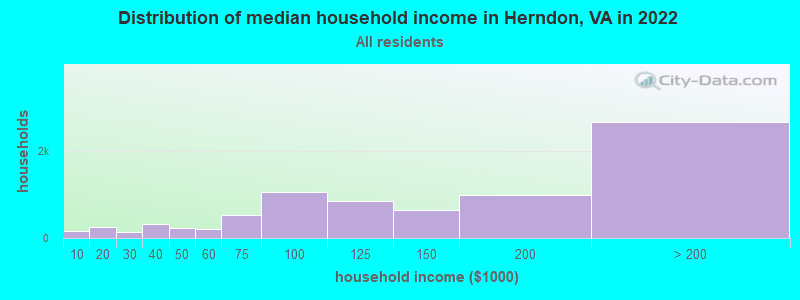
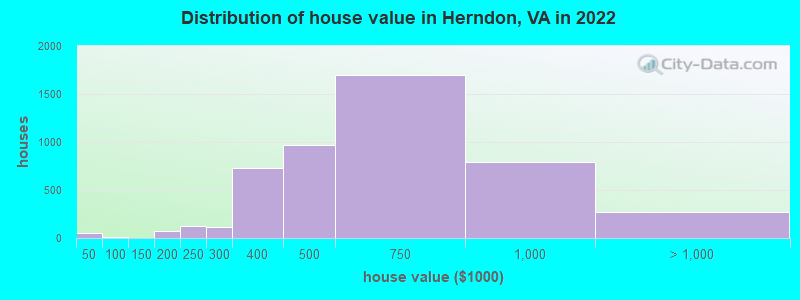
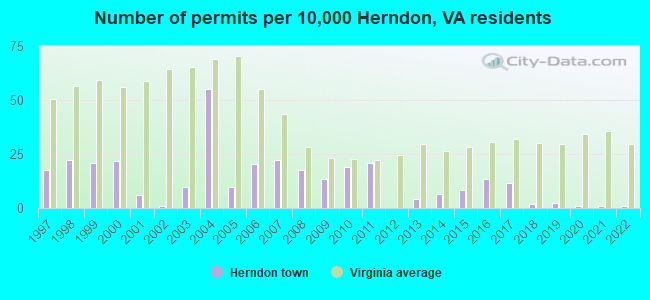
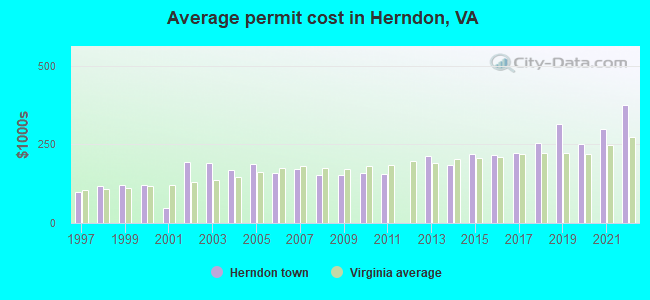
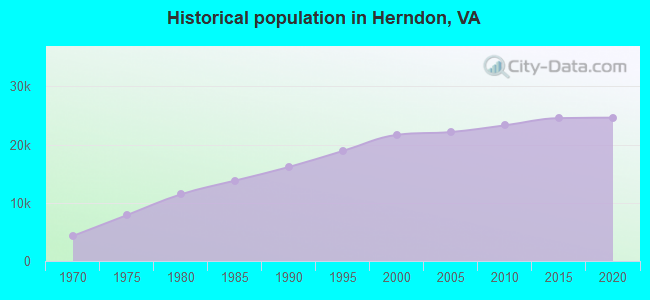
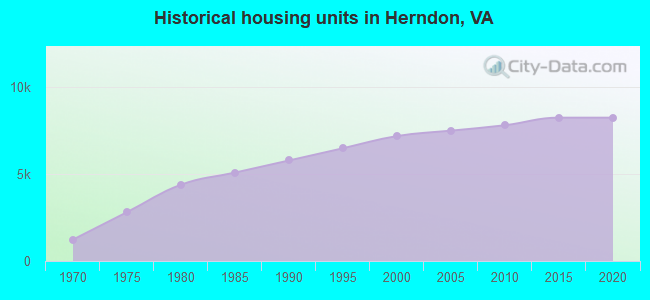
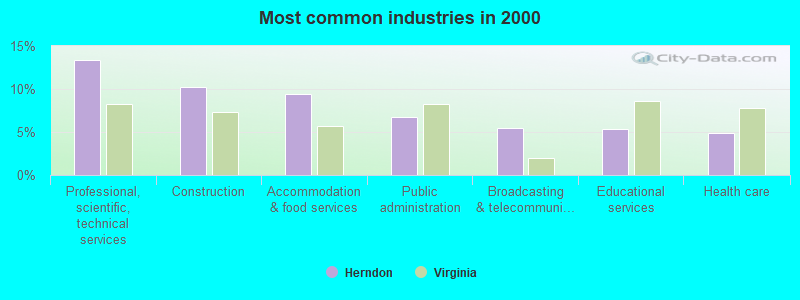
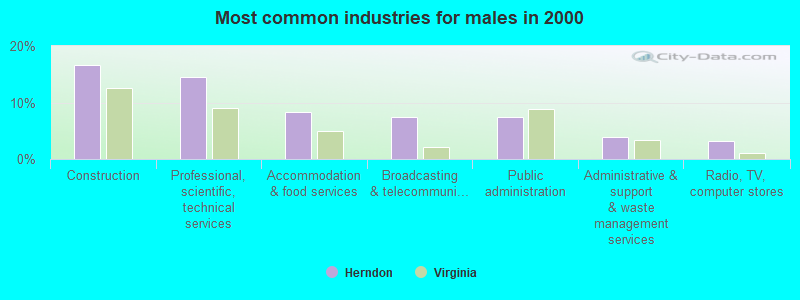
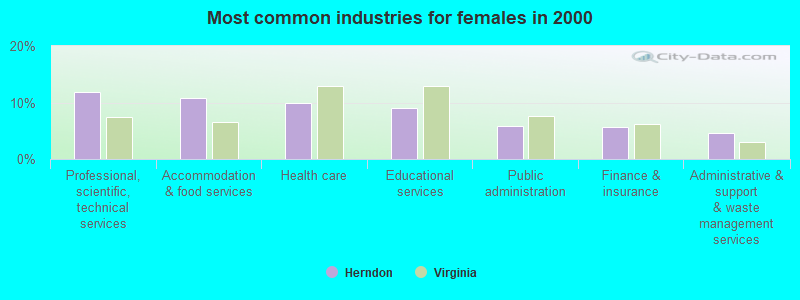
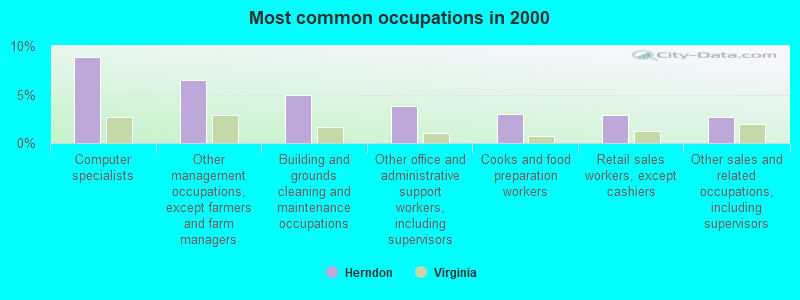
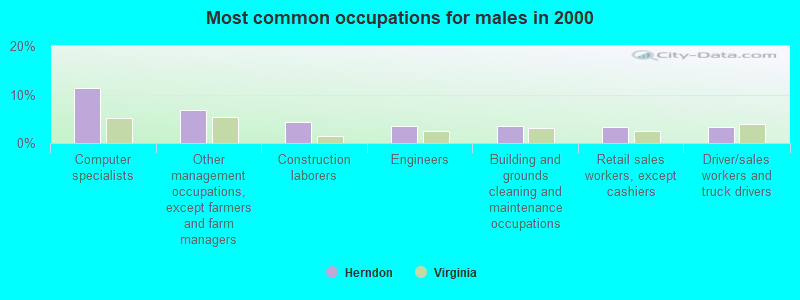
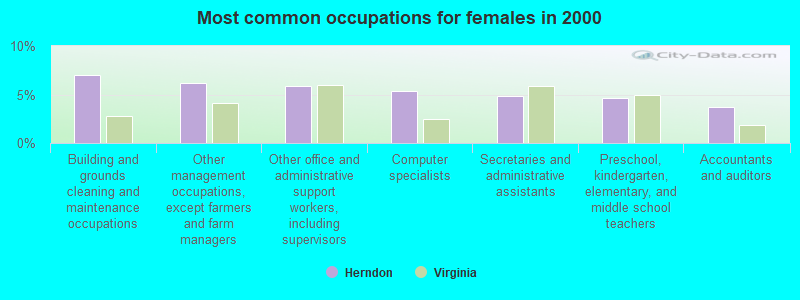
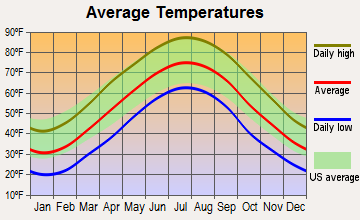
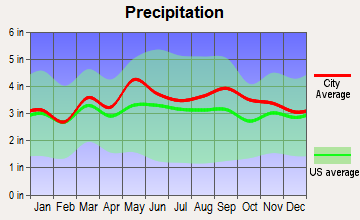
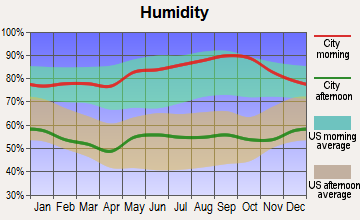
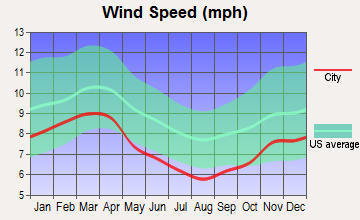
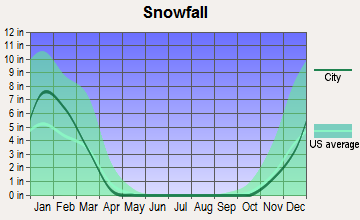
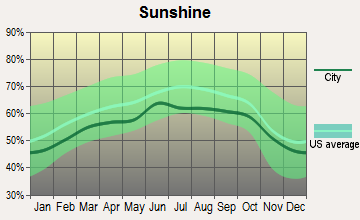
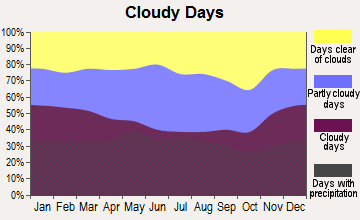
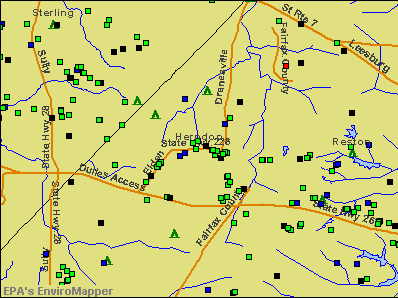

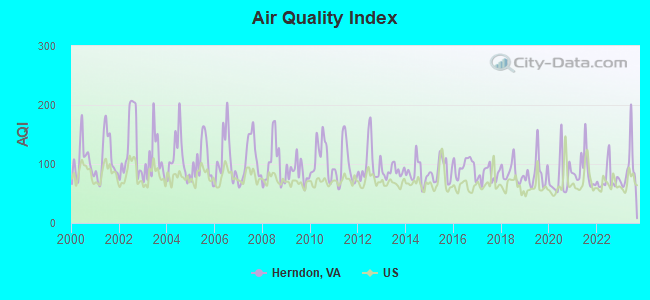
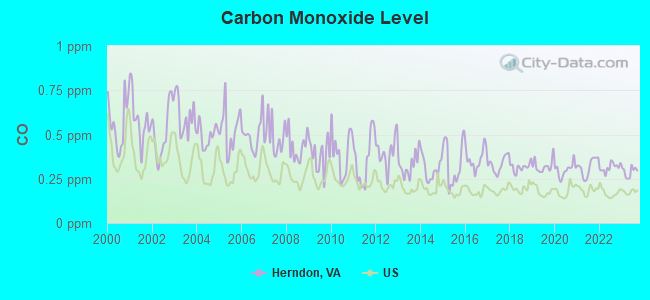
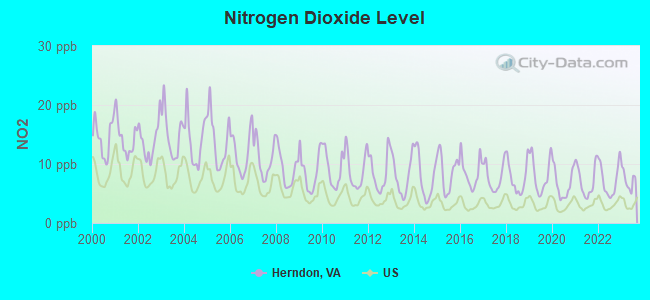
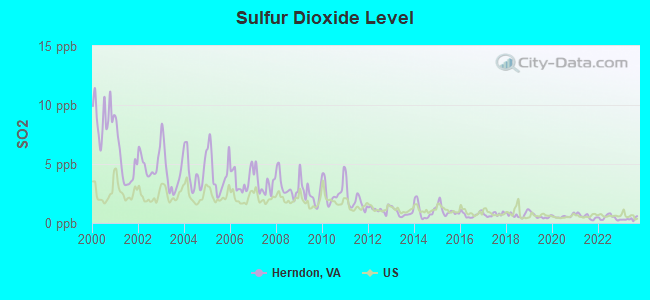
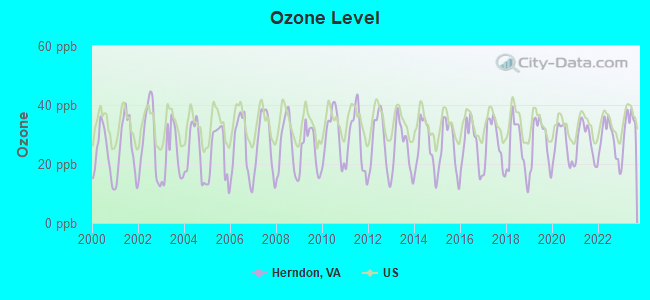
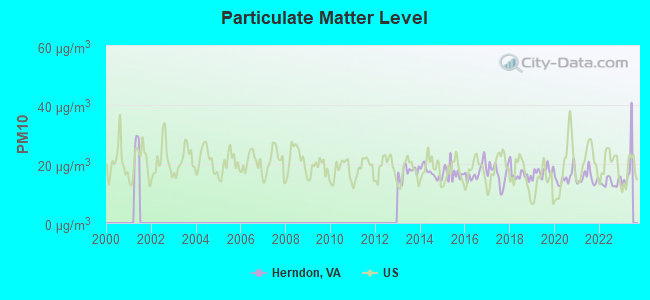
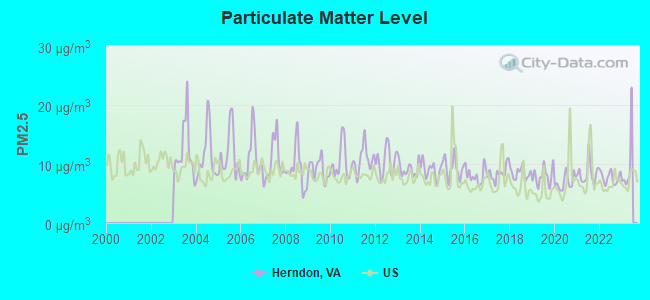
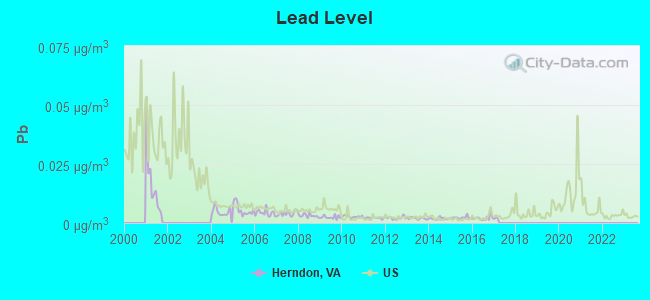
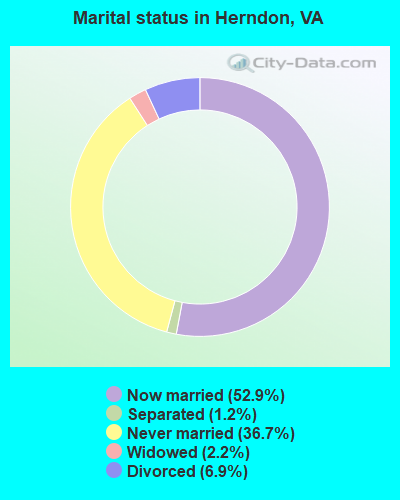
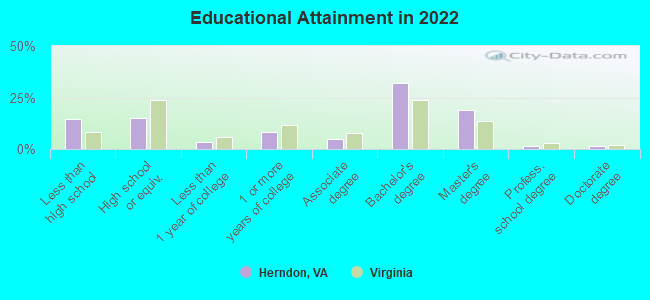
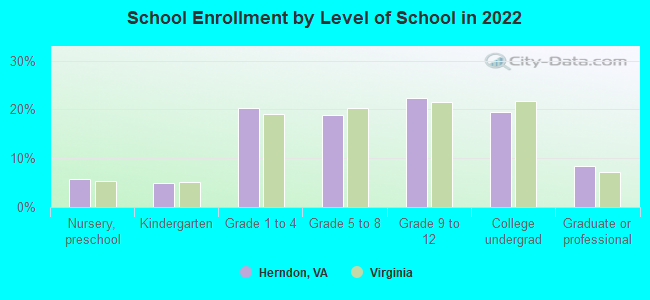
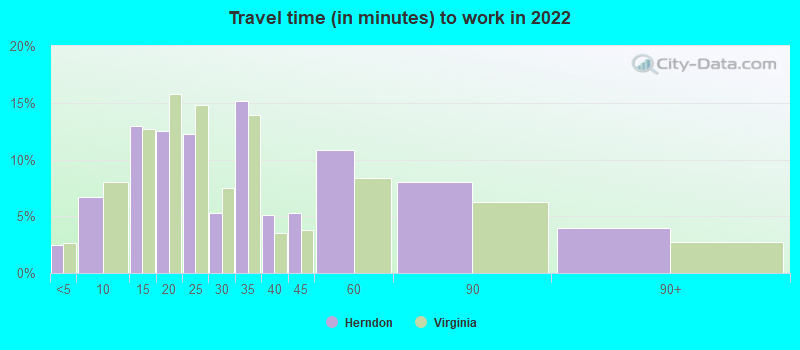
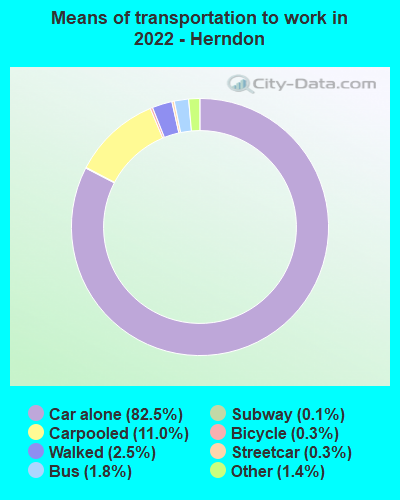
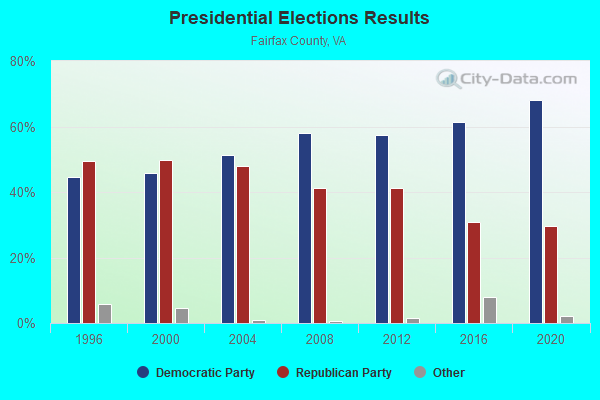
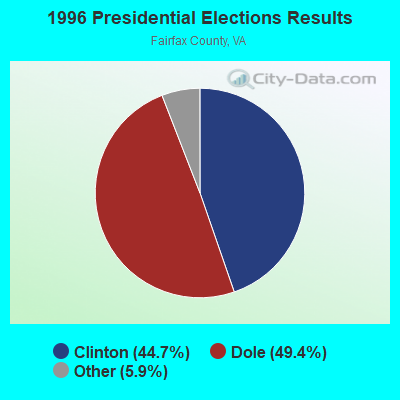
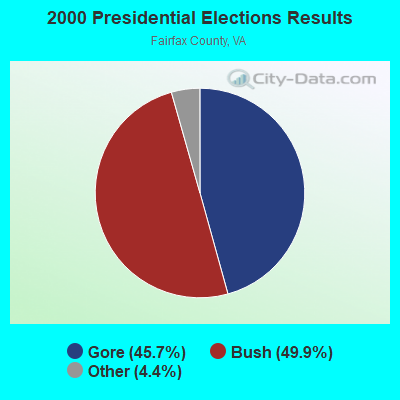
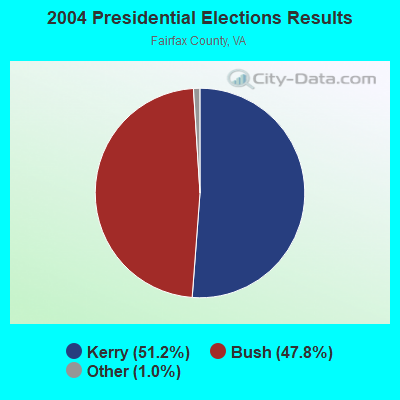
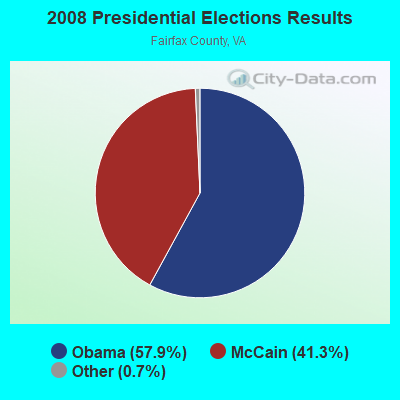
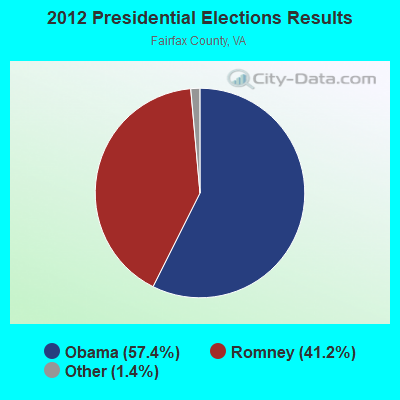
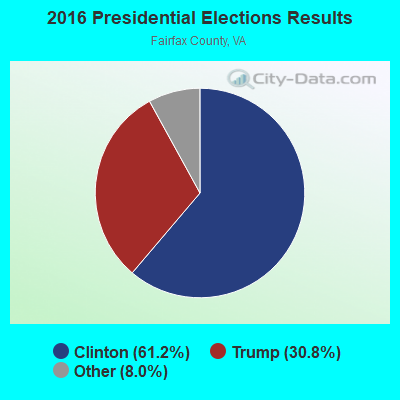
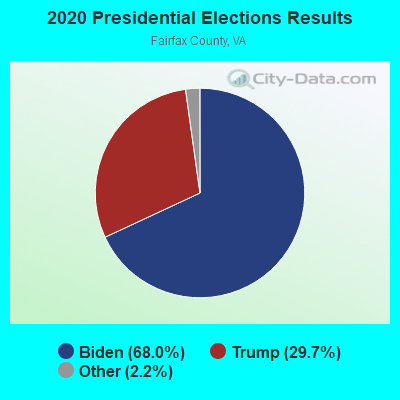
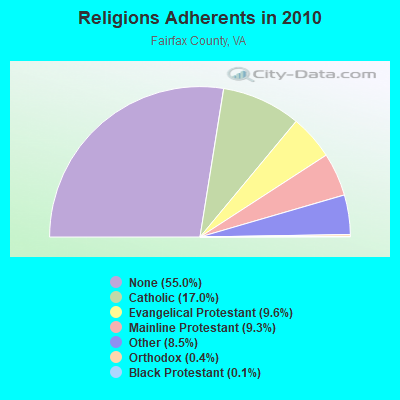
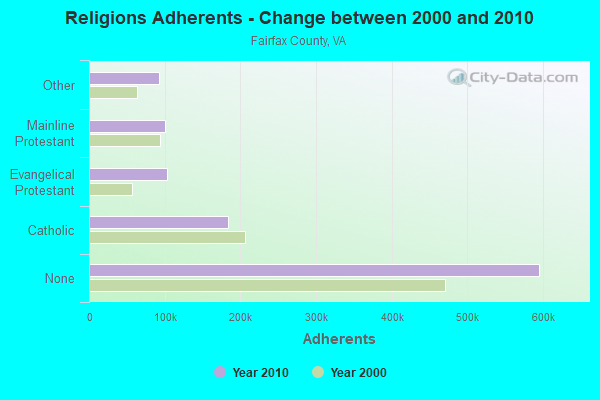
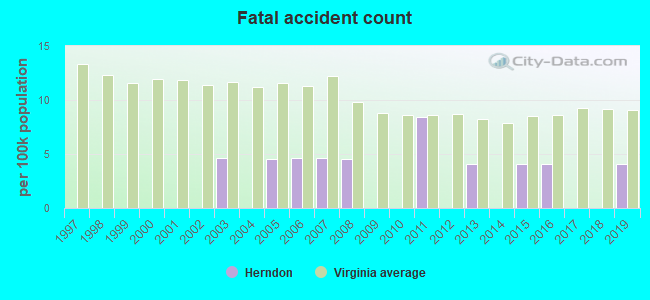
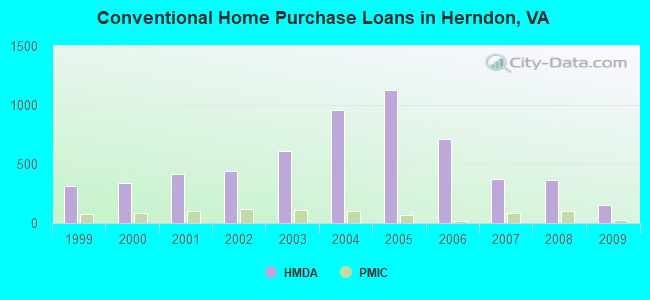
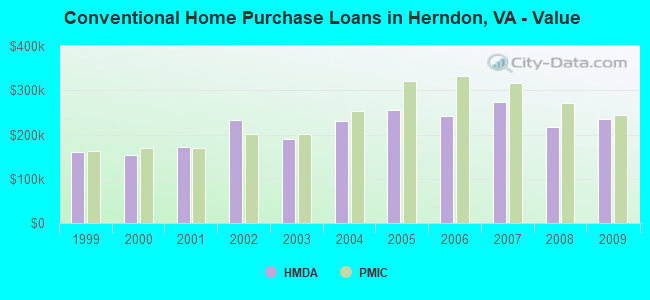
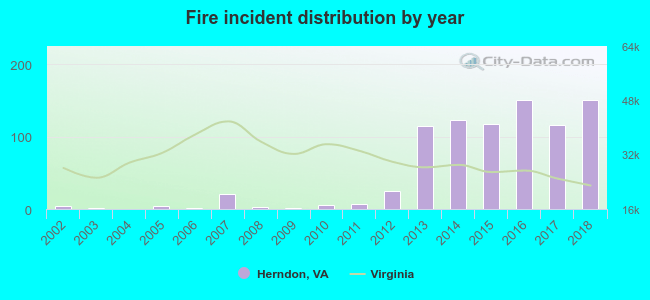 According to the data from the years 2002 - 2018 the average number of fire incidents per year is 50. The highest number of fire incidents - 150 took place in 2016, and the least - 0 in 2004. The data has an increasing trend.
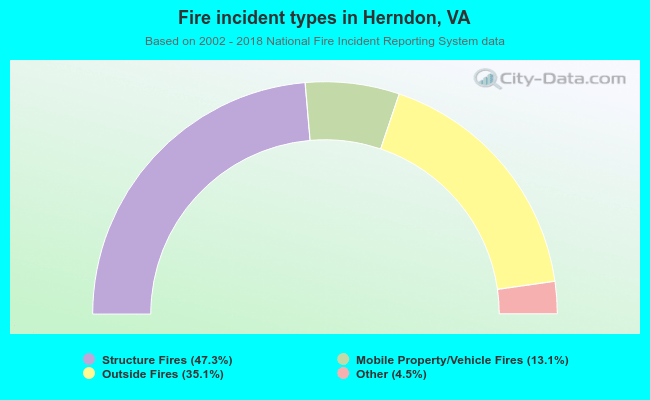 When looking into fire subcategories, the most incidents belonged to: Structure Fires (47.3%), and Outside Fires (35.1%).