Prince William County, Virginia (VA)
County owner-occupied free and clear houses and condos in 2010: 8,714
County owner-occupied houses and condos in 2000: 67,798
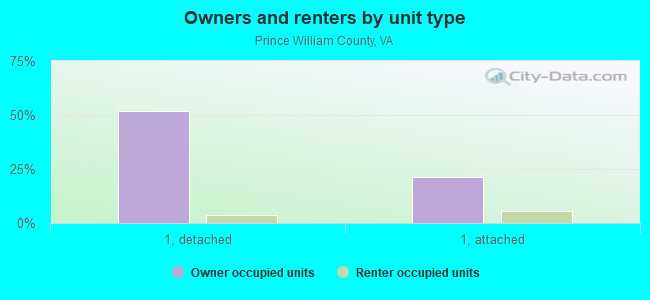
Renter-occupied apartments: 35,032 (it was 26,772 in 2000)
| % of renters here: | 28% |
| State: | 33% |
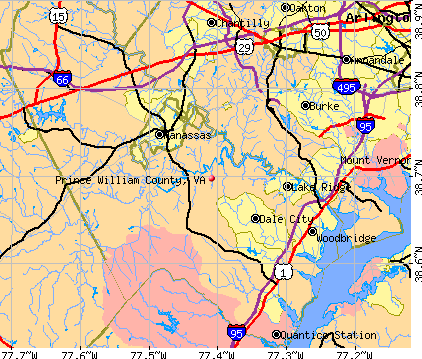
Land area: 338 sq. mi.
Water area: 10.6 sq. mi.
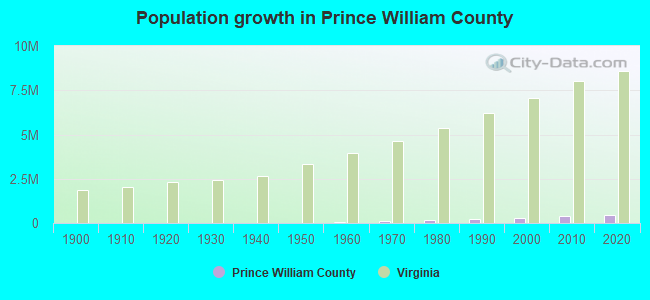
Population density: 1442 people per square mile (very high).
Industries providing employment: Educational, health and social services (20.6%), Professional, scientific, management, administrative, and waste management services (18.7%), Public administration (12.6%), Retail trade (10.1%).
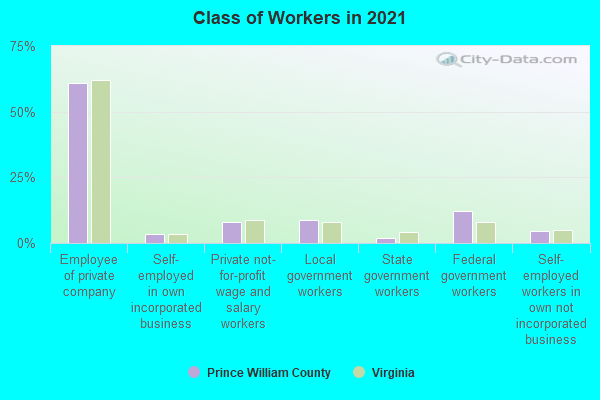
Type of workers:
- Private wage or salary: 69%
- Government: 26%
- Self-employed, not incorporated: 4%
- Unpaid family work: 0%
- OSM Map
- General Map
- Google Map
- MSN Map

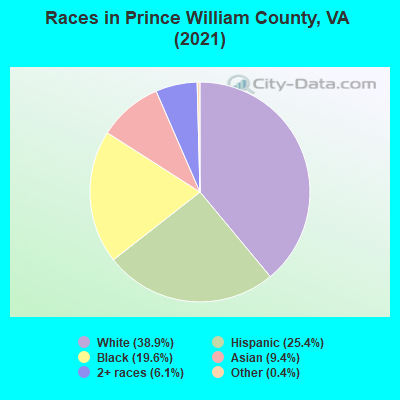
- 187,36738.5%White Non-Hispanic Alone
- 125,52025.8%Hispanic or Latino
- 96,94219.9%Black Non-Hispanic Alone
- 49,64410.2%Asian alone
- 25,0055.1%Two or more races
- 2,0020.4%Some other race alone
- 3640.07%American Indian and Alaska Native alone
- 990.02%Native Hawaiian and Other
Pacific Islander alone
| Median resident age: | 36.1 years |
| Virginia median age: | 39.0 years |
| Males: 245,157 | |
| Females: 241,786 |


| Prince William County: | 3.0 people |
| Virginia: | 3 people |
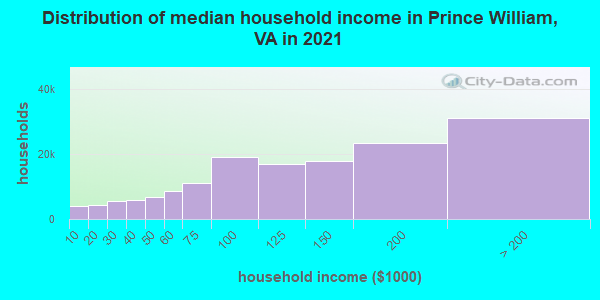
Estimated median household income in 2022: $120,398 ($65,960 in 1999)
| This county: | $120,398 |
| Virginia: | $85,873 |
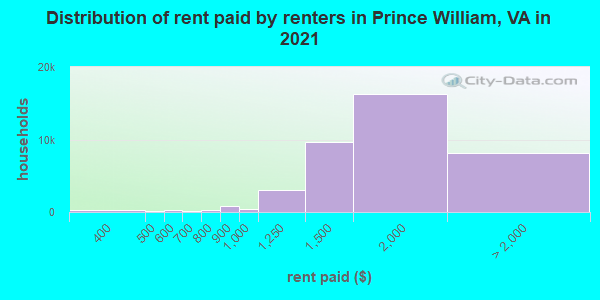
Median contract rent in 2022 for apartments: $1,733 (lower quartile is $1,411, upper quartile is $2,082)
| This county: | $1733 |
| State: | $1270 |
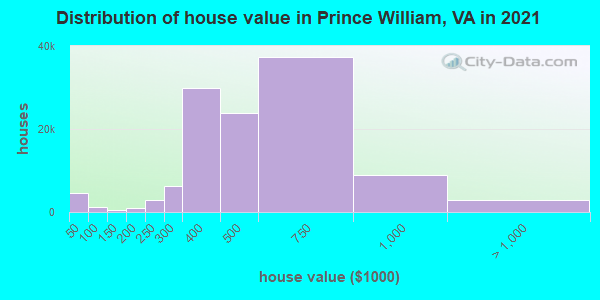
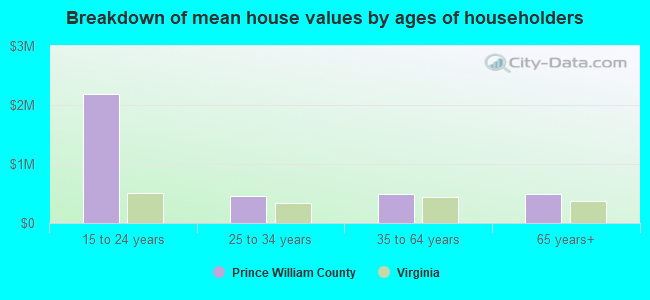
Estimated median house or condo value in 2022: $512,500 (it was $147,900 in 2000)
| Prince William: | $512,500 |
| Virginia: | $365,700 |
Mean price in 2022:
Median monthly housing costs for homes and condos with a mortgage: $2,446Detached houses: $625,682
Here: $625,682 State: $472,865 Townhouses or other attached units: $403,378
Here: $403,378 State: $457,437 In 2-unit structures: $337,358
Here: $337,358 State: $396,289 In 3-to-4-unit structures: $374,199
Here: $374,199 State: $252,346 In 5-or-more-unit structures: $286,991
Here: $286,991 State: $382,551 Mobile homes: $118,795
Here: $118,795 State: $100,736
Median monthly housing costs for units without a mortgage: $739
Institutionalized population: 1,511
Crime in 2021 (reported by the sheriff's office or county police, not the county total):
- Murders: 10
- Rapes: 104
- Robberies: 185
- Assaults: 725
- Burglaries: 420
- Thefts: 4257
- Auto thefts: 497
Crime in 2020 (reported by the sheriff's office or county police, not the county total):
- Murders: 7
- Rapes: 82
- Robberies: 145
- Assaults: 708
- Burglaries: 417
- Thefts: 3805
- Auto thefts: 414
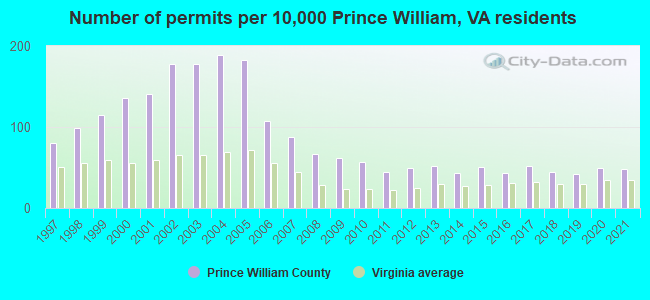
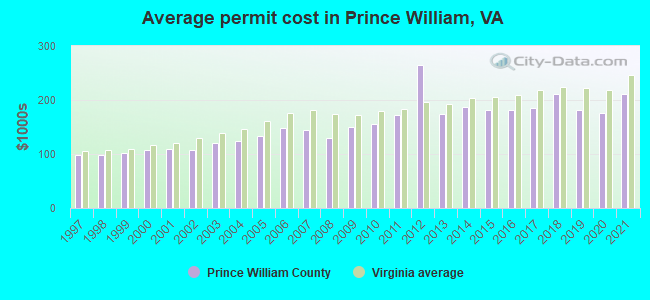
Single-family new house construction building permits:
- 2022: 979 buildings, average cost: $244,900
- 2021: 1346 buildings, average cost: $212,000
- 2020: 1369 buildings, average cost: $176,000
- 2019: 1186 buildings, average cost: $181,000
- 2018: 1248 buildings, average cost: $210,900
- 2017: 1457 buildings, average cost: $185,800
- 2016: 1214 buildings, average cost: $182,000
- 2015: 1444 buildings, average cost: $180,800
- 2014: 1208 buildings, average cost: $187,100
- 2013: 1473 buildings, average cost: $174,900
- 2012: 1397 buildings, average cost: $265,300
- 2011: 1251 buildings, average cost: $172,100
- 2010: 1602 buildings, average cost: $155,500
- 2009: 1729 buildings, average cost: $149,900
- 2008: 1887 buildings, average cost: $128,700
- 2007: 2478 buildings, average cost: $144,200
- 2006: 3007 buildings, average cost: $148,300
- 2005: 5140 buildings, average cost: $132,500
- 2004: 5307 buildings, average cost: $123,900
- 2003: 5006 buildings, average cost: $119,700
- 2002: 4998 buildings, average cost: $107,100
- 2001: 3950 buildings, average cost: $109,200
- 2000: 3816 buildings, average cost: $108,200
- 1999: 3224 buildings, average cost: $100,900
- 1998: 2789 buildings, average cost: $99,400
- 1997: 2259 buildings, average cost: $99,200
Median real estate property taxes paid for housing units with mortgages in 2022: $4,806 (0.9%)
Median real estate property taxes paid for housing units with no mortgage in 2022: $4,958 (1.0%)
| Prince William County: | 6.9% |
| Virginia: | 10.6% |
Median age of residents in 2022: 36.1 years old
(Males: 35.4 years old, Females: 36.8 years old)
(Median age for: White residents: 41.2 years old, Black residents: 36.7 years old, American Indian residents: 32.9 years old, Asian residents: 38.3 years old, Hispanic or Latino residents: 29.7 years old, Other race residents: 31.3 years old)
Area name: Washington-Arlington-Alexandria, DC-VA-MD HUD Metro FMR Area
Fair market rent in 2006 for a 1-bedroom apartment in Prince William County is $1080 a month.
Fair market rent for a 2-bedroom apartment is $1225 a month.
Fair market rent for a 3-bedroom apartment is $1580 a month.
Cities in this county include: Dale City, Manassas, Marumsco, Woodbridge, Lake Ridge, Buckhall, Cherry Hill, Montclair, Neabsco, Bull Run.
2023 air pollution in Prince William County:
Nitrogen Dioxide: 0.00 ppm (standard limit: 0.053 ppm). Below U.S. average.
Ozone (1-hour): 0.031 ppm (standard limit: 0.12 ppm). Near U.S. average.
Neighboring counties: Clay County, West Virginia  , Bracken County, Kentucky , Delta County, Colorado , Mason County, West Virginia , Fauquier County , Monroe County, Illinois .
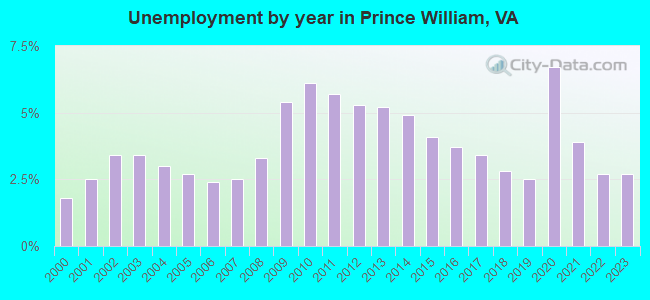
| Here: | 2.6% |
| Virginia: | 2.7% |
Current college students: 16,310
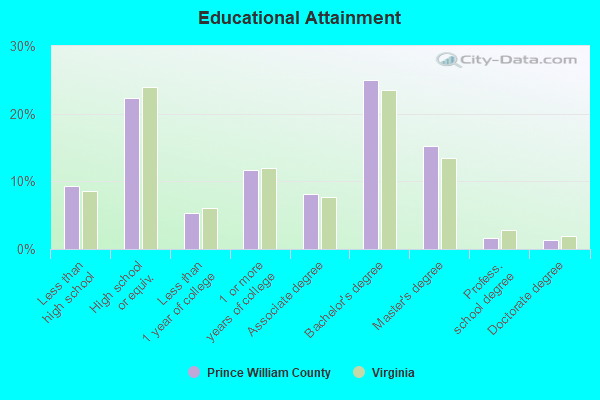
People 25 years of age or older with a high school degree or higher: 90.4%
People 25 years of age or older with a bachelor's degree or higher: 43.9%
Number of foreign born residents: 121,485 (57.8% naturalized citizens)
| Prince William County: | 24.9% |
| Whole state: | 12.7% |
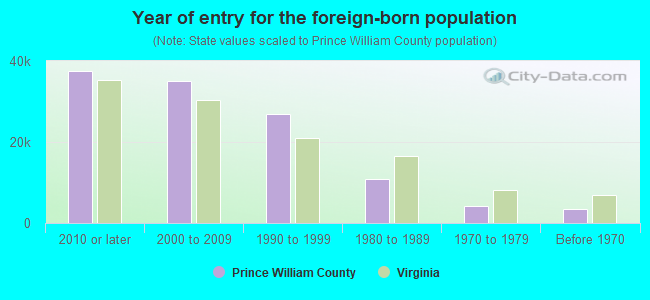
- Year of entry for the foreign-born population
- 38,3732010 or later
- 36,7682000 to 2009
- 24,6781990 to 1999
- 10,9121980 to 1989
- 4,2681970 to 1979
- 3,504Before 1970
Mean travel time to work (commute): # minutes
Percentage of county residents living and working in this county: 91.7%
Housing units in structures:
- One, detached: 87,548
- One, attached: 43,245
- Two: 1,223
- 3 or 4: 2,180
- 5 to 9: 4,025
- 10 to 19: 14,072
- 20 to 49: 2,239
- 50 or more: 5,941
- Mobile homes: 1,605
Housing units in Prince William County with a mortgage: 91,207 (8,121 second mortgage, 124 home equity loan, 6,727 both second mortgage and home equity loan)
Houses without a mortgage: 1,395
| Here: | 98.9% with mortgage |
| State: | 97.2% with mortgage |
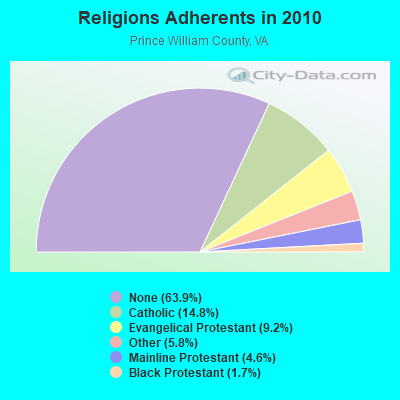
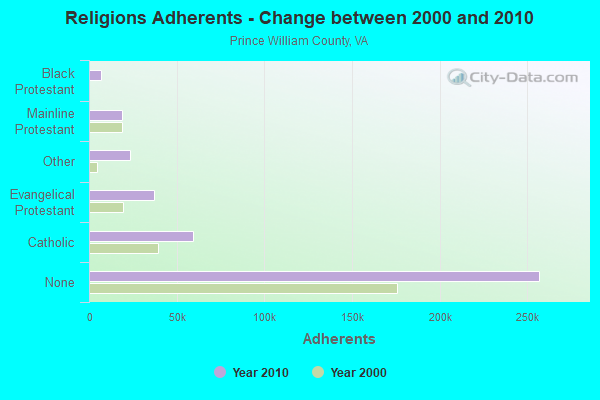
Religion statistics for Prince William County
| Religion | Adherents | Congregations |
|---|---|---|
| Catholic | 59,551 | 6 |
| Evangelical Protestant | 36,833 | 131 |
| Other | 23,214 | 22 |
| Mainline Protestant | 18,644 | 29 |
| Black Protestant | 6,926 | 10 |
| None | 256,834 | - |
Source: Clifford Grammich, Kirk Hadaway, Richard Houseal, Dale E.Jones, Alexei Krindatch, Richie Stanley and Richard H.Taylor. 2012. 2010 U.S.Religion Census: Religious Congregations & Membership Study. Association of Statisticians of American Religious Bodies. Jones, Dale E., et al. 2002. Congregations and Membership in the United States 2000. Nashville, TN: Glenmary Research Center.
Food Environment Statistics:
| Prince William County: | 1.78 / 10,000 pop. |
| State: | 2.03 / 10,000 pop. |
| Here: | 0.11 / 10,000 pop. |
| Virginia: | 0.17 / 10,000 pop. |
| This county: | 1.20 / 10,000 pop. |
| Virginia: | 1.43 / 10,000 pop. |
| Prince William County: | 2.56 / 10,000 pop. |
| Virginia: | 4.03 / 10,000 pop. |
| This county: | 5.48 / 10,000 pop. |
| State: | 7.65 / 10,000 pop. |
| Prince William County: | 8.7% |
| Virginia: | 9.3% |
| Prince William County: | 28.2% |
| State: | 26.7% |
| Here: | 25.9% |
| State: | 18.6% |
Agriculture in Prince William County:
Average size of farms: 93 acresAverage value of agricultural products sold per farm: $27,203
Average value of crops sold per acre for harvested cropland: $231.36
The value of livestock, poultry, and their products as a percentage of the total market value of agricultural products sold: 60.14%
Average total farm production expenses per farm: $31,109
Harvested cropland as a percentage of land in farms: 50.39%
Average market value of all machinery and equipment per farm: $34,838
The percentage of farms operated by a family or individual: 84.86%
Average age of principal farm operators: 56 years
Average number of cattle and calves per 100 acres of all land in farms: 19.81
Milk cows as a percentage of all cattle and calves: 20.55%
Corn for grain: 1448 harvested acres
All wheat for grain: 671 harvested acres
Soybeans for beans: 1407 harvested acres
Vegetables: 56 harvested acres
Land in orchards: 32 acres
Earthquake activity:
Prince William County-area historical earthquake activity is significantly above Virginia state average. It is 55% smaller than the overall U.S. average.On 8/23/2011 at 17:51:04, a magnitude 5.8 (5.8 MW, Depth: 3.7 mi, Class: Moderate, Intensity: VI - VII) earthquake occurred 61.4 miles away from Prince William County center
On 8/25/2011 at 05:07:52, a magnitude 4.5 (4.5 ML, Depth: 4.2 mi, Class: Light, Intensity: IV - V) earthquake occurred 60.0 miles away from the county center
On 12/9/2003 at 20:59:18, a magnitude 4.5 (4.5 ML, Depth: 6.2 mi) earthquake occurred 74.0 miles away from the county center
On 12/9/2003 at 20:59:14, a magnitude 4.5 (4.5 MB, 4.5 LG) earthquake occurred 81.2 miles away from the county center
On 9/25/1998 at 19:52:52, a magnitude 5.2 (4.8 MB, 4.3 MS, 5.2 LG, 4.5 MW, Depth: 3.1 mi) earthquake occurred 249.7 miles away from Prince William County center
On 1/16/1994 at 01:49:16, a magnitude 4.6 (4.6 MB, 4.6 LG, Depth: 3.1 mi) earthquake occurred 134.7 miles away from the county center
Magnitude types: regional Lg-wave magnitude (LG), body-wave magnitude (MB), local magnitude (ML), surface-wave magnitude (MS), moment magnitude (MW)
Most recent natural disasters:
- Virginia Covid-19 Pandemic, Incident Period: January 20, 2020, Major Disaster (Presidential) Declared DR-4512-VA: April 2, 2020, FEMA Id: 4512, Natural disaster type: Other
- Virginia Severe Winter Storm And Snowstorm, Incident Period: January 22, 2016 to January 23, 2016, Major Disaster (Presidential) Declared DR-4262: March 07, 2016, FEMA Id: 4262, Natural disaster type: Snowstorm, Winter Storm
- Virginia Hurricane Sandy, Incident Period: October 26, 2012 to November 01, 2012, Emergency Declared EM-3359: October 29, 2012, FEMA Id: 3359, Natural disaster type: Hurricane
- Virginia Remnants of Tropical Storm Lee, Incident Period: September 08, 2011 to September 09, 2011, Major Disaster (Presidential) Declared DR-4045: November 17, 2011, FEMA Id: 4045, Natural disaster type: Tropical Storm
- Virginia Severe Winter Storms and Snowstorms, Incident Period: February 05, 2010 to February 11, 2010, Major Disaster (Presidential) Declared DR-1905: April 27, 2010, FEMA Id: 1905, Natural disaster type: Snowstorm, Winter Storm
- Virginia Severe Winter Storm and Snowstorm, Incident Period: December 18, 2009 to December 20, 2009, Major Disaster (Presidential) Declared DR-1874: February 16, 2010, FEMA Id: 1874, Natural disaster type: Snowstorm, Winter Storm
- Virginia Hurricane Katrina Evacuation, Incident Period: August 29, 2005 to October 01, 2005, Emergency Declared EM-3240: September 12, 2005, FEMA Id: 3240, Natural disaster type: Hurricane
- Virginia Hurricane Isabel, Incident Period: September 18, 2003 to October 01, 2003, Major Disaster (Presidential) Declared DR-1491: September 18, 2003, FEMA Id: 1491, Natural disaster type: Hurricane
- Virginia Winter Storm, Incident Period: January 25, 2000 to January 30, 2000, Major Disaster (Presidential) Declared DR-1318: February 28, 2000, FEMA Id: 1318, Natural disaster type: Winter Storm
- Virginia Hurricane Fran, Incident Period: September 05, 1996 to September 23, 1996, Major Disaster (Presidential) Declared DR-1135: September 06, 1996, FEMA Id: 1135, Natural disaster type: Hurricane
- 4 other natural disasters have been reported since 1953.
The number of natural disasters in Prince William County (14) is near the US average (15).
Major Disasters (Presidential) Declared: 10
Emergencies Declared: 4
Causes of natural disasters: Winter Storms: 5, Hurricanes: 4, Snowstorms: 3, Tropical Storms: 2, Blizzard: 1, Drought: 1, Other: 1 (Note: some incidents may be assigned to more than one category).
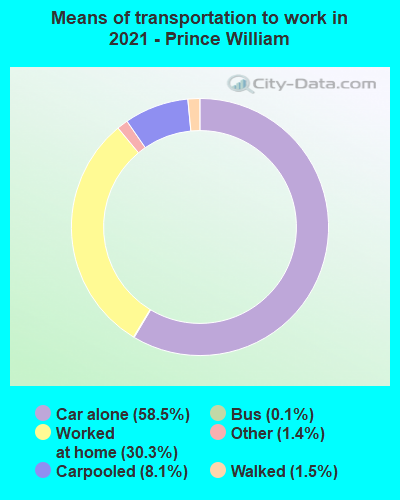
Means of transportation to work:
- Drove a car alone: 112,239 (59.8%)
- Carpooled: 15,605 (8.3%)
- Bus: 378 (0.2%)
- Long-distance train or commuter rail: 741 (0.4%)
- Taxicab, motorcycle, or other means: 4,449 (2.4%)
- Bicycle: 228 (0.1%)
- Walked: 3,129 (1.7%)
- Worked at home: 50,935 (27.1%)
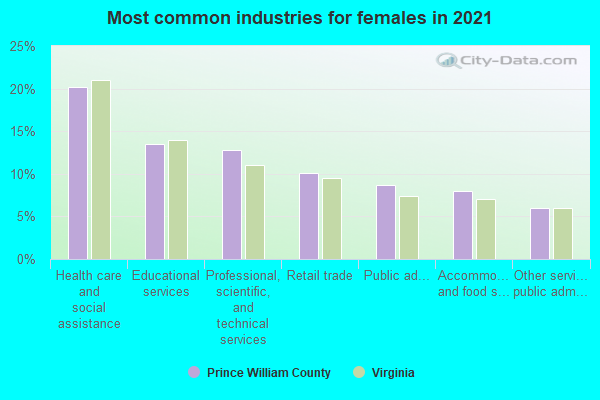
- Health care and social assistance (18%)
- Educational services (13%)
- Public administration (10%)
- Professional, scientific, and technical services (10%)
- Retail trade (8%)
- Other services, except public administration (5%)
- Accommodation and food services (5%)
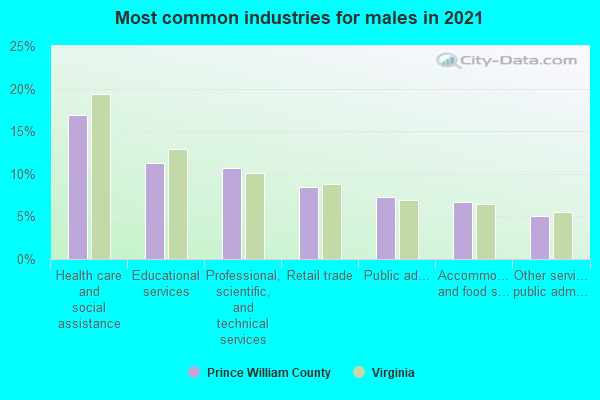
- Health care and social assistance (20%)
- Educational services (15%)
- Public administration (12%)
- Professional, scientific, and technical services (11%)
- Retail trade (9%)
- Other services, except public administration (6%)
- Accommodation and food services (6%)
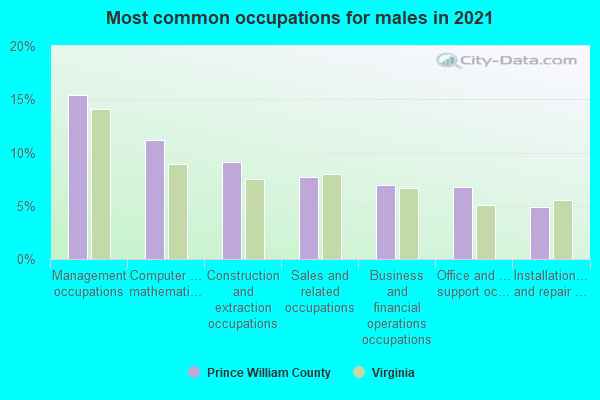
- Management occupations (13%)
- Construction and extraction occupations (11%)
- Computer and mathematical occupations (10%)
- Sales and related occupations (9%)
- Business and financial operations occupations (7%)
- Transportation occupations (6%)
- Office and administrative support occupations (5%)
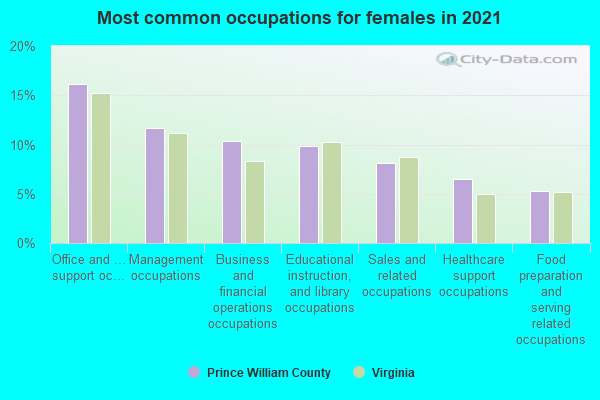
- Office and administrative support occupations (14%)
- Business and financial operations occupations (12%)
- Educational instruction, and library occupations (11%)
- Management occupations (11%)
- Sales and related occupations (6%)
- Healthcare support occupations (5%)
- Computer and mathematical occupations (5%)
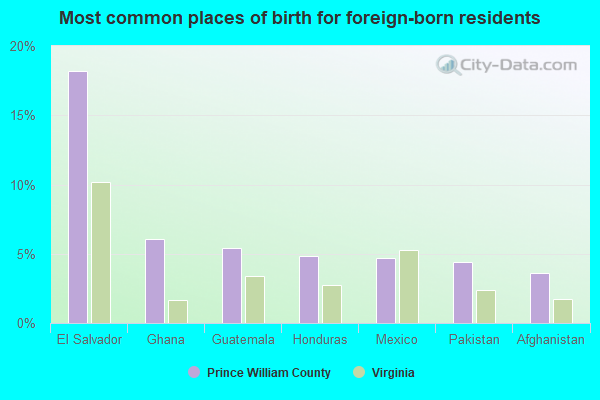
- El Salvador (20%)
- Ghana (6%)
- Afghanistan (4%)
- Mexico (4%)
- Honduras (4%)
- Ethiopia (4%)
- Philippines (4%)
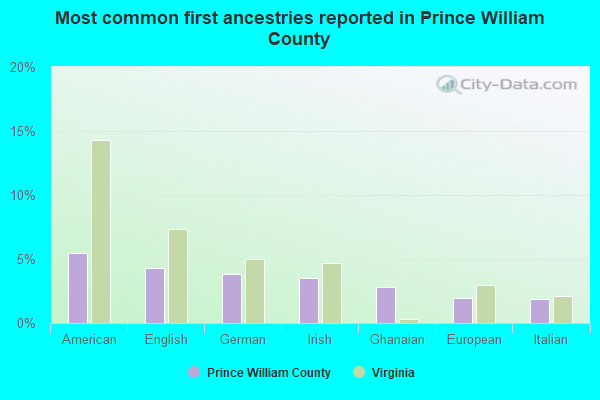
- American (5%)
- English (4%)
- Irish (4%)
- German (4%)
- Ghanaian (3%)
- Ethiopian (2%)
- Italian (2%)
People in group quarters in Prince William County, Virginia in 2010:
- 842 people in local jails and other municipal confinement facilities
- 736 people in military barracks and dormitories (nondisciplinary)
- 562 people in nursing facilities/skilled-nursing facilities
- 127 people in emergency and transitional shelters (with sleeping facilities) for people experiencing homelessness
- 65 people in other noninstitutional facilities
- 58 people in group homes for juveniles (non-correctional)
- 53 people in group homes intended for adults
- 35 people in correctional facilities intended for juveniles
- 24 people in workers' group living quarters and job corps centers
- 14 people in residential treatment centers for juveniles (non-correctional)
- 4 people in residential treatment centers for adults
People in group quarters in Prince William County, Virginia in 2000:
- 948 people in military barracks, etc.
- 603 people in nursing homes
- 517 people in military transient quarters for temporary residents
- 190 people in other noninstitutional group quarters
- 59 people in short-term care, detention or diagnostic centers for delinquent children
- 50 people in religious group quarters
- 11 people in other types of correctional institutions
- 6 people in unknown juvenile institutions
- 5 people in other nonhousehold living situations
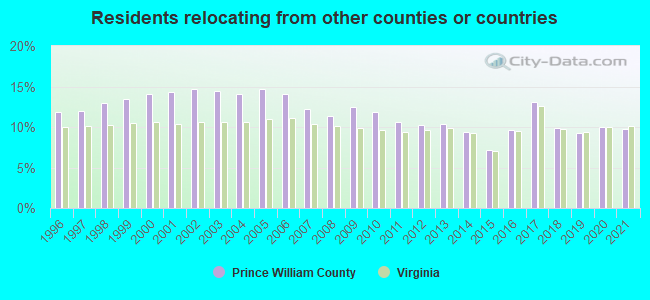
9.70% of this county's 2021 resident taxpayers lived in other counties in 2020 ($73,434 average adjusted gross income)
| Here: | 9.70% |
| Virginia average: | 10.16% |
0.13% of residents moved from foreign countries ($1,263 average AGI)
Prince William County: 0.13% Virginia average: 0.12%
6.09% relocated from other counties in Virginia ($47,727 average AGI)
3.48% relocated from other states ($24,444 average AGI)
Prince William County: 3.48% Virginia average: 3.91%
Top counties from which taxpayers relocated into this county between 2020 and 2021:
| from Fairfax County, VA | |
| from Loudoun County, VA | |
| from Alexandria city, VA | |
| from Manassas city, VA | |
| from Stafford County, VA | |
| from Arlington County, VA | |
| from Prince George's County, MD |
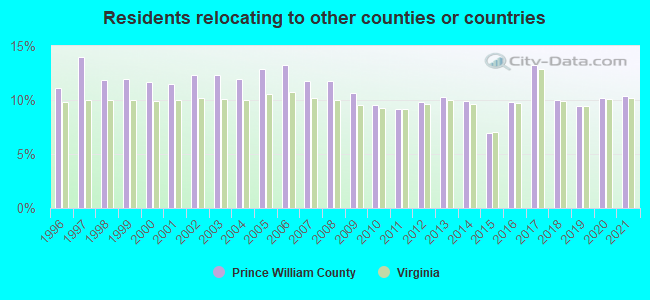
10.41% of this county's 2020 resident taxpayers moved to other counties in 2021 ($82,245 average adjusted gross income)
| Here: | 10.41% |
| Virginia average: | 10.20% |
0.11% of residents moved to foreign countries ($1,088 average AGI)
Prince William County: 0.11% Virginia average: 0.09%
6.01% relocated to other counties in Virginia ($43,462 average AGI)
4.29% relocated to other states ($37,696 average AGI)
Prince William County: 4.29% Virginia average: 3.98%
Top counties to which taxpayers relocated from this county between 2020 and 2021:
| to Fairfax County, VA | |
| to Stafford County, VA | |
| to Manassas city, VA | |
| to Loudoun County, VA | |
| to Spotsylvania County, VA | |
| to Fauquier County, VA | |
| to Alexandria city, VA |
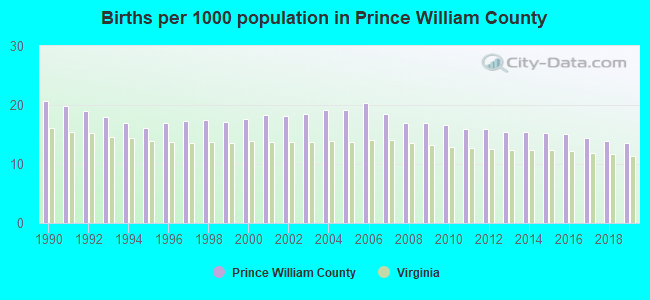
Births per 1000 population from 1990 to 1999: 17.9
Births per 1000 population from 2000 to 2009: 18.3
Births per 1000 population from 2010 to 2022: 12.7
Deaths per 1000 population from 1990 to 1999: 3.4
Deaths per 1000 population from 2000 to 2009: 3.8
Deaths per 1000 population from 2010 to 2020: 4.1

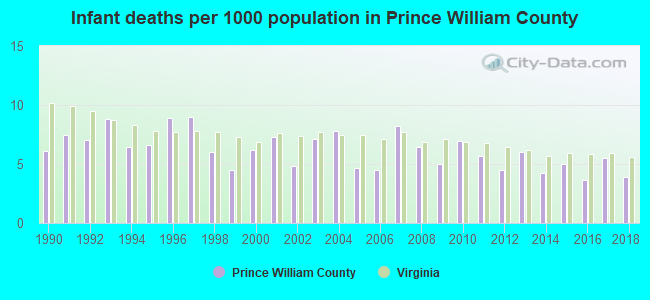
Infant deaths per 1000 live births from 1990 to 1999: 7.1
Infant deaths per 1000 live births from 2000 to 2009: 6.2
Infant deaths per 1000 live births from 2010 to 2021: 5.1
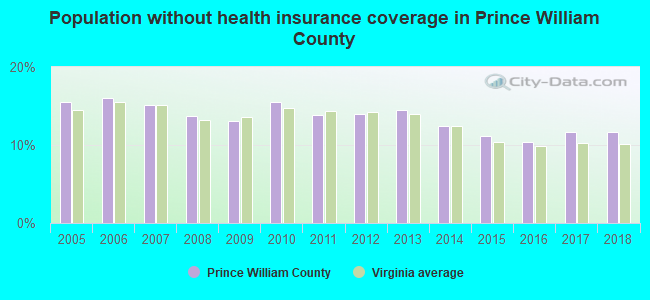
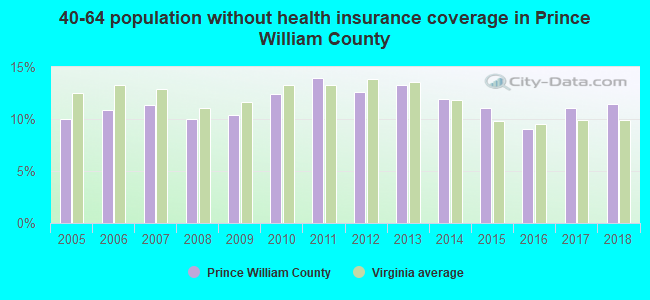
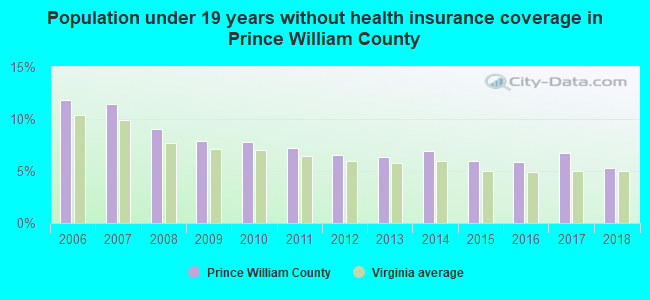
Persons under 19 years old without health insurance coverage in 2018: 5.3%
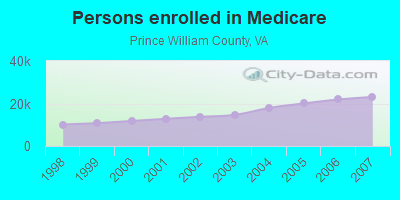
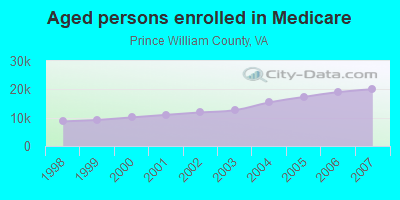
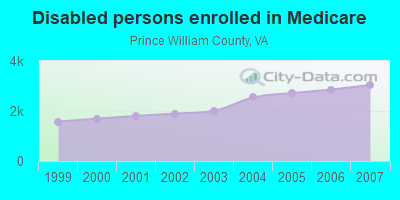
Persons enrolled in hospital insurance and/or supplemental medical insurance (Medicare) in July 1, 2007: 23,078 (20,039 aged, 3,039 disabled)
Children under 18 without health insurance coverage in 2007: 12,159 (11%)
Most common underlying causes of death in Prince William County, Virginia in 1999 - 2019:
- Bronchus or lung, unspecified - Malignant neoplasms (2,055)
- Atherosclerotic heart disease (1,556)
- Chronic obstructive pulmonary disease, unspecified (1,061)
- Acute myocardial infarction, unspecified (1,057)
- Unspecified dementia (1,033)
- Congestive heart failure (797)
- Stroke, not specified as haemorrhage or infarction (790)
- Alzheimer disease, unspecified (735)
- Breast, unspecified - Malignant neoplasms (717)
- Septicaemia, unspecified (658)
Population without health insurance coverage in 2000: 12%
Children under 18 without health insurance coverage in 2000: 11%
Short term general hospital admissions per 100,000 population in 2004: 3,134
Short term general hospital beds per 100,000 population in 2004: 45
Emergency room visits per 100,000 population in 2004: 15,589
General practice office based MDs per 100,000 population in 2005: 1,862
Medical specialist MDs per 100,000 population in 2005: 372
Dentists per 100,000 population in 1998: 3
Total births per 100,000 population, July 2005 - July 2006 : 32
Total deaths per 100,000 population, July 2005 - July 2006: 79
Limited-service eating places per 100,000 population in 2005 : 8
Beer, wine & liquor stores per 100,000 population in 2005: 1
Homicides per 1,000,000 population from 2000 to 2006: 39.7. This is less than state average.
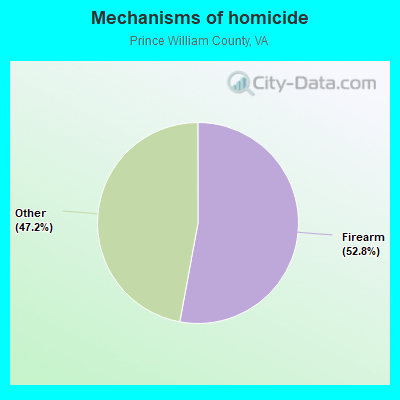
- Firearm - 21.0
- Other - 18.7
Suicides per 1,000,000 population from 2000 to 2006: 77.1. This is less than state average.
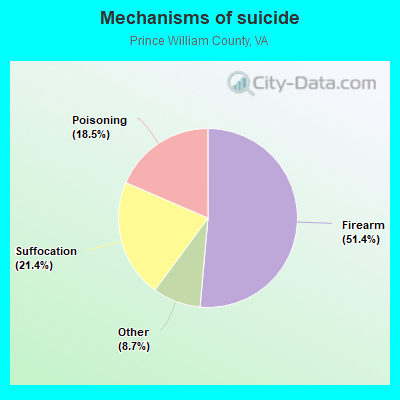
- Firearm - 39.7
- Suffocation - 16.5
- Poisoning - 14.3
- Other - 6.7
Household type by relationship:
Households: 486,943- Male householders: 85,447 (13,395 living alone), Female householders: 71,281 (17,627 living alone)
90,104 spouses (89,104 opposite-sex spouses), 8,825 unmarried partners, (8,560 opposite-sex unmarried partners), 166,486 children (157,291 natural, 2,249 adopted, 6,946 stepchildren), 8,832 grandchildren, 9,278 brothers or sisters, 14,376 parents, 106 foster children, 12,857 other relatives, 15,572 non-relatives
- In group quarters: 3,779
Size of family households: 38,564 2-persons, 26,642 3-persons, 26,498 4-persons, 16,478 5-persons, 6,805 6-persons, 4,105 7-or-more-persons.
Size of nonfamily households: 31,022 1-person, 5,623 2-persons, 466 3-persons, 486 4-persons, 39 7-or-more-persons.
84,727 married couples with children.
27,121 single-parent households (6,852 men, 20,269 women).
63.9% of residents of Prince William speak English at home.
19.4% of residents speak Spanish at home (59% speak English very well, 21% speak English well, 14% speak English not well, 6% don't speak English at all).
6.4% of residents speak other Indo-European language at home (73% speak English very well, 20% speak English well, 6% speak English not well, 1% don't speak English at all).
5.3% of residents speak Asian or Pacific Island language at home (57% speak English very well, 24% speak English well, 17% speak English not well, 2% don't speak English at all).
5.0% of residents speak other language at home (69% speak English very well, 22% speak English well, 7% speak English not well, 1% don't speak English at all).
In fiscal year 2004:
Federal Government expenditure: $1,914,679,000 ($5,689 per capita)
Department of Defense expenditure: $1,118,016,000
Federal direct payments to individuals for retirement and disability: $694,292,000
Federal other direct payments to individuals: $74,563,000
Federal direct payments not to individuals: $1,667,000
Federal grants: $125,218,000
Federal procurement contracts: $381,686,000 ($317,396,000 Department of Defense)
Federal salaries and wages: $637,253,000 ($537,503,000 Department of Defense)
Federal Government direct loans: $1,205,000
Federal guaranteed/insured loans: $870,658,000
Federal Government insurance: $113,321,000
Population change from April 1, 2000 to July 1, 2005:
Births: 30,401| Here: | 87 per 1000 residents |
| State: | 70 per 1000 residents |
Deaths: 6,212
| Here: | 18 per 1000 residents |
| State: | 40 per 1000 residents |
Net international migration: +6,814
| Here: | +20 per 1000 residents |
| State: | +18 per 1000 residents |
Net internal migration: +37,176
| Here: | +107 per 1000 residents |
| State: | +14 per 1000 residents |
Total withdrawal of fresh water for public supply: 65.26 millions of gallons per day (1% from ground, 99% from surface)
| Here: | 7.8 |
| State: | 7.0 |
| Here: | 4.5 |
| State: | 4.3 |
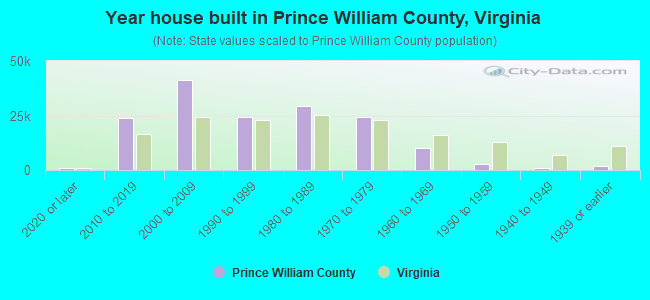
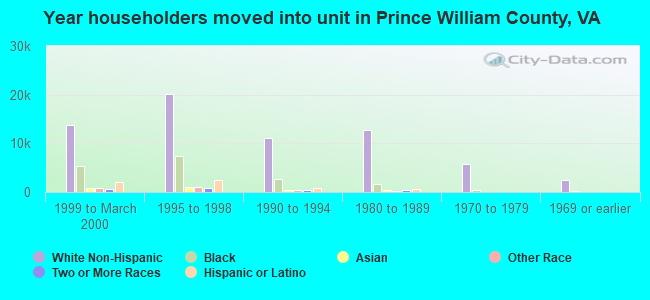
- Year house built in Prince William County, Virginia
- 3,0432020 or later
- 22,7402010 to 2019
- 41,6412000 to 2009
- 26,5941990 to 1999
- 29,4371980 to 1989
- 21,5961970 to 1979
- 9,4581960 to 1969
- 4,2281950 to 1959
- 1,1381940 to 1949
- 2,2031939 or earlier
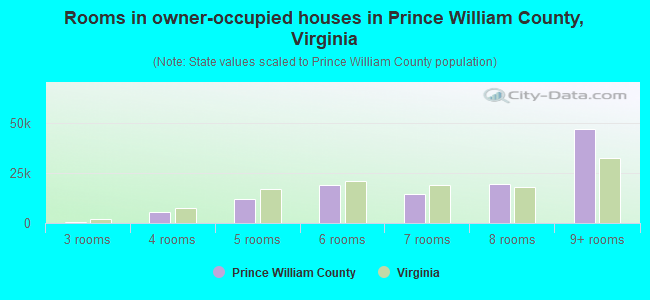
- Rooms in owner-occupied houses in Prince William County, Virginia
- 3331 room
- 02 rooms
- 1,2373 rooms
- 5,5404 rooms
- 10,7665 rooms
- 20,1046 rooms
- 15,8917 rooms
- 14,0358 rooms
- 47,3149+ rooms
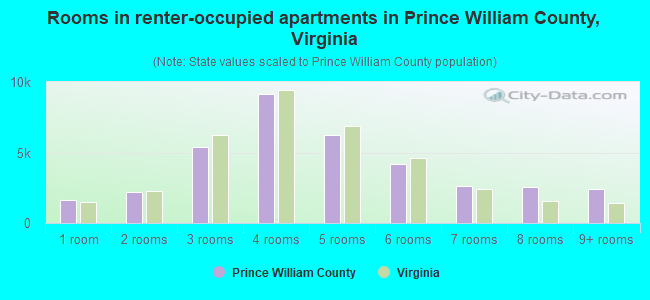
- Rooms in renter-occupied apartments in Prince William County, Virginia
- 1,4271 room
- 2,8772 rooms
- 7,6533 rooms
- 9,0914 rooms
- 6,4885 rooms
- 5,5086 rooms
- 3,0307 rooms
- 2,9558 rooms
- 2,4799+ rooms
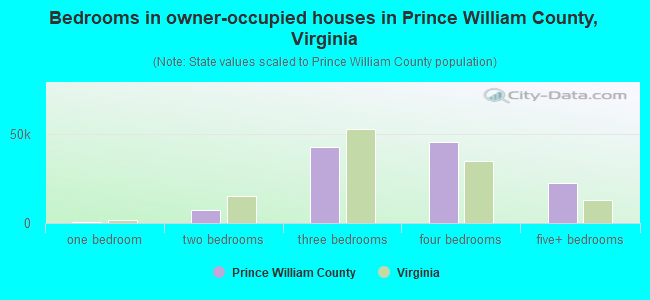
- Bedrooms in owner-occupied houses in Prince William County, Virginia
- 441no bedroom
- 3691 bedroom
- 7,2232 bedrooms
- 41,4513 bedrooms
- 44,9094 bedrooms
- 20,8275+ bedrooms
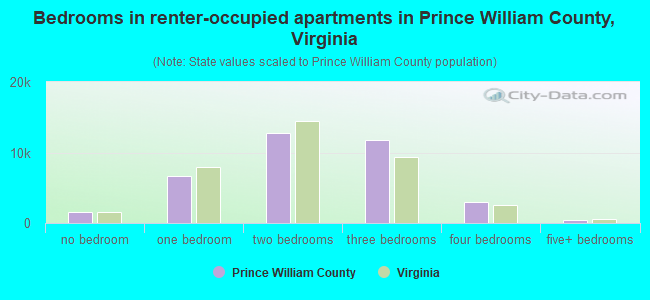
- Bedrooms in renter-occupied apartments in Prince William County, Virginia
- 1,439no bedroom
- 9,0901 bedroom
- 13,9782 bedrooms
- 11,8423 bedrooms
- 3,7124 bedrooms
- 1,4475+ bedrooms
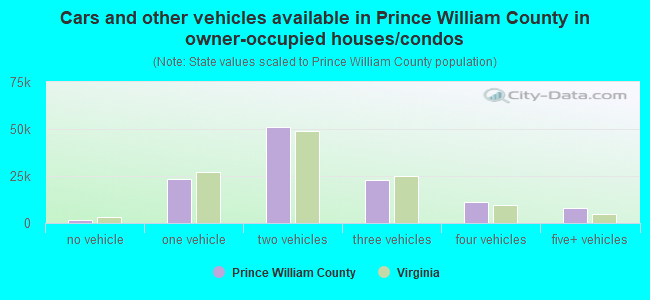
- Cars and other vehicles available in Prince William County in owner-occupied houses/condos
- 1,708no vehicle
- 21,8991 vehicle
- 50,2442 vehicles
- 26,3973 vehicles
- 8,6034 vehicles
- 6,3695+ vehicles
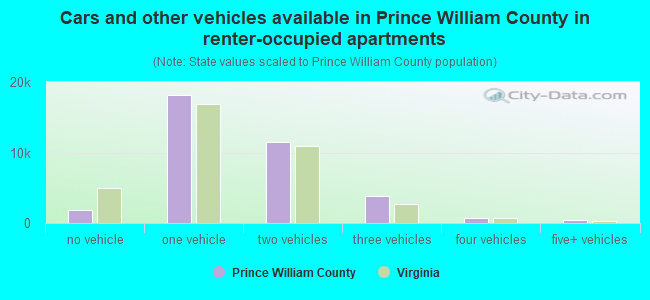
- Cars and other vehicles available in Prince William County in renter-occupied apartments
- 2,987no vehicle
- 18,6481 vehicle
- 14,4412 vehicles
- 3,2493 vehicles
- 1,5894 vehicles
- 5945+ vehicles
87.4% of Prince William County residents lived in the same house 1 years ago.
Out of people who lived in different houses, 26% lived in this county.
Out of people who lived in different counties, 68% lived in Virginia.
| Prince William County: | 87.4% |
| State average: | 86.6% |
Place of birth for U.S.-born residents:
- This state: 175,836
- Other state: 172,385
- Northeast: 47,854
- Midwest: 30,504
- South: 69,074
- West: 24,953
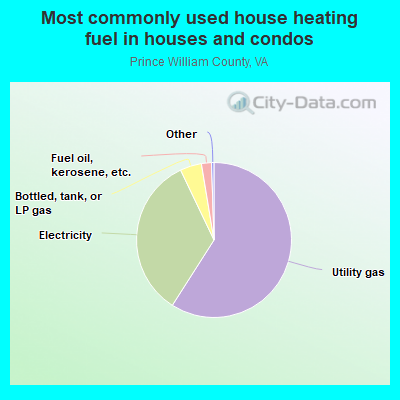
- 58.8%Utility gas
- 35.3%Electricity
- 3.1%Bottled, tank, or LP gas
- 2.0%Fuel oil, kerosene, etc.
- 0.4%No fuel used
- 0.3%Wood
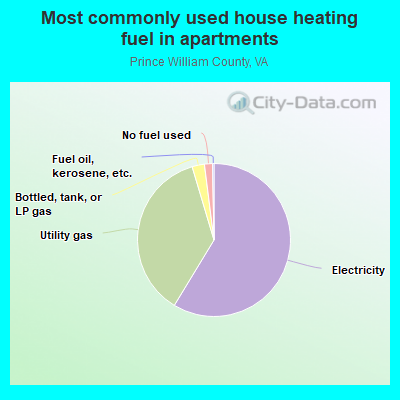
- 62.5%Electricity
- 32.9%Utility gas
- 2.7%Bottled, tank, or LP gas
- 1.2%Fuel oil, kerosene, etc.
- 0.5%No fuel used
- 0.2%Solar energy
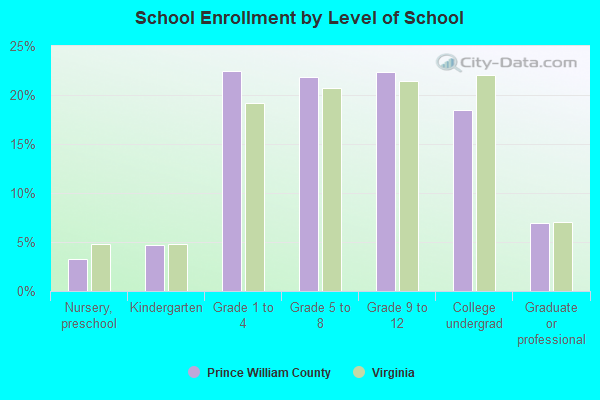
Private vs. public school enrollment:
| Here: | 10.6% |
| Virginia: | 13.2% |
| Here: | 4.9% |
| Virginia: | 10.2% |
| Here: | 16.4% |
| Virginia: | 18.7% |
Prince William County government finances - Expenditure in 2020:
- Bond Funds - Cash and Securities: $115,916,000
Cash and Securities: $99,376,000
- Charges - Other: $169,206,000
Sewerage: $77,425,000
Other: $60,291,000
Solid Waste Management: $20,943,000
Solid Waste Management: $20,698,000
Elementary and Secondary Education School Lunch: $18,603,000
Elementary and Secondary Education School Lunch: $12,474,000
Parks and Recreation: $12,459,000
Parks and Recreation: $9,112,000
Sewerage: $8,229,000
Housing and Community Development: $4,111,000
Elementary and Secondary Education School Tuition and Transportation: $2,754,000
Elementary and Secondary Education School Tuition and Transportation: $2,630,000
Housing and Community Development: $2,381,000
Elementary and Secondary Education - Other: $1,886,000
Elementary and Secondary Education - Other: $1,360,000
Regular Highways: $12,000
Regular Highways: $9,000
- Construction - Regular Highways: $80,010,000
Elementary and Secondary Education: $69,151,000
Elementary and Secondary Education: $68,716,000
Regular Highways: $58,748,000
General - Other: $42,311,000
Correctional Institutions: $14,416,000
Water Utilities: $13,317,000
Sewerage: $11,419,000
Solid Waste Management: $1,311,000
Solid Waste Management: $890,000
Parks and Recreation: $150,000
Parks and Recreation: $148,000
- Current Operations - Elementary and Secondary Education: $1,104,084,000
Elementary and Secondary Education: $1,043,214,000
Correctional Institutions: $137,065,000
Police Protection: $130,292,000
Local Fire Protection: $127,565,000
Police Protection: $113,292,000
Local Fire Protection: $110,367,000
General - Other: $70,699,000
Correctional Institutions: $60,866,000
Public Welfare - Other: $60,779,000
Sewerage: $56,046,000
Health - Other: $51,979,000
Health - Other: $51,809,000
Public Welfare - Other: $44,976,000
Sewerage: $44,059,000
Housing and Community Development: $42,452,000
Parks and Recreation: $37,590,000
Water Utilities: $32,661,000
Housing and Community Development: $32,471,000
General Public Buildings: $31,742,000
General Public Buildings: $31,398,000
Judicial and Legal Services: $31,041,000
Parks and Recreation: $30,114,000
General - Other: $26,519,000
Water Utilities: $24,535,000
Financial Administration: $22,021,000
Financial Administration: $20,573,000
Libraries: $17,557,000
Libraries: $17,046,000
Solid Waste Management: $14,669,000
Judicial and Legal Services: $14,596,000
Central Staff Services: $13,612,000
Solid Waste Management: $11,727,000
Central Staff Services: $9,192,000
Corrections - Other: $5,326,000
Corrections - Other: $4,864,000
Natural Resources - Other: $800,000
Regular Highways: $321,000
Regular Highways: $321,000
- Federal Intergovernmental - Housing and Community Development: $29,358,000
Housing and Community Development: $28,817,000
Public Welfare: $17,400,000
Public Welfare: $14,755,000
Other: $9,375,000
Education: $6,140,000
Education: $5,287,000
Other: $4,155,000
Highways: $3,985,000
Highways: $3,903,000
Health and Hospitals: $3,219,000
Health and Hospitals: $2,731,000
General Local Government Support: $99,000
Natural Resources: $59,000
- General - Interest on Debt: $49,107,000
Interest on Debt: $14,042,000
- Intergovernmental to Local - Other - Sewerage: $24,466,000
Other - Elementary and Secondary Education: $21,423,000
Other - Elementary and Secondary Education: $16,421,000
Other - Water Utilities: $14,854,000
Other - Electric Utilities: $12,624,000
Other - General - Other: $12,375,000
Other - Water Utilities: $10,802,000
- Local Intergovernmental - Other: $48,974,000
Highways: $39,440,000
Highways: $39,308,000
Education: $37,811,000
Education: $22,600,000
Other: $12,462,000
- Long Term Debt - Outstanding Unspecified Public Purpose: $1,181,248,000
Beginning Outstanding - Unspecified Public Purpose: $1,158,470,000
Beginning Outstanding - Unspecified Public Purpose: $302,892,000
Outstanding Unspecified Public Purpose: $280,177,000
Issue, Unspecified Public Purpose: $115,895,000
Retired Unspecified Public Purpose: $93,117,000
Retired Unspecified Public Purpose: $79,606,000
Beginning Outstanding - Public Debt for Private Purpose: $79,127,000
Outstanding Nonguaranteed - Industrial Revenue: $76,112,000
Beginning Outstanding - Public Debt for Private Purpose: $73,097,000
Outstanding Nonguaranteed - Industrial Revenue: $70,082,000
Issue, Unspecified Public Purpose: $56,891,000
Retired Nonguaranteed - Public Debt for Private Purpose: $3,015,000
Retired Nonguaranteed - Public Debt for Private Purpose: $3,015,000
- Miscellaneous - General Revenue - Other: $52,565,000
Interest Earnings: $32,464,000
Interest Earnings: $15,166,000
General Revenue - Other: $13,659,000
Donations From Private Sources: $12,644,000
Fines and Forfeits: $3,120,000
Fines and Forfeits: $2,749,000
Rents: $1,786,000
Sale of Property: $1,667,000
Donations From Private Sources: $1,652,000
Sale of Property: $498,000
- Other Capital Outlay - Elementary and Secondary Education: $110,532,000
Elementary and Secondary Education: $41,126,000
Water Utilities: $12,921,000
Sewerage: $9,605,000
- Other Funds - Cash and Securities: $1,353,447,000
Cash and Securities: $1,128,479,000
- Revenue - Water Utilities: $47,720,000
- Sinking Funds - Cash and Securities: $76,582,000
Cash and Securities: $76,112,000
- State Intergovernmental - Education: $619,237,000
Education: $567,657,000
Other: $103,219,000
General Local Government Support: $89,252,000
Public Welfare: $37,483,000
Other: $28,745,000
Highways: $12,951,000
Public Welfare: $12,857,000
General Local Government Support: $6,599,000
Highways: $6,309,000
Health and Hospitals: $435,000
Health and Hospitals: $311,000
Housing and Community Development: $156,000
- Tax - Property: $917,517,000
Property: $773,774,000
General Sales and Gross Receipts: $72,342,000
General Sales and Gross Receipts: $64,566,000
Other License: $37,337,000
Occupation and Business License - Other: $28,236,000
Occupation and Business License - Other: $26,554,000
Documentary and Stock Transfer: $20,644,000
Other Selective Sales: $17,545,000
Public Utilities Sales: $15,959,000
Public Utilities Sales: $14,728,000
Other License: $12,986,000
Documentary and Stock Transfer: $11,914,000
Motor Vehicle License: $9,086,000
Motor Vehicle License: $8,845,000
Other Selective Sales: $4,025,000
Public Utility License: $1,379,000
Public Utility License: $1,307,000
- Total Salaries and Wages: $730,518,000
: $668,336,000
- Water Utilities - Interest on Debt: $3,718,000
Interest on Debt: $998,000
Prince William County government finances - Revenue in 2020:
- Bond Funds - Cash and Securities: $115,916,000
Cash and Securities: $99,376,000
- Charges - Other: $169,206,000
Sewerage: $77,425,000
Other: $60,291,000
Solid Waste Management: $20,943,000
Solid Waste Management: $20,698,000
Elementary and Secondary Education School Lunch: $18,603,000
Elementary and Secondary Education School Lunch: $12,474,000
Parks and Recreation: $12,459,000
Parks and Recreation: $9,112,000
Sewerage: $8,229,000
Housing and Community Development: $4,111,000
Elementary and Secondary Education School Tuition and Transportation: $2,754,000
Elementary and Secondary Education School Tuition and Transportation: $2,630,000
Housing and Community Development: $2,381,000
Elementary and Secondary Education - Other: $1,886,000
Elementary and Secondary Education - Other: $1,360,000
Regular Highways: $12,000
Regular Highways: $9,000
- Construction - Regular Highways: $80,010,000
Elementary and Secondary Education: $69,151,000
Elementary and Secondary Education: $68,716,000
Regular Highways: $58,748,000
General - Other: $42,311,000
Correctional Institutions: $14,416,000
Water Utilities: $13,317,000
Sewerage: $11,419,000
Solid Waste Management: $1,311,000
Solid Waste Management: $890,000
Parks and Recreation: $150,000
Parks and Recreation: $148,000
- Current Operations - Elementary and Secondary Education: $1,104,084,000
Elementary and Secondary Education: $1,043,214,000
Correctional Institutions: $137,065,000
Police Protection: $130,292,000
Local Fire Protection: $127,565,000
Police Protection: $113,292,000
Local Fire Protection: $110,367,000
General - Other: $70,699,000
Correctional Institutions: $60,866,000
Public Welfare - Other: $60,779,000
Sewerage: $56,046,000
Health - Other: $51,979,000
Health - Other: $51,809,000
Public Welfare - Other: $44,976,000
Sewerage: $44,059,000
Housing and Community Development: $42,452,000
Parks and Recreation: $37,590,000
Water Utilities: $32,661,000
Housing and Community Development: $32,471,000
General Public Buildings: $31,742,000
General Public Buildings: $31,398,000
Judicial and Legal Services: $31,041,000
Parks and Recreation: $30,114,000
General - Other: $26,519,000
Water Utilities: $24,535,000
Financial Administration: $22,021,000
Financial Administration: $20,573,000
Libraries: $17,557,000
Libraries: $17,046,000
Solid Waste Management: $14,669,000
Judicial and Legal Services: $14,596,000
Central Staff Services: $13,612,000
Solid Waste Management: $11,727,000
Central Staff Services: $9,192,000
Corrections - Other: $5,326,000
Corrections - Other: $4,864,000
Natural Resources - Other: $800,000
Regular Highways: $321,000
Regular Highways: $321,000
- Federal Intergovernmental - Housing and Community Development: $29,358,000
Housing and Community Development: $28,817,000
Public Welfare: $17,400,000
Public Welfare: $14,755,000
Other: $9,375,000
Education: $6,140,000
Education: $5,287,000
Other: $4,155,000
Highways: $3,985,000
Highways: $3,903,000
Health and Hospitals: $3,219,000
Health and Hospitals: $2,731,000
General Local Government Support: $99,000
Natural Resources: $59,000
- General - Interest on Debt: $49,107,000
Interest on Debt: $14,042,000
- Intergovernmental to Local - Other - Sewerage: $24,466,000
Other - Elementary and Secondary Education: $21,423,000
Other - Elementary and Secondary Education: $16,421,000
Other - Water Utilities: $14,854,000
Other - Electric Utilities: $12,624,000
Other - General - Other: $12,375,000
Other - Water Utilities: $10,802,000
- Local Intergovernmental - Other: $48,974,000
Highways: $39,440,000
Highways: $39,308,000
Education: $37,811,000
Education: $22,600,000
Other: $12,462,000
- Long Term Debt - Outstanding Unspecified Public Purpose: $1,181,248,000
Beginning Outstanding - Unspecified Public Purpose: $1,158,470,000
Beginning Outstanding - Unspecified Public Purpose: $302,892,000
Outstanding Unspecified Public Purpose: $280,177,000
Issue, Unspecified Public Purpose: $115,895,000
Retired Unspecified Public Purpose: $93,117,000
Retired Unspecified Public Purpose: $79,606,000
Beginning Outstanding - Public Debt for Private Purpose: $79,127,000
Outstanding Nonguaranteed - Industrial Revenue: $76,112,000
Beginning Outstanding - Public Debt for Private Purpose: $73,097,000
Outstanding Nonguaranteed - Industrial Revenue: $70,082,000
Issue, Unspecified Public Purpose: $56,891,000
Retired Nonguaranteed - Public Debt for Private Purpose: $3,015,000
Retired Nonguaranteed - Public Debt for Private Purpose: $3,015,000
- Miscellaneous - General Revenue - Other: $52,565,000
Interest Earnings: $32,464,000
Interest Earnings: $15,166,000
General Revenue - Other: $13,659,000
Donations From Private Sources: $12,644,000
Fines and Forfeits: $3,120,000
Fines and Forfeits: $2,749,000
Rents: $1,786,000
Sale of Property: $1,667,000
Donations From Private Sources: $1,652,000
Sale of Property: $498,000
- Other Capital Outlay - Elementary and Secondary Education: $110,532,000
Elementary and Secondary Education: $41,126,000
Water Utilities: $12,921,000
Sewerage: $9,605,000
- Other Funds - Cash and Securities: $1,353,447,000
Cash and Securities: $1,128,479,000
- Revenue - Water Utilities: $47,720,000
- Sinking Funds - Cash and Securities: $76,582,000
Cash and Securities: $76,112,000
- State Intergovernmental - Education: $619,237,000
Education: $567,657,000
Other: $103,219,000
General Local Government Support: $89,252,000
Public Welfare: $37,483,000
Other: $28,745,000
Highways: $12,951,000
Public Welfare: $12,857,000
General Local Government Support: $6,599,000
Highways: $6,309,000
Health and Hospitals: $435,000
Health and Hospitals: $311,000
Housing and Community Development: $156,000
- Tax - Property: $917,517,000
Property: $773,774,000
General Sales and Gross Receipts: $72,342,000
General Sales and Gross Receipts: $64,566,000
Other License: $37,337,000
Occupation and Business License - Other: $28,236,000
Occupation and Business License - Other: $26,554,000
Documentary and Stock Transfer: $20,644,000
Other Selective Sales: $17,545,000
Public Utilities Sales: $15,959,000
Public Utilities Sales: $14,728,000
Other License: $12,986,000
Documentary and Stock Transfer: $11,914,000
Motor Vehicle License: $9,086,000
Motor Vehicle License: $8,845,000
Other Selective Sales: $4,025,000
Public Utility License: $1,379,000
Public Utility License: $1,307,000
- Total Salaries and Wages: $730,518,000
: $668,336,000
- Water Utilities - Interest on Debt: $3,718,000
Interest on Debt: $998,000
Prince William County government finances - Debt in 2020:
- Bond Funds - Cash and Securities: $115,916,000
Cash and Securities: $99,376,000
- Charges - Other: $169,206,000
Sewerage: $77,425,000
Other: $60,291,000
Solid Waste Management: $20,943,000
Solid Waste Management: $20,698,000
Elementary and Secondary Education School Lunch: $18,603,000
Elementary and Secondary Education School Lunch: $12,474,000
Parks and Recreation: $12,459,000
Parks and Recreation: $9,112,000
Sewerage: $8,229,000
Housing and Community Development: $4,111,000
Elementary and Secondary Education School Tuition and Transportation: $2,754,000
Elementary and Secondary Education School Tuition and Transportation: $2,630,000
Housing and Community Development: $2,381,000
Elementary and Secondary Education - Other: $1,886,000
Elementary and Secondary Education - Other: $1,360,000
Regular Highways: $12,000
Regular Highways: $9,000
- Construction - Regular Highways: $80,010,000
Elementary and Secondary Education: $69,151,000
Elementary and Secondary Education: $68,716,000
Regular Highways: $58,748,000
General - Other: $42,311,000
Correctional Institutions: $14,416,000
Water Utilities: $13,317,000
Sewerage: $11,419,000
Solid Waste Management: $1,311,000
Solid Waste Management: $890,000
Parks and Recreation: $150,000
Parks and Recreation: $148,000
- Current Operations - Elementary and Secondary Education: $1,104,084,000
Elementary and Secondary Education: $1,043,214,000
Correctional Institutions: $137,065,000
Police Protection: $130,292,000
Local Fire Protection: $127,565,000
Police Protection: $113,292,000
Local Fire Protection: $110,367,000
General - Other: $70,699,000
Correctional Institutions: $60,866,000
Public Welfare - Other: $60,779,000
Sewerage: $56,046,000
Health - Other: $51,979,000
Health - Other: $51,809,000
Public Welfare - Other: $44,976,000
Sewerage: $44,059,000
Housing and Community Development: $42,452,000
Parks and Recreation: $37,590,000
Water Utilities: $32,661,000
Housing and Community Development: $32,471,000
General Public Buildings: $31,742,000
General Public Buildings: $31,398,000
Judicial and Legal Services: $31,041,000
Parks and Recreation: $30,114,000
General - Other: $26,519,000
Water Utilities: $24,535,000
Financial Administration: $22,021,000
Financial Administration: $20,573,000
Libraries: $17,557,000
Libraries: $17,046,000
Solid Waste Management: $14,669,000
Judicial and Legal Services: $14,596,000
Central Staff Services: $13,612,000
Solid Waste Management: $11,727,000
Central Staff Services: $9,192,000
Corrections - Other: $5,326,000
Corrections - Other: $4,864,000
Natural Resources - Other: $800,000
Regular Highways: $321,000
Regular Highways: $321,000
- Federal Intergovernmental - Housing and Community Development: $29,358,000
Housing and Community Development: $28,817,000
Public Welfare: $17,400,000
Public Welfare: $14,755,000
Other: $9,375,000
Education: $6,140,000
Education: $5,287,000
Other: $4,155,000
Highways: $3,985,000
Highways: $3,903,000
Health and Hospitals: $3,219,000
Health and Hospitals: $2,731,000
General Local Government Support: $99,000
Natural Resources: $59,000
- General - Interest on Debt: $49,107,000
Interest on Debt: $14,042,000
- Intergovernmental to Local - Other - Sewerage: $24,466,000
Other - Elementary and Secondary Education: $21,423,000
Other - Elementary and Secondary Education: $16,421,000
Other - Water Utilities: $14,854,000
Other - Electric Utilities: $12,624,000
Other - General - Other: $12,375,000
Other - Water Utilities: $10,802,000
- Local Intergovernmental - Other: $48,974,000
Highways: $39,440,000
Highways: $39,308,000
Education: $37,811,000
Education: $22,600,000
Other: $12,462,000
- Long Term Debt - Outstanding Unspecified Public Purpose: $1,181,248,000
Beginning Outstanding - Unspecified Public Purpose: $1,158,470,000
Beginning Outstanding - Unspecified Public Purpose: $302,892,000
Outstanding Unspecified Public Purpose: $280,177,000
Issue, Unspecified Public Purpose: $115,895,000
Retired Unspecified Public Purpose: $93,117,000
Retired Unspecified Public Purpose: $79,606,000
Beginning Outstanding - Public Debt for Private Purpose: $79,127,000
Outstanding Nonguaranteed - Industrial Revenue: $76,112,000
Beginning Outstanding - Public Debt for Private Purpose: $73,097,000
Outstanding Nonguaranteed - Industrial Revenue: $70,082,000
Issue, Unspecified Public Purpose: $56,891,000
Retired Nonguaranteed - Public Debt for Private Purpose: $3,015,000
Retired Nonguaranteed - Public Debt for Private Purpose: $3,015,000
- Miscellaneous - General Revenue - Other: $52,565,000
Interest Earnings: $32,464,000
Interest Earnings: $15,166,000
General Revenue - Other: $13,659,000
Donations From Private Sources: $12,644,000
Fines and Forfeits: $3,120,000
Fines and Forfeits: $2,749,000
Rents: $1,786,000
Sale of Property: $1,667,000
Donations From Private Sources: $1,652,000
Sale of Property: $498,000
- Other Capital Outlay - Elementary and Secondary Education: $110,532,000
Elementary and Secondary Education: $41,126,000
Water Utilities: $12,921,000
Sewerage: $9,605,000
- Other Funds - Cash and Securities: $1,353,447,000
Cash and Securities: $1,128,479,000
- Revenue - Water Utilities: $47,720,000
- Sinking Funds - Cash and Securities: $76,582,000
Cash and Securities: $76,112,000
- State Intergovernmental - Education: $619,237,000
Education: $567,657,000
Other: $103,219,000
General Local Government Support: $89,252,000
Public Welfare: $37,483,000
Other: $28,745,000
Highways: $12,951,000
Public Welfare: $12,857,000
General Local Government Support: $6,599,000
Highways: $6,309,000
Health and Hospitals: $435,000
Health and Hospitals: $311,000
Housing and Community Development: $156,000
- Tax - Property: $917,517,000
Property: $773,774,000
General Sales and Gross Receipts: $72,342,000
General Sales and Gross Receipts: $64,566,000
Other License: $37,337,000
Occupation and Business License - Other: $28,236,000
Occupation and Business License - Other: $26,554,000
Documentary and Stock Transfer: $20,644,000
Other Selective Sales: $17,545,000
Public Utilities Sales: $15,959,000
Public Utilities Sales: $14,728,000
Other License: $12,986,000
Documentary and Stock Transfer: $11,914,000
Motor Vehicle License: $9,086,000
Motor Vehicle License: $8,845,000
Other Selective Sales: $4,025,000
Public Utility License: $1,379,000
Public Utility License: $1,307,000
- Total Salaries and Wages: $730,518,000
: $668,336,000
- Water Utilities - Interest on Debt: $3,718,000
Interest on Debt: $998,000
Prince William County government finances - Cash and Securities in 2020:
- Bond Funds - Cash and Securities: $115,916,000
Cash and Securities: $99,376,000
- Charges - Other: $169,206,000
Sewerage: $77,425,000
Other: $60,291,000
Solid Waste Management: $20,943,000
Solid Waste Management: $20,698,000
Elementary and Secondary Education School Lunch: $18,603,000
Elementary and Secondary Education School Lunch: $12,474,000
Parks and Recreation: $12,459,000
Parks and Recreation: $9,112,000
Sewerage: $8,229,000
Housing and Community Development: $4,111,000
Elementary and Secondary Education School Tuition and Transportation: $2,754,000
Elementary and Secondary Education School Tuition and Transportation: $2,630,000
Housing and Community Development: $2,381,000
Elementary and Secondary Education - Other: $1,886,000
Elementary and Secondary Education - Other: $1,360,000
Regular Highways: $12,000
Regular Highways: $9,000
- Construction - Regular Highways: $80,010,000
Elementary and Secondary Education: $69,151,000
Elementary and Secondary Education: $68,716,000
Regular Highways: $58,748,000
General - Other: $42,311,000
Correctional Institutions: $14,416,000
Water Utilities: $13,317,000
Sewerage: $11,419,000
Solid Waste Management: $1,311,000
Solid Waste Management: $890,000
Parks and Recreation: $150,000
Parks and Recreation: $148,000
- Current Operations - Elementary and Secondary Education: $1,104,084,000
Elementary and Secondary Education: $1,043,214,000
Correctional Institutions: $137,065,000
Police Protection: $130,292,000
Local Fire Protection: $127,565,000
Police Protection: $113,292,000
Local Fire Protection: $110,367,000
General - Other: $70,699,000
Correctional Institutions: $60,866,000
Public Welfare - Other: $60,779,000
Sewerage: $56,046,000
Health - Other: $51,979,000
Health - Other: $51,809,000
Public Welfare - Other: $44,976,000
Sewerage: $44,059,000
Housing and Community Development: $42,452,000
Parks and Recreation: $37,590,000
Water Utilities: $32,661,000
Housing and Community Development: $32,471,000
General Public Buildings: $31,742,000
General Public Buildings: $31,398,000
Judicial and Legal Services: $31,041,000
Parks and Recreation: $30,114,000
General - Other: $26,519,000
Water Utilities: $24,535,000
Financial Administration: $22,021,000
Financial Administration: $20,573,000
Libraries: $17,557,000
Libraries: $17,046,000
Solid Waste Management: $14,669,000
Judicial and Legal Services: $14,596,000
Central Staff Services: $13,612,000
Solid Waste Management: $11,727,000
Central Staff Services: $9,192,000
Corrections - Other: $5,326,000
Corrections - Other: $4,864,000
Natural Resources - Other: $800,000
Regular Highways: $321,000
Regular Highways: $321,000
- Federal Intergovernmental - Housing and Community Development: $29,358,000
Housing and Community Development: $28,817,000
Public Welfare: $17,400,000
Public Welfare: $14,755,000
Other: $9,375,000
Education: $6,140,000
Education: $5,287,000
Other: $4,155,000
Highways: $3,985,000
Highways: $3,903,000
Health and Hospitals: $3,219,000
Health and Hospitals: $2,731,000
General Local Government Support: $99,000
Natural Resources: $59,000
- General - Interest on Debt: $49,107,000
Interest on Debt: $14,042,000
- Intergovernmental to Local - Other - Sewerage: $24,466,000
Other - Elementary and Secondary Education: $21,423,000
Other - Elementary and Secondary Education: $16,421,000
Other - Water Utilities: $14,854,000
Other - Electric Utilities: $12,624,000
Other - General - Other: $12,375,000
Other - Water Utilities: $10,802,000
- Local Intergovernmental - Other: $48,974,000
Highways: $39,440,000
Highways: $39,308,000
Education: $37,811,000
Education: $22,600,000
Other: $12,462,000
- Long Term Debt - Outstanding Unspecified Public Purpose: $1,181,248,000
Beginning Outstanding - Unspecified Public Purpose: $1,158,470,000
Beginning Outstanding - Unspecified Public Purpose: $302,892,000
Outstanding Unspecified Public Purpose: $280,177,000
Issue, Unspecified Public Purpose: $115,895,000
Retired Unspecified Public Purpose: $93,117,000
Retired Unspecified Public Purpose: $79,606,000
Beginning Outstanding - Public Debt for Private Purpose: $79,127,000
Outstanding Nonguaranteed - Industrial Revenue: $76,112,000
Beginning Outstanding - Public Debt for Private Purpose: $73,097,000
Outstanding Nonguaranteed - Industrial Revenue: $70,082,000
Issue, Unspecified Public Purpose: $56,891,000
Retired Nonguaranteed - Public Debt for Private Purpose: $3,015,000
Retired Nonguaranteed - Public Debt for Private Purpose: $3,015,000
- Miscellaneous - General Revenue - Other: $52,565,000
Interest Earnings: $32,464,000
Interest Earnings: $15,166,000
General Revenue - Other: $13,659,000
Donations From Private Sources: $12,644,000
Fines and Forfeits: $3,120,000
Fines and Forfeits: $2,749,000
Rents: $1,786,000
Sale of Property: $1,667,000
Donations From Private Sources: $1,652,000
Sale of Property: $498,000
- Other Capital Outlay - Elementary and Secondary Education: $110,532,000
Elementary and Secondary Education: $41,126,000
Water Utilities: $12,921,000
Sewerage: $9,605,000
- Other Funds - Cash and Securities: $1,353,447,000
Cash and Securities: $1,128,479,000
- Revenue - Water Utilities: $47,720,000
- Sinking Funds - Cash and Securities: $76,582,000
Cash and Securities: $76,112,000
- State Intergovernmental - Education: $619,237,000
Education: $567,657,000
Other: $103,219,000
General Local Government Support: $89,252,000
Public Welfare: $37,483,000
Other: $28,745,000
Highways: $12,951,000
Public Welfare: $12,857,000
General Local Government Support: $6,599,000
Highways: $6,309,000
Health and Hospitals: $435,000
Health and Hospitals: $311,000
Housing and Community Development: $156,000
- Tax - Property: $917,517,000
Property: $773,774,000
General Sales and Gross Receipts: $72,342,000
General Sales and Gross Receipts: $64,566,000
Other License: $37,337,000
Occupation and Business License - Other: $28,236,000
Occupation and Business License - Other: $26,554,000
Documentary and Stock Transfer: $20,644,000
Other Selective Sales: $17,545,000
Public Utilities Sales: $15,959,000
Public Utilities Sales: $14,728,000
Other License: $12,986,000
Documentary and Stock Transfer: $11,914,000
Motor Vehicle License: $9,086,000
Motor Vehicle License: $8,845,000
Other Selective Sales: $4,025,000
Public Utility License: $1,379,000
Public Utility License: $1,307,000
- Total Salaries and Wages: $730,518,000
: $668,336,000
- Water Utilities - Interest on Debt: $3,718,000
Interest on Debt: $998,000
Supplemental Security Income (SSI) in 2006:
- Total number of recipients: 2,626
- Number of aged recipients: 688
- Number of blind and disabled recipients: 1,938
- Number of recipients under 18: 483
- Number of recipients between 18 and 64: 1,249
- Number of recipients older than 64: 894
- Number of recipients also receiving OASDI: 663
- Amount of payments (thousands of dollars): 1,154
| Home Mortgage Disclosure Act Aggregated Statistics For Year 2009 (Based on 48 full tracts) | ||||||||||||||
| A) FHA, FSA/RHS & VA Home Purchase Loans | B) Conventional Home Purchase Loans | C) Refinancings | D) Home Improvement Loans | E) Loans on Dwellings For 5+ Families | F) Non-occupant Loans on < 5 Family Dwellings (A B C & D) | G) Loans On Manufactured Home Dwelling (A B C & D) | ||||||||
|---|---|---|---|---|---|---|---|---|---|---|---|---|---|---|
| Number | Average Value | Number | Average Value | Number | Average Value | Number | Average Value | Number | Average Value | Number | Average Value | Number | Average Value | |
| LOANS ORIGINATED | 5,822 | $265,817 | 2,636 | $218,654 | 8,021 | $277,015 | 336 | $84,562 | 5 | $12,431,000 | 863 | $149,917 | 8 | $165,000 |
| APPLICATIONS APPROVED, NOT ACCEPTED | 304 | $257,444 | 206 | $249,519 | 650 | $271,766 | 46 | $45,565 | 0 | $0 | 60 | $142,950 | 5 | $52,600 |
| APPLICATIONS DENIED | 770 | $236,718 | 452 | $186,529 | 3,218 | $290,632 | 286 | $64,972 | 0 | $0 | 295 | $159,698 | 18 | $54,722 |
| APPLICATIONS WITHDRAWN | 798 | $254,703 | 514 | $223,152 | 2,358 | $296,031 | 69 | $111,696 | 1 | $198,000 | 183 | $167,038 | 2 | $260,500 |
| FILES CLOSED FOR INCOMPLETENESS | 129 | $230,442 | 88 | $209,057 | 567 | $290,757 | 34 | $109,559 | 0 | $0 | 53 | $190,038 | 3 | $50,000 |
| Private Mortgage Insurance Companies Aggregated Statistics For Year 2009 (Based on 46 full tracts) | ||||||||
| A) Conventional Home Purchase Loans | B) Refinancings | C) Non-occupant Loans on < 5 Family Dwellings (A & B) | D) Loans On Manufactured Home Dwelling (A & B) | |||||
|---|---|---|---|---|---|---|---|---|
| Number | Average Value | Number | Average Value | Number | Average Value | Number | Average Value | |
| LOANS ORIGINATED | 485 | $251,148 | 166 | $319,711 | 7 | $122,429 | 0 | $0 |
| APPLICATIONS APPROVED, NOT ACCEPTED | 186 | $270,823 | 79 | $353,823 | 7 | $162,714 | 0 | $0 |
| APPLICATIONS DENIED | 89 | $232,258 | 43 | $330,977 | 4 | $141,000 | 1 | $100,000 |
| APPLICATIONS WITHDRAWN | 47 | $282,553 | 21 | $337,667 | 1 | $575,000 | 0 | $0 |
| FILES CLOSED FOR INCOMPLETENESS | 34 | $242,529 | 2 | $365,000 | 2 | $151,000 | 0 | $0 |
| Most common first names in Prince William County, VA among deceased individuals | ||
| Name | Count | Lived (average) |
|---|---|---|
| Mary | 482 | 77.7 years |
| John | 466 | 71.7 years |
| James | 428 | 69.4 years |
| William | 419 | 70.8 years |
| Robert | 374 | 69.7 years |
| Charles | 253 | 70.9 years |
| George | 219 | 73.5 years |
| Margaret | 216 | 78.1 years |
| Helen | 193 | 80.1 years |
| Dorothy | 192 | 77.9 years |
| Most common last names in Prince William County, VA among deceased individuals | ||
| Last name | Count | Lived (average) |
|---|---|---|
| Smith | 208 | 72.9 years |
| Williams | 129 | 70.0 years |
| Johnson | 121 | 74.5 years |
| Davis | 120 | 71.3 years |
| Brown | 106 | 69.6 years |
| Jones | 83 | 74.4 years |
| Miller | 79 | 71.5 years |
| Harris | 72 | 70.3 years |
| Thomas | 67 | 71.4 years |
| Moore | 67 | 73.2 years |
| Businesses in Prince William County, VA | ||||
| Name | Count | Name | Count | |
|---|---|---|---|---|
| 7-Eleven | 56 | Justice | 2 | |
| ALDI | 3 | KFC | 7 | |
| AMF Bowling | 1 | Kmart | 2 | |
| AT&T | 19 | Kohl's | 2 | |
| Ace Hardware | 2 | LA Fitness | 2 | |
| Advance Auto Parts | 7 | La-Z-Boy | 1 | |
| Aeropostale | 2 | Lane Bryant | 2 | |
| American Eagle Outfitters | 2 | Lane Furniture | 1 | |
| Ann Taylor | 1 | LensCrafters | 2 | |
| Applebee's | 3 | Levi Strauss & Co. | 1 | |
| Arby's | 4 | Little Caesars Pizza | 2 | |
| Ashley Furniture | 1 | Long John Silver's | 1 | |
| AutoZone | 5 | Lowe's | 3 | |
| Avenue | 1 | Macy's | 1 | |
| Bakers | 1 | Marriott | 7 | |
| Bally Total Fitness | 1 | Marshalls | 2 | |
| Banana Republic | 1 | MasterBrand Cabinets | 64 | |
| Barnes & Noble | 1 | Mazda | 1 | |
| Baskin-Robbins | 6 | McDonald's | 24 | |
| Bath & Body Works | 3 | Men's Wearhouse | 2 | |
| Bed Bath & Beyond | 3 | Motherhood Maternity | 2 | |
| Best Western | 3 | New Balance | 3 | |
| Blockbuster | 7 | New York & Co | 1 | |
| Brooks Brothers | 1 | Nike | 39 | |
| Budget Car Rental | 1 | Nissan | 2 | |
| Buffalo Wild Wings | 2 | Nordstrom | 1 | |
| Burger King | 10 | Office Depot | 2 | |
| CVS | 14 | Old Country Buffet | 1 | |
| CarMax | 1 | Old Navy | 2 | |
| Caribou Coffee | 1 | Olive Garden | 2 | |
| Casual Male XL | 2 | On The Border | 1 | |
| Catherines | 2 | Outback | 1 | |
| Charlotte Russe | 2 | Outback Steakhouse | 1 | |
| Chevrolet | 2 | Pac Sun | 2 | |
| Chick-Fil-A | 5 | Panda Express | 3 | |
| Chico's | 1 | Panera Bread | 6 | |
| Chipotle | 4 | Papa John's Pizza | 5 | |
| Chuck E. Cheese's | 2 | Payless | 4 | |
| Cinnabon | 1 | Penske | 3 | |
| Circle K | 7 | PetSmart | 4 | |
| Clarks | 1 | Pier 1 Imports | 3 | |
| Cold Stone Creamery | 3 | Pizza Hut | 10 | |
| ColorTyme | 2 | Popeyes | 5 | |
| Comfort Inn | 1 | Qdoba Mexican Grill | 3 | |
| Comfort Suites | 1 | Quality | 2 | |
| Costco | 2 | Quiznos | 6 | |
| Cracker Barrel | 2 | RadioShack | 6 | |
| Cricket Wireless | 15 | Ramada | 1 | |
| Curves | 1 | Red Lobster | 2 | |
| DHL | 5 | Red Robin | 3 | |
| Dairy Queen | 6 | Red Roof Inn | 1 | |
| Days Inn | 1 | Rite Aid | 4 | |
| Deb | 1 | Rodeway Inn | 1 | |
| Decora Cabinetry | 22 | Ruby Tuesday | 4 | |
| Dennys | 3 | Ryder Rental & Truck Leasing | 1 | |
| Domino's Pizza | 1 | Safeway | 5 | |
| DressBarn | 2 | Sam's Club | 1 | |
| Dressbarn | 2 | Sears | 5 | |
| Dunkin Donuts | 8 | Skechers USA | 1 | |
| Econo Lodge | 2 | Sleep Inn | 2 | |
| Express | 1 | Spencer Gifts | 2 | |
| Famous Footwear | 2 | Sprint Nextel | 9 | |
| Fashion Bug | 1 | Staples | 4 | |
| FedEx | 57 | Starbucks | 20 | |
| Finish Line | 2 | Subaru | 1 | |
| Firestone Complete Auto Care | 2 | Subway | 30 | |
| Foot Locker | 3 | Super 8 | 4 | |
| Ford | 2 | T-Mobile | 14 | |
| Forever 21 | 1 | T.G.I. Driday's | 2 | |
| GNC | 10 | T.J.Maxx | 2 | |
| GameStop | 8 | Taco Bell | 10 | |
| Gap | 1 | Talbots | 1 | |
| Giant | 7 | Target | 5 | |
| Goodwill | 3 | The Room Place | 3 | |
| Gymboree | 1 | Torrid | 1 | |
| H&M | 2 | Toyota | 2 | |
| H&R Block | 12 | Toys"R"Us | 5 | |
| Haagen-Dazs | 1 | True Value | 1 | |
| Havertys Furniture | 1 | U-Haul | 9 | |
| Hilton | 4 | UPS | 48 | |
| Holiday Inn | 4 | Value City Furniture | 1 | |
| Home Depot | 3 | Vans | 5 | |
| Honda | 2 | Verizon Wireless | 3 | |
| Hot Topic | 2 | Victoria's Secret | 2 | |
| Hyundai | 2 | Volkswagen | 1 | |
| IHOP | 6 | Vons | 5 | |
| IKEA | 1 | Waffle House | 1 | |
| J.Crew | 1 | Walgreens | 6 | |
| JCPenney | 2 | Walmart | 4 | |
| JoS. A. Bank | 2 | Wendy's | 9 | |
| Jones New York | 1 | Wet Seal | 1 | |
| Journeys | 2 | World Gym | 1 | |
Prince William County on our top lists:
- #3 on the list of "Top 101 counties with the lowest number of deaths per 1000 residents 2007-2013 (pop. 50,000+)"
- #5 on the list of "Top 101 counties with the largest number of children under 18 without health insurance coverage in 2000 (pop. 50,000+)"
- #26 on the list of "Top 101 counties with the lowest Nitrogen Dioxide air pollution readings in 2012 (ppm)"
- #35 on the list of "Top 101 counties with the highest number of births per 1000 residents 2007-2013"
- #35 on the list of "Top 101 counties with the highest number of births per 1000 residents 2007-2013 (pop 50,000+)"
- #40 on the list of "Top 101 counties with the lowest number of deaths per 1000 residents 2007-2013"
- #41 on the list of "Top 101 counties with the largest increase in the number of infant deaths per 1000 residents 2000-2006 to 2007-2013 (pop. 50,000+)"
- #50 on the list of "Top 101 counties with the largest number of people moving in compared to moving out (pop. 50,000+)"
- #51 on the list of "Top 101 counties with the highest percentage of residents relocating from other counties between 2010 and 2011 (pop. 50,000+)"
- #59 on the list of "Top 101 counties with the largest number of children under 18 without health insurance coverage in 2000"
- #66 on the list of "Top 101 counties with the highest percentage of residents relocating from foreign countries between 2010 and 2011 (pop. 50,000+)"
- #74 on the list of "Top 101 counties with the highest percentage of residents relocating to foreign countries in 2011 (pop. 50,000+)"
- #90 on the list of "Top 101 counties with the highest surface withdrawal of fresh water for public supply (pop. 50,000+)"
- #94 on the list of "Top 101 counties with the highest percentage of residents relocating to other counties in 2011 (pop. 50,000+)"
- #95 on the list of "Top 101 counties with the highest percentage of residents relocating from foreign countries between 2010 and 2011"
- #95 on the list of "Top 101 counties with the highest surface withdrawal of fresh water for public supply"
- #100 on the list of "Top 101 counties with the largest decrease in the number of births per 1000 residents 2000-2006 to 2007-2013 (pop 50,000+)"
- #100 on the list of "Top 101 counties with the highest number of infant deaths per 1000 residents 2007-2013 (pop. 50,000+)"