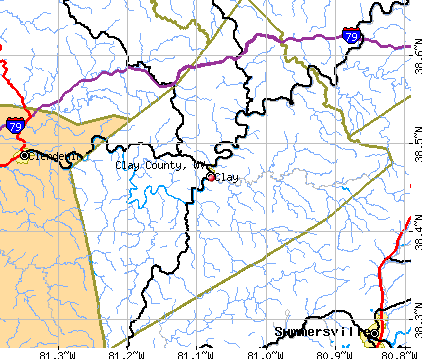
Clay County, West Virginia (WV)
County owner-occupied free and clear houses and condos in 2010: 1,805
County owner-occupied houses and condos in 2000: 3,179
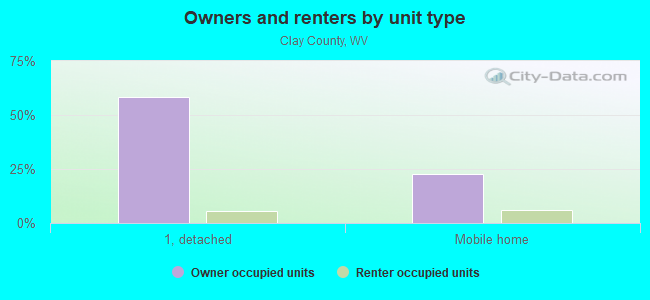
Renter-occupied apartments: 787 (it was 841 in 2000)
| % of renters here: | 21% |
| State: | 27% |
Land area: 342 sq. mi.
Water area: 1.4 sq. mi.
Population density: 23 people per square mile (low).
Industries providing employment: Educational, health and social services (28.9%), Retail trade (16.2%), Construction (10.4%).
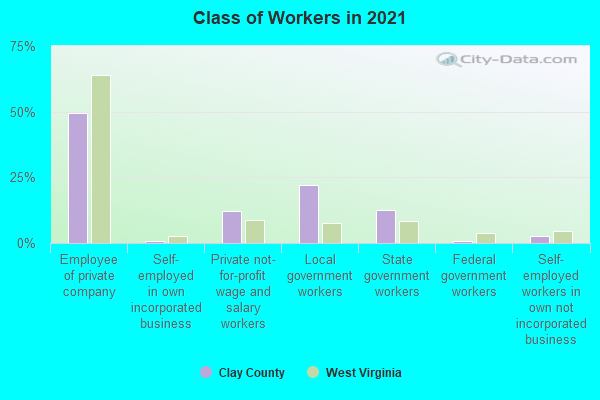
Type of workers:
- Private wage or salary: 72%
- Government: 26%
- Self-employed, not incorporated: 2%
- Unpaid family work: 0%
- OSM Map
- General Map
- Google Map
- MSN Map

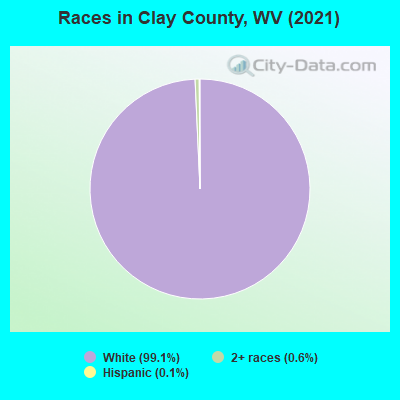
- 7,65396.3%White Non-Hispanic Alone
- 2773.5%Two or more races
- 80.1%Hispanic or Latino
- 60.08%American Indian and Alaska Native alone
- 40.05%Black Non-Hispanic Alone
| Median resident age: | 45.3 years |
| West Virginia median age: | 42.9 years |
| Males: 3,960 | |
| Females: 4,009 |

 | West Virginia...Southern or Northern? (474 replies) |
| Teays Valley WV Business News (21 replies) |
| 2020 Census in West Virginia (24 replies) |
| How can we fix the WV economy? (238 replies) |
| Elk River Rail Trail planned between Clendenin and Clay (26 replies) |
| Restaurants and Stores in Charleston are going up!!! (969 replies) |
| Clay County: | 2.0 people |
| West Virginia: | 2 people |
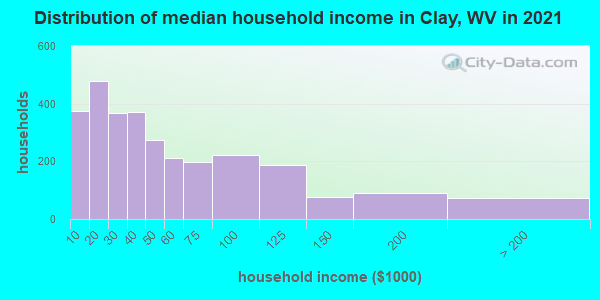
Estimated median household income in 2022: $40,862 ($22,120 in 1999)
| This county: | $40,862 |
| West Virginia: | $54,329 |
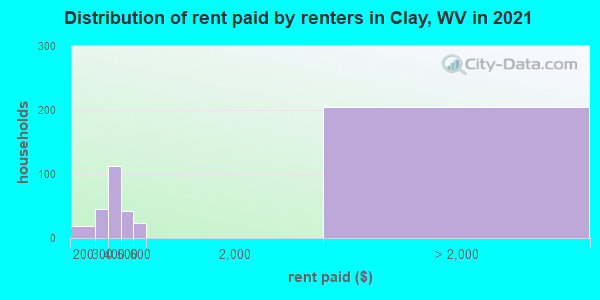
Median contract rent in 2022 for apartments: $336 (lower quartile is $275, upper quartile is $439)
| This county: | $336 |
| State: | $606 |
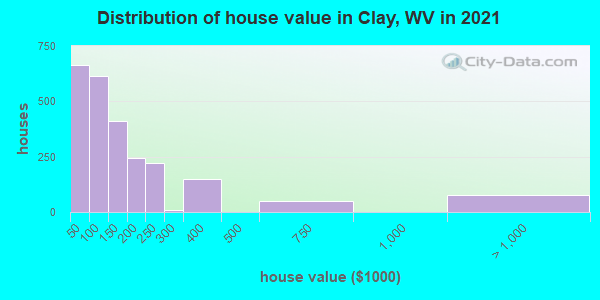
Estimated median house or condo value in 2022: $107,230 (it was $47,300 in 2000)
| Clay: | $107,230 |
| West Virginia: | $155,100 |
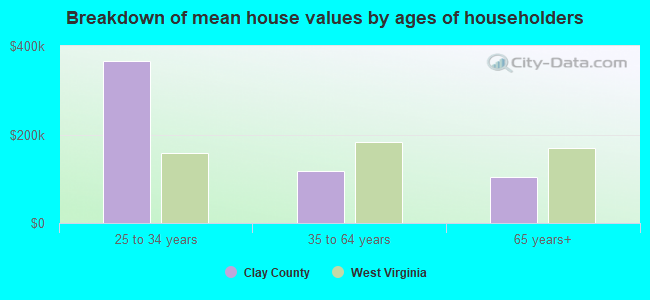
Mean price in 2022:
Median monthly housing costs for homes and condos with a mortgage: $929Detached houses: $167,648
Here: $167,648 State: $206,655 Townhouses or other attached units: $54,643
Here: $54,643 State: $205,683 Mobile homes: $131,455
Here: $131,455 State: $63,963
Median monthly housing costs for units without a mortgage: $292
Institutionalized population: 56
Crime in 2004 (reported by the sheriff's office or county police, not the county total):
- Murders: 0
- Rapes: 0
- Robberies: 0
- Assaults: 2
- Burglaries: 0
- Thefts: 0
- Auto thefts: 0
Crime in 2003 (reported by the sheriff's office or county police, not the county total):
- Murders: 0
- Rapes: 0
- Robberies: 0
- Assaults: 2
- Burglaries: 1
- Thefts: 4
- Auto thefts: 0
Health of residents in Clay County based on CDC Behavioral Risk Factor Surveillance System Survey Questionnaires from 2013 to 2021:
General health status score of residents in this county from 1 (poor) to 5 (excellent) is 3.2. This is significantly worse than average.68.0% of residents exercised in the past month. This is less than average.
48.4% of residents smoked 100+ cigarettes in their lives. This is about average.
33.9% of adult residents drank alcohol in the past 30 days. This is less than average.
62.7% of residents visited a dentist within the past year. This is less than average.
Average weight of males is 207 pounds. This is more than average.
Average weight of females is 170 pounds. This is more than average.
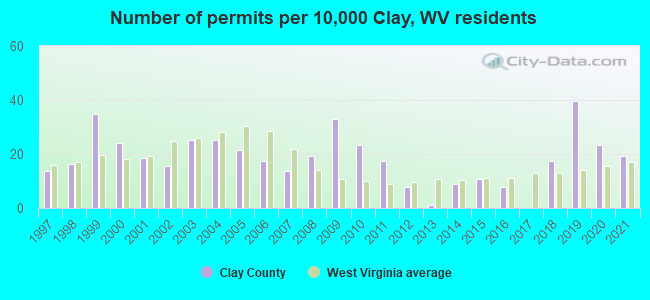
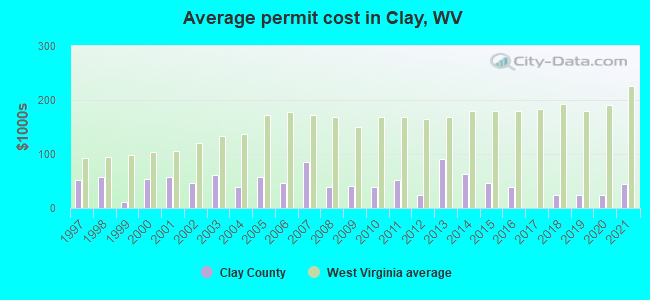
Single-family new house construction building permits:
- 2022: 16 buildings, average cost: $32,800
- 2021: 20 buildings, average cost: $43,800
- 2020: 24 buildings, average cost: $25,000
- 2019: 41 buildings, average cost: $25,000
- 2018: 18 buildings, average cost: $25,000
- 2017: 0 buildings
- 2016: 8 buildings, average cost: $37,800
- 2015: 11 buildings, average cost: $45,500
- 2014: 9 buildings, average cost: $63,100
- 2013: 1 building, cost: $91,000
- 2012: 8 buildings, average cost: $24,100
- 2011: 18 buildings, average cost: $52,100
- 2010: 24 buildings, average cost: $39,000
- 2009: 34 buildings, average cost: $40,600
- 2008: 20 buildings, average cost: $38,100
- 2007: 14 buildings, average cost: $85,600
- 2006: 18 buildings, average cost: $47,400
- 2005: 22 buildings, average cost: $57,600
- 2004: 26 buildings, average cost: $38,700
- 2003: 26 buildings, average cost: $61,700
- 2002: 16 buildings, average cost: $47,000
- 2001: 19 buildings, average cost: $57,600
- 2000: 25 buildings, average cost: $52,600
- 1999: 36 buildings, average cost: $10,900
- 1998: 17 buildings, average cost: $57,200
- 1997: 14 buildings, average cost: $51,000
Median real estate property taxes paid for housing units with mortgages in 2022: $391 (0.3%)
Median real estate property taxes paid for housing units with no mortgage in 2022: $315 (0.3%)
| Clay County: | 26.2% |
| West Virginia: | 17.9% |
Median age of residents in 2022: 45.3 years old
(Males: 45.8 years old, Females: 44.8 years old)
(Median age for: White residents: 45.2 years old, Hispanic or Latino residents: 36.8 years old)
Area name: Charleston, WV HUD Metro FMR Area
Fair market rent in 2006 for a 1-bedroom apartment in Clay County is $432 a month.
Fair market rent for a 2-bedroom apartment is $540 a month.
Fair market rent for a 3-bedroom apartment is $688 a month.
Cities in this county include: Clay.
Neighboring counties: Chase County, Kansas  , Fauquier County, Virginia
  , Posey County, Indiana , Monroe County, Illinois , Prince William County, Virginia , Falls Church city, Virginia , Manassas Park city, Virginia .
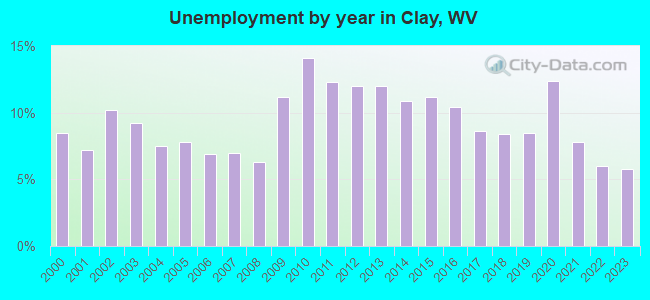
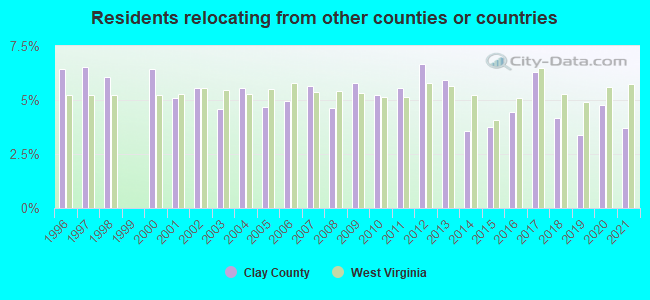
| Here: | 6.5% |
| West Virginia: | 4.0% |
Current college students: 258
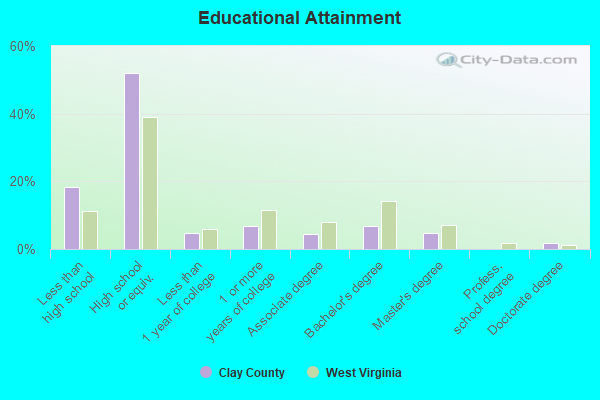
People 25 years of age or older with a high school degree or higher: 83.3%
People 25 years of age or older with a bachelor's degree or higher: 12.6%
Number of foreign born residents: 3 (105.1% naturalized citizens)
| Clay County: | 0.0% |
| Whole state: | 1.8% |
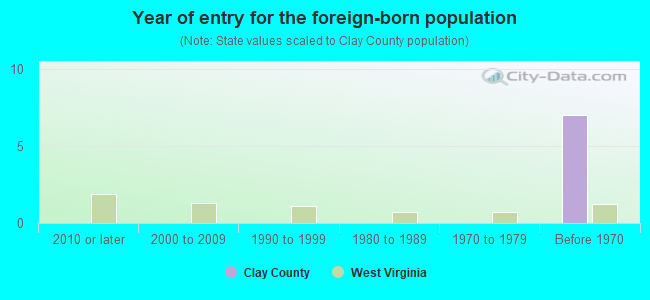
- Year of entry for the foreign-born population
- 02010 or later
- 02000 to 2009
- 01990 to 1999
- 01980 to 1989
- 01970 to 1979
- 7Before 1970
Mean travel time to work (commute): & minutes
Percentage of county residents living and working in this county: 99.1%
Housing units in structures:
- One, detached: 2,653
- Two: 55
- 3 or 4: 9
- 5 to 9: 11
- 10 to 19: 14
- Mobile homes: 1,182
- Boats, RVs, vans, etc.: 45
Housing units in Clay County with a mortgage: 707 (56 second mortgage, 0 home equity loan, 46 both second mortgage and home equity loan)
Houses without a mortgage: 0
| Here: | 100.0% with mortgage |
| State: | 97.1% with mortgage |
Religion statistics for Clay County
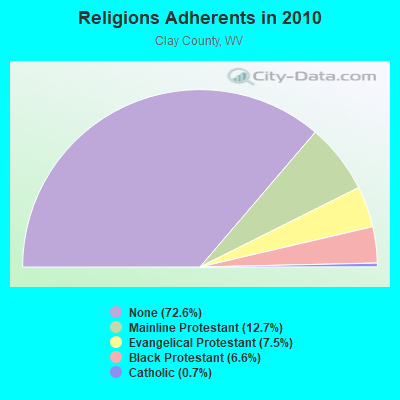
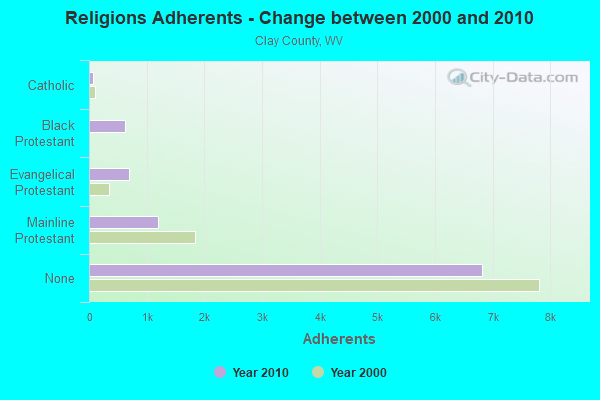
| Religion | Adherents | Congregations |
|---|---|---|
| Mainline Protestant | 1,190 | 18 |
| Evangelical Protestant | 701 | 8 |
| Black Protestant | 617 | 4 |
| Catholic | 66 | 1 |
| Other | 2 | - |
| None | 6,810 | - |
Source: Clifford Grammich, Kirk Hadaway, Richard Houseal, Dale E.Jones, Alexei Krindatch, Richie Stanley and Richard H.Taylor. 2012. 2010 U.S.Religion Census: Religious Congregations & Membership Study. Association of Statisticians of American Religious Bodies. Jones, Dale E., et al. 2002. Congregations and Membership in the United States 2000. Nashville, TN: Glenmary Research Center.
Food Environment Statistics:
| Clay County: | 2.97 / 10,000 pop. |
| State: | 2.41 / 10,000 pop. |
| This county: | 0.99 / 10,000 pop. |
| West Virginia: | 1.09 / 10,000 pop. |
| Clay County: | 5.93 / 10,000 pop. |
| West Virginia: | 5.38 / 10,000 pop. |
| This county: | 4.95 / 10,000 pop. |
| State: | 6.22 / 10,000 pop. |
| Clay County: | 13.1% |
| West Virginia: | 12.2% |
| Clay County: | 35.3% |
| State: | 31.1% |
| Here: | 11.0% |
| State: | 13.1% |
Agriculture in Clay County:
Average size of farms: 160 acresAverage value of agricultural products sold per farm: $3,094
Average value of crops sold per acre for harvested cropland: $26.80
The value of nursery, greenhouse, floriculture, and sod as a percentage of the total market value of agricultural products sold: 3.98%
The value of livestock, poultry, and their products as a percentage of the total market value of agricultural products sold: 85.80%
Average total farm production expenses per farm: $6,573
Harvested cropland as a percentage of land in farms: 10.25%
Average market value of all machinery and equipment per farm: $17,886
The percentage of farms operated by a family or individual: 99.15%
Average age of principal farm operators: 55 years
Average number of cattle and calves per 100 acres of all land in farms: 6.74
Milk cows as a percentage of all cattle and calves: 0.63%
Vegetables: 10 harvested acres
Land in orchards: 5 acres
Earthquake activity:
Clay County-area historical earthquake activity is significantly above West Virginia state average. It is 19% smaller than the overall U.S. average.On 8/23/2011 at 17:51:04, a magnitude 5.8 (5.8 MW, Depth: 3.7 mi, Class: Moderate, Intensity: VI - VII) earthquake occurred 175.1 miles away from Clay County center
On 7/27/1980 at 18:52:21, a magnitude 5.2 (5.1 MB, 4.7 MS, 5.0 UK, 5.2 UK) earthquake occurred 156.4 miles away from the county center
On 8/9/2020 at 12:07:37, a magnitude 5.1 (5.1 MW, Depth: 4.7 mi) earthquake occurred 137.2 miles away from the county center
On 9/25/1998 at 19:52:52, a magnitude 5.2 (4.8 MB, 4.3 MS, 5.2 LG, 4.5 MW, Depth: 3.1 mi) earthquake occurred 212.8 miles away from the county center
On 1/31/1986 at 16:46:43, a magnitude 5.0 (5.0 MB) earthquake occurred 217.4 miles away from Clay County center
On 9/7/1988 at 02:28:09, a magnitude 4.6 (4.5 MB, 4.6 LG, Class: Light, Intensity: IV - V) earthquake occurred 153.5 miles away from the county center
Magnitude types: regional Lg-wave magnitude (LG), body-wave magnitude (MB), surface-wave magnitude (MS), moment magnitude (MW)
Most recent natural disasters:
- West Virginia Covid-19 Pandemic, Incident Period: January 20, 2020, Major Disaster (Presidential) Declared DR-4517-WV: April 3, 2020, FEMA Id: 4517, Natural disaster type: Other
- West Virginia Severe Storms, Flooding, Landslides, and Mudslides, Incident Period: June 22, 2016 to June 29, 2016, Major Disaster (Presidential) Declared DR-4273: June 25, 2016, FEMA Id: 4273, Natural disaster type: Storm, Mudslide, Landslide, Flood
- West Virginia Severe Storms, Straight-line Winds, Flooding, Landslides, and Mudslides, Incident Period: July 10, 2015 to July 14, 2015, Major Disaster (Presidential) Declared DR-4236: August 07, 2015, FEMA Id: 4236, Natural disaster type: Storm, Mudslide, Landslide, Flood, Wind
- West Virginia Chemical Spill, Incident Period: January 09, 2014 to January 20, 2014, Emergency Declared EM-3366: January 10, 2014, FEMA Id: 3366, Natural disaster type: Other
- West Virginia Hurricane Sandy, Incident Period: October 29, 2012 to November 08, 2012, Emergency Declared EM-3358: October 29, 2012, FEMA Id: 3358, Natural disaster type: Hurricane
- West Virginia Hurricane Sandy, Incident Period: October 29, 2012 to November 08, 2012, Major Disaster (Presidential) Declared DR-4093: November 27, 2012, FEMA Id: 4093, Natural disaster type: Hurricane
- West Virginia Severe Storms, Incident Period: June 29, 2012 to July 10, 2012, Emergency Declared EM-3345: June 30, 2012, FEMA Id: 3345, Natural disaster type: Storm
- West Virginia Severe Storms and Straight-Line Winds, Incident Period: June 29, 2012 to July 08, 2012, Major Disaster (Presidential) Declared DR-4071: July 23, 2012, FEMA Id: 4071, Natural disaster type: Storm, Wind
- West Virginia Severe Winter Storm and Snowstorm, Incident Period: December 18, 2009 to December 20, 2009, Major Disaster (Presidential) Declared DR-1881: March 02, 2010, FEMA Id: 1881, Natural disaster type: Snowstorm, Winter Storm
- West Virginia Severe Storms, Tornadoes, Flooding, Mudslides, and Landslides, Incident Period: June 03, 2008 to June 07, 2008, Major Disaster (Presidential) Declared DR-1769: June 19, 2008, FEMA Id: 1769, Natural disaster type: Storm, Tornado, Mudslide, Landslide, Flood
- 13 other natural disasters have been reported since 1953.
The number of natural disasters in Clay County (23) is greater than the US average (15).
Major Disasters (Presidential) Declared: 17
Emergencies Declared: 5
Causes of natural disasters: Floods: 11, Storms: 11, Landslides: 6, Hurricanes: 3, Mudslides: 3, Winter Storms: 3, Tornadoes: 2, Winds: 2, Blizzard: 1, Fire: 1, Snowfall: 1, Snowstorm: 1, Other: 2 (Note: some incidents may be assigned to more than one category).
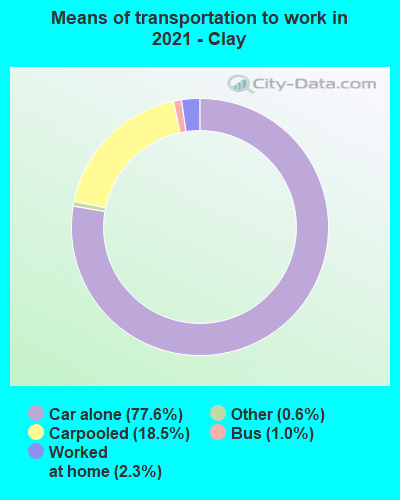
Means of transportation to work:
- Drove a car alone: 1,217 (79.5%)
- Carpooled: 200 (13.1%)
- Taxicab, motorcycle, or other means: 3 (0.2%)
- Walked: 16 (1.0%)
- Worked at home: 78 (5.1%)
- Health care and social assistance (18%)
- Educational services (18%)
- Retail trade (14%)
- Public administration (11%)
- Accommodation and food services (5%)
- Finance and insurance (4%)
- Manufacturing (3%)
- Health care and social assistance (22%)
- Educational services (21%)
- Retail trade (17%)
- Public administration (14%)
- Accommodation and food services (6%)
- Finance and insurance (5%)
- Manufacturing (4%)
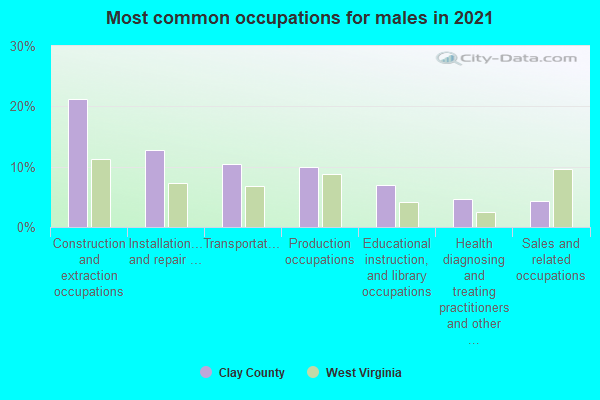
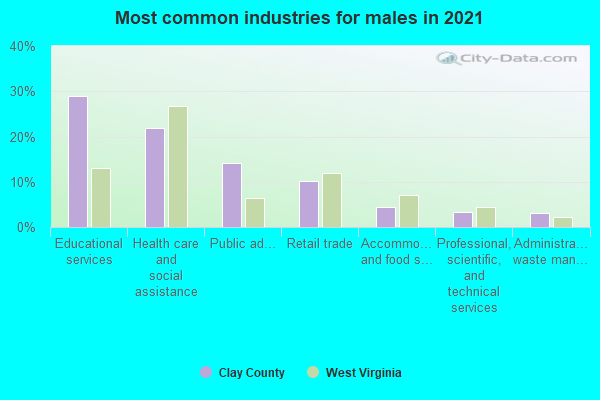
- Construction and extraction occupations (18%)
- Transportation occupations (12%)
- Installation, maintenance, and repair occupations (11%)
- Production occupations (9%)
- Management occupations (6%)
- Educational instruction, and library occupations (6%)
- Office and administrative support occupations (4%)
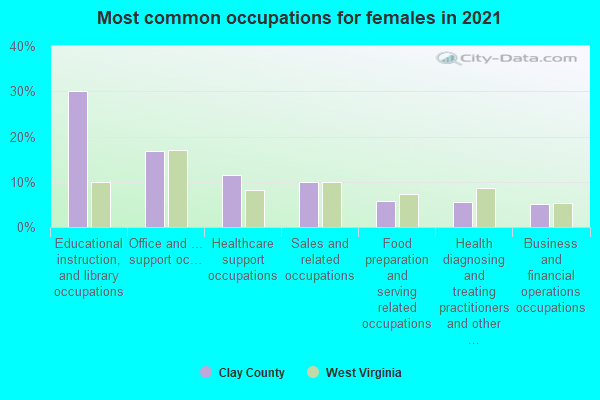
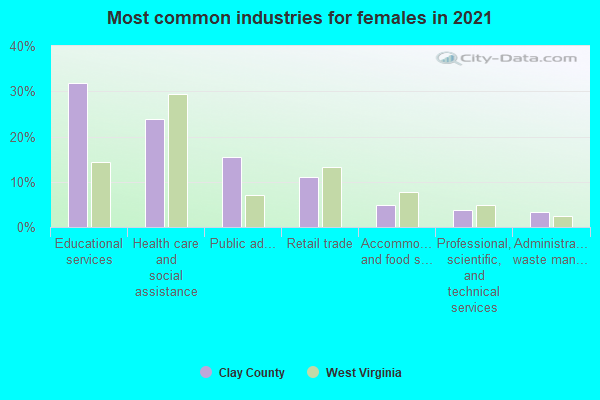
- Educational instruction, and library occupations (21%)
- Office and administrative support occupations (20%)
- Sales and related occupations (12%)
- Healthcare support occupations (11%)
- Management occupations (6%)
- Business and financial operations occupations (6%)
- Food preparation and serving related occupations (5%)
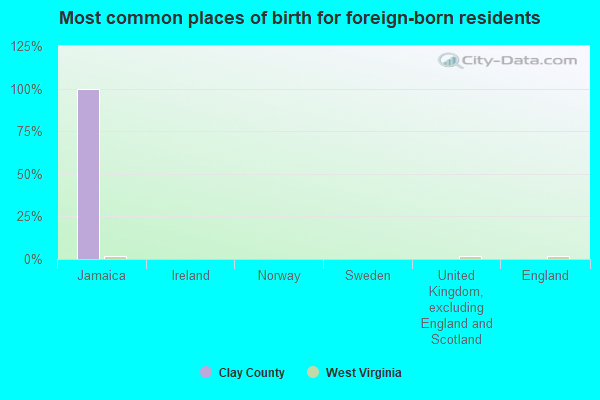
- Jamaica (100%)
- Ireland (0%)
- Norway (0%)
- Sweden (0%)
- United Kingdom, excluding England and Scotland (0%)
- England (0%)
- Scotland (0%)
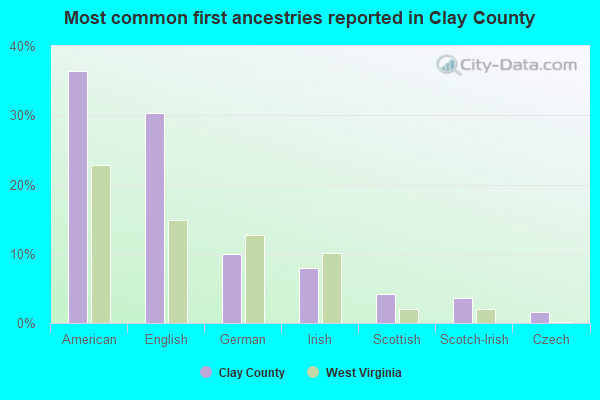
- American (39%)
- English (33%)
- Irish (9%)
- German (9%)
- Scottish (2%)
- Italian (2%)
- Scotch-Irish (2%)
18 people in group homes intended for adults
People in group quarters in Clay County, West Virginia in 2000:
- 50 people in nursing homes
- 15 people in mental (psychiatric) hospitals or wards
- 5 people in other noninstitutional group quarters
3.71% of this county's 2021 resident taxpayers lived in other counties in 2020 ($30,105 average adjusted gross income)
| Here: | 3.71% |
| West Virginia average: | 5.74% |
10 or fewer of this county's residents moved from foreign countries.
3.71% relocated from other counties in West Virginia ($30,105 average AGI)
10 or fewer of this county's residents relocated from other states.
Top counties from which taxpayers relocated into this county between 2020 and 2021:
| from Kanawha County, WV |
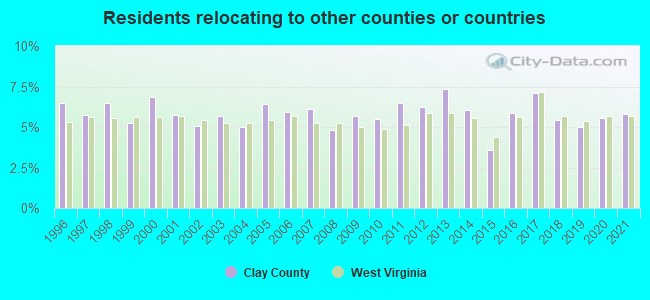
5.78% of this county's 2020 resident taxpayers moved to other counties in 2021 ($31,947 average adjusted gross income)
| Here: | 5.78% |
| West Virginia average: | 5.65% |
10 or fewer of this county's residents moved to foreign countries.
4.74% relocated to other counties in West Virginia ($24,808 average AGI)
1.03% relocated to other states ($7,139 average AGI)
Clay County: 1.03% West Virginia average: 2.93%
Top counties to which taxpayers relocated from this county between 2020 and 2021:
| to Kanawha County, WV |
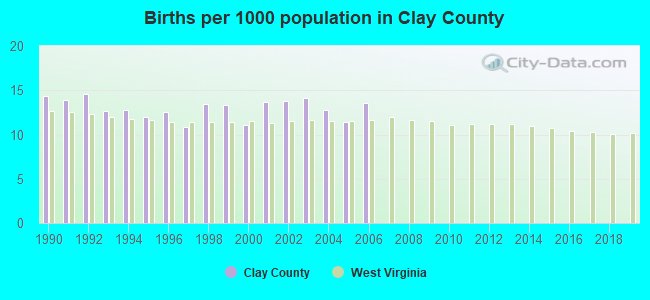
Births per 1000 population from 1990 to 1999: 13.0
Births per 1000 population from 2000 to 2006: 12.9
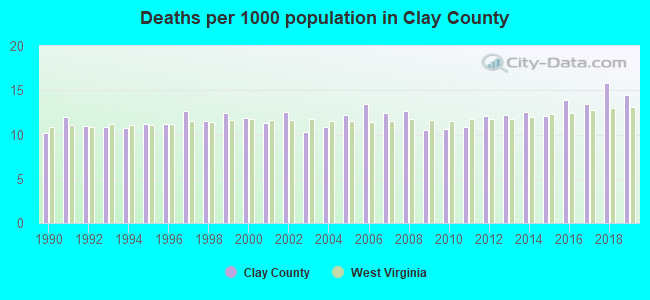
Deaths per 1000 population from 1990 to 1999: 11.4
Deaths per 1000 population from 2000 to 2009: 11.8
Deaths per 1000 population from 2010 to 2020: 13.2
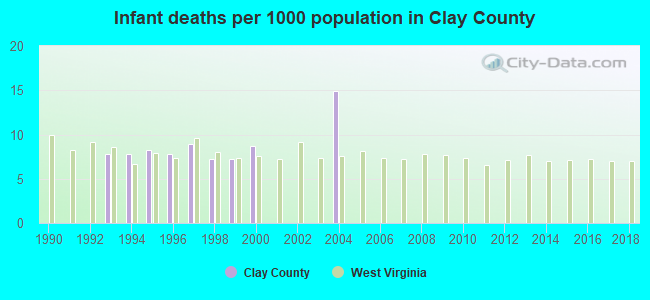
Infant deaths per 1000 live births from 1990 to 1999: 5.5
Infant deaths per 1000 live births from 2000 to 2006: 3.4
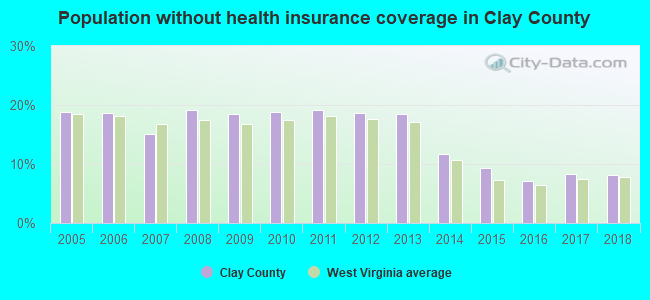
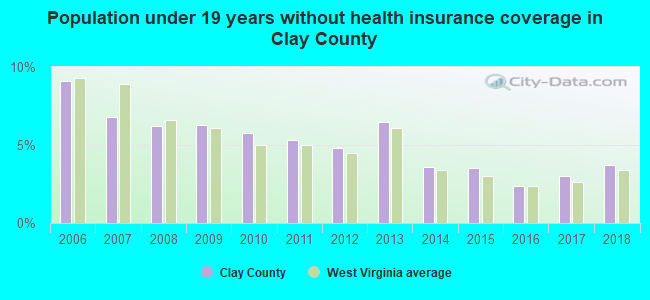
Persons under 19 years old without health insurance coverage in 2018: 3.7%
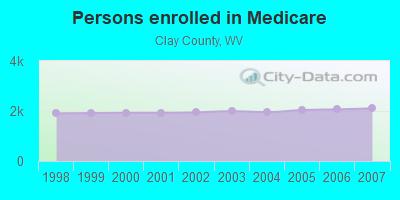
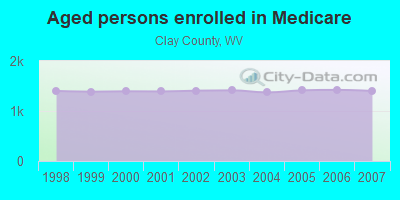
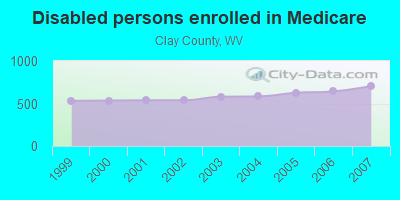
Persons enrolled in hospital insurance and/or supplemental medical insurance (Medicare) in July 1, 2007: 2,105 (1,401 aged, 704 disabled)
Children under 18 without health insurance coverage in 2007: 143 (6%)
Most common underlying causes of death in Clay County, West Virginia in 1999 - 2019:
- Bronchus or lung, unspecified - Malignant neoplasms (132)
- Atherosclerotic heart disease (80)
- Acute myocardial infarction, unspecified (22)
- Unspecified dementia (11)
- Chronic obstructive pulmonary disease, unspecified (10)
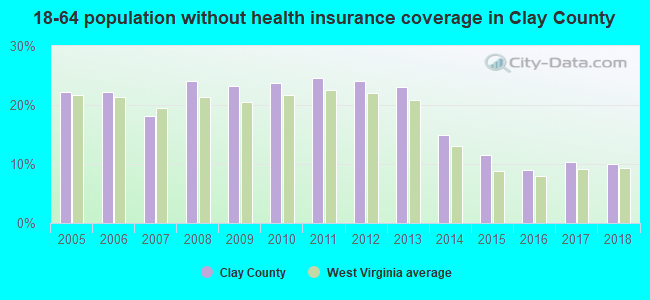
Population without health insurance coverage in 2000: 18%
Children under 18 without health insurance coverage in 2000: 12%
Medical specialist MDs per 100,000 population in 2005: 1,091
Total births per 100,000 population, July 2005 - July 2006 : 10
Total deaths per 100,000 population, July 2005 - July 2006: 10
Crimes per 100,000 population in 1996: 1
Household type by relationship:
Households: 7,969- Male householders: 1,569 (308 living alone), Female householders: 1,372 (458 living alone)
1,582 spouses (1,582 opposite-sex spouses), 262 unmarried partners, (262 opposite-sex unmarried partners), 2,371 children (1,932 natural, 292 adopted, 181 stepchildren), 199 grandchildren, 87 brothers or sisters, 115 parents, 16 foster children, 193 other relatives, 107 non-relatives
- In group quarters: 75
Size of family households: 917 2-persons, 444 3-persons, 336 4-persons, 259 5-persons, 81 6-persons, 26 7-or-more-persons.
Size of nonfamily households: 767 1-person, 85 2-persons, 16 3-persons, 7 6-persons.
881 married couples with children.
504 single-parent households (274 men, 230 women).
98.9% of residents of Clay speak English at home.
0.1% of residents speak Spanish at home (100% speak English very well).
0.1% of residents speak other Indo-European language at home (100% speak English very well).
1.0% of residents speak Asian or Pacific Island language at home (100% speak English very well).
In fiscal year 2004:
Federal Government expenditure: $72,971,000 ($7,000 per capita)
Department of Defense expenditure: $548,000
Federal direct payments to individuals for retirement and disability: $30,829,000
Federal other direct payments to individuals: $14,752,000
Federal direct payments not to individuals: $40,000
Federal grants: $25,311,000
Federal procurement contracts: $406,000 ($0,000 Department of Defense)
Federal salaries and wages: $1,633,000 ($0,000 Department of Defense)
Federal Government direct loans: $21,000
Federal guaranteed/insured loans: $357,000
Federal Government insurance: $7,210,000
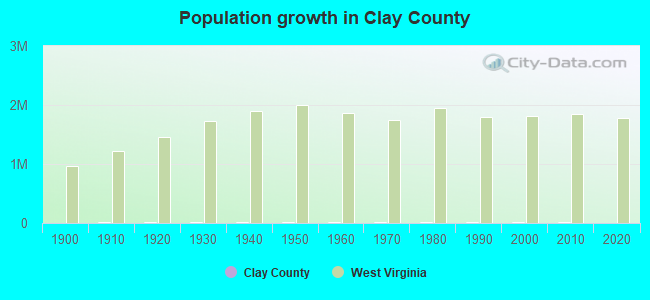
Population change from April 1, 2000 to July 1, 2005:
Births: 729| Here: | 70 per 1000 residents |
| State: | 60 per 1000 residents |
Deaths: 601
| Here: | 58 per 1000 residents |
| State: | 61 per 1000 residents |
Net international migration: 0
| Here: | 0 per 1000 residents |
| State: | +2 per 1000 residents |
Net internal migration: -86
| Here: | |
| State: |
Total withdrawal of fresh water for public supply: 0.42 millions of gallons per day (all from surface)
| Here: | 6.4 |
| State: | 6.5 |
| Here: | 5.1 |
| State: | 4.7 |
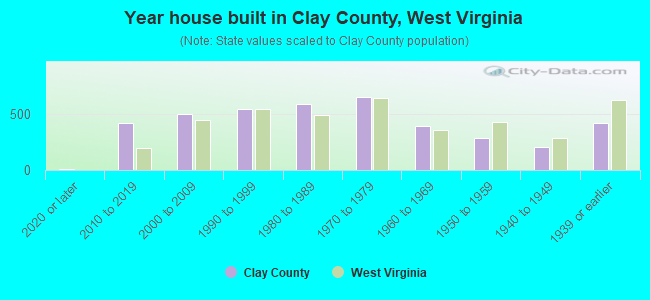
- Year house built in Clay County, West Virginia
- 202020 or later
- 5492010 to 2019
- 5532000 to 2009
- 5731990 to 1999
- 6161980 to 1989
- 5481970 to 1979
- 4771960 to 1969
- 2531950 to 1959
- 2101940 to 1949
- 2461939 or earlier
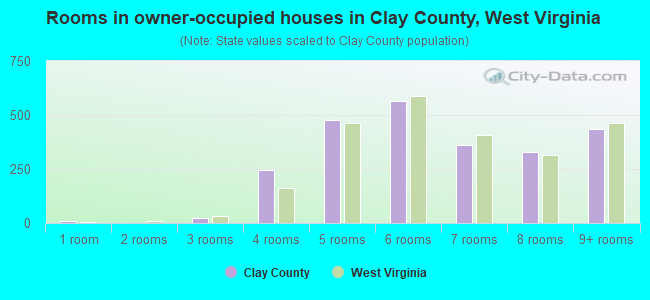
- Rooms in owner-occupied houses in Clay County, West Virginia
- 01 room
- 02 rooms
- 403 rooms
- 2824 rooms
- 4135 rooms
- 5576 rooms
- 3927 rooms
- 3138 rooms
- 4169+ rooms
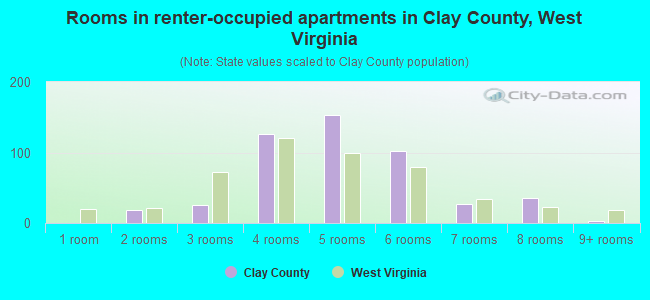
- Rooms in renter-occupied apartments in Clay County, West Virginia
- 41 room
- 172 rooms
- 213 rooms
- 1414 rooms
- 1375 rooms
- 1246 rooms
- 207 rooms
- 558 rooms
- 159+ rooms
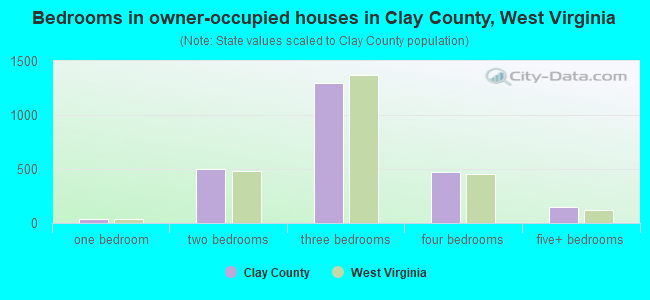
- Bedrooms in owner-occupied houses in Clay County, West Virginia
- 0no bedroom
- 591 bedroom
- 5212 bedrooms
- 1,2053 bedrooms
- 5164 bedrooms
- 1115+ bedrooms
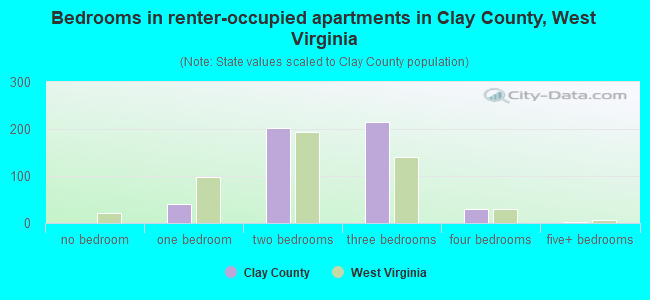
- Bedrooms in renter-occupied apartments in Clay County, West Virginia
- 4no bedroom
- 381 bedroom
- 2002 bedrooms
- 2603 bedrooms
- 334 bedrooms
- 25+ bedrooms
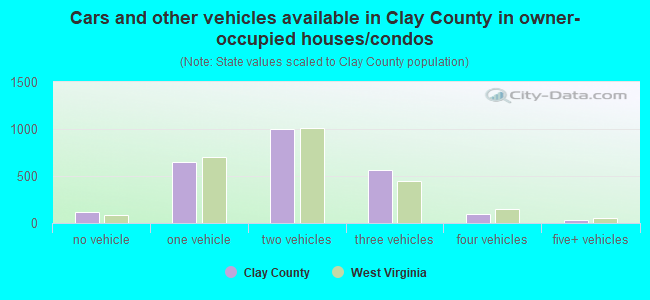
- Cars and other vehicles available in Clay County in owner-occupied houses/condos
- 128no vehicle
- 6821 vehicle
- 9962 vehicles
- 5023 vehicles
- 694 vehicles
- 495+ vehicles
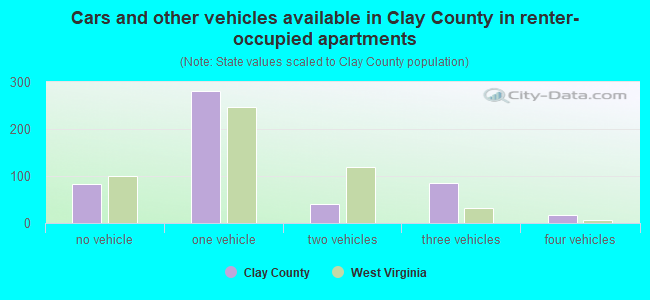
- Cars and other vehicles available in Clay County in renter-occupied apartments
- 101no vehicle
- 2471 vehicle
- 742 vehicles
- 1063 vehicles
- 64 vehicles
- 05+ vehicles
94.3% of Clay County residents lived in the same house 1 years ago.
Out of people who lived in different houses, 33% lived in this county.
Out of people who lived in different counties, 61% lived in West Virginia.
| Clay County: | 94.3% |
| State average: | 89.6% |
Place of birth for U.S.-born residents:
- This state: 6,153
- Other state: 1,762
- Northeast: 468
- Midwest: 580
- South: 665
- West: 36
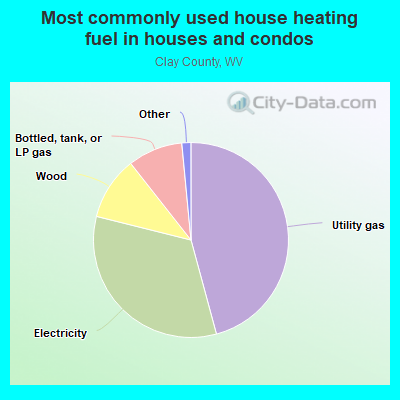
- 43.5%Utility gas
- 36.3%Electricity
- 10.3%Wood
- 9.0%Bottled, tank, or LP gas
- 0.6%Coal or coke
- 0.3%Other fuel
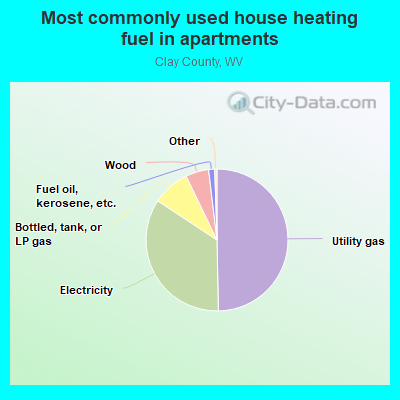
- 53.3%Utility gas
- 38.3%Electricity
- 5.7%Wood
- 2.7%Bottled, tank, or LP gas
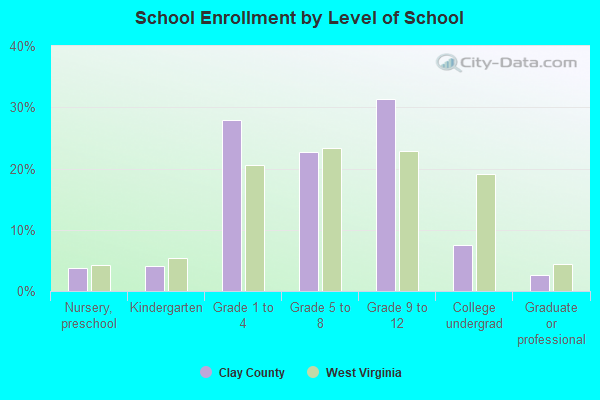
Private vs. public school enrollment:
| Here: | 4.9% |
| West Virginia: | 12.2% |
| Here: | 23.1% |
| West Virginia: | 8.8% |
| Here: | 24.5% |
| West Virginia: | 17.3% |
Clay County government finances - Expenditure in 2018:
- Charges - Other: $1,146,000
Other: $823,000
- Current Operations - Health - Other: $2,105,000
Police Protection: $1,288,000
Health - Other: $953,000
Police Protection: $932,000
Financial Administration: $720,000
Central Staff Services: $720,000
Central Staff Services: $534,000
Financial Administration: $534,000
Judicial and Legal Services: $391,000
Judicial and Legal Services: $290,000
General - Other: $261,000
Libraries: $116,000
Solid Waste Management: $115,000
Libraries: $110,000
General Public Buildings: $105,000
General - Other: $101,000
General Public Buildings: $78,000
Correctional Institutions: $36,000
Correctional Institutions: $23,000
Parks and Recreation: $11,000
Solid Waste Management: $7,000
Parks and Recreation: $7,000
- Federal Intergovernmental - Other: $1,174,000
Other: $54,000
- Local Intergovernmental - Other: $16,000
- Miscellaneous - General Revenue - Other: $146,000
General Revenue - Other: $115,000
Fines and Forfeits: $88,000
Donations From Private Sources: $58,000
Donations From Private Sources: $54,000
Fines and Forfeits: $48,000
Sale of Property: $35,000
Interest Earnings: $8,000
Interest Earnings: $7,000
- Other Funds - Cash and Securities: $2,698,000
Cash and Securities: $2,609,000
- State Intergovernmental - Health and Hospitals: $116,000
Other: $115,000
Health and Hospitals: $104,000
General Local Government Support: $73,000
Other: $67,000
General Local Government Support: $51,000
- Tax - Property: $1,191,000
Property: $1,176,000
Other: $32,000
Other: $30,000
Other License: $28,000
Other License: $14,000
- Total Salaries and Wages: $1,239,000
Clay County government finances - Revenue in 2018:
- Charges - Other: $1,146,000
Other: $823,000
- Current Operations - Health - Other: $2,105,000
Police Protection: $1,288,000
Health - Other: $953,000
Police Protection: $932,000
Financial Administration: $720,000
Central Staff Services: $720,000
Central Staff Services: $534,000
Financial Administration: $534,000
Judicial and Legal Services: $391,000
Judicial and Legal Services: $290,000
General - Other: $261,000
Libraries: $116,000
Solid Waste Management: $115,000
Libraries: $110,000
General Public Buildings: $105,000
General - Other: $101,000
General Public Buildings: $78,000
Correctional Institutions: $36,000
Correctional Institutions: $23,000
Parks and Recreation: $11,000
Solid Waste Management: $7,000
Parks and Recreation: $7,000
- Federal Intergovernmental - Other: $1,174,000
Other: $54,000
- Local Intergovernmental - Other: $16,000
- Miscellaneous - General Revenue - Other: $146,000
General Revenue - Other: $115,000
Fines and Forfeits: $88,000
Donations From Private Sources: $58,000
Donations From Private Sources: $54,000
Fines and Forfeits: $48,000
Sale of Property: $35,000
Interest Earnings: $8,000
Interest Earnings: $7,000
- Other Funds - Cash and Securities: $2,698,000
Cash and Securities: $2,609,000
- State Intergovernmental - Health and Hospitals: $116,000
Other: $115,000
Health and Hospitals: $104,000
General Local Government Support: $73,000
Other: $67,000
General Local Government Support: $51,000
- Tax - Property: $1,191,000
Property: $1,176,000
Other: $32,000
Other: $30,000
Other License: $28,000
Other License: $14,000
- Total Salaries and Wages: $1,239,000
Clay County government finances - Debt in 2018:
- Charges - Other: $1,146,000
Other: $823,000
- Current Operations - Health - Other: $2,105,000
Police Protection: $1,288,000
Health - Other: $953,000
Police Protection: $932,000
Financial Administration: $720,000
Central Staff Services: $720,000
Central Staff Services: $534,000
Financial Administration: $534,000
Judicial and Legal Services: $391,000
Judicial and Legal Services: $290,000
General - Other: $261,000
Libraries: $116,000
Solid Waste Management: $115,000
Libraries: $110,000
General Public Buildings: $105,000
General - Other: $101,000
General Public Buildings: $78,000
Correctional Institutions: $36,000
Correctional Institutions: $23,000
Parks and Recreation: $11,000
Solid Waste Management: $7,000
Parks and Recreation: $7,000
- Federal Intergovernmental - Other: $1,174,000
Other: $54,000
- Local Intergovernmental - Other: $16,000
- Miscellaneous - General Revenue - Other: $146,000
General Revenue - Other: $115,000
Fines and Forfeits: $88,000
Donations From Private Sources: $58,000
Donations From Private Sources: $54,000
Fines and Forfeits: $48,000
Sale of Property: $35,000
Interest Earnings: $8,000
Interest Earnings: $7,000
- Other Funds - Cash and Securities: $2,698,000
Cash and Securities: $2,609,000
- State Intergovernmental - Health and Hospitals: $116,000
Other: $115,000
Health and Hospitals: $104,000
General Local Government Support: $73,000
Other: $67,000
General Local Government Support: $51,000
- Tax - Property: $1,191,000
Property: $1,176,000
Other: $32,000
Other: $30,000
Other License: $28,000
Other License: $14,000
- Total Salaries and Wages: $1,239,000
Clay County government finances - Cash and Securities in 2018:
- Charges - Other: $1,146,000
Other: $823,000
- Current Operations - Health - Other: $2,105,000
Police Protection: $1,288,000
Health - Other: $953,000
Police Protection: $932,000
Financial Administration: $720,000
Central Staff Services: $720,000
Central Staff Services: $534,000
Financial Administration: $534,000
Judicial and Legal Services: $391,000
Judicial and Legal Services: $290,000
General - Other: $261,000
Libraries: $116,000
Solid Waste Management: $115,000
Libraries: $110,000
General Public Buildings: $105,000
General - Other: $101,000
General Public Buildings: $78,000
Correctional Institutions: $36,000
Correctional Institutions: $23,000
Parks and Recreation: $11,000
Solid Waste Management: $7,000
Parks and Recreation: $7,000
- Federal Intergovernmental - Other: $1,174,000
Other: $54,000
- Local Intergovernmental - Other: $16,000
- Miscellaneous - General Revenue - Other: $146,000
General Revenue - Other: $115,000
Fines and Forfeits: $88,000
Donations From Private Sources: $58,000
Donations From Private Sources: $54,000
Fines and Forfeits: $48,000
Sale of Property: $35,000
Interest Earnings: $8,000
Interest Earnings: $7,000
- Other Funds - Cash and Securities: $2,698,000
Cash and Securities: $2,609,000
- State Intergovernmental - Health and Hospitals: $116,000
Other: $115,000
Health and Hospitals: $104,000
General Local Government Support: $73,000
Other: $67,000
General Local Government Support: $51,000
- Tax - Property: $1,191,000
Property: $1,176,000
Other: $32,000
Other: $30,000
Other License: $28,000
Other License: $14,000
- Total Salaries and Wages: $1,239,000
Supplemental Security Income (SSI) in 2006:
- Total number of recipients: 808
- Number of aged recipients: 48
- Number of blind and disabled recipients: 760
- Number of recipients under 18: 67
- Number of recipients between 18 and 64: 580
- Number of recipients older than 64: 161
- Number of recipients also receiving OASDI: 276
- Amount of payments (thousands of dollars): 387
| Most common first names in Clay County, WV among deceased individuals | ||
| Name | Count | Lived (average) |
|---|---|---|
| William | 22 | 74.8 years |
| James | 19 | 69.5 years |
| John | 15 | 74.1 years |
| Mary | 12 | 82.9 years |
| Russell | 9 | 65.7 years |
| Arthur | 7 | 75.7 years |
| Cecil | 7 | 72.3 years |
| Roy | 7 | 82.5 years |
| Alice | 7 | 67.4 years |
| Ethel | 7 | 82.8 years |
| Most common last names in Clay County, WV among deceased individuals | ||
| Last name | Count | Lived (average) |
|---|---|---|
| Davis | 16 | 76.6 years |
| Mullins | 16 | 76.3 years |
| Williams | 15 | 67.9 years |
| Salisbury | 14 | 67.9 years |
| Adkins | 14 | 68.9 years |
| Butcher | 13 | 65.1 years |
| Wilson | 13 | 78.4 years |
| Moore | 13 | 70.2 years |
| Hamrick | 12 | 70.9 years |
| Ramsey | 12 | 68.8 years |
Businesses in Clay County, WV
- H&R Block: 1
- Rite Aid: 1
- Subway: 1
Clay County on our top lists:
- #59 on the list of "Top 101 counties with highest percentage of residents voting for 3rd party candidates in the 2012 Presidential Election"
- #69 on the list of "Top 101 counties with the smallest number of children under 18 without health insurance coverage in 2000"
- #90 on the list of "Top 101 counties with the smallest number of people without health insurance coverage in 2000"