Dale City, Virginia Submit your own pictures of this place and show them to the world
OSM Map
General Map
Google Map
MSN Map
OSM Map
General Map
Google Map
MSN Map
OSM Map
General Map
Google Map
MSN Map
OSM Map
General Map
Google Map
MSN Map
Please wait while loading the map...
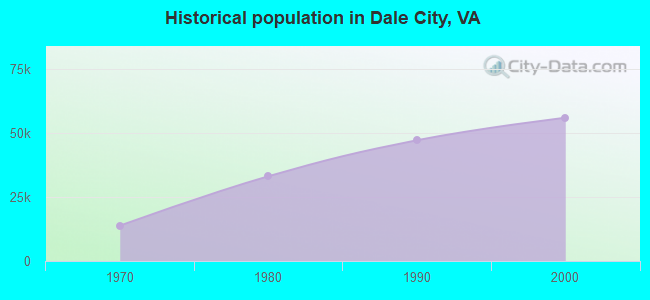
Population in 2022: 66,140 (100% urban, 0% rural). Population change since 2000: +18.2%Males: 34,493 Females: 31,647
March 2022 cost of living index in Dale City: 160.4 (very high, U.S. average is 100) Percentage of residents living in poverty in 2022: 11.4%for White Non-Hispanic residents , 6.9% for Black residents , 10.1% for Hispanic or Latino residents , 14.2% for other race residents , 4.9% for two or more races residents )
Profiles of local businesses
Business Search - 14 Million verified businesses
Data:
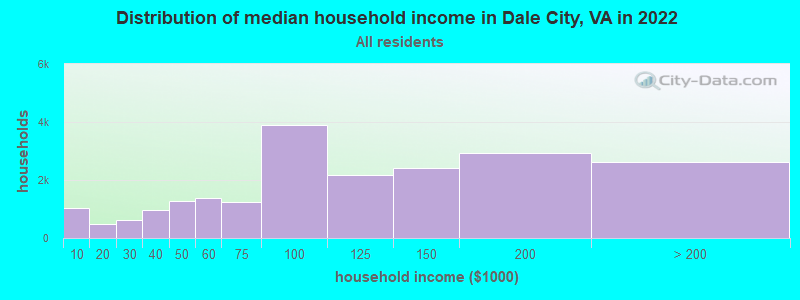
Median household income ($)
Median household income (% change since 2000)
Household income diversity
Ratio of average income to average house value (%)
Ratio of average income to average rent
Median household income ($) - White
Median household income ($) - Black or African American
Median household income ($) - Asian
Median household income ($) - Hispanic or Latino
Median household income ($) - American Indian and Alaska Native
Median household income ($) - Multirace
Median household income ($) - Other Race
Median household income for houses/condos with a mortgage ($)
Median household income for apartments without a mortgage ($)
Races - White alone (%)
Races - White alone (% change since 2000)
Races - Black alone (%)
Races - Black alone (% change since 2000)
Races - American Indian alone (%)
Races - American Indian alone (% change since 2000)
Races - Asian alone (%)
Races - Asian alone (% change since 2000)
Races - Hispanic (%)
Races - Hispanic (% change since 2000)
Races - Native Hawaiian and Other Pacific Islander alone (%)
Races - Native Hawaiian and Other Pacific Islander alone (% change since 2000)
Races - Two or more races (%)
Races - Two or more races (% change since 2000)
Races - Other race alone (%)
Races - Other race alone (% change since 2000)
Racial diversity
Unemployment (%)
Unemployment (% change since 2000)
Unemployment (%) - White
Unemployment (%) - Black or African American
Unemployment (%) - Asian
Unemployment (%) - Hispanic or Latino
Unemployment (%) - American Indian and Alaska Native
Unemployment (%) - Multirace
Unemployment (%) - Other Race
Population density (people per square mile)
Population - Males (%)
Population - Females (%)
Population - Males (%) - White
Population - Males (%) - Black or African American
Population - Males (%) - Asian
Population - Males (%) - Hispanic or Latino
Population - Males (%) - American Indian and Alaska Native
Population - Males (%) - Multirace
Population - Males (%) - Other Race
Population - Females (%) - White
Population - Females (%) - Black or African American
Population - Females (%) - Asian
Population - Females (%) - Hispanic or Latino
Population - Females (%) - American Indian and Alaska Native
Population - Females (%) - Multirace
Population - Females (%) - Other Race
Coronavirus confirmed cases (Apr 27, 2024)
Deaths caused by coronavirus (Apr 27, 2024)
Coronavirus confirmed cases (per 100k population) (Apr 27, 2024)
Deaths caused by coronavirus (per 100k population) (Apr 27, 2024)
Daily increase in number of cases (Apr 27, 2024)
Weekly increase in number of cases (Apr 27, 2024)
Cases doubled (in days) (Apr 27, 2024)
Hospitalized patients (Apr 18, 2022)
Negative test results (Apr 18, 2022)
Total test results (Apr 18, 2022)
COVID Vaccine doses distributed (per 100k population) (Sep 19, 2023)
COVID Vaccine doses administered (per 100k population) (Sep 19, 2023)
COVID Vaccine doses distributed (Sep 19, 2023)
COVID Vaccine doses administered (Sep 19, 2023)
Likely homosexual households (%)
Likely homosexual households (% change since 2000)
Likely homosexual households - Lesbian couples (%)
Likely homosexual households - Lesbian couples (% change since 2000)
Likely homosexual households - Gay men (%)
Likely homosexual households - Gay men (% change since 2000)
Cost of living index
Median gross rent ($)
Median contract rent ($)
Median monthly housing costs ($)
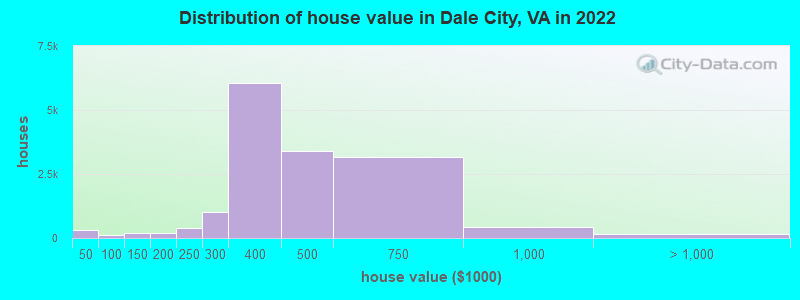
Median house or condo value ($)
Median house or condo value ($ change since 2000)
Mean house or condo value by units in structure - 1, detached ($)
Mean house or condo value by units in structure - 1, attached ($)
Mean house or condo value by units in structure - 2 ($)
Mean house or condo value by units in structure by units in structure - 3 or 4 ($)
Mean house or condo value by units in structure - 5 or more ($)
Mean house or condo value by units in structure - Boat, RV, van, etc. ($)
Mean house or condo value by units in structure - Mobile home ($)
Median house or condo value ($) - White
Median house or condo value ($) - Black or African American
Median house or condo value ($) - Asian
Median house or condo value ($) - Hispanic or Latino
Median house or condo value ($) - American Indian and Alaska Native
Median house or condo value ($) - Multirace
Median house or condo value ($) - Other Race
Median resident age
Resident age diversity
Median resident age - Males
Median resident age - Females
Median resident age - White
Median resident age - Black or African American
Median resident age - Asian
Median resident age - Hispanic or Latino
Median resident age - American Indian and Alaska Native
Median resident age - Multirace
Median resident age - Other Race
Median resident age - Males - White
Median resident age - Males - Black or African American
Median resident age - Males - Asian
Median resident age - Males - Hispanic or Latino
Median resident age - Males - American Indian and Alaska Native
Median resident age - Males - Multirace
Median resident age - Males - Other Race
Median resident age - Females - White
Median resident age - Females - Black or African American
Median resident age - Females - Asian
Median resident age - Females - Hispanic or Latino
Median resident age - Females - American Indian and Alaska Native
Median resident age - Females - Multirace
Median resident age - Females - Other Race
Commute - mean travel time to work (minutes)
Travel time to work - Less than 5 minutes (%)
Travel time to work - Less than 5 minutes (% change since 2000)
Travel time to work - 5 to 9 minutes (%)
Travel time to work - 5 to 9 minutes (% change since 2000)
Travel time to work - 10 to 19 minutes (%)
Travel time to work - 10 to 19 minutes (% change since 2000)
Travel time to work - 20 to 29 minutes (%)
Travel time to work - 20 to 29 minutes (% change since 2000)
Travel time to work - 30 to 39 minutes (%)
Travel time to work - 30 to 39 minutes (% change since 2000)
Travel time to work - 40 to 59 minutes (%)
Travel time to work - 40 to 59 minutes (% change since 2000)
Travel time to work - 60 to 89 minutes (%)
Travel time to work - 60 to 89 minutes (% change since 2000)
Travel time to work - 90 or more minutes (%)
Travel time to work - 90 or more minutes (% change since 2000)
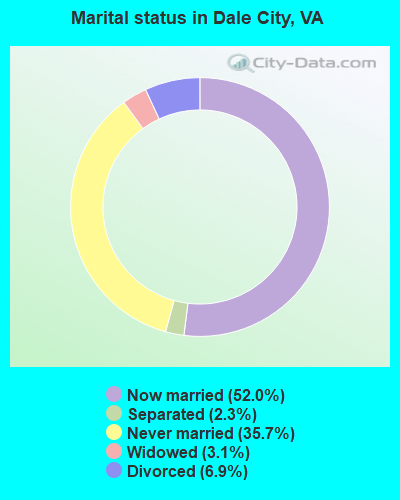
Marital status - Never married (%)
Marital status - Now married (%)
Marital status - Separated (%)
Marital status - Widowed (%)
Marital status - Divorced (%)
Median family income ($)
Median family income (% change since 2000)
Median non-family income ($)
Median non-family income (% change since 2000)
Median per capita income ($)
Median per capita income (% change since 2000)
Median family income ($) - White
Median family income ($) - Black or African American
Median family income ($) - Asian
Median family income ($) - Hispanic or Latino
Median family income ($) - American Indian and Alaska Native
Median family income ($) - Multirace
Median family income ($) - Other Race
Median year house/condo built
Median year apartment built
Year house built - Built 2005 or later (%)
Year house built - Built 2000 to 2004 (%)
Year house built - Built 1990 to 1999 (%)
Year house built - Built 1980 to 1989 (%)
Year house built - Built 1970 to 1979 (%)
Year house built - Built 1960 to 1969 (%)
Year house built - Built 1950 to 1959 (%)
Year house built - Built 1940 to 1949 (%)
Year house built - Built 1939 or earlier (%)
Average household size
Household density (households per square mile)
Average household size - White
Average household size - Black or African American
Average household size - Asian
Average household size - Hispanic or Latino
Average household size - American Indian and Alaska Native
Average household size - Multirace
Average household size - Other Race
Occupied housing units (%)
Vacant housing units (%)
Owner occupied housing units (%)
Renter occupied housing units (%)
Vacancy status - For rent (%)
Vacancy status - For sale only (%)
Vacancy status - Rented or sold, not occupied (%)
Vacancy status - For seasonal, recreational, or occasional use (%)
Vacancy status - For migrant workers (%)
Vacancy status - Other vacant (%)
Residents with income below the poverty level (%)
Residents with income below 50% of the poverty level (%)
Children below poverty level (%)
Poor families by family type - Married-couple family (%)
Poor families by family type - Male, no wife present (%)
Poor families by family type - Female, no husband present (%)
Poverty status for native-born residents (%)
Poverty status for foreign-born residents (%)
Poverty among high school graduates not in families (%)
Poverty among people who did not graduate high school not in families (%)
Residents with income below the poverty level (%) - White
Residents with income below the poverty level (%) - Black or African American
Residents with income below the poverty level (%) - Asian
Residents with income below the poverty level (%) - Hispanic or Latino
Residents with income below the poverty level (%) - American Indian and Alaska Native
Residents with income below the poverty level (%) - Multirace
Residents with income below the poverty level (%) - Other Race
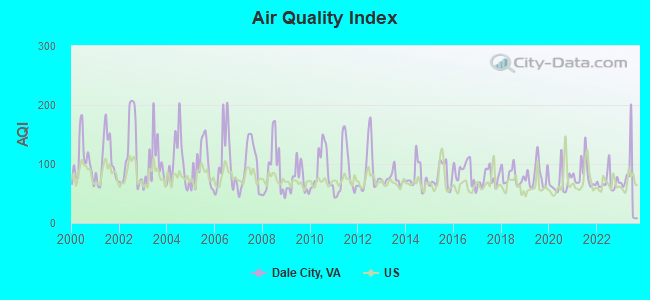
Air pollution - Air Quality Index (AQI)
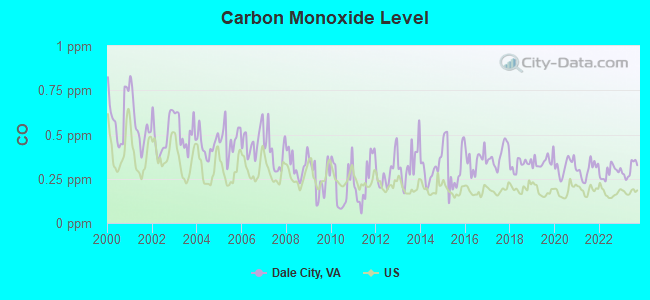
Air pollution - CO
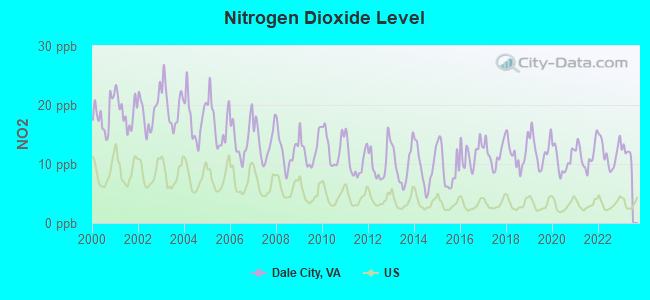
Air pollution - NO2
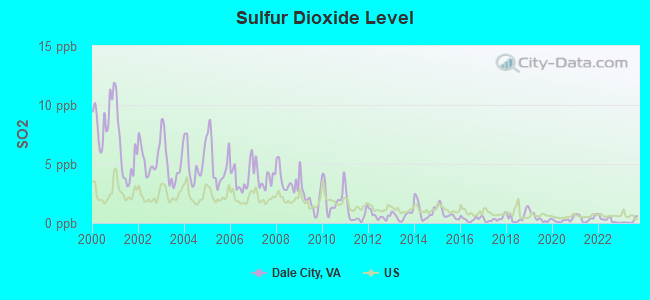
Air pollution - SO2
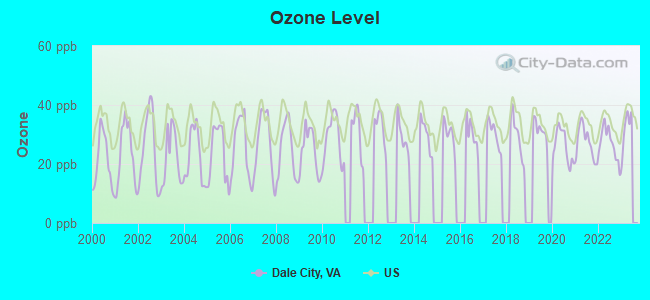
Air pollution - Ozone
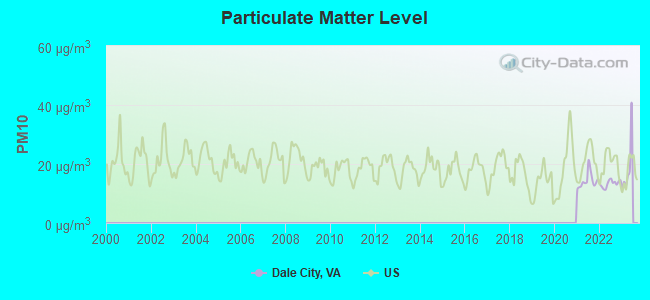
Air pollution - PM10
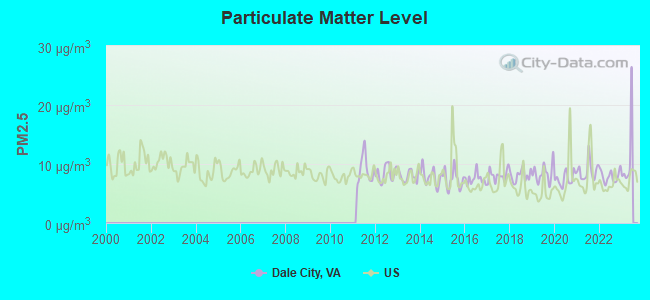
Air pollution - PM25
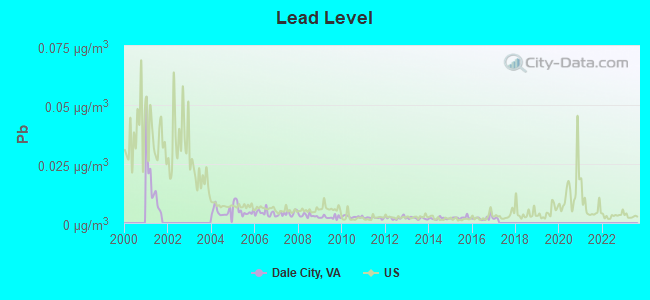
Air pollution - Pb
Crime - Murders per 100,000 population
Crime - Rapes per 100,000 population
Crime - Robberies per 100,000 population
Crime - Assaults per 100,000 population
Crime - Burglaries per 100,000 population
Crime - Thefts per 100,000 population
Crime - Auto thefts per 100,000 population
Crime - Arson per 100,000 population
Crime - City-data.com crime index
Crime - Violent crime index
Crime - Property crime index
Crime - Murders per 100,000 population (5 year average)
Crime - Rapes per 100,000 population (5 year average)
Crime - Robberies per 100,000 population (5 year average)
Crime - Assaults per 100,000 population (5 year average)
Crime - Burglaries per 100,000 population (5 year average)
Crime - Thefts per 100,000 population (5 year average)
Crime - Auto thefts per 100,000 population (5 year average)
Crime - Arson per 100,000 population (5 year average)
Crime - City-data.com crime index (5 year average)
Crime - Violent crime index (5 year average)
Crime - Property crime index (5 year average)
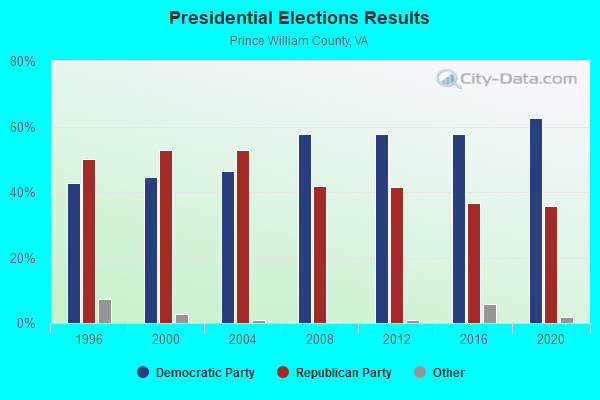
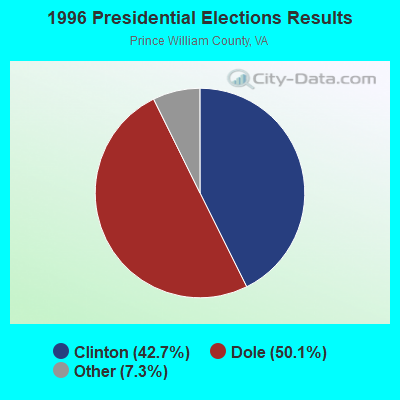
1996 Presidential Elections Results (%) - Democratic Party (Clinton)
1996 Presidential Elections Results (%) - Republican Party (Dole)
1996 Presidential Elections Results (%) - Other
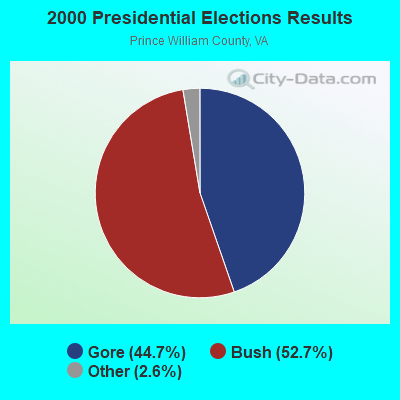
2000 Presidential Elections Results (%) - Democratic Party (Gore)
2000 Presidential Elections Results (%) - Republican Party (Bush)
2000 Presidential Elections Results (%) - Other
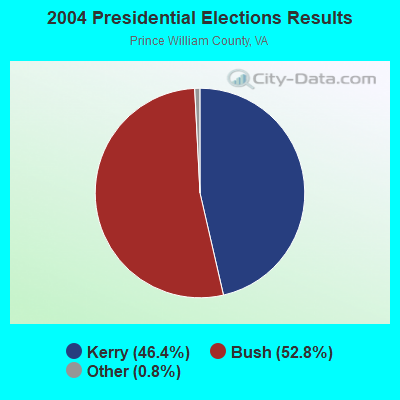
2004 Presidential Elections Results (%) - Democratic Party (Kerry)
2004 Presidential Elections Results (%) - Republican Party (Bush)
2004 Presidential Elections Results (%) - Other
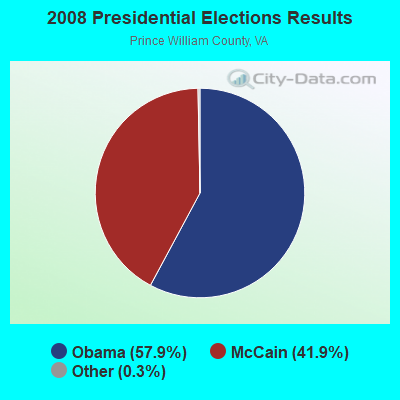
2008 Presidential Elections Results (%) - Democratic Party (Obama)
2008 Presidential Elections Results (%) - Republican Party (McCain)
2008 Presidential Elections Results (%) - Other
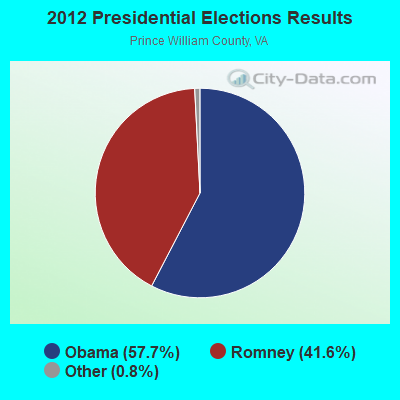
2012 Presidential Elections Results (%) - Democratic Party (Obama)
2012 Presidential Elections Results (%) - Republican Party (Romney)
2012 Presidential Elections Results (%) - Other
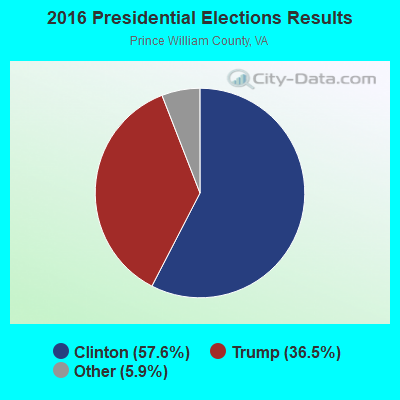
2016 Presidential Elections Results (%) - Democratic Party (Clinton)
2016 Presidential Elections Results (%) - Republican Party (Trump)
2016 Presidential Elections Results (%) - Other
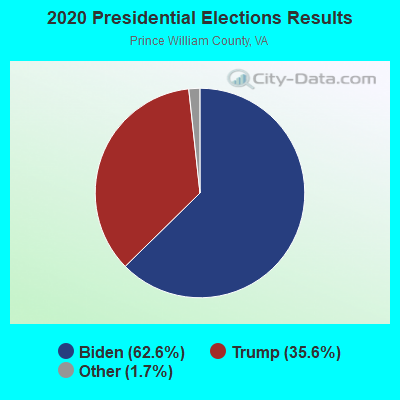
2020 Presidential Elections Results (%) - Democratic Party (Biden)
2020 Presidential Elections Results (%) - Republican Party (Trump)
2020 Presidential Elections Results (%) - Other
Ancestries Reported - Arab (%)
Ancestries Reported - Czech (%)
Ancestries Reported - Danish (%)
Ancestries Reported - Dutch (%)
Ancestries Reported - English (%)
Ancestries Reported - French (%)
Ancestries Reported - French Canadian (%)
Ancestries Reported - German (%)
Ancestries Reported - Greek (%)
Ancestries Reported - Hungarian (%)
Ancestries Reported - Irish (%)
Ancestries Reported - Italian (%)
Ancestries Reported - Lithuanian (%)
Ancestries Reported - Norwegian (%)
Ancestries Reported - Polish (%)
Ancestries Reported - Portuguese (%)
Ancestries Reported - Russian (%)
Ancestries Reported - Scotch-Irish (%)
Ancestries Reported - Scottish (%)
Ancestries Reported - Slovak (%)
Ancestries Reported - Subsaharan African (%)
Ancestries Reported - Swedish (%)
Ancestries Reported - Swiss (%)
Ancestries Reported - Ukrainian (%)
Ancestries Reported - United States (%)
Ancestries Reported - Welsh (%)
Ancestries Reported - West Indian (%)
Ancestries Reported - Other (%)
Educational Attainment - No schooling completed (%)
Educational Attainment - Less than high school (%)
Educational Attainment - High school or equivalent (%)
Educational Attainment - Less than 1 year of college (%)
Educational Attainment - 1 or more years of college (%)
Educational Attainment - Associate degree (%)
Educational Attainment - Bachelor's degree (%)
Educational Attainment - Master's degree (%)
Educational Attainment - Professional school degree (%)
Educational Attainment - Doctorate degree (%)
School Enrollment - Nursery, preschool (%)
School Enrollment - Kindergarten (%)
School Enrollment - Grade 1 to 4 (%)
School Enrollment - Grade 5 to 8 (%)
School Enrollment - Grade 9 to 12 (%)
School Enrollment - College undergrad (%)
School Enrollment - Graduate or professional (%)
School Enrollment - Not enrolled in school (%)
School enrollment - Public schools (%)
School enrollment - Private schools (%)
School enrollment - Not enrolled (%)
Median number of rooms in houses and condos
Median number of rooms in apartments
Housing units lacking complete plumbing facilities (%)
Housing units lacking complete kitchen facilities (%)
Density of houses
Urban houses (%)
Rural houses (%)
Households with people 60 years and over (%)
Households with people 65 years and over (%)
Households with people 75 years and over (%)
Households with one or more nonrelatives (%)
Households with no nonrelatives (%)
Population in households (%)
Family households (%)
Nonfamily households (%)
Population in families (%)
Family households with own children (%)
Median number of bedrooms in owner occupied houses
Mean number of bedrooms in owner occupied houses
Median number of bedrooms in renter occupied houses
Mean number of bedrooms in renter occupied houses
Median number of vehichles in owner occupied houses
Mean number of vehichles in owner occupied houses
Median number of vehichles in renter occupied houses
Mean number of vehichles in renter occupied houses
Mortgage status - with mortgage (%)
Mortgage status - with second mortgage (%)
Mortgage status - with home equity loan (%)
Mortgage status - with both second mortgage and home equity loan (%)
Mortgage status - without a mortgage (%)
Average family size
Average family size - White
Average family size - Black or African American
Average family size - Asian
Average family size - Hispanic or Latino
Average family size - American Indian and Alaska Native
Average family size - Multirace
Average family size - Other Race
Geographical mobility - Same house 1 year ago (%)
Geographical mobility - Moved within same county (%)
Geographical mobility - Moved from different county within same state (%)
Geographical mobility - Moved from different state (%)
Geographical mobility - Moved from abroad (%)
Place of birth - Born in state of residence (%)
Place of birth - Born in other state (%)
Place of birth - Native, outside of US (%)
Place of birth - Foreign born (%)
Housing units in structures - 1, detached (%)
Housing units in structures - 1, attached (%)
Housing units in structures - 2 (%)
Housing units in structures - 3 or 4 (%)
Housing units in structures - 5 to 9 (%)
Housing units in structures - 10 to 19 (%)
Housing units in structures - 20 to 49 (%)
Housing units in structures - 50 or more (%)
Housing units in structures - Mobile home (%)
Housing units in structures - Boat, RV, van, etc. (%)
House/condo owner moved in on average (years ago)
Renter moved in on average (years ago)
Year householder moved into unit - Moved in 1999 to March 2000 (%)
Year householder moved into unit - Moved in 1995 to 1998 (%)
Year householder moved into unit - Moved in 1990 to 1994 (%)
Year householder moved into unit - Moved in 1980 to 1989 (%)
Year householder moved into unit - Moved in 1970 to 1979 (%)
Year householder moved into unit - Moved in 1969 or earlier (%)
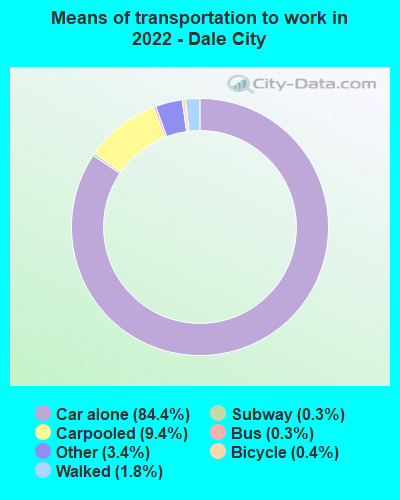
Means of transportation to work - Drove car alone (%)
Means of transportation to work - Carpooled (%)
Means of transportation to work - Public transportation (%)
Means of transportation to work - Bus or trolley bus (%)
Means of transportation to work - Streetcar or trolley car (%)
Means of transportation to work - Subway or elevated (%)
Means of transportation to work - Railroad (%)
Means of transportation to work - Ferryboat (%)
Means of transportation to work - Taxicab (%)
Means of transportation to work - Motorcycle (%)
Means of transportation to work - Bicycle (%)
Means of transportation to work - Walked (%)
Means of transportation to work - Other means (%)
Working at home (%)
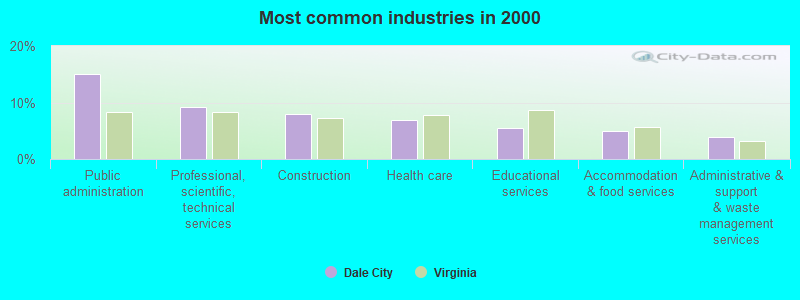
Industry diversity
Most Common Industries - Agriculture, forestry, fishing and hunting, and mining (%)
Most Common Industries - Agriculture, forestry, fishing and hunting (%)
Most Common Industries - Mining, quarrying, and oil and gas extraction (%)
Most Common Industries - Construction (%)
Most Common Industries - Manufacturing (%)
Most Common Industries - Wholesale trade (%)
Most Common Industries - Retail trade (%)
Most Common Industries - Transportation and warehousing, and utilities (%)
Most Common Industries - Transportation and warehousing (%)
Most Common Industries - Utilities (%)
Most Common Industries - Information (%)
Most Common Industries - Finance and insurance, and real estate and rental and leasing (%)
Most Common Industries - Finance and insurance (%)
Most Common Industries - Real estate and rental and leasing (%)
Most Common Industries - Professional, scientific, and management, and administrative and waste management services (%)
Most Common Industries - Professional, scientific, and technical services (%)
Most Common Industries - Management of companies and enterprises (%)
Most Common Industries - Administrative and support and waste management services (%)
Most Common Industries - Educational services, and health care and social assistance (%)
Most Common Industries - Educational services (%)
Most Common Industries - Health care and social assistance (%)
Most Common Industries - Arts, entertainment, and recreation, and accommodation and food services (%)
Most Common Industries - Arts, entertainment, and recreation (%)
Most Common Industries - Accommodation and food services (%)
Most Common Industries - Other services, except public administration (%)
Most Common Industries - Public administration (%)
Occupation diversity
Most Common Occupations - Management, business, science, and arts occupations (%)
Most Common Occupations - Management, business, and financial occupations (%)
Most Common Occupations - Management occupations (%)
Most Common Occupations - Business and financial operations occupations (%)
Most Common Occupations - Computer, engineering, and science occupations (%)
Most Common Occupations - Computer and mathematical occupations (%)
Most Common Occupations - Architecture and engineering occupations (%)
Most Common Occupations - Life, physical, and social science occupations (%)
Most Common Occupations - Education, legal, community service, arts, and media occupations (%)
Most Common Occupations - Community and social service occupations (%)
Most Common Occupations - Legal occupations (%)
Most Common Occupations - Education, training, and library occupations (%)
Most Common Occupations - Arts, design, entertainment, sports, and media occupations (%)
Most Common Occupations - Healthcare practitioners and technical occupations (%)
Most Common Occupations - Health diagnosing and treating practitioners and other technical occupations (%)
Most Common Occupations - Health technologists and technicians (%)
Most Common Occupations - Service occupations (%)
Most Common Occupations - Healthcare support occupations (%)
Most Common Occupations - Protective service occupations (%)
Most Common Occupations - Fire fighting and prevention, and other protective service workers including supervisors (%)
Most Common Occupations - Law enforcement workers including supervisors (%)
Most Common Occupations - Food preparation and serving related occupations (%)
Most Common Occupations - Building and grounds cleaning and maintenance occupations (%)
Most Common Occupations - Personal care and service occupations (%)
Most Common Occupations - Sales and office occupations (%)
Most Common Occupations - Sales and related occupations (%)
Most Common Occupations - Office and administrative support occupations (%)
Most Common Occupations - Natural resources, construction, and maintenance occupations (%)
Most Common Occupations - Farming, fishing, and forestry occupations (%)
Most Common Occupations - Construction and extraction occupations (%)
Most Common Occupations - Installation, maintenance, and repair occupations (%)
Most Common Occupations - Production, transportation, and material moving occupations (%)
Most Common Occupations - Production occupations (%)
Most Common Occupations - Transportation occupations (%)
Most Common Occupations - Material moving occupations (%)
People in Group quarters - Institutionalized population (%)
People in Group quarters - Correctional institutions (%)
People in Group quarters - Federal prisons and detention centers (%)
People in Group quarters - Halfway houses (%)
People in Group quarters - Local jails and other confinement facilities (including police lockups) (%)
People in Group quarters - Military disciplinary barracks (%)
People in Group quarters - State prisons (%)
People in Group quarters - Other types of correctional institutions (%)
People in Group quarters - Nursing homes (%)
People in Group quarters - Hospitals/wards, hospices, and schools for the handicapped (%)
People in Group quarters - Hospitals/wards and hospices for chronically ill (%)
People in Group quarters - Hospices or homes for chronically ill (%)
People in Group quarters - Military hospitals or wards for chronically ill (%)
People in Group quarters - Other hospitals or wards for chronically ill (%)
People in Group quarters - Hospitals or wards for drug/alcohol abuse (%)
People in Group quarters - Mental (Psychiatric) hospitals or wards (%)
People in Group quarters - Schools, hospitals, or wards for the mentally retarded (%)
People in Group quarters - Schools, hospitals, or wards for the physically handicapped (%)
People in Group quarters - Institutions for the deaf (%)
People in Group quarters - Institutions for the blind (%)
People in Group quarters - Orthopedic wards and institutions for the physically handicapped (%)
People in Group quarters - Wards in general hospitals for patients who have no usual home elsewhere (%)
People in Group quarters - Wards in military hospitals for patients who have no usual home elsewhere (%)
People in Group quarters - Juvenile institutions (%)
People in Group quarters - Long-term care (%)
People in Group quarters - Homes for abused, dependent, and neglected children (%)
People in Group quarters - Residential treatment centers for emotionally disturbed children (%)
People in Group quarters - Training schools for juvenile delinquents (%)
People in Group quarters - Short-term care, detention or diagnostic centers for delinquent children (%)
People in Group quarters - Type of juvenile institution unknown (%)
People in Group quarters - Noninstitutionalized population (%)
People in Group quarters - College dormitories (includes college quarters off campus) (%)
People in Group quarters - Military quarters (%)
People in Group quarters - On base (%)
People in Group quarters - Barracks, unaccompanied personnel housing (UPH), (Enlisted/Officer), ;and similar group living quarters for military personnel (%)
People in Group quarters - Transient quarters for temporary residents (%)
People in Group quarters - Military ships (%)
People in Group quarters - Group homes (%)
People in Group quarters - Homes or halfway houses for drug/alcohol abuse (%)
People in Group quarters - Homes for the mentally ill (%)
People in Group quarters - Homes for the mentally retarded (%)
People in Group quarters - Homes for the physically handicapped (%)
People in Group quarters - Other group homes (%)
People in Group quarters - Religious group quarters (%)
People in Group quarters - Dormitories (%)
People in Group quarters - Agriculture workers' dormitories on farms (%)
People in Group quarters - Job Corps and vocational training facilities (%)
People in Group quarters - Other workers' dormitories (%)
People in Group quarters - Crews of maritime vessels (%)
People in Group quarters - Other nonhousehold living situations (%)
People in Group quarters - Other noninstitutional group quarters (%)
Residents speaking English at home (%)
Residents speaking English at home - Born in the United States (%)
Residents speaking English at home - Native, born elsewhere (%)
Residents speaking English at home - Foreign born (%)
Residents speaking Spanish at home (%)
Residents speaking Spanish at home - Born in the United States (%)
Residents speaking Spanish at home - Native, born elsewhere (%)
Residents speaking Spanish at home - Foreign born (%)
Residents speaking other language at home (%)
Residents speaking other language at home - Born in the United States (%)
Residents speaking other language at home - Native, born elsewhere (%)
Residents speaking other language at home - Foreign born (%)
Class of Workers - Employee of private company (%)
Class of Workers - Self-employed in own incorporated business (%)
Class of Workers - Private not-for-profit wage and salary workers (%)
Class of Workers - Local government workers (%)
Class of Workers - State government workers (%)
Class of Workers - Federal government workers (%)
Class of Workers - Self-employed workers in own not incorporated business and Unpaid family workers (%)
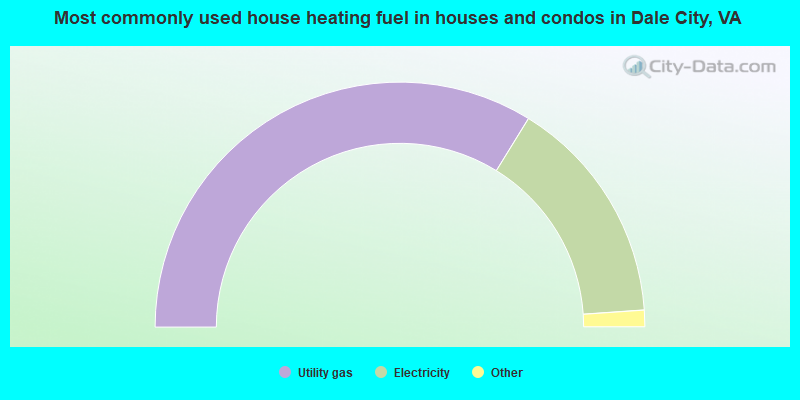
House heating fuel used in houses and condos - Utility gas (%)
House heating fuel used in houses and condos - Bottled, tank, or LP gas (%)
House heating fuel used in houses and condos - Electricity (%)
House heating fuel used in houses and condos - Fuel oil, kerosene, etc. (%)
House heating fuel used in houses and condos - Coal or coke (%)
House heating fuel used in houses and condos - Wood (%)
House heating fuel used in houses and condos - Solar energy (%)
House heating fuel used in houses and condos - Other fuel (%)
House heating fuel used in houses and condos - No fuel used (%)
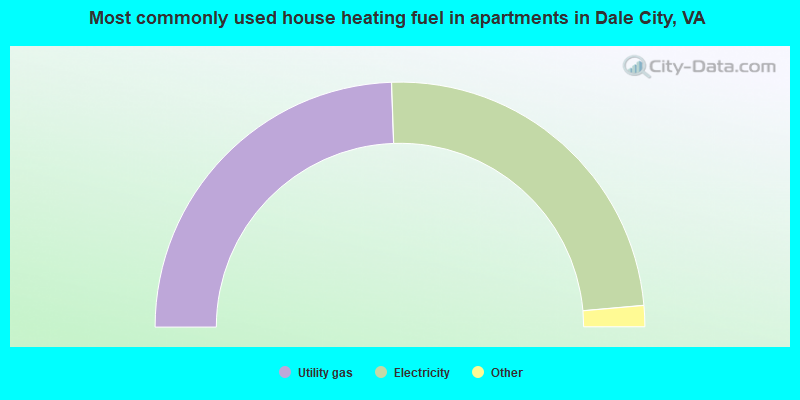
House heating fuel used in apartments - Utility gas (%)
House heating fuel used in apartments - Bottled, tank, or LP gas (%)
House heating fuel used in apartments - Electricity (%)
House heating fuel used in apartments - Fuel oil, kerosene, etc. (%)
House heating fuel used in apartments - Coal or coke (%)
House heating fuel used in apartments - Wood (%)
House heating fuel used in apartments - Solar energy (%)
House heating fuel used in apartments - Other fuel (%)
House heating fuel used in apartments - No fuel used (%)
Armed forces status - In Armed Forces (%)
Armed forces status - Civilian (%)
Armed forces status - Civilian - Veteran (%)
Armed forces status - Civilian - Nonveteran (%)
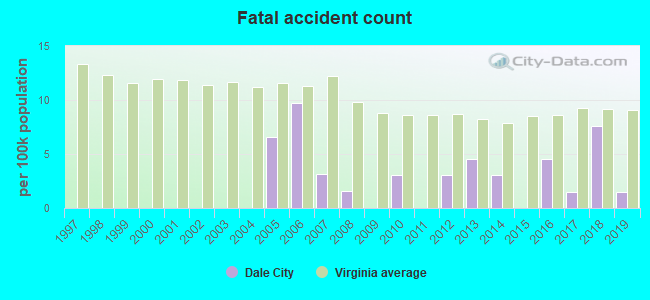
Fatal accidents locations in years 2005-2021
Fatal accidents locations in 2005
Fatal accidents locations in 2006
Fatal accidents locations in 2007
Fatal accidents locations in 2008
Fatal accidents locations in 2009
Fatal accidents locations in 2010
Fatal accidents locations in 2011
Fatal accidents locations in 2012
Fatal accidents locations in 2013
Fatal accidents locations in 2014
Fatal accidents locations in 2015
Fatal accidents locations in 2016
Fatal accidents locations in 2017
Fatal accidents locations in 2018
Fatal accidents locations in 2019
Fatal accidents locations in 2020
Fatal accidents locations in 2021
Alcohol use - People drinking some alcohol every month (%)
Alcohol use - People not drinking at all (%)
Alcohol use - Average days/month drinking alcohol
Alcohol use - Average drinks/week
Alcohol use - Average days/year people drink much
Audiometry - Average condition of hearing (%)
Audiometry - People that can hear a whisper from across a quiet room (%)
Audiometry - People that can hear normal voice from across a quiet room (%)
Audiometry - Ears ringing, roaring, buzzing (%)
Audiometry - Had a job exposure to loud noise (%)
Audiometry - Had off-work exposure to loud noise (%)
Blood Pressure & Cholesterol - Has high blood pressure (%)
Blood Pressure & Cholesterol - Checking blood pressure at home (%)
Blood Pressure & Cholesterol - Frequently checking blood cholesterol (%)
Blood Pressure & Cholesterol - Has high cholesterol level (%)
Consumer Behavior - Money monthly spent on food at supermarket/grocery store
Consumer Behavior - Money monthly spent on food at other stores
Consumer Behavior - Money monthly spent on eating out
Consumer Behavior - Money monthly spent on carryout/delivered foods
Consumer Behavior - Income spent on food at supermarket/grocery store (%)
Consumer Behavior - Income spent on food at other stores (%)
Consumer Behavior - Income spent on eating out (%)
Consumer Behavior - Income spent on carryout/delivered foods (%)
Current Health Status - General health condition (%)
Current Health Status - Blood donors (%)
Current Health Status - Has blood ever tested for HIV virus (%)
Current Health Status - Left-handed people (%)
Dermatology - People using sunscreen (%)
Diabetes - Diabetics (%)
Diabetes - Had a blood test for high blood sugar (%)
Diabetes - People taking insulin (%)
Diet Behavior & Nutrition - Diet health (%)
Diet Behavior & Nutrition - Milk product consumption (# of products/month)
Diet Behavior & Nutrition - Meals not home prepared (#/week)
Diet Behavior & Nutrition - Meals from fast food or pizza place (#/week)
Diet Behavior & Nutrition - Ready-to-eat foods (#/month)
Diet Behavior & Nutrition - Frozen meals/pizza (#/month)
Drug Use - People that ever used marijuana or hashish (%)
Drug Use - Ever used hard drugs (%)
Drug Use - Ever used any form of cocaine (%)
Drug Use - Ever used heroin (%)
Drug Use - Ever used methamphetamine (%)
Health Insurance - People covered by health insurance (%)
Kidney Conditions-Urology - Avg. # of times urinating at night
Medical Conditions - People with asthma (%)
Medical Conditions - People with anemia (%)
Medical Conditions - People with psoriasis (%)
Medical Conditions - People with overweight (%)
Medical Conditions - Elderly people having difficulties in thinking or remembering (%)
Medical Conditions - People who ever received blood transfusion (%)
Medical Conditions - People having trouble seeing even with glass/contacts (%)
Medical Conditions - People with arthritis (%)
Medical Conditions - People with gout (%)
Medical Conditions - People with congestive heart failure (%)
Medical Conditions - People with coronary heart disease (%)
Medical Conditions - People with angina pectoris (%)
Medical Conditions - People who ever had heart attack (%)
Medical Conditions - People who ever had stroke (%)
Medical Conditions - People with emphysema (%)
Medical Conditions - People with thyroid problem (%)
Medical Conditions - People with chronic bronchitis (%)
Medical Conditions - People with any liver condition (%)
Medical Conditions - People who ever had cancer or malignancy (%)
Mental Health - People who have little interest in doing things (%)
Mental Health - People feeling down, depressed, or hopeless (%)
Mental Health - People who have trouble sleeping or sleeping too much (%)
Mental Health - People feeling tired or having little energy (%)
Mental Health - People with poor appetite or overeating (%)
Mental Health - People feeling bad about themself (%)
Mental Health - People who have trouble concentrating on things (%)
Mental Health - People moving or speaking slowly or too fast (%)
Mental Health - People having thoughts they would be better off dead (%)
Oral Health - Average years since last visit a dentist
Oral Health - People embarrassed because of mouth (%)
Oral Health - People with gum disease (%)
Oral Health - General health of teeth and gums (%)
Oral Health - Average days a week using dental floss/device
Oral Health - Average days a week using mouthwash for dental problem
Oral Health - Average number of teeth
Pesticide Use - Households using pesticides to control insects (%)
Pesticide Use - Households using pesticides to kill weeds (%)
Physical Activity - People doing vigorous-intensity work activities (%)
Physical Activity - People doing moderate-intensity work activities (%)
Physical Activity - People walking or bicycling (%)
Physical Activity - People doing vigorous-intensity recreational activities (%)
Physical Activity - People doing moderate-intensity recreational activities (%)
Physical Activity - Average hours a day doing sedentary activities
Physical Activity - Average hours a day watching TV or videos
Physical Activity - Average hours a day using computer
Physical Functioning - People having limitations keeping them from working (%)
Physical Functioning - People limited in amount of work they can do (%)
Physical Functioning - People that need special equipment to walk (%)
Physical Functioning - People experiencing confusion/memory problems (%)
Physical Functioning - People requiring special healthcare equipment (%)
Prescription Medications - Average number of prescription medicines taking
Preventive Aspirin Use - Adults 40+ taking low-dose aspirin (%)
Reproductive Health - Vaginal deliveries (%)
Reproductive Health - Cesarean deliveries (%)
Reproductive Health - Deliveries resulted in a live birth (%)
Reproductive Health - Pregnancies resulted in a delivery (%)
Reproductive Health - Women breastfeeding newborns (%)
Reproductive Health - Women that had a hysterectomy (%)
Reproductive Health - Women that had both ovaries removed (%)
Reproductive Health - Women that have ever taken birth control pills (%)
Reproductive Health - Women taking birth control pills (%)
Reproductive Health - Women that have ever used Depo-Provera or injectables (%)
Reproductive Health - Women that have ever used female hormones (%)
Sexual Behavior - People 18+ that ever had sex (vaginal, anal, or oral) (%)
Sexual Behavior - Males 18+ that ever had vaginal sex with a woman (%)
Sexual Behavior - Males 18+ that ever performed oral sex on a woman (%)
Sexual Behavior - Males 18+ that ever had anal sex with a woman (%)
Sexual Behavior - Males 18+ that ever had any sex with a man (%)
Sexual Behavior - Females 18+ that ever had vaginal sex with a man (%)
Sexual Behavior - Females 18+ that ever performed oral sex on a man (%)
Sexual Behavior - Females 18+ that ever had anal sex with a man (%)
Sexual Behavior - Females 18+ that ever had any kind of sex with a woman (%)
Sexual Behavior - Average age people first had sex
Sexual Behavior - Average number of female sex partners in lifetime (males 18+)
Sexual Behavior - Average number of female vaginal sex partners in lifetime (males 18+)
Sexual Behavior - Average age people first performed oral sex on a woman (18+)
Sexual Behavior - Average number of woman performed oral sex on in lifetime (18+)
Sexual Behavior - Average number of male sex partners in lifetime (males 18+)
Sexual Behavior - Average number of male anal sex partners in lifetime (males 18+)
Sexual Behavior - Average age people first performed oral sex on a man (18+)
Sexual Behavior - Average number of male oral sex partners in lifetime (18+)
Sexual Behavior - People using protection when performing oral sex (%)
Sexual Behavior - Average number of times people have vaginal or anal sex a year
Sexual Behavior - People having sex without condom (%)
Sexual Behavior - Average number of male sex partners in lifetime (females 18+)
Sexual Behavior - Average number of male vaginal sex partners in lifetime (females 18+)
Sexual Behavior - Average number of female sex partners in lifetime (females 18+)
Sexual Behavior - Circumcised males 18+ (%)
Sleep Disorders - Average hours sleeping at night
Sleep Disorders - People that has trouble sleeping (%)
Smoking-Cigarette Use - People smoking cigarettes (%)
Taste & Smell - People 40+ having problems with smell (%)
Taste & Smell - People 40+ having problems with taste (%)
Taste & Smell - People 40+ that ever had wisdom teeth removed (%)
Taste & Smell - People 40+ that ever had tonsils teeth removed (%)
Taste & Smell - People 40+ that ever had a loss of consciousness because of a head injury (%)
Taste & Smell - People 40+ that ever had a broken nose or other serious injury to face or skull (%)
Taste & Smell - People 40+ that ever had two or more sinus infections (%)
Weight - Average height (inches)
Weight - Average weight (pounds)
Weight - Average BMI
Weight - People that are obese (%)
Weight - People that ever were obese (%)
Weight - People trying to lose weight (%)
According to our research of Virginia and other state lists, there were 17 registered sex offenders living in Dale City, Virginia as of April 27, 2024 . The ratio of all residents to sex offenders in Dale City is 4,429 to 1.The ratio of registered sex offenders to all residents in this city is much lower than the state average.
Latest news from Dale City, VA collected exclusively by city-data.com from local newspapers, TV, and radio stations
Ancestries: American (4.7%), Ghanaian (3.1%), English (2.9%), German (1.8%), Ethiopian (1.7%), European (1.5%).
Current Local Time:
Land area: 15.0 square miles.
Population density: 4,397 people per square mile (average).
24,695 residents are foreign born (18.1% Latin America , 9.0% Asia , 5.0% Africa ).
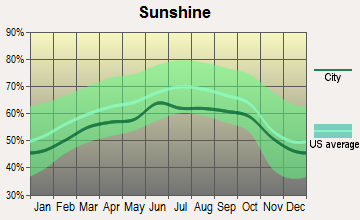
This place:
33.0%Virginia:
12.6%
Median real estate property taxes paid for housing units with mortgages in 2022: $4,221 (1.0%)Median real estate property taxes paid for housing units with no mortgage in 2022: $4,251 (1.1%)
Nearest city with pop. 200,000+: Washington, DC
Nearest city with pop. 1,000,000+: Philadelphia, PA
Nearest cities:
Latitude: 38.65 N, Longitude: 77.34 W
Daytime population change due to commuting: -23,059 (-34.9%)Workers who live and work in this place: 7,399 (21.3%)
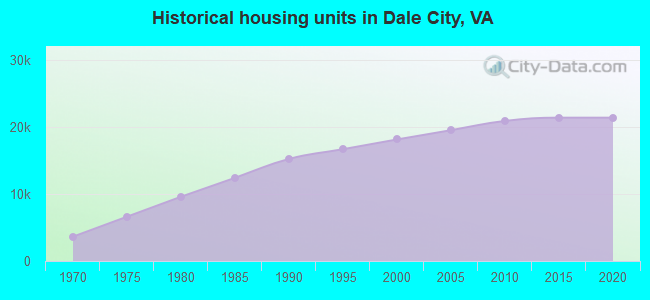
Property values in Dale City, VA
Unemployment in December 2023:
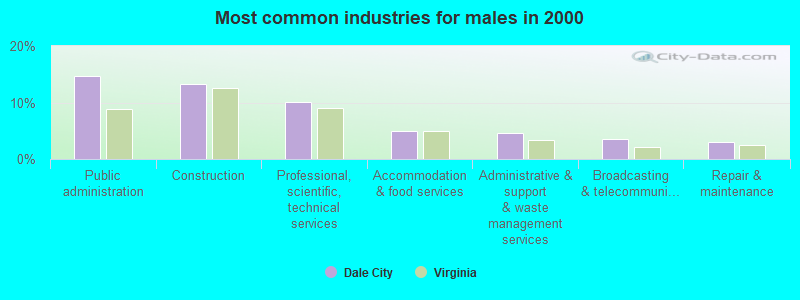
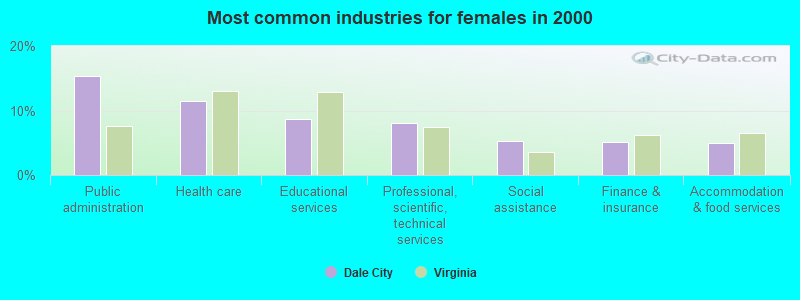
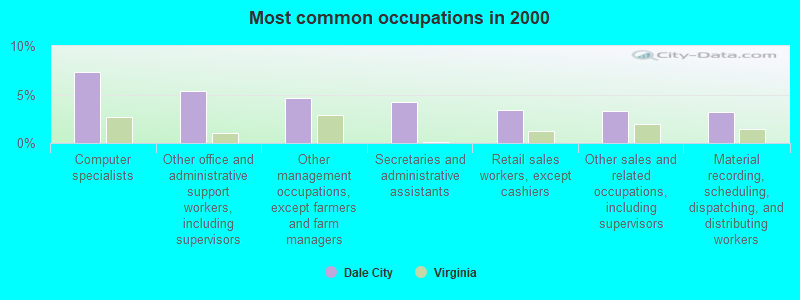
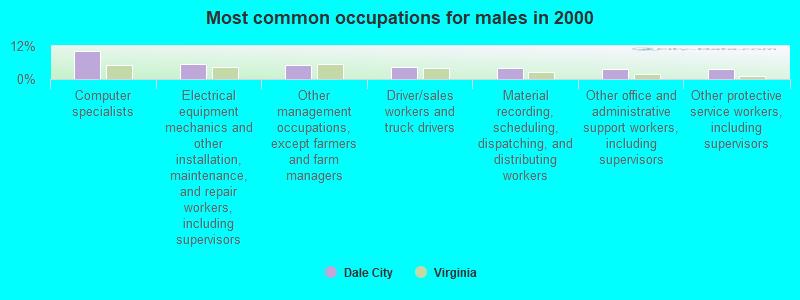
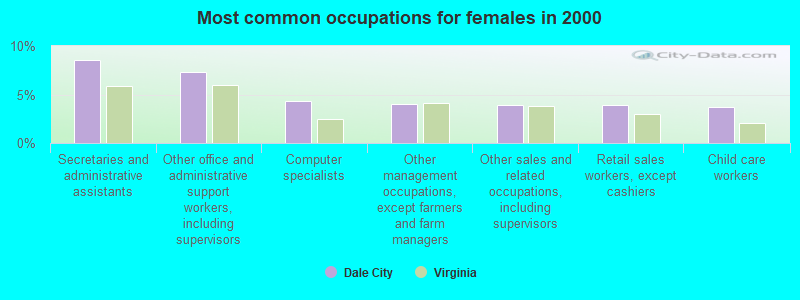
Most common occupations in Dale City, VA (%)
Both Males Females
Computer specialists (7.3%)
Other office and administrative support workers, including supervisors (5.4%)
Other management occupations, except farmers and farm managers (4.6%)
Secretaries and administrative assistants (4.2%)
Retail sales workers, except cashiers (3.4%)
Other sales and related occupations, including supervisors (3.3%)
Material recording, scheduling, dispatching, and distributing workers (3.2%)
Computer specialists (10.1%)
Electrical equipment mechanics and other installation, maintenance, and repair workers, including supervisors (5.4%)
Other management occupations, except farmers and farm managers (5.1%)
Driver/sales workers and truck drivers (4.2%)
Material recording, scheduling, dispatching, and distributing workers (4.1%)
Other office and administrative support workers, including supervisors (3.6%)
Other protective service workers, including supervisors (3.5%)
Secretaries and administrative assistants (8.6%)
Other office and administrative support workers, including supervisors (7.3%)
Computer specialists (4.3%)
Other management occupations, except farmers and farm managers (4.0%)
Other sales and related occupations, including supervisors (3.9%)
Retail sales workers, except cashiers (3.9%)
Child care workers (3.7%)
Tornado activity:
Dale City-area historical tornado activity is above Virginia state average. It is 5% greater than the overall U.S. average.
On 4/28/2002, a category F4 (max. wind speeds 207-260 mph) tornado 11.1 miles away from the Dale City place center killed 3 people and injured 122 people and caused $124 million in damages.
On 9/24/2001, a category F4 tornado 26.8 miles away from the place center injured 2 people and caused $2 million in damages.
Earthquake activity:
Dale City-area historical earthquake activity is significantly above Virginia state average. It is 55% smaller than the overall U.S. average. On 8/23/2011 at 17:51:04, a magnitude 5.8 (5.8 MW, Depth: 3.7 mi, Class: Moderate, Intensity: VI - VII) earthquake occurred 60.4 miles away from Dale City center On 8/25/2011 at 05:07:52, a magnitude 4.5 (4.5 ML, Depth: 4.2 mi, Class: Light, Intensity: IV - V) earthquake occurred 59.2 miles away from the city center On 12/9/2003 at 20:59:18, a magnitude 4.5 (4.5 ML, Depth: 6.2 mi) earthquake occurred 73.2 miles away from Dale City center On 12/9/2003 at 20:59:14, a magnitude 4.5 (4.5 MB, 4.5 LG) earthquake occurred 79.5 miles away from the city center On 1/16/1994 at 01:49:16, a magnitude 4.6 (4.6 MB, 4.6 LG, Depth: 3.1 mi) earthquake occurred 135.6 miles away from the city center On 9/25/1998 at 19:52:52, a magnitude 5.2 (4.8 MB, 4.3 MS, 5.2 LG, 4.5 MW, Depth: 3.1 mi) earthquake occurred 254.5 miles away from Dale City center Magnitude types: regional Lg-wave magnitude (LG), body-wave magnitude (MB), local magnitude (ML), surface-wave magnitude (MS), moment magnitude (MW) Natural disasters: The number of natural disasters in Prince William County (14) is near the US average (15).Major Disasters (Presidential) Declared: 10Emergencies Declared: 4Winter Storms: 5, Hurricanes: 4, Snowstorms: 3, Tropical Storms: 2, Blizzard: 1, Drought: 1, Other: 1 (Note: some incidents may be assigned to more than one category). Hospitals and medical centers near Dale City: SENTARA HOME CARE SERVICES (Home Health Center, about 2 miles away; WOODBRIDGE, VA)
RENAL CAREPARTNERS - WOODBRIDGE (Dialysis Facility, about 2 miles away; WOODBRIDGE, VA)
FMC - POTOMAC MILLS (Dialysis Facility, about 3 miles away; WOODBRIDGE, VA)
CDC - WOODBRIDGE (Dialysis Facility, about 3 miles away; WOODBRIDGE, VA)
SENTARA NORTHERN VIRGINIA MEDICAL CENTER (about 4 miles away; WOODBRIDGE, VA)
ENVOY OF WOODBRIDGE, LLC (Nursing Home, about 4 miles away; WOODBRIDGE, VA)
BESTCARE HOME CARE INC (Home Health Center, about 5 miles away; WOODBRIDGE, VA)
Amtrak stations near Dale City: 6 miles: WOODBRIDGE (1040 EXPRESS WAY) Services: partially wheelchair accessible, public payphones, vending machines, paid short-term parking, call for taxi service, public transit connection.
8 miles: LORTON (AUTO-TRAIN) (LORTON, 8006 LORTON RD.) Services: ticket office, fully wheelchair accessible, enclosed waiting area, public restrooms, public payphones, vending machines, free short-term parking, call for taxi service.
10 miles: QUANTICO (QUNATICO, RAILROAD AVE.) Services: public payphones, free short-term parking, free long-term parking, call for taxi service, public transit connection.
Colleges/universities with over 2000 students nearest to Dale City:
George Mason University (about 13 miles; Fairfax, VA ; Full-time enrollment: 26,002)
Northern Virginia Community College (about 15 miles; Annandale, VA ; FT enrollment: 35,721)
Stratford University (about 16 miles; Fairfax, VA ; FT enrollment: 2,570)
Medtech Institute (about 18 miles; Falls Church, VA ; FT enrollment: 2,900)
College of Southern Maryland (about 20 miles; La Plata, MD ; FT enrollment: 5,775)
Marymount University (about 22 miles; Arlington, VA ; FT enrollment: 3,361)
Strayer University-Virginia (about 22 miles; Arlington, VA ; FT enrollment: 7,005)
Private high school in Dale City: EVANGEL CHRISTIAN SCHOOL Students: 230, Location: 14836 ASHDALE AVE, Grades: PK-12)
Private elementary/middle schools in Dale City: HOLY FAMILY CATHOLIC SCHOOL Students: 242, Location: 14160 FERNDALE RD, Grades: PK-8)
DALE CITY CHRISTIAN CHURCH CDC & ACADEMY Students: 100, Location: 14022 LINDENDALE RD, Grades: PK-2)
User-submitted facts and corrections:
Cary Christian Academy (Private School) Grades K4-12- 250 Students, 5023 Davis Ford Road
Notable locations in Dale City: (A) , Potomac Festival II (B) , Dale City Mini Library (C) , Dale City Volunteer Fire Department Station 10 (D) , Dale City Volunteer Fire Department Station 20 (E) , Dale City Volunteer Fire Department Station 18 (F) , Dale City Volunteer Fire Department Station 13 (G) , Dale City Neighborhood Library (H) , Prince William County Police Crossing Guards Bureau (I) . Display/hide their locations on the map
Shopping Centers: (1) , Forestdale Plaza Shopping Center (2) , Ashdale Plaza Shopping Center (3) , Center Plaza Shopping Center (4) , Smoketown Plaza Shopping Center (5) , Prince William Square Shopping Center (6) . Display/hide their locations on the map
Churches in Dale City include: (A) , Epiphany Lutheran Church (B) , Lutheran Church of the Covenant (C) , Christ Chapel Assembly of God Church (D) , The Church of Jesus Christ of Latter Day Saints (E) , Evangelical Baptist Church (F) , First Church of the Nazarene (G) , First United Presbyterian Church (H) , Good Shepherd United Methodist Church (I) . Display/hide their locations on the map
Cemeteries: (1) , Greenwood Cemetery (2) . Display/hide their locations on the map
Streams, rivers, and creeks: (A) , Headly Run (B) . Display/hide their locations on the map
Parks in Dale City include: (1) , Greenwood Farm Park (2) , Hillendale Park (3) , Logan Park (4) , Andrew Leitch Park (5) . Display/hide their locations on the map
Birthplace of: David Hooper - College basketball player (Navy Midshipmen).
Prince William County has a predicted average indoor radon screening level between 2 and 4 pCi/L (pico curies per liter) - Moderate Potential Average household size: This place:
3.3 peopleVirginia:
2.5 people
Percentage of family households: This place:
79.4%Whole state:
67.0%
Percentage of households with unmarried partners: This place:
5.8%Whole state:
5.7%
Likely homosexual households (counted as self-reported same-sex unmarried-partner households)
Lesbian couples: 0.4% of all households Gay men: 0.3% of all households
People in group quarters in Dale City in 2010:
20 people in group homes intended for adults
11 people in other noninstitutional facilities
4 people in residential treatment centers for adults
People in group quarters in Dale City in 2000:
25 people in other noninstitutional group quarters
11 people in other types of correctional institutions
5 people in other nonhousehold living situations
Banks with branches in Dale City (2011 data):
SunTrust Bank: Cheshire Station Safeway Branch at 4215 Cheshire Station Plaza, branch established on 2002/04/03; Dale City Branch at 4150 Dale Boulevard, branch established on 1973/07/02. Info updated 2010/05/27: Bank assets: $171,291.7 mil, Deposits: $129,833.2 mil, headquarters in Atlanta, GA, positive income , Commercial Lending Specialization, 1716 total offices , Holding Company: Suntrust Banks, Inc.
Capital One, National Association: Cheshire Station Branch at 4101 Cheshire Station, branch established on 2003/07/24. Info updated 2011/07/01: Bank assets: $133,477.8 mil, Deposits: $97,063.7 mil, headquarters in Mclean, VA, positive income , 984 total offices , Holding Company: Capital One Financial Corporation
Bank of America, National Association: Dale City Branch at 4191 Dale Boulevard, branch established on 1974/11/22. Info updated 2009/11/18: Bank assets: $1,451,969.3 mil, Deposits: $1,077,176.8 mil, headquarters in Charlotte, NC, positive income , 5782 total offices , Holding Company: Bank Of America Corporation
Wells Fargo Bank, National Association: Dale City Branch at 2876 Dale Boulevard, branch established on 1968/11/04. Info updated 2011/04/05: Bank assets: $1,161,490.0 mil, Deposits: $905,653.0 mil, headquarters in Sioux Falls, SD, positive income , 6395 total offices , Holding Company: Wells Fargo & Company
TD Bank, National Association: Dale City Branch at 13630 Foulger Square, branch established on 2005/12/30. Info updated 2010/10/04: Bank assets: $188,912.6 mil, Deposits: $153,149.8 mil, headquarters in Wilmington, DE, positive income , 1314 total offices , Holding Company: Toronto-Dominion Bank, The
For population 15 years and over in Dale City:
Never married: 35.7%Now married: 52.0%Separated: 2.3%Widowed: 3.1%Divorced: 6.9% For population 25 years and over in Dale City:
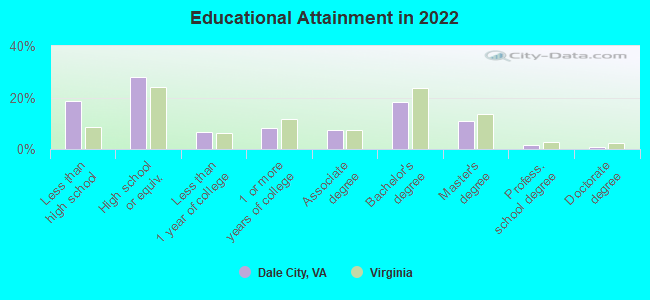
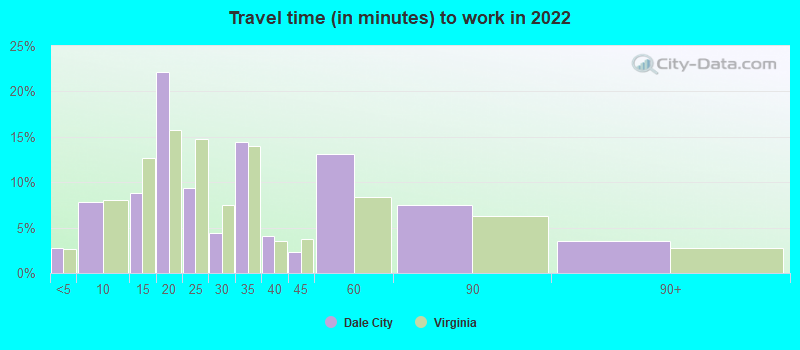
High school or higher: 81.5%Bachelor's degree or higher: 31.4%Graduate or professional degree: 13.3%Unemployed: 3.1%Mean travel time to work (commute): 25.8 minutes
Education Gini index (Inequality in education) Here:
18.5Virginia average:
12.1
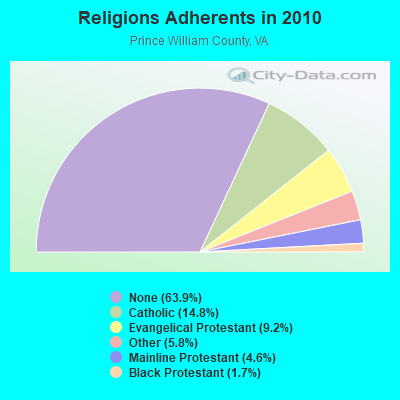
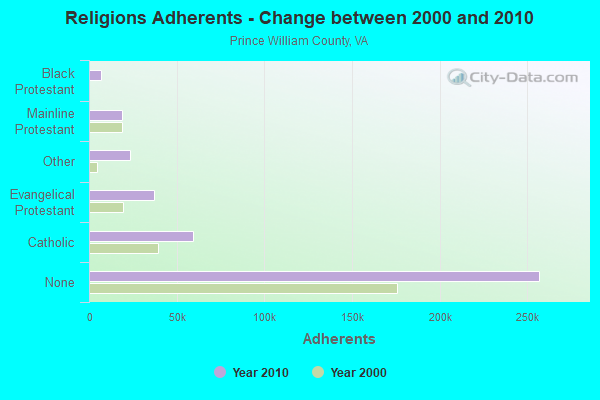
Religion statistics for Dale City, VA (based on Prince William County data)
Religion Adherents Congregations Catholic 59,551 6 Evangelical Protestant 36,833 131 Other 23,214 22 Mainline Protestant 18,644 29 Black Protestant 6,926 10 None 256,834 -
Source: Clifford Grammich, Kirk Hadaway, Richard Houseal, Dale E.Jones, Alexei Krindatch, Richie Stanley and Richard H.Taylor. 2012. 2010 U.S.Religion Census: Religious Congregations & Membership Study. Association of Statisticians of American Religious Bodies. Jones, Dale E., et al. 2002. Congregations and Membership in the United States 2000. Nashville, TN: Glenmary Research Center. Graphs represent county-level data
Food Environment Statistics: Number of grocery stores : 64Here :
1.78 / 10,000 pop.Virginia :
2.03 / 10,000 pop.
Number of supercenters and club stores : 4Prince William County :
0.11 / 10,000 pop.Virginia :
0.17 / 10,000 pop.
Number of convenience stores (no gas) : 43Prince William County :
1.20 / 10,000 pop.Virginia :
1.43 / 10,000 pop.
Number of convenience stores (with gas) : 92This county :
2.56 / 10,000 pop.Virginia :
4.03 / 10,000 pop.
Number of full-service restaurants : 197This county :
5.48 / 10,000 pop.Virginia :
7.65 / 10,000 pop.
Adult diabetes rate : Prince William County :
8.7%State :
9.3%
Adult obesity rate : This county :
28.2%State :
26.7%
Low-income preschool obesity rate : This county :
25.9%State :
18.6%
Health and Nutrition: Healthy diet rate : Dale City:
48.3%Virginia:
50.6%
Average overall health of teeth and gums : This city:
46.8%Virginia:
48.6%
Average BMI : Dale City:
28.9Virginia:
28.6
People feeling badly about themselves : This city:
21.2%Virginia:
20.2%
People not drinking alcohol at all : Dale City:
10.9%State:
10.5%
Average hours sleeping at night : Dale City:
6.7Virginia:
6.8
General health condition : Dale City:
56.7%State:
57.4%
Average condition of hearing : Dale City:
82.4%Virginia:
80.5%
More about Health and Nutrition of Dale City, VA Residents
9.70% of this county's 2021 resident taxpayers lived in other counties in 2020 ($73,434 average adjusted gross income )
Here:
9.70%Virginia average:
10.16%
0.13% of residents moved from foreign countries ($1,263 average AGI )Prince William County:
0.13%Virginia average:
0.12%
Top counties from which taxpayers relocated into this county between 2020 and 2021:
10.41% of this county's 2020 resident taxpayers moved to other counties in 2021 ($82,245 average adjusted gross income )
Here:
10.41%Virginia average:
10.20%
0.11% of residents moved to foreign countries ($1,088 average AGI )Prince William County:
0.11%Virginia average:
0.09%
Top counties to which taxpayers relocated from this county between 2020 and 2021:
Businesses in Dale City, VA
Name Count Name Count
7-Eleven 6 Nike 1 AT&T 1 Office Depot 1 Ace Hardware 1 Papa John's Pizza 1 AutoZone 1 Pizza Hut 2 Blockbuster 1 Popeyes 1 Chuck E. Cheese's 1 Safeway 1 DHL 1 Starbucks 2 Dairy Queen 1 Subway 3 Dennys 1 Taco Bell 1 Foot Locker 1 UPS 2 GNC 1 Vons 1 Giant 2 Wendy's 1 Long John Silver's 1 World Gym 1 McDonald's 3
Strongest AM radio stations in Dale City:
WPWC (1480 AM; 5 kW; DUMFRIES-TRIANGLE, VA; Owner: JMK COMMUNICATIONS, INC)
WKCW (1420 AM; 50 kW; WARRENTON, VA; Owner: WAY BROADCASTING, INC.)
WTEM (980 AM; 50 kW; WASHINGTON, DC; Owner: AMFM RADIO LICENSES, L.L.C.)
WWGB (1030 AM; daytime; 50 kW; INDIAN HEAD, MD; Owner: GOOD BODY MEDIA, LLC)
WKDL (730 AM; 8 kW; ALEXANDRIA, VA; Owner: MEGA COMMUNICATIONS OF ALEXANDRIA LICENSEE, LLC)
WUST (1120 AM; daytime; 20 kW; WASHINGTON, DC)
WPGC (1580 AM; 50 kW; MORNINGSIDE, MD; Owner: INFINITY WPGC(AM), INC.)
WTOP (1500 AM; 50 kW; WASHINGTON, DC; Owner: BONNEVILLE HOLDING COMPANY)
WMET (1150 AM; 50 kW; GAITHERSBURG, MD; Owner: BELTWAY ACQUISITION CORPORATION)
WKDV (1460 AM; 5 kW; MANASSAS, VA; Owner: WAY BROADCASTING, INC.)
WCBM (680 AM; 50 kW; BALTIMORE, MD; Owner: WCBM MARYLAND, INC.)
WDCT (1310 AM; 5 kW; FAIRFAX, VA; Owner: FAMILY RADIO, LTD.)
WBIS (1190 AM; 50 kW; ANNAPOLIS, MD; Owner: NATIONS RADIO, LLC)
Strongest FM radio stations in Dale City:
WJFK-FM (106.7 FM; MANASSAS, VA; Owner: INFINITY BROADCASTING CORP. OF WASHINGTON, DC)
WJZW (105.9 FM; WOODBRIDGE, VA; Owner: WMAL, INC.)
WMZQ-FM (98.7 FM; WASHINGTON, DC; Owner: AMFM RADIO LICENSES, L.L.C.)
WPER (89.9 FM; CULPEPER, VA; Owner: POSITIVE ALTERNATIVE RADIO INC.)
WWZZ (104.1 FM; WALDORF, MD; Owner: BONNEVILLE HOLDING COMPANY)
WETA (90.9 FM; WASHINGTON, DC; Owner: GREATER WASHINGTON EDUCATIONAL TELECOMMUNICATIONS ASSN.)
WGTS (91.9 FM; TAKOMA PARK, MD; Owner: COLUMBIA UNION COLLEGE BROADCASTING, INC.)
WRQX (107.3 FM; WASHINGTON, DC; Owner: WMAL, INC.)
WHUR-FM (96.3 FM; WASHINGTON, DC; Owner: THE HOWARD UNIVERSITY)
WASH (97.1 FM; WASHINGTON, DC; Owner: AMFM RADIO LICENSES, L.L.C.)
WARW (94.7 FM; BETHESDA, MD; Owner: INFINITY BROADCASTING OPERATIONS, INC.)
WIHT (99.5 FM; WASHINGTON, DC; Owner: AMFM RADIO LICENSES, L.L.C.)
WKYS (93.9 FM; WASHINGTON, DC; Owner: RADIO ONE LICENSES, LLC)
WAVA (105.1 FM; ARLINGTON, VA; Owner: SALEM MEDIA OF VIRGINIA, INC.)
WINC-FM (92.5 FM; WINCHESTER, VA; Owner: MID ATLANTIC NETWORK, INC.)
WWDC-FM (101.1 FM; WASHINGTON, DC; Owner: AMFM RADIO LICENSES, L.L.C.)
W228BA (93.5 FM; LEESBURG, VA; Owner: CSN INTERNATIONAL)
WBPS-FM (94.3 FM; WARRENTON, VA; Owner: MEGA COMMUNICATIONS OF WARRENTON LICENSEE, L.L.C.)
WBQB (101.5 FM; FREDERICKSBURG, VA; Owner: MID ATLANTIC NETWORK, INC.)
WTOP-FM (107.7 FM; WARRENTON, VA; Owner: BONNEVILLE HOLDING COMPANY)
TV broadcast stations around Dale City:
WNVT (Channel 53; GOLDVEIN, VA; Owner: COMMONWEALTH PUBLIC BROADCASTING CORPORATION)
WPXW (Channel 66; MANASSAS, VA; Owner: PAXSON WASHINGTON LICENSE, INC.)
WNVC (Channel 56; FAIRFAX, VA; Owner: COMMONWEALTH PUBLIC BROADCASTING CORPORATION)
WJLA-TV (Channel 7; WASHINGTON, DC; Owner: ACC LICENSEE, INC.)
WUSA (Channel 9; WASHINGTON, DC; Owner: THE DETROIT NEWS, INC.)
WTTG (Channel 5; WASHINGTON, DC; Owner: FOX TELEVISION STATIONS, INC.)
WETA-TV (Channel 26; WASHINGTON, DC; Owner: THE GREATER WASHINGTON ED TELECOMM. ASSOC)
WDCA (Channel 20; WASHINGTON, DC; Owner: FOX TELEVISION STATIONS, INC.)
WHUT-TV (Channel 32; WASHINGTON, DC; Owner: HOWARD UNIVERSITY)
WIAV-LP (Channel 58; WASHINGTON, DC; Owner: ASIAVISION, INC.)
WRC-TV (Channel 4; WASHINGTON, DC; Owner: NBC SUBSIDIARY (WRC-TV), INC.)
WBDC-TV (Channel 50; WASHINGTON, DC; Owner: WBDC BROADCASTING, INC.)
W42BE (Channel 42; FAIRFAX, VA; Owner: FAIRFAX LOW POWER CO.)
W28BY (Channel 63; BALTIMORE, MD; Owner: INFORMATION SUPER STATION, L.L.C.)
WMDO-CA (Channel 30; WASHINGTON, DC; Owner: ENTRAVISION HOLDINGS, LLC)
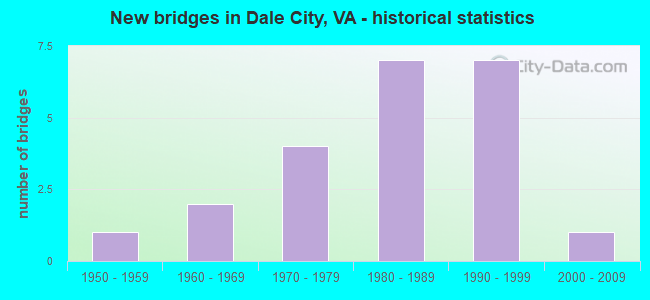
National Bridge Inventory (NBI) Statistics 22 Number of bridges203ft / 61.9m Total length $1,606,000 Total costs1,382,566 Total average daily traffic51,298 Total average daily truck traffic
New bridges - historical statistics
1 1950-1959 2 1960-1969 4 1970-1979 7 1980-1989 7 1990-1999 1 2000-2009
See full National Bridge Inventory statistics for Dale City, VA
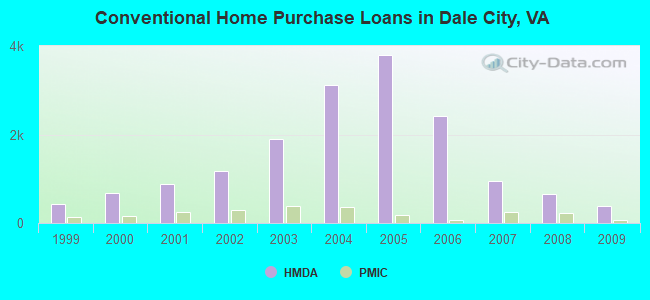
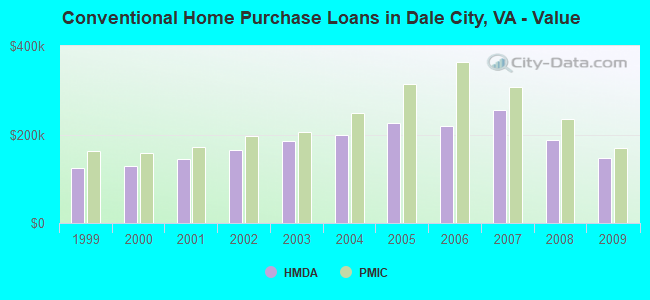
Home Mortgage Disclosure Act Aggregated Statistics For Year 2009(Based on 7 full and 2 partial tracts) A) FHA, FSA/RHS & VA B) Conventional C) Refinancings D) Home Improvement Loans F) Non-occupant Loans on G) Loans On Manufactured Number Average Value Number Average Value Number Average Value Number Average Value Number Average Value Number Average Value
LOANS ORIGINATED 984 $210,095 388 $145,885 870 $230,925 47 $62,428 201 $118,777 1 $65,000 APPLICATIONS APPROVED, NOT ACCEPTED 53 $218,479 24 $154,640 89 $208,066 10 $39,943 12 $123,462 0 $0 APPLICATIONS DENIED 147 $211,963 73 $135,715 510 $242,709 59 $53,231 56 $126,460 1 $45,000 APPLICATIONS WITHDRAWN 161 $200,591 61 $142,410 338 $248,978 10 $112,248 33 $124,162 1 $97,000 FILES CLOSED FOR INCOMPLETENESS 31 $187,880 10 $176,709 80 $245,730 8 $84,862 10 $131,464 0 $0
Aggregated Statistics For Year 2008(Based on 7 full and 2 partial tracts) A) FHA, FSA/RHS & VA B) Conventional C) Refinancings D) Home Improvement Loans E) Loans on Dwellings For 5+ Families F) Non-occupant Loans on G) Loans On Manufactured Number Average Value Number Average Value Number Average Value Number Average Value Number Average Value Number Average Value Number Average Value
LOANS ORIGINATED 1,153 $212,982 660 $186,588 587 $219,285 120 $55,508 1 $1,312,000 208 $132,856 1 $214,000 APPLICATIONS APPROVED, NOT ACCEPTED 59 $190,286 92 $200,702 155 $241,070 39 $43,028 0 $0 32 $149,533 2 $65,000 APPLICATIONS DENIED 192 $211,186 181 $198,818 880 $272,849 181 $74,902 0 $0 72 $164,729 8 $87,389 APPLICATIONS WITHDRAWN 137 $220,630 135 $204,439 419 $265,595 31 $97,611 0 $0 53 $163,303 0 $0 FILES CLOSED FOR INCOMPLETENESS 15 $193,426 47 $214,363 85 $281,504 15 $98,378 0 $0 14 $214,560 0 $0
Aggregated Statistics For Year 2007(Based on 7 full and 2 partial tracts) A) FHA, FSA/RHS & VA B) Conventional C) Refinancings D) Home Improvement Loans F) Non-occupant Loans on G) Loans On Manufactured Number Average Value Number Average Value Number Average Value Number Average Value Number Average Value Number Average Value
LOANS ORIGINATED 121 $306,984 958 $255,487 1,751 $238,264 283 $112,917 143 $223,484 1 $49,830 APPLICATIONS APPROVED, NOT ACCEPTED 11 $349,274 155 $234,569 425 $254,591 57 $65,633 14 $219,716 0 $0 APPLICATIONS DENIED 13 $298,394 312 $262,127 1,781 $285,723 271 $131,304 108 $245,414 10 $44,076 APPLICATIONS WITHDRAWN 14 $283,579 213 $255,952 843 $283,603 51 $155,711 39 $224,110 1 $73,280 FILES CLOSED FOR INCOMPLETENESS 1 $278,460 50 $277,271 258 $308,032 16 $165,982 5 $218,646 0 $0
Aggregated Statistics For Year 2006(Based on 7 full and 2 partial tracts) A) FHA, FSA/RHS & VA B) Conventional C) Refinancings D) Home Improvement Loans E) Loans on Dwellings For 5+ Families F) Non-occupant Loans on G) Loans On Manufactured Number Average Value Number Average Value Number Average Value Number Average Value Number Average Value Number Average Value Number Average Value
LOANS ORIGINATED 42 $332,689 2,417 $219,095 3,358 $256,059 427 $126,520 1 $766,380 256 $227,333 4 $119,922 APPLICATIONS APPROVED, NOT ACCEPTED 4 $214,982 202 $240,084 537 $263,519 76 $93,018 0 $0 44 $245,751 2 $81,530 APPLICATIONS DENIED 4 $296,172 581 $230,416 1,564 $275,973 260 $127,771 1 $7,330 98 $214,547 7 $97,256 APPLICATIONS WITHDRAWN 8 $349,146 269 $239,121 1,149 $279,942 93 $186,269 1 $325,000 53 $250,342 0 $0 FILES CLOSED FOR INCOMPLETENESS 0 $0 82 $221,036 270 $282,739 15 $151,895 0 $0 12 $206,401 0 $0
Aggregated Statistics For Year 2005(Based on 7 full and 2 partial tracts) A) FHA, FSA/RHS & VA B) Conventional C) Refinancings D) Home Improvement Loans E) Loans on Dwellings For 5+ Families F) Non-occupant Loans on G) Loans On Manufactured Number Average Value Number Average Value Number Average Value Number Average Value Number Average Value Number Average Value Number Average Value
LOANS ORIGINATED 31 $280,485 3,795 $225,857 4,623 $248,729 550 $130,320 2 $164,140 518 $218,336 3 $192,667 APPLICATIONS APPROVED, NOT ACCEPTED 1 $136,500 324 $229,940 572 $236,167 61 $103,147 0 $0 50 $204,905 7 $76,571 APPLICATIONS DENIED 3 $279,667 730 $212,716 1,492 $245,865 297 $109,706 0 $0 135 $224,065 19 $43,994 APPLICATIONS WITHDRAWN 5 $267,852 300 $234,499 1,150 $236,088 168 $183,842 0 $0 64 $220,230 3 $151,667 FILES CLOSED FOR INCOMPLETENESS 3 $214,157 97 $218,742 249 $254,832 23 $103,734 0 $0 28 $208,356 0 $0
Aggregated Statistics For Year 2004(Based on 7 full and 2 partial tracts) A) FHA, FSA/RHS & VA B) Conventional C) Refinancings D) Home Improvement Loans E) Loans on Dwellings For 5+ Families F) Non-occupant Loans on G) Loans On Manufactured Number Average Value Number Average Value Number Average Value Number Average Value Number Average Value Number Average Value Number Average Value
LOANS ORIGINATED 333 $232,214 3,128 $198,855 4,292 $197,909 403 $83,525 0 $0 399 $159,022 4 $62,645 APPLICATIONS APPROVED, NOT ACCEPTED 12 $223,643 228 $208,338 579 $193,149 84 $72,137 1 $145,830 27 $119,715 6 $33,800 APPLICATIONS DENIED 15 $231,807 504 $187,212 1,446 $197,392 333 $66,264 0 $0 86 $167,688 10 $53,474 APPLICATIONS WITHDRAWN 13 $228,548 242 $215,259 1,143 $186,872 118 $110,262 0 $0 44 $152,294 0 $0 FILES CLOSED FOR INCOMPLETENESS 4 $168,490 61 $190,694 241 $202,061 21 $80,216 0 $0 13 $152,070 0 $0
Aggregated Statistics For Year 2003(Based on 7 full and 2 partial tracts) A) FHA, FSA/RHS & VA B) Conventional C) Refinancings D) Home Improvement Loans F) Non-occupant Loans on Number Average Value Number Average Value Number Average Value Number Average Value Number Average Value
LOANS ORIGINATED 600 $201,598 1,899 $184,232 6,160 $159,968 260 $28,085 342 $124,254 APPLICATIONS APPROVED, NOT ACCEPTED 26 $189,158 179 $174,699 989 $156,101 86 $32,072 32 $117,407 APPLICATIONS DENIED 27 $190,084 254 $158,667 1,591 $160,905 253 $28,923 58 $130,497 APPLICATIONS WITHDRAWN 44 $199,942 187 $191,497 978 $160,836 38 $61,846 46 $117,952 FILES CLOSED FOR INCOMPLETENESS 9 $189,373 32 $188,835 241 $166,165 15 $50,613 11 $79,904
Aggregated Statistics For Year 2002(Based on 6 full and 1 partial tracts) A) FHA, FSA/RHS & VA B) Conventional C) Refinancings D) Home Improvement Loans F) Non-occupant Loans on Number Average Value Number Average Value Number Average Value Number Average Value Number Average Value
LOANS ORIGINATED 675 $180,140 1,174 $164,878 3,044 $157,633 204 $29,643 179 $109,996 APPLICATIONS APPROVED, NOT ACCEPTED 14 $181,286 95 $153,380 402 $138,824 57 $35,793 14 $111,876 APPLICATIONS DENIED 32 $175,844 134 $148,020 918 $129,847 199 $22,407 21 $89,177 APPLICATIONS WITHDRAWN 45 $171,154 102 $165,756 604 $133,206 41 $31,244 16 $91,280 FILES CLOSED FOR INCOMPLETENESS 4 $140,500 21 $175,873 153 $132,884 3 $32,320 5 $64,902
Aggregated Statistics For Year 2001(Based on 6 full and 1 partial tracts) A) FHA, FSA/RHS & VA B) Conventional C) Refinancings D) Home Improvement Loans F) Non-occupant Loans on Number Average Value Number Average Value Number Average Value Number Average Value Number Average Value
LOANS ORIGINATED 773 $160,494 878 $144,633 1,820 $135,667 183 $21,428 89 $91,592 APPLICATIONS APPROVED, NOT ACCEPTED 18 $164,556 56 $116,665 207 $118,829 50 $25,647 9 $94,659 APPLICATIONS DENIED 30 $150,874 120 $113,071 700 $99,578 251 $20,821 17 $75,272 APPLICATIONS WITHDRAWN 48 $158,726 92 $155,832 451 $118,739 65 $27,230 25 $120,390 FILES CLOSED FOR INCOMPLETENESS 1 $194,000 11 $157,668 127 $116,953 8 $27,125 1 $103,000
Aggregated Statistics For Year 2000(Based on 6 full and 1 partial tracts) A) FHA, FSA/RHS & VA B) Conventional C) Refinancings D) Home Improvement Loans E) Loans on Dwellings For 5+ Families F) Non-occupant Loans on Number Average Value Number Average Value Number Average Value Number Average Value Number Average Value Number Average Value
LOANS ORIGINATED 804 $144,029 679 $128,407 291 $97,884 205 $27,134 3 $115,090 40 $79,350 APPLICATIONS APPROVED, NOT ACCEPTED 24 $135,400 37 $108,475 63 $82,097 84 $23,048 0 $0 4 $55,648 APPLICATIONS DENIED 59 $132,895 135 $94,328 543 $64,802 241 $19,744 1 $183,000 10 $55,771 APPLICATIONS WITHDRAWN 39 $140,208 64 $124,374 188 $73,046 44 $35,370 0 $0 4 $72,500 FILES CLOSED FOR INCOMPLETENESS 5 $129,200 12 $159,333 17 $72,253 5 $15,644 0 $0 1 $50,000
Aggregated Statistics For Year 1999(Based on 6 full and 3 partial tracts) A) FHA, FSA/RHS & VA B) Conventional C) Refinancings D) Home Improvement Loans F) Non-occupant Loans on Number Average Value Number Average Value Number Average Value Number Average Value Number Average Value
LOANS ORIGINATED 729 $126,007 431 $124,444 831 $103,512 229 $17,495 74 $85,350 APPLICATIONS APPROVED, NOT ACCEPTED 14 $119,976 40 $88,158 165 $87,355 53 $21,396 12 $69,658 APPLICATIONS DENIED 67 $126,169 100 $110,247 547 $83,890 257 $17,930 48 $67,202 APPLICATIONS WITHDRAWN 66 $133,865 78 $104,126 335 $91,441 46 $39,507 19 $93,774 FILES CLOSED FOR INCOMPLETENESS 7 $102,639 10 $84,322 78 $101,740 5 $17,652 4 $85,550
Detailed mortgage data for all 9 tracts in Dale City, VA
Private Mortgage Insurance Companies Aggregated Statistics For Year 2009(Based on 7 full and 2 partial tracts) A) Conventional B) Refinancings C) Non-occupant Loans on Number Average Value Number Average Value Number Average Value
LOANS ORIGINATED 66 $168,479 13 $298,137 3 $96,920 APPLICATIONS APPROVED, NOT ACCEPTED 26 $189,476 7 $299,976 0 $0 APPLICATIONS DENIED 16 $141,349 3 $308,667 0 $0 APPLICATIONS WITHDRAWN 3 $164,433 0 $0 0 $0 FILES CLOSED FOR INCOMPLETENESS 3 $171,333 0 $0 0 $0
Aggregated Statistics For Year 2008(Based on 7 full and 2 partial tracts) A) Conventional B) Refinancings C) Non-occupant Loans on Number Average Value Number Average Value Number Average Value
LOANS ORIGINATED 222 $234,607 53 $291,948 17 $171,903 APPLICATIONS APPROVED, NOT ACCEPTED 80 $260,549 66 $313,806 10 $196,252 APPLICATIONS DENIED 36 $201,893 11 $302,159 10 $212,009 APPLICATIONS WITHDRAWN 10 $234,448 4 $245,408 1 $234,000 FILES CLOSED FOR INCOMPLETENESS 3 $126,190 5 $234,832 0 $0
Aggregated Statistics For Year 2007(Based on 7 full and 2 partial tracts) A) Conventional B) Refinancings C) Non-occupant Loans on Number Average Value Number Average Value Number Average Value
LOANS ORIGINATED 245 $307,716 147 $347,660 10 $279,553 APPLICATIONS APPROVED, NOT ACCEPTED 21 $327,420 45 $359,798 1 $345,800 APPLICATIONS DENIED 7 $357,889 5 $391,344 0 $0 APPLICATIONS WITHDRAWN 7 $339,466 25 $356,298 3 $377,817 FILES CLOSED FOR INCOMPLETENESS 1 $385,000 0 $0 0 $0
Aggregated Statistics For Year 2006(Based on 7 full and 2 partial tracts) A) Conventional B) Refinancings C) Non-occupant Loans on Number Average Value Number Average Value Number Average Value
LOANS ORIGINATED 63 $364,749 94 $356,584 7 $304,093 APPLICATIONS APPROVED, NOT ACCEPTED 12 $304,003 30 $347,026 2 $232,510 APPLICATIONS DENIED 4 $407,000 3 $545,000 2 $407,500 APPLICATIONS WITHDRAWN 6 $392,667 13 $331,582 2 $244,500 FILES CLOSED FOR INCOMPLETENESS 1 $415,000 1 $269,000 0 $0
Aggregated Statistics For Year 2005(Based on 7 full and 2 partial tracts) A) Conventional B) Refinancings C) Non-occupant Loans on Number Average Value Number Average Value Number Average Value
LOANS ORIGINATED 180 $313,283 110 $306,699 30 $276,138 APPLICATIONS APPROVED, NOT ACCEPTED 23 $263,104 41 $275,432 9 $239,652 APPLICATIONS DENIED 11 $269,364 2 $238,080 5 $300,800 APPLICATIONS WITHDRAWN 11 $291,658 11 $284,433 2 $211,500 FILES CLOSED FOR INCOMPLETENESS 2 $388,340 3 $265,863 0 $0
Aggregated Statistics For Year 2004(Based on 7 full and 2 partial tracts) A) Conventional B) Refinancings C) Non-occupant Loans on D) Loans On Manufactured Number Average Value Number Average Value Number Average Value Number Average Value
LOANS ORIGINATED 362 $248,986 174 $234,683 47 $179,188 1 $152,950 APPLICATIONS APPROVED, NOT ACCEPTED 39 $251,000 55 $209,567 6 $178,460 0 $0 APPLICATIONS DENIED 11 $189,353 6 $329,237 8 $207,750 0 $0 APPLICATIONS WITHDRAWN 20 $249,356 23 $220,462 5 $226,920 0 $0 FILES CLOSED FOR INCOMPLETENESS 4 $233,250 1 $172,000 0 $0 0 $0
Aggregated Statistics For Year 2003(Based on 7 full and 2 partial tracts) A) Conventional B) Refinancings C) Non-occupant Loans on Number Average Value Number Average Value Number Average Value
LOANS ORIGINATED 381 $206,113 349 $191,890 37 $146,319 APPLICATIONS APPROVED, NOT ACCEPTED 25 $205,124 104 $191,321 8 $103,882 APPLICATIONS DENIED 8 $166,141 5 $163,622 4 $130,000 APPLICATIONS WITHDRAWN 11 $200,014 41 $204,866 0 $0 FILES CLOSED FOR INCOMPLETENESS 1 $335,000 1 $158,280 0 $0
Aggregated Statistics For Year 2002(Based on 6 full and 1 partial tracts) A) Conventional B) Refinancings C) Non-occupant Loans on Number Average Value Number Average Value Number Average Value
LOANS ORIGINATED 301 $196,810 224 $181,567 26 $133,805 APPLICATIONS APPROVED, NOT ACCEPTED 34 $169,148 49 $177,909 7 $95,663 APPLICATIONS DENIED 9 $212,633 6 $172,667 1 $188,000 APPLICATIONS WITHDRAWN 17 $205,285 9 $128,912 4 $82,052 FILES CLOSED FOR INCOMPLETENESS 1 $194,000 2 $271,500 0 $0
Aggregated Statistics For Year 2001(Based on 6 full and 1 partial tracts) A) Conventional B) Refinancings C) Non-occupant Loans on Number Average Value Number Average Value Number Average Value
LOANS ORIGINATED 241 $171,725 141 $169,822 13 $95,488 APPLICATIONS APPROVED, NOT ACCEPTED 18 $190,798 29 $148,912 2 $162,500 APPLICATIONS DENIED 3 $145,797 9 $182,333 1 $104,000 APPLICATIONS WITHDRAWN 6 $189,667 1 $263,000 1 $300,000 FILES CLOSED FOR INCOMPLETENESS 2 $248,500 2 $247,000 0 $0
Aggregated Statistics For Year 2000(Based on 6 full and 1 partial tracts) A) Conventional B) Refinancings C) Non-occupant Loans on Number Average Value Number Average Value Number Average Value
LOANS ORIGINATED 154 $158,488 34 $150,952 12 $79,735 APPLICATIONS APPROVED, NOT ACCEPTED 9 $158,112 14 $141,214 2 $91,500 APPLICATIONS DENIED 8 $191,250 2 $93,500 0 $0 APPLICATIONS WITHDRAWN 4 $124,750 1 $136,000 1 $79,000 FILES CLOSED FOR INCOMPLETENESS 0 $0 2 $116,000 0 $0
Aggregated Statistics For Year 1999(Based on 6 full and 3 partial tracts) A) Conventional B) Refinancings C) Non-occupant Loans on Number Average Value Number Average Value Number Average Value
LOANS ORIGINATED 136 $163,538 134 $128,086 3 $127,020 APPLICATIONS APPROVED, NOT ACCEPTED 18 $141,843 17 $132,374 3 $92,143 APPLICATIONS DENIED 8 $168,305 11 $130,453 2 $88,760 APPLICATIONS WITHDRAWN 3 $151,553 2 $97,555 1 $103,530 FILES CLOSED FOR INCOMPLETENESS 2 $174,900 3 $92,077 1 $59,460
Dale City compared to Virginia state average:
Unemployed percentage significantly below state average. Hispanic race population percentage significantly above state average. Foreign-born population percentage significantly above state average.
#2 on the list of "Top 101 cities that people commute from (largest negative percentage daily daytime population change due to commuting) (population 50,000+)"
#5 on the list of "Top 101 cities with the smallest household incomes disparities (population 50,000+)"
#10 on the list of "Top 100 low-educated but high-earning cities (pop. 50,000+)"
#12 on the list of "Top 101 cities with largest percentage of males in occupations: fire fighting and prevention workers including supervisors (population 50,000+)"
#14 on the list of "Top 101 cities with the most residents born in Ghana (population 500+)"
#15 on the list of "Top 101 cities with largest percentage of males in industries: construction (population 50,000+)"
#16 on the list of "Top 100 cities with highest median household income and median resident age less than 35 (pop. 50,000+)"
#20 on the list of "Top 100 cities with biggest houses (pop. 50,000+)"
#20 on the list of "Top 101 cities with largest percentage of males in occupations: construction and extraction occupations (population 50,000+)"
#24 on the list of "Top 100 cities with longest commuting times (pop. 50,000+)"
#26 on the list of "Top 100 most racially diverse cities (pop. 50,000+)"
#27 on the list of "Top 101 cities with the least people below the poverty level (population 50,000+)"
#29 on the list of "Top 101 cities with the most residents born in Bolivia (population 500+)"
#29 on the list of "Top 101 cities with the smallest house values disparities (population 50,000+)"
#37 on the list of "Top 101 cities with largest percentage of females in industries: public administration (population 50,000+)"
#41 on the list of "Top 101 cities with largest percentage of females in occupations: transportation occupations (population 50,000+)"
#45 on the list of "Top 101 cities with largest percentage of females in occupations: fire fighting and prevention workers including supervisors (population 50,000+)"
#46 on the list of "Top 101 cities with largest percentage of males in industries: public administration (population 50,000+)"
#48 on the list of "Top 101 cities with largest percentage of males in industries: management of companies and enterprises (population 50,000+)"
#50 on the list of "Top 101 cities with the most cars per house, population 50,000+"
#5 on the list of "Top 101 counties with the largest number of children under 18 without health insurance coverage in 2000 (pop. 50,000+)"
#26 on the list of "Top 101 counties with the lowest Nitrogen Dioxide air pollution readings in 2012 (ppm)"
#35 on the list of "Top 101 counties with the highest number of births per 1000 residents 2007-2013"
#40 on the list of "Top 101 counties with the lowest number of deaths per 1000 residents 2007-2013"
#41 on the list of "Top 101 counties with the largest increase in the number of infant deaths per 1000 residents 2000-2006 to 2007-2013 (pop. 50,000+)"
Top Patent Applicants
Steven E. Noel (3)
Ronald Howard (2)
John-Isaac Clark (2)
Gregory D. Hughes (2)
Jared Gilbert (1)
Clint Joseph Hunkley (1)
John Clark (1)
Walter Taylor (1)
Jared D. Gilbert (1)
Milan Chukel (1)
Total of 15 patent applications in 2008-2024.

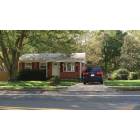
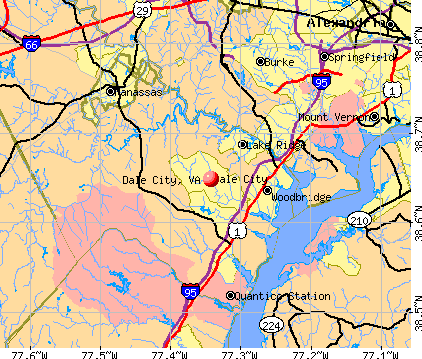


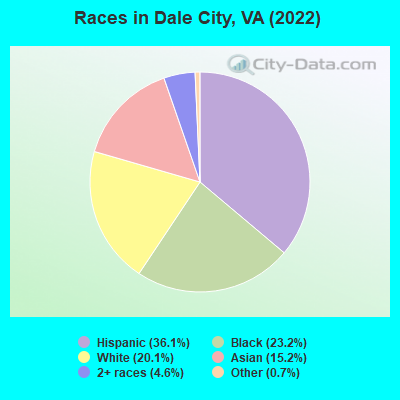
 Recent articles from our blog. Our writers, many of them Ph.D. graduates or candidates, create easy-to-read articles on a wide variety of topics.

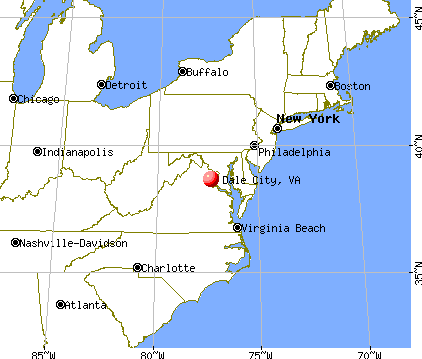
 (25.5 miles