Woodbridge, Virginia Submit your own pictures of this place and show them to the world
OSM Map
General Map
Google Map
MSN Map
OSM Map
General Map
Google Map
MSN Map
OSM Map
General Map
Google Map
MSN Map
OSM Map
General Map
Google Map
MSN Map
Please wait while loading the map...
Population in 2010: 4,055. Population change since 2000: -87.3%Males: 1,975 Females: 2,080
March 2022 cost of living index in Woodbridge: 163.0 (very high, U.S. average is 100) Percentage of residents living in poverty in 2022: 9.4%for White Non-Hispanic residents , 8.4% for Black residents , 13.9% for Hispanic or Latino residents , 28.8% for American Indian residents , 14.5% for other race residents , 5.0% for two or more races residents )
Profiles of local businesses
Business Search - 14 Million verified businesses
Data:
Median household income ($)
Median household income (% change since 2000)
Household income diversity
Ratio of average income to average house value (%)
Ratio of average income to average rent
Median household income ($) - White
Median household income ($) - Black or African American
Median household income ($) - Asian
Median household income ($) - Hispanic or Latino
Median household income ($) - American Indian and Alaska Native
Median household income ($) - Multirace
Median household income ($) - Other Race
Median household income for houses/condos with a mortgage ($)
Median household income for apartments without a mortgage ($)
Races - White alone (%)
Races - White alone (% change since 2000)
Races - Black alone (%)
Races - Black alone (% change since 2000)
Races - American Indian alone (%)
Races - American Indian alone (% change since 2000)
Races - Asian alone (%)
Races - Asian alone (% change since 2000)
Races - Hispanic (%)
Races - Hispanic (% change since 2000)
Races - Native Hawaiian and Other Pacific Islander alone (%)
Races - Native Hawaiian and Other Pacific Islander alone (% change since 2000)
Races - Two or more races (%)
Races - Two or more races (% change since 2000)
Races - Other race alone (%)
Races - Other race alone (% change since 2000)
Racial diversity
Unemployment (%)
Unemployment (% change since 2000)
Unemployment (%) - White
Unemployment (%) - Black or African American
Unemployment (%) - Asian
Unemployment (%) - Hispanic or Latino
Unemployment (%) - American Indian and Alaska Native
Unemployment (%) - Multirace
Unemployment (%) - Other Race
Population density (people per square mile)
Population - Males (%)
Population - Females (%)
Population - Males (%) - White
Population - Males (%) - Black or African American
Population - Males (%) - Asian
Population - Males (%) - Hispanic or Latino
Population - Males (%) - American Indian and Alaska Native
Population - Males (%) - Multirace
Population - Males (%) - Other Race
Population - Females (%) - White
Population - Females (%) - Black or African American
Population - Females (%) - Asian
Population - Females (%) - Hispanic or Latino
Population - Females (%) - American Indian and Alaska Native
Population - Females (%) - Multirace
Population - Females (%) - Other Race
Coronavirus confirmed cases (Apr 27, 2024)
Deaths caused by coronavirus (Apr 27, 2024)
Coronavirus confirmed cases (per 100k population) (Apr 27, 2024)
Deaths caused by coronavirus (per 100k population) (Apr 27, 2024)
Daily increase in number of cases (Apr 27, 2024)
Weekly increase in number of cases (Apr 27, 2024)
Cases doubled (in days) (Apr 27, 2024)
Hospitalized patients (Apr 18, 2022)
Negative test results (Apr 18, 2022)
Total test results (Apr 18, 2022)
COVID Vaccine doses distributed (per 100k population) (Sep 19, 2023)
COVID Vaccine doses administered (per 100k population) (Sep 19, 2023)
COVID Vaccine doses distributed (Sep 19, 2023)
COVID Vaccine doses administered (Sep 19, 2023)
Likely homosexual households (%)
Likely homosexual households (% change since 2000)
Likely homosexual households - Lesbian couples (%)
Likely homosexual households - Lesbian couples (% change since 2000)
Likely homosexual households - Gay men (%)
Likely homosexual households - Gay men (% change since 2000)
Cost of living index
Median gross rent ($)
Median contract rent ($)
Median monthly housing costs ($)
Median house or condo value ($)
Median house or condo value ($ change since 2000)
Mean house or condo value by units in structure - 1, detached ($)
Mean house or condo value by units in structure - 1, attached ($)
Mean house or condo value by units in structure - 2 ($)
Mean house or condo value by units in structure by units in structure - 3 or 4 ($)
Mean house or condo value by units in structure - 5 or more ($)
Mean house or condo value by units in structure - Boat, RV, van, etc. ($)
Mean house or condo value by units in structure - Mobile home ($)
Median house or condo value ($) - White
Median house or condo value ($) - Black or African American
Median house or condo value ($) - Asian
Median house or condo value ($) - Hispanic or Latino
Median house or condo value ($) - American Indian and Alaska Native
Median house or condo value ($) - Multirace
Median house or condo value ($) - Other Race
Median resident age
Resident age diversity
Median resident age - Males
Median resident age - Females
Median resident age - White
Median resident age - Black or African American
Median resident age - Asian
Median resident age - Hispanic or Latino
Median resident age - American Indian and Alaska Native
Median resident age - Multirace
Median resident age - Other Race
Median resident age - Males - White
Median resident age - Males - Black or African American
Median resident age - Males - Asian
Median resident age - Males - Hispanic or Latino
Median resident age - Males - American Indian and Alaska Native
Median resident age - Males - Multirace
Median resident age - Males - Other Race
Median resident age - Females - White
Median resident age - Females - Black or African American
Median resident age - Females - Asian
Median resident age - Females - Hispanic or Latino
Median resident age - Females - American Indian and Alaska Native
Median resident age - Females - Multirace
Median resident age - Females - Other Race
Commute - mean travel time to work (minutes)
Travel time to work - Less than 5 minutes (%)
Travel time to work - Less than 5 minutes (% change since 2000)
Travel time to work - 5 to 9 minutes (%)
Travel time to work - 5 to 9 minutes (% change since 2000)
Travel time to work - 10 to 19 minutes (%)
Travel time to work - 10 to 19 minutes (% change since 2000)
Travel time to work - 20 to 29 minutes (%)
Travel time to work - 20 to 29 minutes (% change since 2000)
Travel time to work - 30 to 39 minutes (%)
Travel time to work - 30 to 39 minutes (% change since 2000)
Travel time to work - 40 to 59 minutes (%)
Travel time to work - 40 to 59 minutes (% change since 2000)
Travel time to work - 60 to 89 minutes (%)
Travel time to work - 60 to 89 minutes (% change since 2000)
Travel time to work - 90 or more minutes (%)
Travel time to work - 90 or more minutes (% change since 2000)
Marital status - Never married (%)
Marital status - Now married (%)
Marital status - Separated (%)
Marital status - Widowed (%)
Marital status - Divorced (%)
Median family income ($)
Median family income (% change since 2000)
Median non-family income ($)
Median non-family income (% change since 2000)
Median per capita income ($)
Median per capita income (% change since 2000)
Median family income ($) - White
Median family income ($) - Black or African American
Median family income ($) - Asian
Median family income ($) - Hispanic or Latino
Median family income ($) - American Indian and Alaska Native
Median family income ($) - Multirace
Median family income ($) - Other Race
Median year house/condo built
Median year apartment built
Year house built - Built 2005 or later (%)
Year house built - Built 2000 to 2004 (%)
Year house built - Built 1990 to 1999 (%)
Year house built - Built 1980 to 1989 (%)
Year house built - Built 1970 to 1979 (%)
Year house built - Built 1960 to 1969 (%)
Year house built - Built 1950 to 1959 (%)
Year house built - Built 1940 to 1949 (%)
Year house built - Built 1939 or earlier (%)
Average household size
Household density (households per square mile)
Average household size - White
Average household size - Black or African American
Average household size - Asian
Average household size - Hispanic or Latino
Average household size - American Indian and Alaska Native
Average household size - Multirace
Average household size - Other Race
Occupied housing units (%)
Vacant housing units (%)
Owner occupied housing units (%)
Renter occupied housing units (%)
Vacancy status - For rent (%)
Vacancy status - For sale only (%)
Vacancy status - Rented or sold, not occupied (%)
Vacancy status - For seasonal, recreational, or occasional use (%)
Vacancy status - For migrant workers (%)
Vacancy status - Other vacant (%)
Residents with income below the poverty level (%)
Residents with income below 50% of the poverty level (%)
Children below poverty level (%)
Poor families by family type - Married-couple family (%)
Poor families by family type - Male, no wife present (%)
Poor families by family type - Female, no husband present (%)
Poverty status for native-born residents (%)
Poverty status for foreign-born residents (%)
Poverty among high school graduates not in families (%)
Poverty among people who did not graduate high school not in families (%)
Residents with income below the poverty level (%) - White
Residents with income below the poverty level (%) - Black or African American
Residents with income below the poverty level (%) - Asian
Residents with income below the poverty level (%) - Hispanic or Latino
Residents with income below the poverty level (%) - American Indian and Alaska Native
Residents with income below the poverty level (%) - Multirace
Residents with income below the poverty level (%) - Other Race
Air pollution - Air Quality Index (AQI)
Air pollution - CO
Air pollution - NO2
Air pollution - SO2
Air pollution - Ozone
Air pollution - PM10
Air pollution - PM25
Air pollution - Pb
Crime - Murders per 100,000 population
Crime - Rapes per 100,000 population
Crime - Robberies per 100,000 population
Crime - Assaults per 100,000 population
Crime - Burglaries per 100,000 population
Crime - Thefts per 100,000 population
Crime - Auto thefts per 100,000 population
Crime - Arson per 100,000 population
Crime - City-data.com crime index
Crime - Violent crime index
Crime - Property crime index
Crime - Murders per 100,000 population (5 year average)
Crime - Rapes per 100,000 population (5 year average)
Crime - Robberies per 100,000 population (5 year average)
Crime - Assaults per 100,000 population (5 year average)
Crime - Burglaries per 100,000 population (5 year average)
Crime - Thefts per 100,000 population (5 year average)
Crime - Auto thefts per 100,000 population (5 year average)
Crime - Arson per 100,000 population (5 year average)
Crime - City-data.com crime index (5 year average)
Crime - Violent crime index (5 year average)
Crime - Property crime index (5 year average)
1996 Presidential Elections Results (%) - Democratic Party (Clinton)
1996 Presidential Elections Results (%) - Republican Party (Dole)
1996 Presidential Elections Results (%) - Other
2000 Presidential Elections Results (%) - Democratic Party (Gore)
2000 Presidential Elections Results (%) - Republican Party (Bush)
2000 Presidential Elections Results (%) - Other
2004 Presidential Elections Results (%) - Democratic Party (Kerry)
2004 Presidential Elections Results (%) - Republican Party (Bush)
2004 Presidential Elections Results (%) - Other
2008 Presidential Elections Results (%) - Democratic Party (Obama)
2008 Presidential Elections Results (%) - Republican Party (McCain)
2008 Presidential Elections Results (%) - Other
2012 Presidential Elections Results (%) - Democratic Party (Obama)
2012 Presidential Elections Results (%) - Republican Party (Romney)
2012 Presidential Elections Results (%) - Other
2016 Presidential Elections Results (%) - Democratic Party (Clinton)
2016 Presidential Elections Results (%) - Republican Party (Trump)
2016 Presidential Elections Results (%) - Other
2020 Presidential Elections Results (%) - Democratic Party (Biden)
2020 Presidential Elections Results (%) - Republican Party (Trump)
2020 Presidential Elections Results (%) - Other
Ancestries Reported - Arab (%)
Ancestries Reported - Czech (%)
Ancestries Reported - Danish (%)
Ancestries Reported - Dutch (%)
Ancestries Reported - English (%)
Ancestries Reported - French (%)
Ancestries Reported - French Canadian (%)
Ancestries Reported - German (%)
Ancestries Reported - Greek (%)
Ancestries Reported - Hungarian (%)
Ancestries Reported - Irish (%)
Ancestries Reported - Italian (%)
Ancestries Reported - Lithuanian (%)
Ancestries Reported - Norwegian (%)
Ancestries Reported - Polish (%)
Ancestries Reported - Portuguese (%)
Ancestries Reported - Russian (%)
Ancestries Reported - Scotch-Irish (%)
Ancestries Reported - Scottish (%)
Ancestries Reported - Slovak (%)
Ancestries Reported - Subsaharan African (%)
Ancestries Reported - Swedish (%)
Ancestries Reported - Swiss (%)
Ancestries Reported - Ukrainian (%)
Ancestries Reported - United States (%)
Ancestries Reported - Welsh (%)
Ancestries Reported - West Indian (%)
Ancestries Reported - Other (%)
Educational Attainment - No schooling completed (%)
Educational Attainment - Less than high school (%)
Educational Attainment - High school or equivalent (%)
Educational Attainment - Less than 1 year of college (%)
Educational Attainment - 1 or more years of college (%)
Educational Attainment - Associate degree (%)
Educational Attainment - Bachelor's degree (%)
Educational Attainment - Master's degree (%)
Educational Attainment - Professional school degree (%)
Educational Attainment - Doctorate degree (%)
School Enrollment - Nursery, preschool (%)
School Enrollment - Kindergarten (%)
School Enrollment - Grade 1 to 4 (%)
School Enrollment - Grade 5 to 8 (%)
School Enrollment - Grade 9 to 12 (%)
School Enrollment - College undergrad (%)
School Enrollment - Graduate or professional (%)
School Enrollment - Not enrolled in school (%)
School enrollment - Public schools (%)
School enrollment - Private schools (%)
School enrollment - Not enrolled (%)
Median number of rooms in houses and condos
Median number of rooms in apartments
Housing units lacking complete plumbing facilities (%)
Housing units lacking complete kitchen facilities (%)
Density of houses
Urban houses (%)
Rural houses (%)
Households with people 60 years and over (%)
Households with people 65 years and over (%)
Households with people 75 years and over (%)
Households with one or more nonrelatives (%)
Households with no nonrelatives (%)
Population in households (%)
Family households (%)
Nonfamily households (%)
Population in families (%)
Family households with own children (%)
Median number of bedrooms in owner occupied houses
Mean number of bedrooms in owner occupied houses
Median number of bedrooms in renter occupied houses
Mean number of bedrooms in renter occupied houses
Median number of vehichles in owner occupied houses
Mean number of vehichles in owner occupied houses
Median number of vehichles in renter occupied houses
Mean number of vehichles in renter occupied houses
Mortgage status - with mortgage (%)
Mortgage status - with second mortgage (%)
Mortgage status - with home equity loan (%)
Mortgage status - with both second mortgage and home equity loan (%)
Mortgage status - without a mortgage (%)
Average family size
Average family size - White
Average family size - Black or African American
Average family size - Asian
Average family size - Hispanic or Latino
Average family size - American Indian and Alaska Native
Average family size - Multirace
Average family size - Other Race
Geographical mobility - Same house 1 year ago (%)
Geographical mobility - Moved within same county (%)
Geographical mobility - Moved from different county within same state (%)
Geographical mobility - Moved from different state (%)
Geographical mobility - Moved from abroad (%)
Place of birth - Born in state of residence (%)
Place of birth - Born in other state (%)
Place of birth - Native, outside of US (%)
Place of birth - Foreign born (%)
Housing units in structures - 1, detached (%)
Housing units in structures - 1, attached (%)
Housing units in structures - 2 (%)
Housing units in structures - 3 or 4 (%)
Housing units in structures - 5 to 9 (%)
Housing units in structures - 10 to 19 (%)
Housing units in structures - 20 to 49 (%)
Housing units in structures - 50 or more (%)
Housing units in structures - Mobile home (%)
Housing units in structures - Boat, RV, van, etc. (%)
House/condo owner moved in on average (years ago)
Renter moved in on average (years ago)
Year householder moved into unit - Moved in 1999 to March 2000 (%)
Year householder moved into unit - Moved in 1995 to 1998 (%)
Year householder moved into unit - Moved in 1990 to 1994 (%)
Year householder moved into unit - Moved in 1980 to 1989 (%)
Year householder moved into unit - Moved in 1970 to 1979 (%)
Year householder moved into unit - Moved in 1969 or earlier (%)
Means of transportation to work - Drove car alone (%)
Means of transportation to work - Carpooled (%)
Means of transportation to work - Public transportation (%)
Means of transportation to work - Bus or trolley bus (%)
Means of transportation to work - Streetcar or trolley car (%)
Means of transportation to work - Subway or elevated (%)
Means of transportation to work - Railroad (%)
Means of transportation to work - Ferryboat (%)
Means of transportation to work - Taxicab (%)
Means of transportation to work - Motorcycle (%)
Means of transportation to work - Bicycle (%)
Means of transportation to work - Walked (%)
Means of transportation to work - Other means (%)
Working at home (%)
Industry diversity
Most Common Industries - Agriculture, forestry, fishing and hunting, and mining (%)
Most Common Industries - Agriculture, forestry, fishing and hunting (%)
Most Common Industries - Mining, quarrying, and oil and gas extraction (%)
Most Common Industries - Construction (%)
Most Common Industries - Manufacturing (%)
Most Common Industries - Wholesale trade (%)
Most Common Industries - Retail trade (%)
Most Common Industries - Transportation and warehousing, and utilities (%)
Most Common Industries - Transportation and warehousing (%)
Most Common Industries - Utilities (%)
Most Common Industries - Information (%)
Most Common Industries - Finance and insurance, and real estate and rental and leasing (%)
Most Common Industries - Finance and insurance (%)
Most Common Industries - Real estate and rental and leasing (%)
Most Common Industries - Professional, scientific, and management, and administrative and waste management services (%)
Most Common Industries - Professional, scientific, and technical services (%)
Most Common Industries - Management of companies and enterprises (%)
Most Common Industries - Administrative and support and waste management services (%)
Most Common Industries - Educational services, and health care and social assistance (%)
Most Common Industries - Educational services (%)
Most Common Industries - Health care and social assistance (%)
Most Common Industries - Arts, entertainment, and recreation, and accommodation and food services (%)
Most Common Industries - Arts, entertainment, and recreation (%)
Most Common Industries - Accommodation and food services (%)
Most Common Industries - Other services, except public administration (%)
Most Common Industries - Public administration (%)
Occupation diversity
Most Common Occupations - Management, business, science, and arts occupations (%)
Most Common Occupations - Management, business, and financial occupations (%)
Most Common Occupations - Management occupations (%)
Most Common Occupations - Business and financial operations occupations (%)
Most Common Occupations - Computer, engineering, and science occupations (%)
Most Common Occupations - Computer and mathematical occupations (%)
Most Common Occupations - Architecture and engineering occupations (%)
Most Common Occupations - Life, physical, and social science occupations (%)
Most Common Occupations - Education, legal, community service, arts, and media occupations (%)
Most Common Occupations - Community and social service occupations (%)
Most Common Occupations - Legal occupations (%)
Most Common Occupations - Education, training, and library occupations (%)
Most Common Occupations - Arts, design, entertainment, sports, and media occupations (%)
Most Common Occupations - Healthcare practitioners and technical occupations (%)
Most Common Occupations - Health diagnosing and treating practitioners and other technical occupations (%)
Most Common Occupations - Health technologists and technicians (%)
Most Common Occupations - Service occupations (%)
Most Common Occupations - Healthcare support occupations (%)
Most Common Occupations - Protective service occupations (%)
Most Common Occupations - Fire fighting and prevention, and other protective service workers including supervisors (%)
Most Common Occupations - Law enforcement workers including supervisors (%)
Most Common Occupations - Food preparation and serving related occupations (%)
Most Common Occupations - Building and grounds cleaning and maintenance occupations (%)
Most Common Occupations - Personal care and service occupations (%)
Most Common Occupations - Sales and office occupations (%)
Most Common Occupations - Sales and related occupations (%)
Most Common Occupations - Office and administrative support occupations (%)
Most Common Occupations - Natural resources, construction, and maintenance occupations (%)
Most Common Occupations - Farming, fishing, and forestry occupations (%)
Most Common Occupations - Construction and extraction occupations (%)
Most Common Occupations - Installation, maintenance, and repair occupations (%)
Most Common Occupations - Production, transportation, and material moving occupations (%)
Most Common Occupations - Production occupations (%)
Most Common Occupations - Transportation occupations (%)
Most Common Occupations - Material moving occupations (%)
People in Group quarters - Institutionalized population (%)
People in Group quarters - Correctional institutions (%)
People in Group quarters - Federal prisons and detention centers (%)
People in Group quarters - Halfway houses (%)
People in Group quarters - Local jails and other confinement facilities (including police lockups) (%)
People in Group quarters - Military disciplinary barracks (%)
People in Group quarters - State prisons (%)
People in Group quarters - Other types of correctional institutions (%)
People in Group quarters - Nursing homes (%)
People in Group quarters - Hospitals/wards, hospices, and schools for the handicapped (%)
People in Group quarters - Hospitals/wards and hospices for chronically ill (%)
People in Group quarters - Hospices or homes for chronically ill (%)
People in Group quarters - Military hospitals or wards for chronically ill (%)
People in Group quarters - Other hospitals or wards for chronically ill (%)
People in Group quarters - Hospitals or wards for drug/alcohol abuse (%)
People in Group quarters - Mental (Psychiatric) hospitals or wards (%)
People in Group quarters - Schools, hospitals, or wards for the mentally retarded (%)
People in Group quarters - Schools, hospitals, or wards for the physically handicapped (%)
People in Group quarters - Institutions for the deaf (%)
People in Group quarters - Institutions for the blind (%)
People in Group quarters - Orthopedic wards and institutions for the physically handicapped (%)
People in Group quarters - Wards in general hospitals for patients who have no usual home elsewhere (%)
People in Group quarters - Wards in military hospitals for patients who have no usual home elsewhere (%)
People in Group quarters - Juvenile institutions (%)
People in Group quarters - Long-term care (%)
People in Group quarters - Homes for abused, dependent, and neglected children (%)
People in Group quarters - Residential treatment centers for emotionally disturbed children (%)
People in Group quarters - Training schools for juvenile delinquents (%)
People in Group quarters - Short-term care, detention or diagnostic centers for delinquent children (%)
People in Group quarters - Type of juvenile institution unknown (%)
People in Group quarters - Noninstitutionalized population (%)
People in Group quarters - College dormitories (includes college quarters off campus) (%)
People in Group quarters - Military quarters (%)
People in Group quarters - On base (%)
People in Group quarters - Barracks, unaccompanied personnel housing (UPH), (Enlisted/Officer), ;and similar group living quarters for military personnel (%)
People in Group quarters - Transient quarters for temporary residents (%)
People in Group quarters - Military ships (%)
People in Group quarters - Group homes (%)
People in Group quarters - Homes or halfway houses for drug/alcohol abuse (%)
People in Group quarters - Homes for the mentally ill (%)
People in Group quarters - Homes for the mentally retarded (%)
People in Group quarters - Homes for the physically handicapped (%)
People in Group quarters - Other group homes (%)
People in Group quarters - Religious group quarters (%)
People in Group quarters - Dormitories (%)
People in Group quarters - Agriculture workers' dormitories on farms (%)
People in Group quarters - Job Corps and vocational training facilities (%)
People in Group quarters - Other workers' dormitories (%)
People in Group quarters - Crews of maritime vessels (%)
People in Group quarters - Other nonhousehold living situations (%)
People in Group quarters - Other noninstitutional group quarters (%)
Residents speaking English at home (%)
Residents speaking English at home - Born in the United States (%)
Residents speaking English at home - Native, born elsewhere (%)
Residents speaking English at home - Foreign born (%)
Residents speaking Spanish at home (%)
Residents speaking Spanish at home - Born in the United States (%)
Residents speaking Spanish at home - Native, born elsewhere (%)
Residents speaking Spanish at home - Foreign born (%)
Residents speaking other language at home (%)
Residents speaking other language at home - Born in the United States (%)
Residents speaking other language at home - Native, born elsewhere (%)
Residents speaking other language at home - Foreign born (%)
Class of Workers - Employee of private company (%)
Class of Workers - Self-employed in own incorporated business (%)
Class of Workers - Private not-for-profit wage and salary workers (%)
Class of Workers - Local government workers (%)
Class of Workers - State government workers (%)
Class of Workers - Federal government workers (%)
Class of Workers - Self-employed workers in own not incorporated business and Unpaid family workers (%)
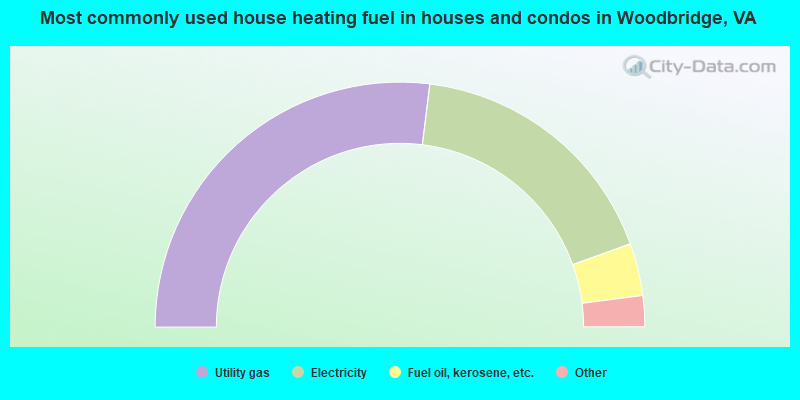
House heating fuel used in houses and condos - Utility gas (%)
House heating fuel used in houses and condos - Bottled, tank, or LP gas (%)
House heating fuel used in houses and condos - Electricity (%)
House heating fuel used in houses and condos - Fuel oil, kerosene, etc. (%)
House heating fuel used in houses and condos - Coal or coke (%)
House heating fuel used in houses and condos - Wood (%)
House heating fuel used in houses and condos - Solar energy (%)
House heating fuel used in houses and condos - Other fuel (%)
House heating fuel used in houses and condos - No fuel used (%)
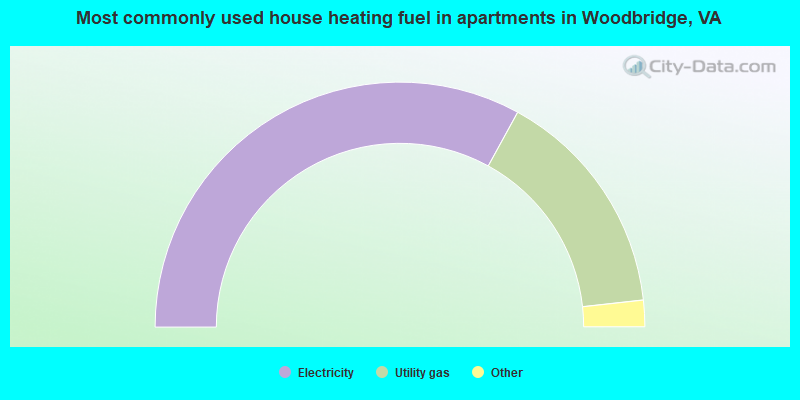
House heating fuel used in apartments - Utility gas (%)
House heating fuel used in apartments - Bottled, tank, or LP gas (%)
House heating fuel used in apartments - Electricity (%)
House heating fuel used in apartments - Fuel oil, kerosene, etc. (%)
House heating fuel used in apartments - Coal or coke (%)
House heating fuel used in apartments - Wood (%)
House heating fuel used in apartments - Solar energy (%)
House heating fuel used in apartments - Other fuel (%)
House heating fuel used in apartments - No fuel used (%)
Armed forces status - In Armed Forces (%)
Armed forces status - Civilian (%)
Armed forces status - Civilian - Veteran (%)
Armed forces status - Civilian - Nonveteran (%)
Fatal accidents locations in years 2005-2021
Fatal accidents locations in 2005
Fatal accidents locations in 2006
Fatal accidents locations in 2007
Fatal accidents locations in 2008
Fatal accidents locations in 2009
Fatal accidents locations in 2010
Fatal accidents locations in 2011
Fatal accidents locations in 2012
Fatal accidents locations in 2013
Fatal accidents locations in 2014
Fatal accidents locations in 2015
Fatal accidents locations in 2016
Fatal accidents locations in 2017
Fatal accidents locations in 2018
Fatal accidents locations in 2019
Fatal accidents locations in 2020
Fatal accidents locations in 2021
Alcohol use - People drinking some alcohol every month (%)
Alcohol use - People not drinking at all (%)
Alcohol use - Average days/month drinking alcohol
Alcohol use - Average drinks/week
Alcohol use - Average days/year people drink much
Audiometry - Average condition of hearing (%)
Audiometry - People that can hear a whisper from across a quiet room (%)
Audiometry - People that can hear normal voice from across a quiet room (%)
Audiometry - Ears ringing, roaring, buzzing (%)
Audiometry - Had a job exposure to loud noise (%)
Audiometry - Had off-work exposure to loud noise (%)
Blood Pressure & Cholesterol - Has high blood pressure (%)
Blood Pressure & Cholesterol - Checking blood pressure at home (%)
Blood Pressure & Cholesterol - Frequently checking blood cholesterol (%)
Blood Pressure & Cholesterol - Has high cholesterol level (%)
Consumer Behavior - Money monthly spent on food at supermarket/grocery store
Consumer Behavior - Money monthly spent on food at other stores
Consumer Behavior - Money monthly spent on eating out
Consumer Behavior - Money monthly spent on carryout/delivered foods
Consumer Behavior - Income spent on food at supermarket/grocery store (%)
Consumer Behavior - Income spent on food at other stores (%)
Consumer Behavior - Income spent on eating out (%)
Consumer Behavior - Income spent on carryout/delivered foods (%)
Current Health Status - General health condition (%)
Current Health Status - Blood donors (%)
Current Health Status - Has blood ever tested for HIV virus (%)
Current Health Status - Left-handed people (%)
Dermatology - People using sunscreen (%)
Diabetes - Diabetics (%)
Diabetes - Had a blood test for high blood sugar (%)
Diabetes - People taking insulin (%)
Diet Behavior & Nutrition - Diet health (%)
Diet Behavior & Nutrition - Milk product consumption (# of products/month)
Diet Behavior & Nutrition - Meals not home prepared (#/week)
Diet Behavior & Nutrition - Meals from fast food or pizza place (#/week)
Diet Behavior & Nutrition - Ready-to-eat foods (#/month)
Diet Behavior & Nutrition - Frozen meals/pizza (#/month)
Drug Use - People that ever used marijuana or hashish (%)
Drug Use - Ever used hard drugs (%)
Drug Use - Ever used any form of cocaine (%)
Drug Use - Ever used heroin (%)
Drug Use - Ever used methamphetamine (%)
Health Insurance - People covered by health insurance (%)
Kidney Conditions-Urology - Avg. # of times urinating at night
Medical Conditions - People with asthma (%)
Medical Conditions - People with anemia (%)
Medical Conditions - People with psoriasis (%)
Medical Conditions - People with overweight (%)
Medical Conditions - Elderly people having difficulties in thinking or remembering (%)
Medical Conditions - People who ever received blood transfusion (%)
Medical Conditions - People having trouble seeing even with glass/contacts (%)
Medical Conditions - People with arthritis (%)
Medical Conditions - People with gout (%)
Medical Conditions - People with congestive heart failure (%)
Medical Conditions - People with coronary heart disease (%)
Medical Conditions - People with angina pectoris (%)
Medical Conditions - People who ever had heart attack (%)
Medical Conditions - People who ever had stroke (%)
Medical Conditions - People with emphysema (%)
Medical Conditions - People with thyroid problem (%)
Medical Conditions - People with chronic bronchitis (%)
Medical Conditions - People with any liver condition (%)
Medical Conditions - People who ever had cancer or malignancy (%)
Mental Health - People who have little interest in doing things (%)
Mental Health - People feeling down, depressed, or hopeless (%)
Mental Health - People who have trouble sleeping or sleeping too much (%)
Mental Health - People feeling tired or having little energy (%)
Mental Health - People with poor appetite or overeating (%)
Mental Health - People feeling bad about themself (%)
Mental Health - People who have trouble concentrating on things (%)
Mental Health - People moving or speaking slowly or too fast (%)
Mental Health - People having thoughts they would be better off dead (%)
Oral Health - Average years since last visit a dentist
Oral Health - People embarrassed because of mouth (%)
Oral Health - People with gum disease (%)
Oral Health - General health of teeth and gums (%)
Oral Health - Average days a week using dental floss/device
Oral Health - Average days a week using mouthwash for dental problem
Oral Health - Average number of teeth
Pesticide Use - Households using pesticides to control insects (%)
Pesticide Use - Households using pesticides to kill weeds (%)
Physical Activity - People doing vigorous-intensity work activities (%)
Physical Activity - People doing moderate-intensity work activities (%)
Physical Activity - People walking or bicycling (%)
Physical Activity - People doing vigorous-intensity recreational activities (%)
Physical Activity - People doing moderate-intensity recreational activities (%)
Physical Activity - Average hours a day doing sedentary activities
Physical Activity - Average hours a day watching TV or videos
Physical Activity - Average hours a day using computer
Physical Functioning - People having limitations keeping them from working (%)
Physical Functioning - People limited in amount of work they can do (%)
Physical Functioning - People that need special equipment to walk (%)
Physical Functioning - People experiencing confusion/memory problems (%)
Physical Functioning - People requiring special healthcare equipment (%)
Prescription Medications - Average number of prescription medicines taking
Preventive Aspirin Use - Adults 40+ taking low-dose aspirin (%)
Reproductive Health - Vaginal deliveries (%)
Reproductive Health - Cesarean deliveries (%)
Reproductive Health - Deliveries resulted in a live birth (%)
Reproductive Health - Pregnancies resulted in a delivery (%)
Reproductive Health - Women breastfeeding newborns (%)
Reproductive Health - Women that had a hysterectomy (%)
Reproductive Health - Women that had both ovaries removed (%)
Reproductive Health - Women that have ever taken birth control pills (%)
Reproductive Health - Women taking birth control pills (%)
Reproductive Health - Women that have ever used Depo-Provera or injectables (%)
Reproductive Health - Women that have ever used female hormones (%)
Sexual Behavior - People 18+ that ever had sex (vaginal, anal, or oral) (%)
Sexual Behavior - Males 18+ that ever had vaginal sex with a woman (%)
Sexual Behavior - Males 18+ that ever performed oral sex on a woman (%)
Sexual Behavior - Males 18+ that ever had anal sex with a woman (%)
Sexual Behavior - Males 18+ that ever had any sex with a man (%)
Sexual Behavior - Females 18+ that ever had vaginal sex with a man (%)
Sexual Behavior - Females 18+ that ever performed oral sex on a man (%)
Sexual Behavior - Females 18+ that ever had anal sex with a man (%)
Sexual Behavior - Females 18+ that ever had any kind of sex with a woman (%)
Sexual Behavior - Average age people first had sex
Sexual Behavior - Average number of female sex partners in lifetime (males 18+)
Sexual Behavior - Average number of female vaginal sex partners in lifetime (males 18+)
Sexual Behavior - Average age people first performed oral sex on a woman (18+)
Sexual Behavior - Average number of woman performed oral sex on in lifetime (18+)
Sexual Behavior - Average number of male sex partners in lifetime (males 18+)
Sexual Behavior - Average number of male anal sex partners in lifetime (males 18+)
Sexual Behavior - Average age people first performed oral sex on a man (18+)
Sexual Behavior - Average number of male oral sex partners in lifetime (18+)
Sexual Behavior - People using protection when performing oral sex (%)
Sexual Behavior - Average number of times people have vaginal or anal sex a year
Sexual Behavior - People having sex without condom (%)
Sexual Behavior - Average number of male sex partners in lifetime (females 18+)
Sexual Behavior - Average number of male vaginal sex partners in lifetime (females 18+)
Sexual Behavior - Average number of female sex partners in lifetime (females 18+)
Sexual Behavior - Circumcised males 18+ (%)
Sleep Disorders - Average hours sleeping at night
Sleep Disorders - People that has trouble sleeping (%)
Smoking-Cigarette Use - People smoking cigarettes (%)
Taste & Smell - People 40+ having problems with smell (%)
Taste & Smell - People 40+ having problems with taste (%)
Taste & Smell - People 40+ that ever had wisdom teeth removed (%)
Taste & Smell - People 40+ that ever had tonsils teeth removed (%)
Taste & Smell - People 40+ that ever had a loss of consciousness because of a head injury (%)
Taste & Smell - People 40+ that ever had a broken nose or other serious injury to face or skull (%)
Taste & Smell - People 40+ that ever had two or more sinus infections (%)
Weight - Average height (inches)
Weight - Average weight (pounds)
Weight - Average BMI
Weight - People that are obese (%)
Weight - People that ever were obese (%)
Weight - People trying to lose weight (%)
Latest news from Woodbridge, VA collected exclusively by city-data.com from local newspapers, TV, and radio stations
Woodbridge, VA City Guides: Ancestries: Ethiopian (6.7%), Ghanaian (4.8%), American (2.6%), Afghan (2.4%), German (1.7%), Polish (1.2%).
Current Local Time:
Land area: 10.5 square miles.
Population density: 387 people per square mile (very low).
16,437 residents are foreign born (20.8% Latin America , 8.4% Africa , 7.9% Asia ).
This place:
38.1%Virginia:
12.6%
Median real estate property taxes paid for housing units with mortgages in 2022: $3,709 (0.9%)Median real estate property taxes paid for housing units with no mortgage in 2022: $3,865 (1.0%)
Nearest city with pop. 50,000+: Dale City, VA
Nearest city with pop. 200,000+: Washington, DC
Nearest city with pop. 1,000,000+: Philadelphia, PA
Nearest cities:
Latitude: 38.64 N, Longitude: 77.26 W
Daytime population change due to commuting: -5,912 (-13.7%)Workers who live and work in this place: 6,882 (29.5%)
Area code commonly used in this area: 703
Property values in Woodbridge, VA
Unemployment in December 2023:
Most common occupations in Woodbridge, VA (%)
Both Males Females
Other office and administrative support workers, including supervisors (4.5%)
Other management occupations, except farmers and farm managers (4.4%)
Computer specialists (4.0%)
Building and grounds cleaning and maintenance occupations (4.0%)
Secretaries and administrative assistants (3.7%)
Other sales and related occupations, including supervisors (3.5%)
Retail sales workers, except cashiers (3.3%)
Electrical equipment mechanics and other installation, maintenance, and repair workers, including supervisors (5.3%)
Computer specialists (5.0%)
Driver/sales workers and truck drivers (4.2%)
Other management occupations, except farmers and farm managers (4.2%)
Vehicle and mobile equipment mechanics, installers, and repairers (4.0%)
Building and grounds cleaning and maintenance occupations (4.0%)
Construction traders workers except carpenters, electricians, painters, plumbers, and construction laborers (3.9%)
Secretaries and administrative assistants (7.8%)
Other office and administrative support workers, including supervisors (6.6%)
Other management occupations, except farmers and farm managers (4.6%)
Retail sales workers, except cashiers (4.2%)
Cashiers (4.2%)
Building and grounds cleaning and maintenance occupations (4.1%)
Child care workers (3.8%)
Tornado activity:
Woodbridge-area historical tornado activity is above Virginia state average. It is 6% greater than the overall U.S. average.
On 4/28/2002, a category F4 (max. wind speeds 207-260 mph) tornado 7.8 miles away from the Woodbridge place center killed 3 people and injured 122 people and caused $124 million in damages.
On 9/24/2001, a category F4 tornado 31.2 miles away from the place center injured 2 people and caused $2 million in damages.
Earthquake activity:
Woodbridge-area historical earthquake activity is significantly above Virginia state average. It is 55% smaller than the overall U.S. average. On 8/23/2011 at 17:51:04, a magnitude 5.8 (5.8 MW, Depth: 3.7 mi, Class: Moderate, Intensity: VI - VII) earthquake occurred 62.6 miles away from Woodbridge center On 8/25/2011 at 05:07:52, a magnitude 4.5 (4.5 ML, Depth: 4.2 mi, Class: Light, Intensity: IV - V) earthquake occurred 61.6 miles away from Woodbridge center On 12/9/2003 at 20:59:18, a magnitude 4.5 (4.5 ML, Depth: 6.2 mi) earthquake occurred 75.5 miles away from Woodbridge center On 12/9/2003 at 20:59:14, a magnitude 4.5 (4.5 MB, 4.5 LG) earthquake occurred 81.0 miles away from the city center On 1/16/1994 at 01:49:16, a magnitude 4.6 (4.6 MB, 4.6 LG, Depth: 3.1 mi) earthquake occurred 133.7 miles away from the city center On 9/25/1998 at 19:52:52, a magnitude 5.2 (4.8 MB, 4.3 MS, 5.2 LG, 4.5 MW, Depth: 3.1 mi) earthquake occurred 257.5 miles away from the city center Magnitude types: regional Lg-wave magnitude (LG), body-wave magnitude (MB), local magnitude (ML), surface-wave magnitude (MS), moment magnitude (MW) Natural disasters: The number of natural disasters in Prince William County (14) is near the US average (15).Major Disasters (Presidential) Declared: 10Emergencies Declared: 4Winter Storms: 5, Hurricanes: 4, Snowstorms: 3, Tropical Storms: 2, Blizzard: 1, Drought: 1, Other: 1 (Note: some incidents may be assigned to more than one category). Hospitals and medical centers in Woodbridge: SENTARA NORTHERN VIRGINIA MEDICAL CENTER (Voluntary non-profit - Private, 2300 OPITZ BOULEVARD) ENVOY OF WOODBRIDGE, LLC (14906 JEFFERSON DAVIS HIGHWAY)
WOODBRIDGE NURS CTR INC (14906 JEFFERSON DAVIS HGY)
CDC - WOODBRIDGE (2751 KILLARNEY DR)
FMC - POTOMAC MILLS (3057 GOLANSKY BLVD)
RENAL CAREPARTNERS - WOODBRIDGE (14000 CROWN CT STE 110)
BESTCARE HOME CARE INC (2070 OLD BRIDGE RD, SUITE 202)
LOVING CARE AND MORE (2000 OPTIZ BOULEVARD SUITE 214-B)
SENTARA HOME CARE SERVICES (3985 PRINCE WILLIAM PARKWAY, SUITE 204)
Amtrak station: WOODBRIDGE (1040 EXPRESS WAY)
.
Services: partially wheelchair accessible, public payphones, vending machines, paid short-term parking, call for taxi service, public transit connection.
Colleges/Universities in Woodbridge: Everest College-Woodbridge Full-time enrollment: 527; Location: 14555 Potomac Mills Rd; Private, for-profit; Website: www.everest.edu/campus/woodbridge?)
Paul Mitchell the School-Woodbridge Full-time enrollment: 91; Location: 14445 Potomac Mills Road; Private, for-profit; Website: woodbridge.paulmitchell.edu/)
Colleges/universities with over 2000 students nearest to Woodbridge:
George Mason University (about 14 miles; Fairfax, VA ; Full-time enrollment: 26,002)
Northern Virginia Community College (about 14 miles; Annandale, VA ; FT enrollment: 35,721)
College of Southern Maryland (about 15 miles; La Plata, MD ; FT enrollment: 5,775)
Stratford University (about 17 miles; Fairfax, VA ; FT enrollment: 2,570)
Medtech Institute (about 17 miles; Falls Church, VA ; FT enrollment: 2,900)
Marymount University (about 20 miles; Arlington, VA ; FT enrollment: 3,361)
Strayer University-Virginia (about 20 miles; Arlington, VA ; FT enrollment: 7,005)
Public high schools in Woodbridge: WOODBRIDGE HIGH Students: 2,661, Location: 3001 OLD BRIDGE RD, Grades: 9-12)GAR-FIELD HIGH Students: 2,654, Location: 14000 SMOKETOWN RD, Grades: PK-12)FOREST PARK HIGH Students: 2,354, Location: 15721 FOREST PARK DRIVE, Grades: 9-12)C.D. HYLTON HIGH Students: 2,212, Location: 14051 SPRIGGS RD, Grades: PK-12)FREEDOM HIGH Location: 15201 NEABSCO MILLS RD., Grades: PK-12)
Private high schools in Woodbridge: CHRIST CHAPEL ACADEMY Students: 557, Location: 13909 SMOKETOWN RD, Grades: PK-12)
HERITAGE CHRISTIAN SCHOOL Students: 340, Location: 14510 SPRIGGS RD, Grades: PK-12)
RICHARD MILBURN HIGH SCHOOL Students: 7, Location: 3460 COMMISSION CT # 200, Grades: 11-12)
CHESAPEAKE ACADEMY Students: 3, Location: 3480 COMMISSION CT, Grades: KG-12)
Biggest public elementary/middle schools in Woodbridge: LAKE RIDGE MIDDLE Students: 1,189, Location: 12350 MOHICAN RD, Grades: 6-8)STUART M. BEVILLE MIDDLE Students: 1,098, Location: 4901 DALE BLVD, Grades: 6-8)WOODBRIDGE MIDDLE Students: 920, Location: 2201 YORK DR, Grades: 6-8)MILLS E. GODWIN MIDDLE Students: 904, Location: 14800 DARBYDALE AVENUE, Grades: 6-8)LEESYLVANIA ELEM Students: 903, Location: 15800 NEABSCO RD, Grades: PK-5)FRED M. LYNN MIDDLE Students: 888, Location: 1650 PRINCE WILLIAM PARKWAY, Grades: 6-8)RIPPON MIDDLE Students: 847, Location: 15101 BLACKBURN RD, Grades: 6-8)NEABSCO ELEM Students: 818, Location: 3800 CORDELL AVE, Grades: PK-5)SPRINGWOODS ELEM Students: 634, Location: 3815 MARQUIS PLACE, Grades: PK-5)OCCOQUAN ELEM Students: 617, Location: 12915 OCCOQUAN RD, Grades: PK-5)Private elementary/middle schools in Woodbridge: ST THOMAS AQUINAS REGIONAL SCHOOL Students: 492, Location: 13750 MARYS WAY, Grades: PK-8)
CLOVERDALE SCHOOL Students: 137, Location: 13506 MINNIEVILLE RD, Grades: PK-2)
CARDINAL MONTESSORI SCHOOL Students: 125, Location: 1424 G ST, Grades: PK-6)
MORNING STAR CHILD DEVELOPMENT CENTER Students: 75, Location: 14001 SMOKETOWN RD, Grades: PK-4)
VICTORY CHRISTIAN PRESCHOOL & ACADEMY Students: 69, Location: 14747 ARIZONA AVE, Grades: PK-6)
See full list of schools located in Woodbridge User-submitted facts and corrections:
Cary Christian Academy, Private High School, 5023 Davis Ford Road, 250 Students, Grades K4-12
Churches Trinity Temple Church of God added by Jessica
Troy University, about 21 miles: Arlington, VA (New Campus: Offers Undergraduate, Graduate, and Online)
Notable locations in Woodbridge: (A) , Rippon Virginia Railway Express Station (B) , Market at Opitz Crossing (C) , H. L. Mooney Water Reclamation Facility (D) , Potomac Town Center (E) , Marumsco Creek Community Center (F) , Diamond Laboratories (G) , Rippon Lodge (H) , Rippon Landing Apartments (I) , Occoquan - Woodbridge - Lorton Volunteer Fire Department Station 2 (J) , Occoquan - Woodbridge - Lorton Volunteer Fire Department Station 12 (K) , Potomac Community Library (L) . Display/hide their locations on the map
Shopping Centers: (1) , Bridgewood Shopping Center (2) , Woodbridge Shopping Center (3) , Prince William Plaza Shopping Center (4) , Potomac Plaza Shopping Center (5) , Marumsco Plaza Shopping Center (6) , Lynwood Shopping Center (7) , Jefferson Plaza Shopping Center (8) , Gordon Plaza Shopping Center (9) . Display/hide their locations on the map
Churches in Woodbridge include: (A) , Church of God (B) , First Baptist Church of Woodbridge (C) , Good Shepherd Lutheran Church (D) , Saint Margarets Episcopal Church (E) , Woodbridge Church of the Brethren (F) , Saint Pauls Church (G) , Cokesbury Church (H) , Covenant Church (I) . Display/hide their locations on the map
Reservoir: (A) . Display/hide its location on the map
Creeks: (A) , Easy Creek (B) , Marumsco Creek (C) . Display/hide their locations on the map
Parks in Woodbridge include: (1) , Rippon Landing Park (2) , Hylbrook Park (3) , Lancaster Park (4) , Marumsco Acre Lake Park (5) , Marumsco National Wildlife Refuge (6) , Riverbend Park (7) , Veterans Memorial Park (8) . Display/hide their locations on the map
Tourist attractions:
Hotels:
Court:
Birthplace of: Brian Bates (soccer) - Soccer player, Trevor McEachron - Soccer player, Aaron Andrews - College basketball player (Morgan State Golden Bears), Brian Fitzgerald (baseball) - Baseball player, Chris Vann - College basketball player (Mt. St. Marys Mountaineers), Daniel Fountain - College basketball player (NC Wilmington Seahawks), Donnell Sands - College football player (Hampton Pirates), Haley Webb - Actor, Jeff Allen - College football player (Maryland Terrapins), Jimmy Little (carpenter) - Television personality.
Prince William County has a predicted average indoor radon screening level between 2 and 4 pCi/L (pico curies per liter) - Moderate Potential Drinking water stations with addresses in Woodbridge and their reported violations in the past:
BULL RUN MOUNTAIN/EVERGREEN (BRME) (Population served: 1,641, Groundwater):
Past monitoring violations:
One regular monitoring violation
Population served: 60, Groundwater):
Past health violations:
MCL, Monthly (TCR) - Between OCT-2012 and DEC-2012, Contaminant: Coliform. Follow-up actions: St Compliance achieved (NOV-14-2012), St Public Notif requested (NOV-27-2012), St Formal NOV issued (NOV-27-2012)
MCL, Monthly (TCR) - Between JUL-2010 and SEP-2010, Contaminant: Coliform. Follow-up actions: St Compliance achieved (OCT-08-2010), St Public Notif requested (OCT-22-2010), St Formal NOV issued (OCT-22-2010), St Public Notif received (NOV-03-2010)
MCL, Monthly (TCR) - In DEC-2007, Contaminant: Coliform. Follow-up actions: St Formal NOV issued (DEC-21-2007), St Public Notif requested (DEC-21-2007), St Public Notif received (JAN-04-2008), St Compliance achieved (JUL-30-2008)
MCL, Monthly (TCR) - Between APR-2005 and JUN-2005, Contaminant: Coliform. Follow-up actions: St Public Notif requested (JUL-18-2005), St Formal NOV issued (JUL-18-2005), St Public Notif received (AUG-03-2005), St Compliance achieved (JUL-19-2006)
Past monitoring violations:
8 routine major monitoring violations
One minor monitoring violation
One regular monitoring violation
Drinking water stations with addresses in Woodbridge that have no violations reported:
EAST END SERVICE AREA - PWCSA (Population served: 133,426, Primary Water Source Type: Purch surface water)
Average household size: This place:
2.4 peopleVirginia:
2.5 people
Percentage of family households: This place:
63.8%Whole state:
67.0%
Percentage of households with unmarried partners: This place:
6.5%Whole state:
5.7%
Likely homosexual households (counted as self-reported same-sex unmarried-partner households)
Lesbian couples: 0.5% of all households Gay men: 0.4% of all households
14 people in residential treatment centers for juveniles (non-correctional) in 2010People in group quarters in Woodbridge in 2000:
200 people in nursing homes
52 people in other noninstitutional group quarters
4 people in religious group quarters
Banks with most branches in Woodbridge (2011 data):
Wells Fargo Bank, National Association: Tacketts Mill, Woodbridge Branch, Manaport Branch, Smoketown Plaza Branch, County Center Branch, Port Potomac Branch. Info updated 2011/04/05: Bank assets: $1,161,490.0 mil, Deposits: $905,653.0 mil, headquarters in Sioux Falls, SD, positive income , 6395 total offices , Holding Company: Wells Fargo & Company
Branch Banking and Trust Company: Marumsco Plaza Branch, River Oaks Branch, Old Bridge Branch, Opitz Crossing Branch, Noblewood Branch, Mapledale Plaza Branch. Info updated 2010/03/29: Bank assets: $168,867.6 mil, Deposits: $127,549.5 mil, headquarters in Winston Salem, NC, positive income , Commercial Lending Specialization, 1793 total offices , Holding Company: Bb&T Corporation
Bank of America, National Association: Potomac Mills Branch, Lake Ridge Branch, Prince William Parkway Branch, Woodbridge Branch. Info updated 2009/11/18: Bank assets: $1,451,969.3 mil, Deposits: $1,077,176.8 mil, headquarters in Charlotte, NC, positive income , 5782 total offices , Holding Company: Bank Of America Corporation
PNC Bank, National Association: Potomac Town Center, Lake Ridge @ Giant Branch, Hoadly Branch. Info updated 2012/03/20: Bank assets: $263,309.6 mil, Deposits: $197,343.0 mil, headquarters in Wilmington, DE, positive income , Commercial Lending Specialization, 3085 total offices , Holding Company: Pnc Financial Services Group, Inc., The
Cardinal Bank: Woodbridge Parkway at 14000 Jefferson Davis Highway, branch established on 2005/06/27; Woodbridge Branch at 13870 Smoketown Road - (Dale City), branch established on 2003/12/15. Info updated 2006/11/03: Bank assets: $2,594.6 mil, Deposits: $1,808.7 mil, headquarters in Mc Lean, VA, positive income , Commercial Lending Specialization, 28 total offices , Holding Company: Cardinal Financial Corporation
Capital One, National Association: Opitz Crossing Branch at 2079 Daniel Stuart Drive, branch established on 1998/12/04; Glen Shopping Center Branch at 4229 Merchant Plaza, branch established on 1997/04/10. Info updated 2011/07/01: Bank assets: $133,477.8 mil, Deposits: $97,063.7 mil, headquarters in Mclean, VA, positive income , 984 total offices , Holding Company: Capital One Financial Corporation
Burke & Herbert Bank & Trust Company: Reid's Prospect Branch at 4605 Daisy Reid Avenue, branch established on 2011/12/12; Smoketown Road Branch at 14008 Smoketown Road, branch established on 2004/10/01. Info updated 2010/05/12: Bank assets: $2,461.7 mil, Deposits: $2,022.3 mil, headquarters in Alexandria, VA, positive income , Commercial Lending Specialization, 25 total offices
SunTrust Bank: Woodbridge Branch at 13408 Jefferson Davis Highway, branch established on 1971/06/01; Lake Ridge Branch at 12417 Dillingham Square, branch established on 1990/03/03. Info updated 2010/05/27: Bank assets: $171,291.7 mil, Deposits: $129,833.2 mil, headquarters in Atlanta, GA, positive income , Commercial Lending Specialization, 1716 total offices , Holding Company: Suntrust Banks, Inc.
Manufacturers and Traders Trust Company: Lake Ridge Branch at 12451 Hedges Run Drive, branch established on 2002/10/15. Info updated 2011/08/08: Bank assets: $76,887.1 mil, Deposits: $60,064.2 mil, headquarters in Buffalo, NY, positive income , Commercial Lending Specialization, 808 total offices , Holding Company: M&T Bank Corporation
For population 15 years and over in Woodbridge:
Never married: 37.1%Now married: 45.0%Separated: 4.3%Widowed: 3.2%Divorced: 10.3% For population 25 years and over in Woodbridge:
High school or higher: 84.5%Bachelor's degree or higher: 31.8%Graduate or professional degree: 11.5%Unemployed: 3.9%Mean travel time to work (commute): 28.4 minutes
Education Gini index (Inequality in education) Here:
16.2Virginia average:
12.1
Religion statistics for Woodbridge, VA (based on Prince William County data)
Religion Adherents Congregations Catholic 59,551 6 Evangelical Protestant 36,833 131 Other 23,214 22 Mainline Protestant 18,644 29 Black Protestant 6,926 10 None 256,834 -
Source: Clifford Grammich, Kirk Hadaway, Richard Houseal, Dale E.Jones, Alexei Krindatch, Richie Stanley and Richard H.Taylor. 2012. 2010 U.S.Religion Census: Religious Congregations & Membership Study. Association of Statisticians of American Religious Bodies. Jones, Dale E., et al. 2002. Congregations and Membership in the United States 2000. Nashville, TN: Glenmary Research Center. Graphs represent county-level data
Food Environment Statistics: Number of grocery stores : 64Prince William County :
1.78 / 10,000 pop.State :
2.03 / 10,000 pop.
Number of supercenters and club stores : 4Here :
0.11 / 10,000 pop.Virginia :
0.17 / 10,000 pop.
Number of convenience stores (no gas) : 43This county :
1.20 / 10,000 pop.State :
1.43 / 10,000 pop.
Number of convenience stores (with gas) : 92This county :
2.56 / 10,000 pop.Virginia :
4.03 / 10,000 pop.
Number of full-service restaurants : 197This county :
5.48 / 10,000 pop.State :
7.65 / 10,000 pop.
Adult diabetes rate : Prince William County :
8.7%Virginia :
9.3%
Adult obesity rate : This county :
28.2%State :
26.7%
Low-income preschool obesity rate : This county :
25.9%Virginia :
18.6%
Health and Nutrition: Healthy diet rate : Woodbridge:
50.3%Virginia:
50.6%
Average overall health of teeth and gums : Woodbridge:
50.8%Virginia:
48.6%
Average BMI : Woodbridge:
28.3State:
28.6
People feeling badly about themselves : Woodbridge:
18.1%Virginia:
20.2%
People not drinking alcohol at all : Average hours sleeping at night : This city:
6.7Virginia:
6.8
Overweight people : Woodbridge:
32.0%State:
33.5%
General health condition : Woodbridge:
59.2%Virginia:
57.4%
Average condition of hearing : This city:
82.9%Virginia:
80.5%
More about Health and Nutrition of Woodbridge, VA Residents
9.70% of this county's 2021 resident taxpayers lived in other counties in 2020 ($73,434 average adjusted gross income )
Here:
9.70%Virginia average:
10.16%
0.13% of residents moved from foreign countries ($1,263 average AGI )Prince William County:
0.13%Virginia average:
0.12%
Top counties from which taxpayers relocated into this county between 2020 and 2021:
10.41% of this county's 2020 resident taxpayers moved to other counties in 2021 ($82,245 average adjusted gross income )
Here:
10.41%Virginia average:
10.20%
0.11% of residents moved to foreign countries ($1,088 average AGI )Prince William County:
0.11%Virginia average:
0.09%
Top counties to which taxpayers relocated from this county between 2020 and 2021:
Businesses in Woodbridge, VA
Name Count Name Count
7-Eleven 12 LA Fitness 2 ALDI 2 Lane Bryant 1 AMF Bowling 1 LensCrafters 1 AT&T 6 Levi Strauss & Co. 1 Advance Auto Parts 3 Lowe's 1 Applebee's 1 Marriott 4 Arby's 1 Marshalls 1 Ashley Furniture 1 MasterBrand Cabinets 13 AutoZone 1 Mazda 1 Avenue 1 McDonald's 7 Bally Total Fitness 1 Men's Wearhouse 1 Banana Republic 1 New Balance 1 Baskin-Robbins 2 Nike 21 Bed Bath & Beyond 1 Nissan 1 Best Western 1 Nordstrom 1 Blockbuster 2 Old Country Buffet 1 Brooks Brothers 1 Old Navy 1 Buffalo Wild Wings 1 Olive Garden 1 Burger King 2 On The Border 1 CVS 4 Outback 1 CarMax 1 Outback Steakhouse 1 Casual Male XL 1 Pac Sun 1 Catherines 1 Panda Express 1 Chevrolet 1 Panera Bread 2 Chick-Fil-A 1 Papa John's Pizza 2 Chipotle 1 Payless 1 Clarks 1 Penske 1 Cold Stone Creamery 1 PetSmart 1 ColorTyme 1 Pier 1 Imports 1 Costco 1 Pizza Hut 2 Cricket Wireless 6 Popeyes 2 DHL 2 Qdoba Mexican Grill 1 Dairy Queen 3 Quality 1 Decora Cabinetry 2 Quiznos 3 Dennys 1 RadioShack 3 Domino's Pizza 4 Red Lobster 1 DressBarn 1 Red Robin 1 Dressbarn 1 Rodeway Inn 1 Dunkin Donuts 2 Ruby Tuesday 1 Econo Lodge 1 Safeway 3 Fashion Bug 1 Sam's Club 1 FedEx 21 Sears 2 Firestone Complete Auto Care 1 Sleep Inn 1 Foot Locker 1 Spencer Gifts 1 Ford 1 Sprint Nextel 2 GNC 2 Staples 1 GameStop 3 Starbucks 4 Gymboree 2 Subway 7 H&M 1 T-Mobile 5 H&R Block 5 T.G.I. Driday's 1 Havertys Furniture 1 T.J.Maxx 1 Hilton 1 Taco Bell 3 Holiday Inn 1 Talbots 1 Home Depot 1 Target 1 Honda 1 The Room Place 1 Hot Topic 1 Toyota 1 Hyundai 1 Toys"R"Us 3 IHOP 1 U-Haul 3 IKEA 1 UPS 13 J.Crew 1 Value City Furniture 1 JCPenney 1 Vans 2 JoS. A. Bank 1 Verizon Wireless 2 Journeys 1 Volkswagen 1 Juicy Couture 1 Vons 3 Justice 1 Walgreens 1 KFC 3 Walmart 1 Kmart 1 Wendy's 4 Kohl's 1
Strongest AM radio stations in Woodbridge:
WKDL (730 AM; 8 kW; ALEXANDRIA, VA; Owner: MEGA COMMUNICATIONS OF ALEXANDRIA LICENSEE, LLC)
WWGB (1030 AM; daytime; 50 kW; INDIAN HEAD, MD; Owner: GOOD BODY MEDIA, LLC)
WPWC (1480 AM; 5 kW; DUMFRIES-TRIANGLE, VA; Owner: JMK COMMUNICATIONS, INC)
WTEM (980 AM; 50 kW; WASHINGTON, DC; Owner: AMFM RADIO LICENSES, L.L.C.)
WPGC (1580 AM; 50 kW; MORNINGSIDE, MD; Owner: INFINITY WPGC(AM), INC.)
WUST (1120 AM; daytime; 20 kW; WASHINGTON, DC)
WKCW (1420 AM; 50 kW; WARRENTON, VA; Owner: WAY BROADCASTING, INC.)
WTOP (1500 AM; 50 kW; WASHINGTON, DC; Owner: BONNEVILLE HOLDING COMPANY)
WMET (1150 AM; 50 kW; GAITHERSBURG, MD; Owner: BELTWAY ACQUISITION CORPORATION)
WCBM (680 AM; 50 kW; BALTIMORE, MD; Owner: WCBM MARYLAND, INC.)
WBIS (1190 AM; 50 kW; ANNAPOLIS, MD; Owner: NATIONS RADIO, LLC)
WDCT (1310 AM; 5 kW; FAIRFAX, VA; Owner: FAMILY RADIO, LTD.)
WABS (780 AM; daytime; 5 kW; ARLINGTON, VA; Owner: SALEM MEDIA OF VIRGINIA, INC.)
Strongest FM radio stations in Woodbridge:
WJFK-FM (106.7 FM; MANASSAS, VA; Owner: INFINITY BROADCASTING CORP. OF WASHINGTON, DC)
WJZW (105.9 FM; WOODBRIDGE, VA; Owner: WMAL, INC.)
WWZZ (104.1 FM; WALDORF, MD; Owner: BONNEVILLE HOLDING COMPANY)
WMZQ-FM (98.7 FM; WASHINGTON, DC; Owner: AMFM RADIO LICENSES, L.L.C.)
WETA (90.9 FM; WASHINGTON, DC; Owner: GREATER WASHINGTON EDUCATIONAL TELECOMMUNICATIONS ASSN.)
WGTS (91.9 FM; TAKOMA PARK, MD; Owner: COLUMBIA UNION COLLEGE BROADCASTING, INC.)
WRQX (107.3 FM; WASHINGTON, DC; Owner: WMAL, INC.)
WHUR-FM (96.3 FM; WASHINGTON, DC; Owner: THE HOWARD UNIVERSITY)
WASH (97.1 FM; WASHINGTON, DC; Owner: AMFM RADIO LICENSES, L.L.C.)
WARW (94.7 FM; BETHESDA, MD; Owner: INFINITY BROADCASTING OPERATIONS, INC.)
WIHT (99.5 FM; WASHINGTON, DC; Owner: AMFM RADIO LICENSES, L.L.C.)
WKYS (93.9 FM; WASHINGTON, DC; Owner: RADIO ONE LICENSES, LLC)
WAVA (105.1 FM; ARLINGTON, VA; Owner: SALEM MEDIA OF VIRGINIA, INC.)
WPER (89.9 FM; CULPEPER, VA; Owner: POSITIVE ALTERNATIVE RADIO INC.)
WWDC-FM (101.1 FM; WASHINGTON, DC; Owner: AMFM RADIO LICENSES, L.L.C.)
WINC-FM (92.5 FM; WINCHESTER, VA; Owner: MID ATLANTIC NETWORK, INC.)
WGMS-FM (103.5 FM; WASHINGTON, DC; Owner: BONNEVILLE HOLDING COMPANY)
WAMU (88.5 FM; WASHINGTON, DC; Owner: THE EXEC. COMM. OF THE BD. OF TRUSTEES OF AMERICAN UNIV.)
WBIG-FM (100.3 FM; WASHINGTON, DC; Owner: AMFM RADIO LICENSES, L.L.C.)
WPGC-FM (95.5 FM; MORNINGSIDE, MD; Owner: INFINITY BROADCASTING CORPORATION OF MARYLAND)
TV broadcast stations around Woodbridge:
WNVT (Channel 53; GOLDVEIN, VA; Owner: COMMONWEALTH PUBLIC BROADCASTING CORPORATION)
WPXW (Channel 66; MANASSAS, VA; Owner: PAXSON WASHINGTON LICENSE, INC.)
WNVC (Channel 56; FAIRFAX, VA; Owner: COMMONWEALTH PUBLIC BROADCASTING CORPORATION)
WJLA-TV (Channel 7; WASHINGTON, DC; Owner: ACC LICENSEE, INC.)
WUSA (Channel 9; WASHINGTON, DC; Owner: THE DETROIT NEWS, INC.)
WTTG (Channel 5; WASHINGTON, DC; Owner: FOX TELEVISION STATIONS, INC.)
WIAV-LP (Channel 58; WASHINGTON, DC; Owner: ASIAVISION, INC.)
WETA-TV (Channel 26; WASHINGTON, DC; Owner: THE GREATER WASHINGTON ED TELECOMM. ASSOC)
WHUT-TV (Channel 32; WASHINGTON, DC; Owner: HOWARD UNIVERSITY)
WDCA (Channel 20; WASHINGTON, DC; Owner: FOX TELEVISION STATIONS, INC.)
WBDC-TV (Channel 50; WASHINGTON, DC; Owner: WBDC BROADCASTING, INC.)
WRC-TV (Channel 4; WASHINGTON, DC; Owner: NBC SUBSIDIARY (WRC-TV), INC.)
W42BE (Channel 42; FAIRFAX, VA; Owner: FAIRFAX LOW POWER CO.)
W28BY (Channel 63; BALTIMORE, MD; Owner: INFORMATION SUPER STATION, L.L.C.)
WZDC-LP (Channel 64; WASHINGTON, DC; Owner: ONDA CAPITAL, INC.)
WMDO-CA (Channel 30; WASHINGTON, DC; Owner: ENTRAVISION HOLDINGS, LLC)
National Bridge Inventory (NBI) Statistics 32 Number of bridges659ft / 201m Total length $4,440,000 Total costs908,861 Total average daily traffic41,580 Total average daily truck traffic
New bridges - historical statistics
1 1950-1959 6 1960-1969 3 1970-1979 3 1980-1989 14 1990-1999 2 2000-2009 3 2010-2019
See full National Bridge Inventory statistics for Woodbridge, VA
Home Mortgage Disclosure Act Aggregated Statistics For Year 2009(Based on 4 full and 1 partial tracts) A) FHA, FSA/RHS & VA B) Conventional C) Refinancings D) Home Improvement Loans F) Non-occupant Loans on G) Loans On Manufactured Number Average Value Number Average Value Number Average Value Number Average Value Number Average Value Number Average Value
LOANS ORIGINATED 775 $222,485 244 $158,816 477 $255,841 10 $84,503 82 $131,147 1 $242,000 APPLICATIONS APPROVED, NOT ACCEPTED 56 $220,773 21 $157,882 40 $216,664 4 $44,018 8 $116,238 2 $57,185 APPLICATIONS DENIED 139 $209,261 65 $141,374 300 $238,842 19 $27,491 38 $148,794 4 $46,890 APPLICATIONS WITHDRAWN 106 $199,378 66 $146,963 145 $239,788 3 $136,560 29 $143,472 0 $0 FILES CLOSED FOR INCOMPLETENESS 20 $174,571 15 $154,450 55 $222,455 3 $70,030 11 $196,011 0 $0
Aggregated Statistics For Year 2008(Based on 4 full and 1 partial tracts) A) FHA, FSA/RHS & VA B) Conventional C) Refinancings D) Home Improvement Loans F) Non-occupant Loans on G) Loans On Manufactured Number Average Value Number Average Value Number Average Value Number Average Value Number Average Value Number Average Value
LOANS ORIGINATED 728 $230,594 372 $182,754 285 $220,697 40 $71,955 116 $142,483 7 $46,070 APPLICATIONS APPROVED, NOT ACCEPTED 49 $247,465 62 $208,175 77 $225,367 19 $61,073 14 $139,497 4 $50,000 APPLICATIONS DENIED 124 $208,784 121 $170,242 418 $260,216 58 $76,969 50 $153,842 13 $56,260 APPLICATIONS WITHDRAWN 120 $237,631 92 $228,410 170 $268,542 14 $143,269 30 $216,608 1 $235,720 FILES CLOSED FOR INCOMPLETENESS 12 $229,212 13 $209,348 35 $224,774 5 $78,354 5 $162,386 0 $0
Aggregated Statistics For Year 2007(Based on 4 full and 1 partial tracts) A) FHA, FSA/RHS & VA B) Conventional C) Refinancings D) Home Improvement Loans F) Non-occupant Loans on G) Loans On Manufactured Number Average Value Number Average Value Number Average Value Number Average Value Number Average Value Number Average Value
LOANS ORIGINATED 110 $326,191 868 $247,808 814 $236,332 99 $117,384 120 $234,511 4 $53,668 APPLICATIONS APPROVED, NOT ACCEPTED 6 $314,890 132 $226,600 219 $251,057 33 $78,675 22 $253,835 4 $37,798 APPLICATIONS DENIED 15 $297,478 323 $263,473 691 $277,000 99 $124,369 78 $262,508 23 $49,855 APPLICATIONS WITHDRAWN 13 $301,312 196 $233,452 306 $282,531 28 $162,811 29 $279,932 0 $0 FILES CLOSED FOR INCOMPLETENESS 1 $277,200 25 $310,444 109 $308,476 12 $114,827 9 $332,133 0 $0
Aggregated Statistics For Year 2006(Based on 4 full and 1 partial tracts) A) FHA, FSA/RHS & VA B) Conventional C) Refinancings D) Home Improvement Loans E) Loans on Dwellings For 5+ Families F) Non-occupant Loans on G) Loans On Manufactured Number Average Value Number Average Value Number Average Value Number Average Value Number Average Value Number Average Value Number Average Value
LOANS ORIGINATED 35 $353,587 1,854 $237,358 1,563 $250,959 176 $129,319 0 $0 279 $256,029 3 $57,553 APPLICATIONS APPROVED, NOT ACCEPTED 2 $286,675 185 $232,521 244 $235,592 25 $103,317 0 $0 38 $213,956 5 $34,784 APPLICATIONS DENIED 4 $286,285 345 $227,686 675 $259,875 129 $121,098 2 $145,425 77 $236,894 11 $47,555 APPLICATIONS WITHDRAWN 2 $321,850 263 $271,828 473 $252,622 48 $193,583 0 $0 45 $276,312 1 $113,850 FILES CLOSED FOR INCOMPLETENESS 1 $274,690 68 $241,762 99 $289,017 8 $212,715 1 $302,260 4 $221,902 0 $0
Aggregated Statistics For Year 2005(Based on 4 full and 1 partial tracts) A) FHA, FSA/RHS & VA B) Conventional C) Refinancings D) Home Improvement Loans E) Loans on Dwellings For 5+ Families F) Non-occupant Loans on G) Loans On Manufactured Number Average Value Number Average Value Number Average Value Number Average Value Number Average Value Number Average Value Number Average Value
LOANS ORIGINATED 21 $267,302 2,319 $232,614 1,841 $228,699 208 $143,801 1 $1,073,160 392 $243,568 4 $118,328 APPLICATIONS APPROVED, NOT ACCEPTED 0 $0 213 $221,091 214 $213,425 24 $181,706 0 $0 38 $228,029 2 $67,500 APPLICATIONS DENIED 1 $233,000 466 $220,752 629 $226,913 146 $101,296 0 $0 85 $226,608 20 $53,371 APPLICATIONS WITHDRAWN 3 $229,967 214 $239,760 429 $212,044 60 $139,887 0 $0 49 $243,596 2 $53,705 FILES CLOSED FOR INCOMPLETENESS 0 $0 57 $269,155 98 $242,906 4 $85,282 0 $0 11 $257,780 0 $0
Aggregated Statistics For Year 2004(Based on 4 full and 1 partial tracts) A) FHA, FSA/RHS & VA B) Conventional C) Refinancings D) Home Improvement Loans F) Non-occupant Loans on G) Loans On Manufactured Number Average Value Number Average Value Number Average Value Number Average Value Number Average Value Number Average Value
LOANS ORIGINATED 120 $220,644 1,591 $198,316 1,655 $180,618 150 $81,266 225 $176,926 10 $29,615 APPLICATIONS APPROVED, NOT ACCEPTED 7 $197,714 112 $184,726 210 $175,641 24 $87,645 10 $202,875 9 $53,320 APPLICATIONS DENIED 18 $209,414 307 $177,901 572 $180,038 180 $68,653 42 $181,585 27 $46,383 APPLICATIONS WITHDRAWN 11 $185,931 155 $212,597 445 $171,257 29 $123,134 31 $193,084 0 $0 FILES CLOSED FOR INCOMPLETENESS 2 $234,135 45 $227,204 96 $179,997 13 $71,452 7 $153,837 0 $0
Aggregated Statistics For Year 2003(Based on 4 full and 1 partial tracts) A) FHA, FSA/RHS & VA B) Conventional C) Refinancings D) Home Improvement Loans E) Loans on Dwellings For 5+ Families F) Non-occupant Loans on Number Average Value Number Average Value Number Average Value Number Average Value Number Average Value Number Average Value
LOANS ORIGINATED 303 $196,582 871 $184,928 2,311 $146,894 97 $40,544 1 $420,000 176 $133,890 APPLICATIONS APPROVED, NOT ACCEPTED 12 $191,862 79 $159,766 346 $139,122 26 $24,963 0 $0 12 $124,862 APPLICATIONS DENIED 12 $201,297 118 $158,847 635 $143,324 109 $23,846 0 $0 38 $124,089 APPLICATIONS WITHDRAWN 39 $188,241 98 $192,678 444 $144,994 15 $37,046 0 $0 30 $133,193 FILES CLOSED FOR INCOMPLETENESS 7 $152,976 20 $146,294 179 $170,776 6 $52,295 0 $0 2 $110,260
Aggregated Statistics For Year 2002(Based on 4 full and 1 partial tracts) A) FHA, FSA/RHS & VA B) Conventional C) Refinancings D) Home Improvement Loans F) Non-occupant Loans on Number Average Value Number Average Value Number Average Value Number Average Value Number Average Value
LOANS ORIGINATED 362 $161,719 782 $158,576 1,212 $134,191 78 $34,562 105 $116,636 APPLICATIONS APPROVED, NOT ACCEPTED 18 $151,033 91 $146,087 190 $121,342 31 $27,997 15 $111,391 APPLICATIONS DENIED 16 $150,466 127 $116,142 487 $115,703 96 $25,898 22 $88,351 APPLICATIONS WITHDRAWN 25 $150,130 68 $161,629 274 $111,907 18 $29,283 14 $118,666 FILES CLOSED FOR INCOMPLETENESS 6 $134,755 25 $170,320 61 $138,601 2 $12,425 4 $92,315
Aggregated Statistics For Year 2001(Based on 4 full and 1 partial tracts) A) FHA, FSA/RHS & VA B) Conventional C) Refinancings D) Home Improvement Loans E) Loans on Dwellings For 5+ Families F) Non-occupant Loans on Number Average Value Number Average Value Number Average Value Number Average Value Number Average Value Number Average Value
LOANS ORIGINATED 390 $137,919 464 $137,327 706 $118,188 79 $24,010 1 $366,300 52 $96,782 APPLICATIONS APPROVED, NOT ACCEPTED 11 $120,933 52 $101,467 74 $95,453 21 $38,978 0 $0 4 $112,738 APPLICATIONS DENIED 21 $120,980 85 $97,710 306 $81,787 106 $21,498 0 $0 20 $55,244 APPLICATIONS WITHDRAWN 19 $144,526 63 $133,593 207 $103,889 30 $34,336 0 $0 11 $117,342 FILES CLOSED FOR INCOMPLETENESS 3 $115,757 2 $163,010 35 $104,510 7 $19,904 0 $0 1 $89,100
Aggregated Statistics For Year 2000(Based on 4 full and 1 partial tracts) A) FHA, FSA/RHS & VA B) Conventional C) Refinancings D) Home Improvement Loans F) Non-occupant Loans on Number Average Value Number Average Value Number Average Value Number Average Value Number Average Value
LOANS ORIGINATED 350 $114,931 288 $129,718 160 $85,184 62 $25,632 19 $65,612 APPLICATIONS APPROVED, NOT ACCEPTED 12 $91,542 26 $63,992 55 $89,737 35 $20,683 2 $13,720 APPLICATIONS DENIED 28 $99,257 106 $69,970 234 $61,061 118 $25,323 10 $53,548 APPLICATIONS WITHDRAWN 23 $110,468 62 $118,483 108 $73,620 17 $32,010 3 $32,987 FILES CLOSED FOR INCOMPLETENESS 5 $98,266 8 $115,538 13 $98,868 0 $0 0 $0
Aggregated Statistics For Year 1999(Based on 3 full and 2 partial tracts) A) FHA, FSA/RHS & VA B) Conventional C) Refinancings D) Home Improvement Loans E) Loans on Dwellings For 5+ Families F) Non-occupant Loans on Number Average Value Number Average Value Number Average Value Number Average Value Number Average Value Number Average Value
LOANS ORIGINATED 213 $107,508 211 $128,869 367 $91,982 72 $16,613 1 $268,000 41 $65,100 APPLICATIONS APPROVED, NOT ACCEPTED 2 $123,000 33 $94,537 71 $85,014 17 $16,534 0 $0 5 $71,036 APPLICATIONS DENIED 29 $118,207 78 $64,720 235 $71,295 75 $14,543 0 $0 23 $69,607 APPLICATIONS WITHDRAWN 29 $110,723 37 $125,393 134 $84,723 21 $61,015 0 $0 4 $71,742 FILES CLOSED FOR INCOMPLETENESS 6 $121,215 6 $107,395 28 $85,488 0 $0 0 $0 0 $0
Detailed HMDA statistics for the following Tracts:
9001.00
, 9002.00 , 9005.00 , 9006.00 , 9007.00
Private Mortgage Insurance Companies Aggregated Statistics For Year 2009(Based on 4 full and 1 partial tracts) A) Conventional B) Refinancings C) Non-occupant Loans on D) Loans On Manufactured Number Average Value Number Average Value Number Average Value Number Average Value
LOANS ORIGINATED 48 $194,030 9 $221,669 1 $119,760 0 $0 APPLICATIONS APPROVED, NOT ACCEPTED 20 $223,648 2 $359,500 0 $0 0 $0 APPLICATIONS DENIED 16 $192,943 3 $227,297 3 $95,050 1 $95,050 APPLICATIONS WITHDRAWN 5 $179,304 2 $210,500 0 $0 0 $0 FILES CLOSED FOR INCOMPLETENESS 4 $116,200 0 $0 1 $114,060 0 $0
Aggregated Statistics For Year 2008(Based on 4 full and 1 partial tracts) A) Conventional B) Refinancings C) Non-occupant Loans on Number Average Value Number Average Value Number Average Value
LOANS ORIGINATED 138 $243,621 27 $262,619 14 $189,740 APPLICATIONS APPROVED, NOT ACCEPTED 70 $286,873 30 $323,711 3 $275,097 APPLICATIONS DENIED 11 $134,447 8 $252,725 9 $141,077 APPLICATIONS WITHDRAWN 9 $178,807 2 $237,820 2 $175,975 FILES CLOSED FOR INCOMPLETENESS 4 $188,248 3 $293,587 2 $340,380
Aggregated Statistics For Year 2007(Based on 4 full and 1 partial tracts) A) Conventional B) Refinancings C) Non-occupant Loans on Number Average Value Number Average Value Number Average Value
LOANS ORIGINATED 121 $297,245 66 $328,547 7 $237,533 APPLICATIONS APPROVED, NOT ACCEPTED 9 $320,214 16 $364,248 2 $364,515 APPLICATIONS DENIED 5 $328,778 1 $301,540 0 $0 APPLICATIONS WITHDRAWN 6 $305,373 8 $312,270 2 $318,255 FILES CLOSED FOR INCOMPLETENESS 1 $216,710 1 $299,410 0 $0
Aggregated Statistics For Year 2006(Based on 4 full and 1 partial tracts) A) Conventional B) Refinancings C) Non-occupant Loans on Number Average Value Number Average Value Number Average Value
LOANS ORIGINATED 32 $386,397 45 $381,955 2 $443,885 APPLICATIONS APPROVED, NOT ACCEPTED 5 $323,740 12 $303,829 1 $271,840 APPLICATIONS DENIED 1 $650,000 6 $374,107 1 $352,640 APPLICATIONS WITHDRAWN 4 $436,980 5 $390,718 1 $109,890 FILES CLOSED FOR INCOMPLETENESS 0 $0 1 $295,000 0 $0
Aggregated Statistics For Year 2005(Based on 4 full and 1 partial tracts) A) Conventional B) Refinancings C) Non-occupant Loans on D) Loans On Manufactured Number Average Value Number Average Value Number Average Value Number Average Value
LOANS ORIGINATED 91 $316,786 47 $298,302 17 $280,990 0 $0 APPLICATIONS APPROVED, NOT ACCEPTED 11 $314,944 12 $227,877 2 $228,255 1 $213,860 APPLICATIONS DENIED 1 $265,000 1 $294,030 0 $0 0 $0 APPLICATIONS WITHDRAWN 5 $213,200 5 $271,944 1 $144,000 0 $0 FILES CLOSED FOR INCOMPLETENESS 0 $0 0 $0 0 $0 0 $0
Aggregated Statistics For Year 2004(Based on 4 full and 1 partial tracts) A) Conventional B) Refinancings C) Non-occupant Loans on D) Loans On Manufactured Number Average Value Number Average Value Number Average Value Number Average Value
LOANS ORIGINATED 195 $231,378 45 $209,726 33 $181,678 0 $0 APPLICATIONS APPROVED, NOT ACCEPTED 26 $237,839 17 $180,998 8 $233,030 0 $0 APPLICATIONS DENIED 7 $228,229 2 $255,045 2 $248,000 0 $0 APPLICATIONS WITHDRAWN 9 $194,208 5 $183,460 1 $149,960 0 $0 FILES CLOSED FOR INCOMPLETENESS 1 $140,580 1 $111,000 1 $111,000 1 $140,580
Aggregated Statistics For Year 2003(Based on 4 full and 1 partial tracts) A) Conventional B) Refinancings C) Non-occupant Loans on Number Average Value Number Average Value Number Average Value
LOANS ORIGINATED 198 $197,083 132 $173,874 38 $157,022 APPLICATIONS APPROVED, NOT ACCEPTED 19 $207,198 39 $170,955 6 $151,023 APPLICATIONS DENIED 4 $188,492 2 $144,045 2 $168,100 APPLICATIONS WITHDRAWN 10 $192,230 11 $162,475 2 $206,525 FILES CLOSED FOR INCOMPLETENESS 0 $0 0 $0 0 $0
Aggregated Statistics For Year 2002(Based on 4 full and 1 partial tracts) A) Conventional B) Refinancings C) Non-occupant Loans on Number Average Value Number Average Value Number Average Value
LOANS ORIGINATED 185 $168,599 77 $156,538 18 $143,119 APPLICATIONS APPROVED, NOT ACCEPTED 18 $187,477 17 $151,902 2 $128,000 APPLICATIONS DENIED 11 $191,510 3 $146,207 2 $126,305 APPLICATIONS WITHDRAWN 5 $147,404 5 $163,234 1 $130,680 FILES CLOSED FOR INCOMPLETENESS 0 $0 0 $0 0 $0
Aggregated Statistics For Year 2001(Based on 4 full and 1 partial tracts) A) Conventional B) Refinancings C) Non-occupant Loans on Number Average Value Number Average Value Number Average Value
LOANS ORIGINATED 120 $141,208 43 $129,997 6 $96,448 APPLICATIONS APPROVED, NOT ACCEPTED 12 $127,632 6 $98,133 0 $0 APPLICATIONS DENIED 3 $190,637 2 $192,730 1 $323,170 APPLICATIONS WITHDRAWN 2 $96,330 2 $173,895 1 $80,790 FILES CLOSED FOR INCOMPLETENESS 0 $0 0 $0 0 $0
Aggregated Statistics For Year 2000(Based on 4 full and 1 partial tracts) A) Conventional B) Refinancings C) Non-occupant Loans on Number Average Value Number Average Value Number Average Value
LOANS ORIGINATED 54 $114,101 11 $101,218 3 $75,423 APPLICATIONS APPROVED, NOT ACCEPTED 7 $187,706 2 $143,755 0 $0 APPLICATIONS DENIED 3 $151,803 0 $0 0 $0 APPLICATIONS WITHDRAWN 3 $157,390 1 $108,000 0 $0 FILES CLOSED FOR INCOMPLETENESS 0 $0 1 $107,910 0 $0
Aggregated Statistics For Year 1999(Based on 3 full and 2 partial tracts) A) Conventional B) Refinancings C) Non-occupant Loans on Number Average Value Number Average Value Number Average Value
LOANS ORIGINATED 57 $133,957 39 $115,708 4 $90,255 APPLICATIONS APPROVED, NOT ACCEPTED 7 $155,897 10 $106,790 1 $80,140 APPLICATIONS DENIED 1 $105,710 4 $95,405 0 $0 APPLICATIONS WITHDRAWN 1 $83,000 2 $141,790 0 $0 FILES CLOSED FOR INCOMPLETENESS 1 $194,100 0 $0 0 $0
Detailed PMIC statistics for the following Tracts:
9001.00
, 9002.00 , 9005.00 , 9006.00 , 9007.00 Fire-safe hotels and motels in Woodbridge, Virginia:
Sleep Inn, 14080 Shoppers Best Way, Woodbridge, Virginia 22192 Phone: (703) 580-9200, Fax: (703) 670-0870
Fairfield Inn Potomac Mills, 2610 Prince William Pkwy, Woodbridge, Virginia 22192 Phone: (703) 497-4000, Fax: (703) 497-4009
Courtyard Potomac Mills, 14300 Crossing Pl, Woodbridge, Virginia 22192 Phone: (703) 491-4525, Fax: (703) 491-0550
Residence Inn Potomac Mills, 14301 Crossing Pl, Woodbridge, Virginia 22192 Phone: (703) 490-4020, Fax: (703) 490-4021
Holiday Inn Express Hotel & Suites, 14030 Telegraph Rd, Woodbridge, Virginia 22192 Phone: (703) 576-1600, Fax: (703) 576-1605
Country Inn & Suites, 2621 Prince William Pkwy, Woodbridge, Virginia 22192 Phone: (703) 492-6868, Fax: (708) 492-6869
Econo Lodge Woodbridge, 13317 Gordon Blvd, Woodbridge, Virginia 22191 Phone: (703) 491-5196
Rodeway Inn, 13964 Jefferson Davis Hwy, Woodbridge, Virginia 22191 Phone: (703) 494-4144
8 other hotels and motels
All 16 fire-safe hotels and motels in Woodbridge, Virginia
Most common first names in Woodbridge, VA among deceased individuals Name Count Lived (average)
Mary 257 76.3 years John 244 70.0 years William 212 69.1 years James 209 68.5 years Robert 193 67.8 years George 125 72.7 years Charles 118 68.4 years Helen 110 78.0 years Margaret 102 77.6 years Joseph 95 67.7 years
Most common last names in Woodbridge, VA among deceased individuals Last name Count Lived (average)
Smith 85 71.5 years Williams 78 69.7 years Johnson 65 75.1 years Davis 62 70.0 years Brown 58 67.5 years Jones 54 74.2 years Miller 42 67.9 years Harris 37 70.5 years Moore 34 73.7 years Thompson 31 77.7 years
Woodbridge compared to Virginia state average:
Unemployed percentage significantly below state average. Black race population percentage above state average. Hispanic race population percentage significantly above state average. Foreign-born population percentage significantly above state average. Length of stay since moving in significantly above state average. Woodbridge on our top lists :
#4 on the list of "Top 100 cities with declining populations from 2000 to 2014"
#27 on the list of "Top 101 cities with the most residents born in Africa, n.e.c. (population 500+)"
#43 on the list of "Top 101 cities with the most residents born in Pakistan (population 500+)"
#88 on the list of "Top 101 cities with the most residents born in El Salvador (population 500+)"
#5 on the list of "Top 101 counties with the largest number of children under 18 without health insurance coverage in 2000 (pop. 50,000+)"
#26 on the list of "Top 101 counties with the lowest Nitrogen Dioxide air pollution readings in 2012 (ppm)"
#35 on the list of "Top 101 counties with the highest number of births per 1000 residents 2007-2013"
#40 on the list of "Top 101 counties with the lowest number of deaths per 1000 residents 2007-2013"
#41 on the list of "Top 101 counties with the largest increase in the number of infant deaths per 1000 residents 2000-2006 to 2007-2013 (pop. 50,000+)"
Top Patent Applicants
Leslie Brandon Shaw (24)
Dallas N. Barr (12)
Richard Kelley (8)
L. Brandon Shaw (6)
Trent Ridder (5)
Justin C. Biffinger (5)
Charles Louis Fuqua (5)
Edward Curren (4)
John C. Moore (4)
William L. Siegel (4)
Total of 273 patent applications in 2008-2024.
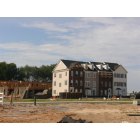
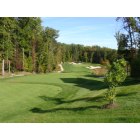

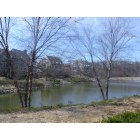


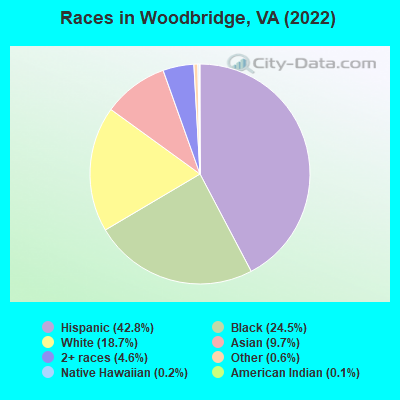
 Recent articles from our blog. Our writers, many of them Ph.D. graduates or candidates, create easy-to-read articles on a wide variety of topics.

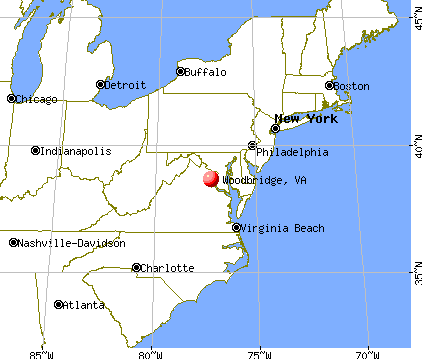
 (4.4 miles
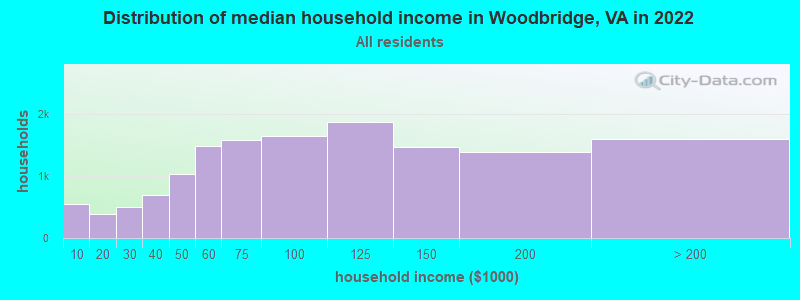
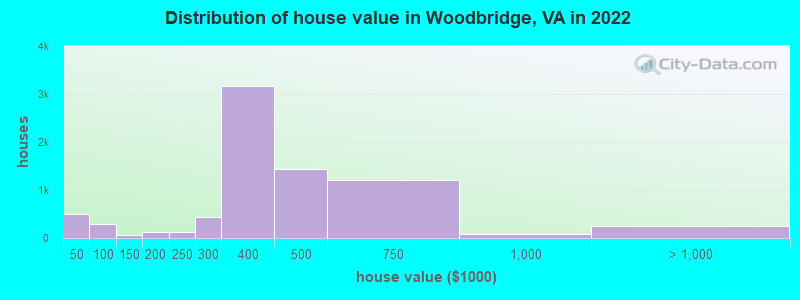
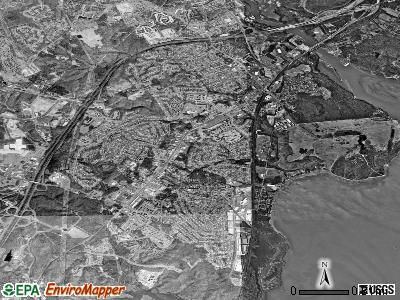
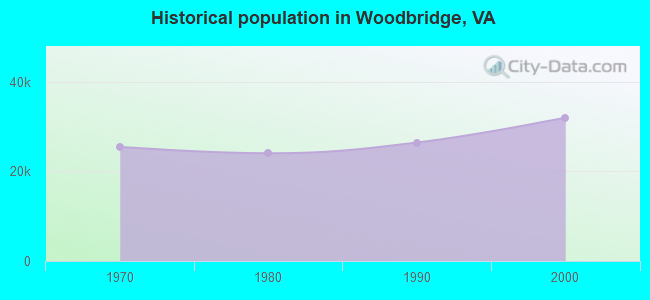
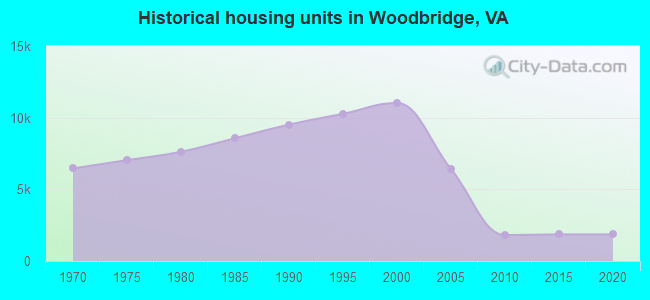
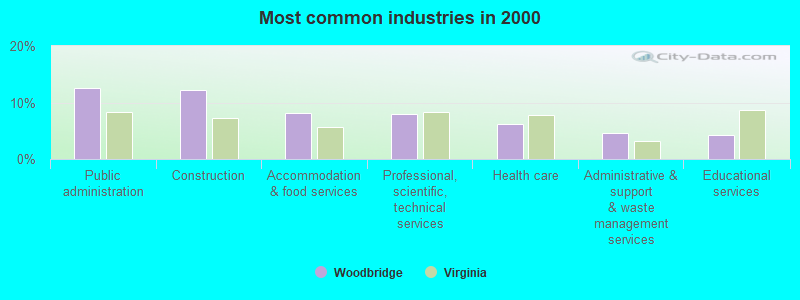
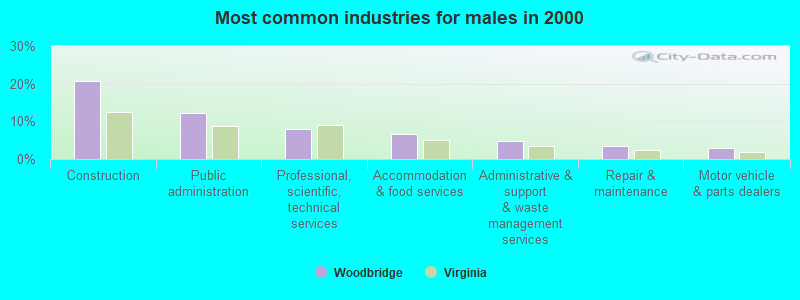
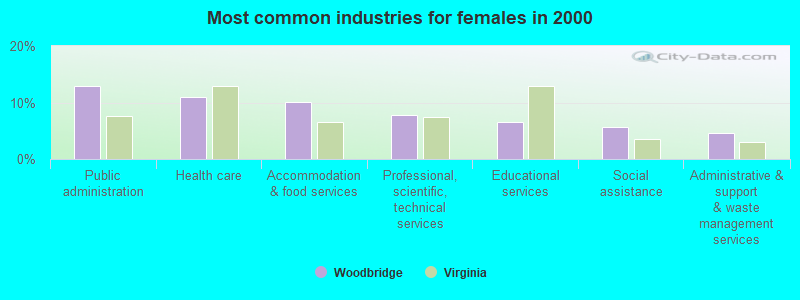
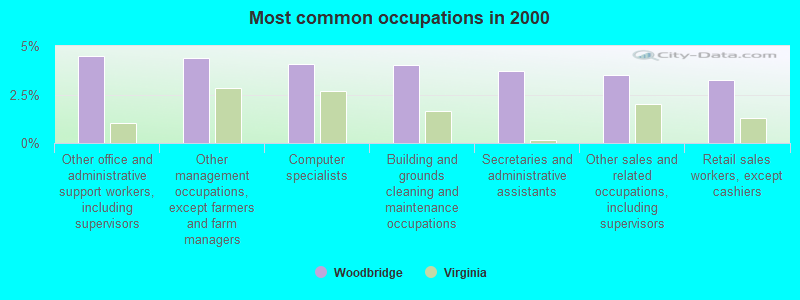
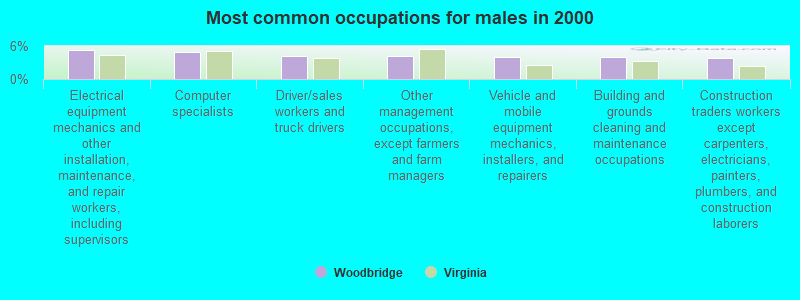
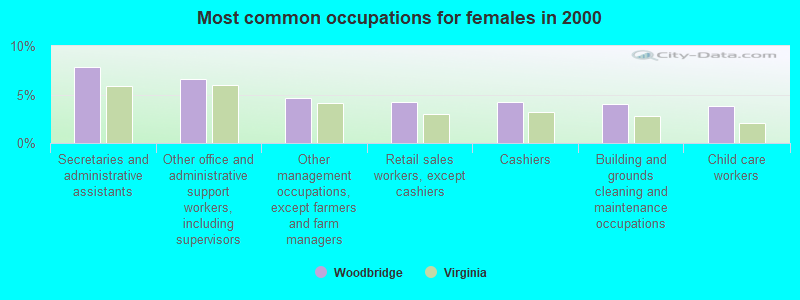
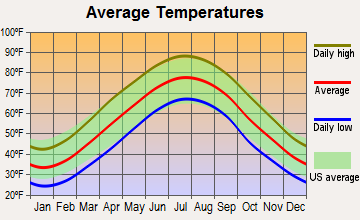
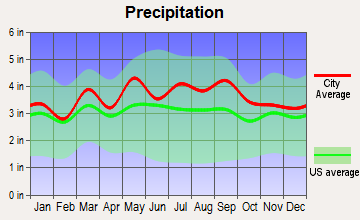
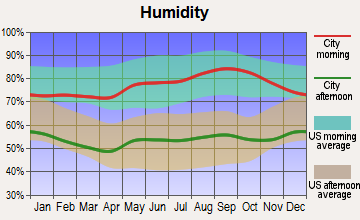
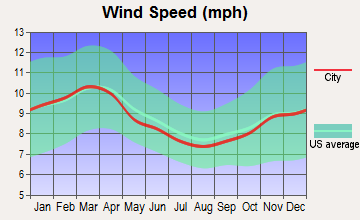
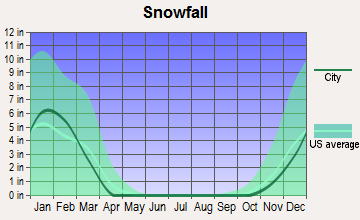
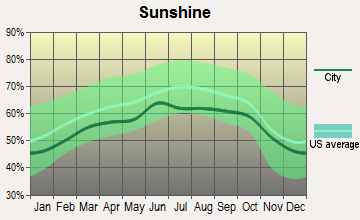
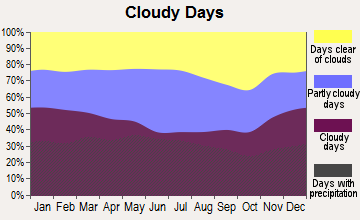


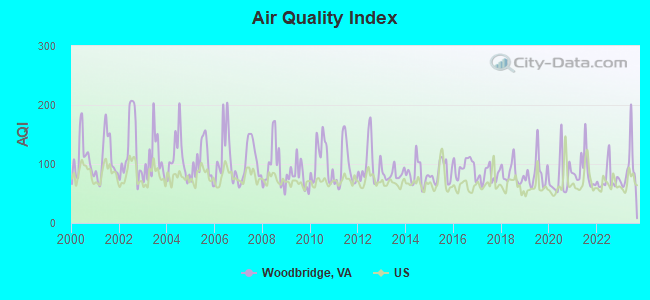
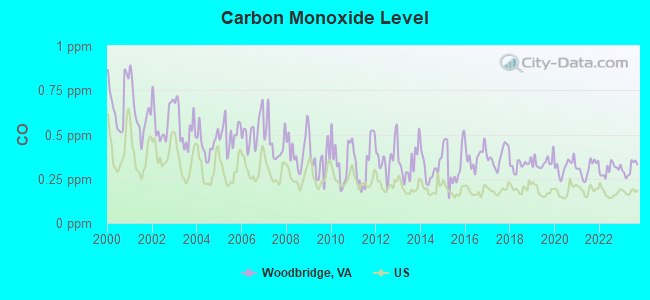
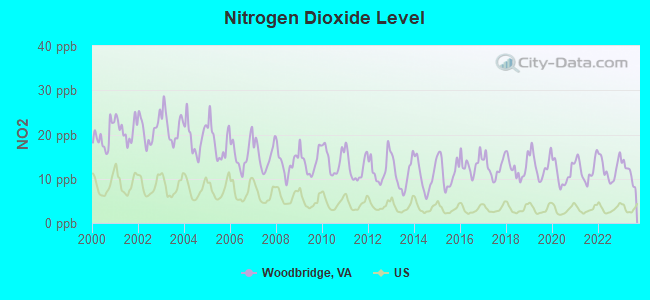
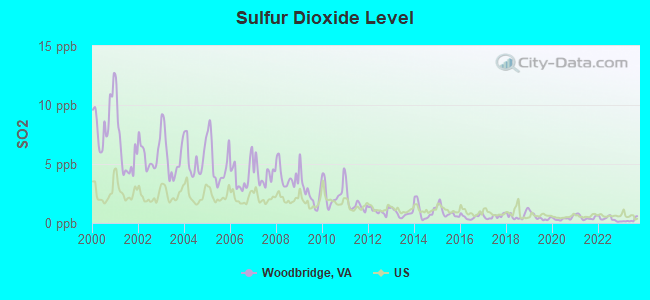
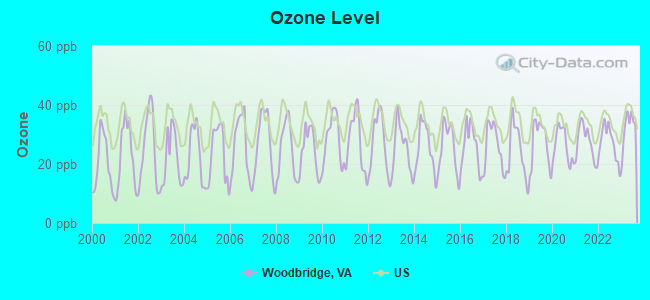
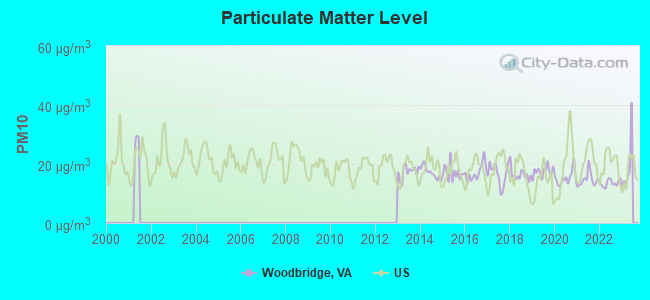
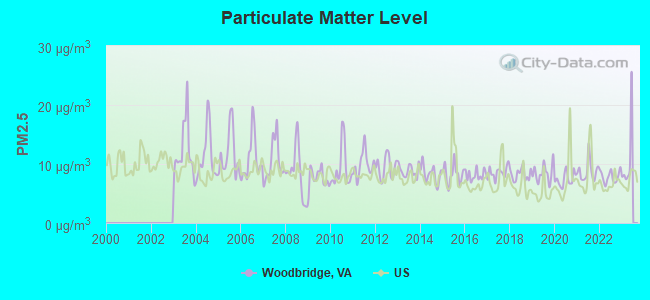
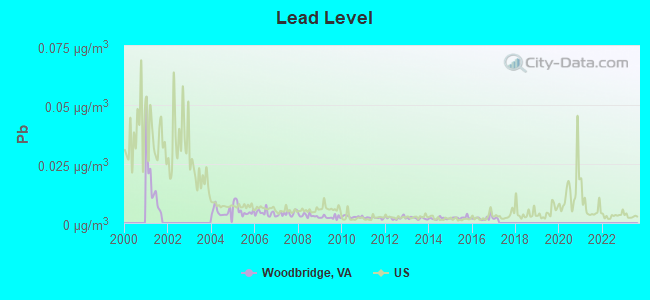
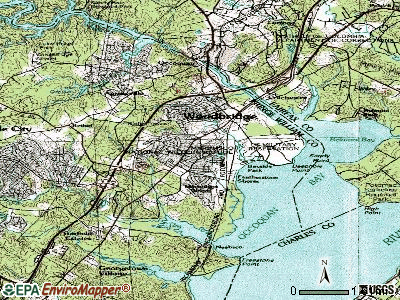
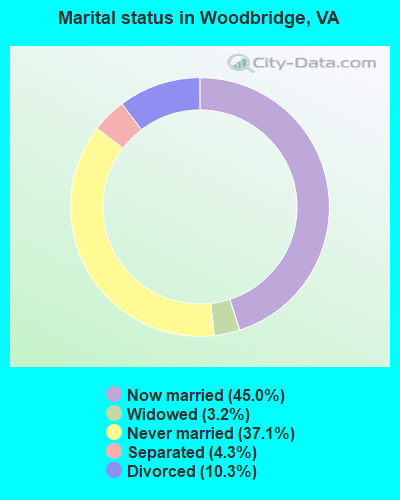
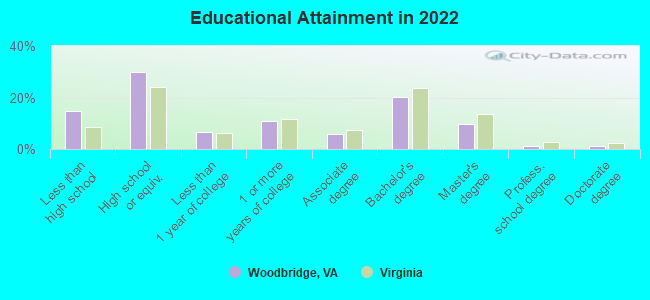
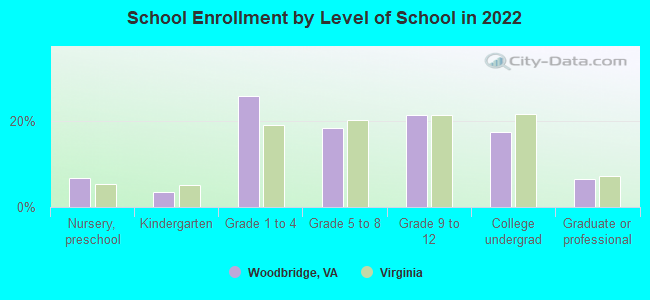
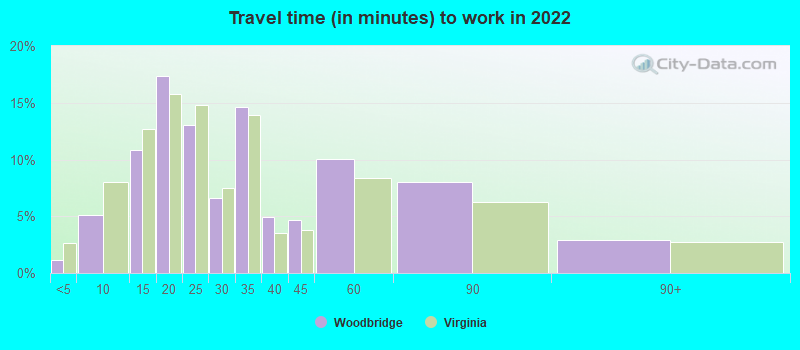
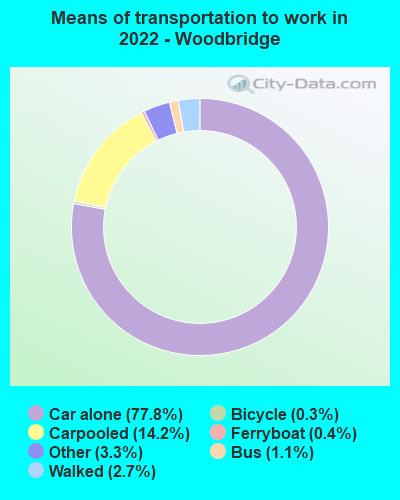
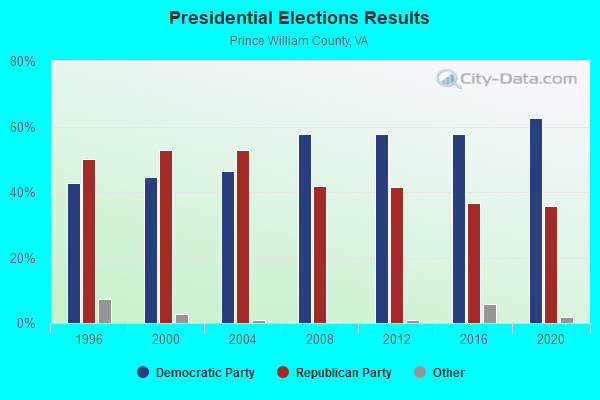
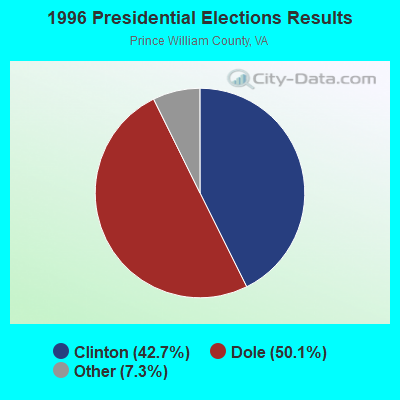
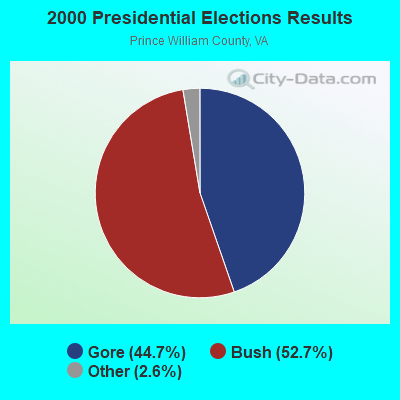
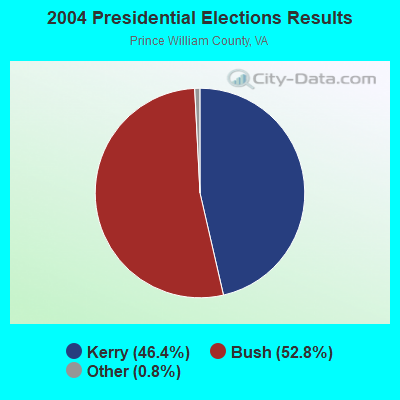
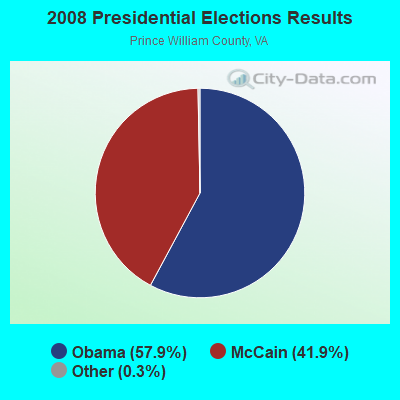
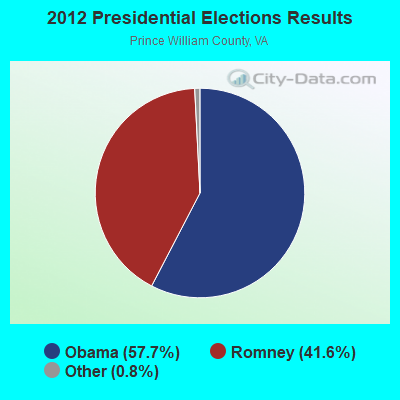
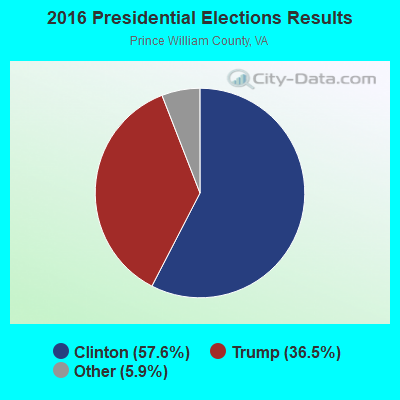
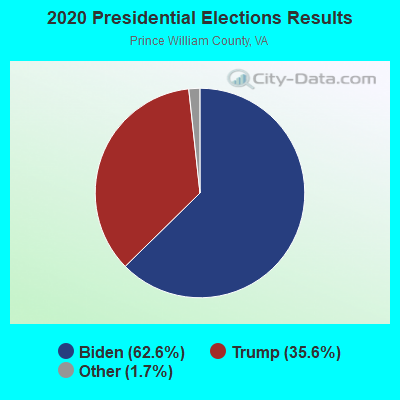
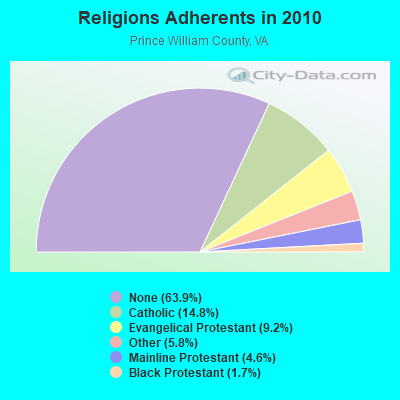
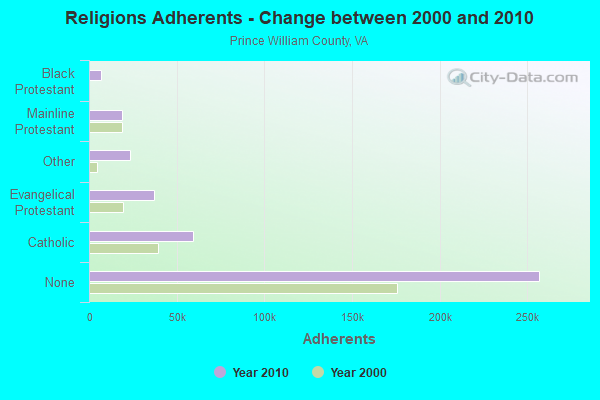
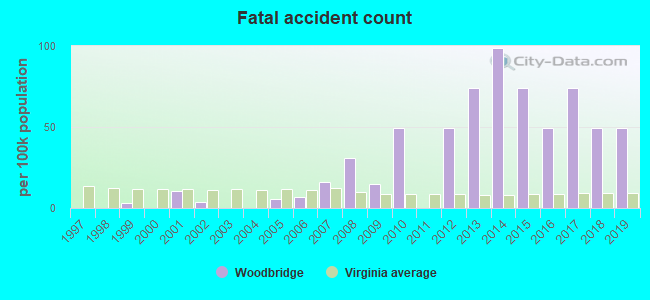
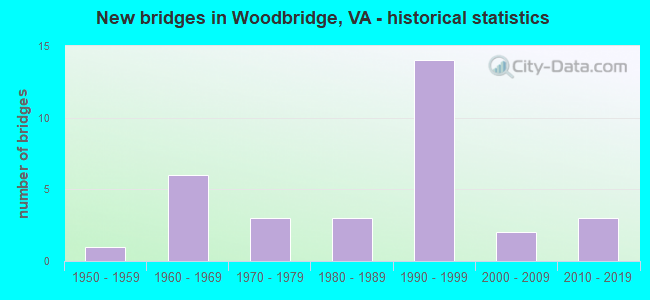
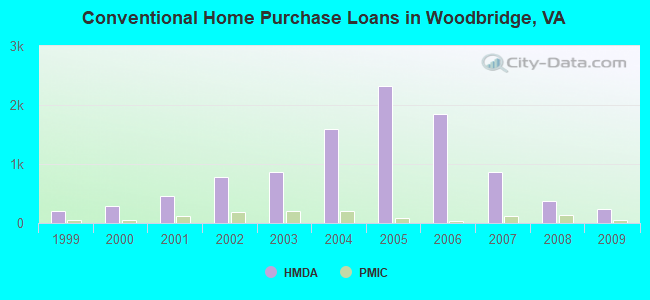
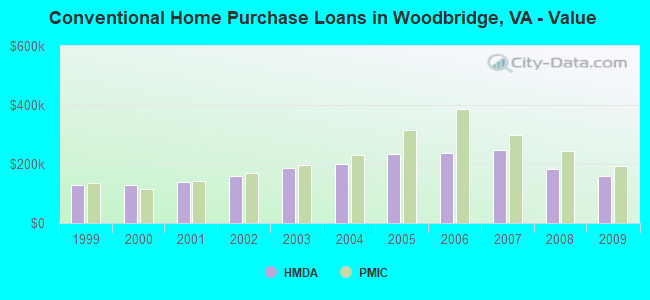
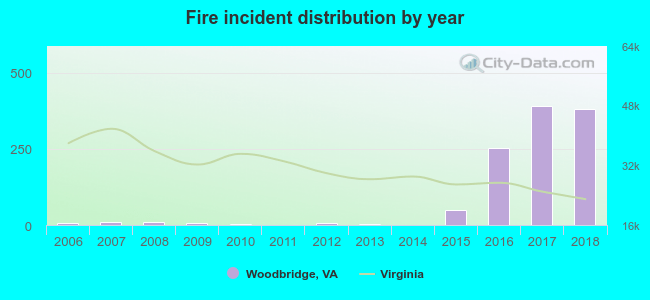 Based on the data from the years 2006 - 2018 the average number of fires per year is 86. The highest number of reported fire incidents - 392 took place in 2017, and the least - 0 in 2014. The data has a rising trend.
 When looking into fire subcategories, the most incidents belonged to: Outside Fires (33.2%), and Structure Fires (32.9%).