Baltimore, MD, and Hampton, VA, both located on the East Coast of the United States, offer different vibes and perks for their residents and visitors. Baltimore, an independent city and the largest in Maryland, carries an urban feel while Hampton, located in southeastern Virginia, exhibits a smaller, more coastal community character. The comparison of these two cities would focus on various sections that are crucial for people considering relocation and tourists visiting these regions.
Distance between
Baltimore, MD and
Hampton, VA : 157.7 miles
Baltimore's population is larger by 319%. Its population has decreased by 74,656 people (11.5%) since 2000. The population of Hampton has decreased by 8,691 people (5.9%) during that time.
Despite its vibrant charm, Baltimore has historically struggled with high crime rates, making safety a concern for both residents and tourists. However, most violent crimes are usually confined to specific neighborhoods. Hampton's crime rate is much lower, offering residents and visitors a safer setting. Both cities have seen a decrease in crime rates over the years, with invested efforts in community policing.
City-data.com crime index counts serious crimes and violent crime more heavily. It adjusts for the number of visitors and daily workers commuting into cities. (higher means more crime, U.S. average = 301.1)
City-data.com crime index counts serious crimes and violent crime more heavily. It adjusts for the number of visitors and daily workers commuting into cities. (higher means more crime, U.S. average = 301.1)
Sex Offenders
According to our data, there are 1,557 registered sex offenders living in Baltimore and 516 registered sex offenders living in . The ratio of residents to sex offenders in Baltimore is 395 to 1; the ratio in Hampton is 262 to 1. The number of registered sex offenders compared to the number of residents is a smaller in Baltimore than in Hampton.
Cost of Living
The overall cost of living in Baltimore is higher than the national average and significantly higher than Hampton. Baltimore's housing costs are also higher, affecting the overall affordability of the city. Hampton, on the other hand, offers a lower cost of living, with housing costs that are significantly below the national average, making it more affordable for relocators and even tourists looking for extended stays.
Income Tax
In Baltimore, the state of Maryland levies a personal income tax that ranges from 2% to 5.75% in addition to a city income tax of 3.2%. Hampton, in Virginia, has lower personal income tax rates ranging from 2% to 5.75% without any additional city income tax.
Property Tax
Property taxes in both cities differ. The median property tax in Baltimore is typically higher than in Hampton. Baltimore's median property tax is $2,358 per year, whereas Hampton's median property tax is $2,091 per year.
Sales Tax
Baltimore, being part of Maryland, has a 6% sales tax, which is applicable to most goods and services. Hampton, being in Virginia, has a slightly higher total sales tax rate of 6%, which includes a state sales tax of 4.3% and a local sales tax of 1.7%.
Income
Type
Baltimore
Hampton
Estimated median household income
$54,652
$57,647
Estimated per capita income
$35,091
$34,250
Cost of living index (U.S. average is 100)
105.7
96.1
If you make $50,000 in Hampton, you will have to make $54,995 in Baltimore to maintain the same standard of living.
Geographical Conditions
Baltimore is located in Central Maryland along the Patapsco River giving it a mix of city and waterside scenery. Hampton, positioned in the southeastern end of the Virginia Peninsula, offers a more coastal environment with plenty of beaches and access to water activities.
Baltimore is home to several highly respected higher education institutions, including Johns Hopkins University. Additionally, its public school system has made significant strides in recent years through focused reform efforts. Hampton also has a range of public and private schools and is in close proximity to several respected universities, such as William & Mary and Hampton University.
Baltimore boasts a more diversified economy, with flourishing sectors such as healthcare, education, and technology. In contrast, Hampton's economy is largely dependent on the military, government, and related industries due to its close proximity to several significant military bases. Both cities have an unemployment rate that's on par with the national average.
Biggest Employers
In Baltimore, Johns Hopkins Hospital and University are the biggest employers, offering opportunities in healthcare and education. Baltimore also houses many federal offices. In Hampton, the biggest employers are the military and the government, including the Norfolk Naval Shipyard and NASA's Langley Research Center.
There were 191 building permits issued in Baltimore in 2012 (116 more than in 2011) compared to 242 building permits issued in Hampton in 2012 (78 more than in 2011).
In Baltimore (Baltimore city), 87.4% voted for Democrats and 11.1% for Republicans in 2012 Presidential Election. In Hampton (Hampton city), 71.0% voted for Democrats and 28.2% for Republicans.
Elections
Type
Democrats
Republicans
Other
Year
Baltimore
Hampton
Baltimore
Hampton
Baltimore
Hampton
2020
87.5%
70.1%
10.7%
28.0%
1.8%
1.9%
2016
84.8%
66.3%
10.5%
28.7%
4.6%
4.9%
2012
87.4%
71.0%
11.1%
28.2%
1.4%
0.8%
2008
87.6%
69.6%
11.7%
30.4%
0.6%
0.0%
2004
82.5%
57.6%
17.1%
42.1%
0.5%
0.3%
2000
82.9%
57.5%
14.2%
41.0%
2.9%
1.5%
1996
79.3%
55.0%
15.5%
37.3%
5.1%
7.7%
Breakdown of population affiliated with a religious congregation
Type
Adherents
Congregations
Religion
Baltimore
Hampton
Baltimore
Hampton
CATHOLIC CHURCH
11.0%
3.9%
8.2%
4.1%
EPISCOPAL CHURCH
1.6%
1.0%
4.0%
2.8%
AMERICAN BAPTIST CHURCHES IN THE USA
1.4%
2.2%
2.2%
3.4%
SOUTHERN BAPTIST CONVENTION
1.4%
11.4%
7.3%
13.8%
EVANGELICAL LUTHERAN CHURCH IN AMERICA
1.0%
0.7%
4.3%
1.4%
MUSLIM ESTIMATE
0.6%
5.0%
1.5%
1.4%
SEVENTH DAY ADVENTIST CHURCH
0.5%
0.5%
1.5%
2.1%
LUTHERAN CHURCH
0.4%
0.1%
1.8%
0.7%
MENNONITE CHURCH USA
0.0%
1.7%
0.3%
0.7%
Weather
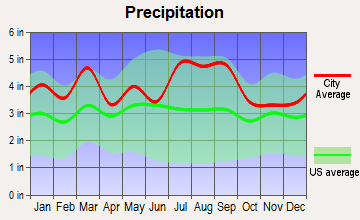
Both cities offer typical East Coast weather, characterized by hot, humid summers and cool winters. However, Hampton's location on the coast offers slightly milder winters compared to Baltimore. Be prepared for occasional hurricanes in either city, which are peak from June to November.
Weather and climate
Type
Baltimore
Hampton
Temperature - Average
54.5°F
59.2°F
Humidity - Average morning or afternoon humidity
70.4%
73%
Humidity - Differences between morning and afternoon humidity
36%
32%
Humidity - Maximum monthly morning or afternoon humidity
84%
83%
Humidity - Minimum monthly morning or afternoon humidity
48%
51%
Precipitation - Yearly average
42.9 in
47.8 in
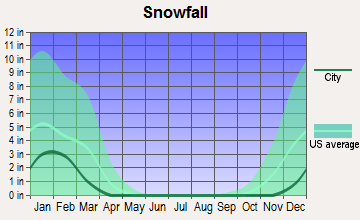
Snowfall - Yearly average
39.6 in
15.4 in
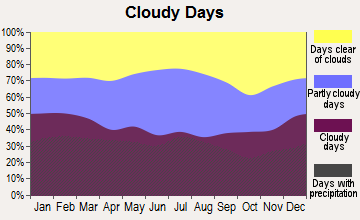
Clouds - Number of days clear of clouds
17.5%
17.6%
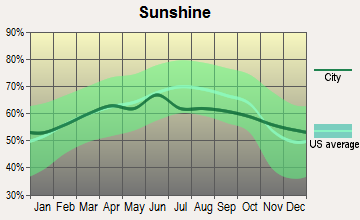
Sunshine amount - Average
60.3%
66.8%
Sunshine amount - Differences during a year
16%
14%
Sunshine amount - Maximum monthly
63%
67%
Sunshine amount - Minimum monthly
47%
53%
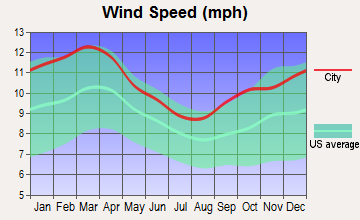
Wind speed - Average
7.9 mph
10.4 mph
Average climate in Baltimore, Maryland
Average climate in Hampton, Virginia
Air pollution
Type
AQI
CO
NO2
OZONE
PB
PM10
PM25
SO2
Year
Baltimore
Hampton
Baltimore
Hampton
Baltimore
Hampton
Baltimore
Hampton
Hampton
Baltimore
Baltimore
Hampton
Baltimore
Hampton
2018
89
57
0.23
0.17
11.8
3.3
28.3
33.1
0.002
N/A
N/A
N/A
7.9
6.1
0.1
0.6
2017
89
60
0.25
0.19
12.1
3.6
27.7
34.1
0.002
N/A
N/A
N/A
8.2
6.9
0.2
0.4
2016
102
66
0.26
0.17
13.0
3.4
28.3
33.1
0.002
N/A
N/A
N/A
7.7
6.1
0.3
0.7
2015
89
57
0.28
0.28
12.4
3.8
28.3
35.1
0.002
N/A
N/A
N/A
9.5
6.4
0.4
0.8
2014
82
59
0.25
0.25
11.8
3.9
25.7
34.8
0.002
N/A
N/A
N/A
10.9
6.8
0.6
1.0
2013
86
66
0.22
0.30
10.7
3.9
25.6
32.5
0.002
N/A
N/A
N/A
9.6
6.8
0.5
1.1
2012
98
76
0.24
0.26
11.3
5.1
25.0
36.3
0.002
N/A
N/A
N/A
11.2
8.1
0.5
1.0
2011
101
66
0.24
0.29
12.5
5.3
25.1
36.7
0.003
N/A
N/A
N/A
12.1
8.8
0.8
1.4
2010
110
80
0.24
0.15
13.1
6.4
26.9
39.7
0.004
N/A
N/A
N/A
12.2
N/A
1.0
2.3
2009
84
54
0.23
0.20
12.2
9.8
23.5
31.5
0.012
N/A
N/A
N/A
10.4
N/A
1.4
1.9
2008
96
77
0.25
0.20
13.6
10.3
21.6
36.2
0.004
N/A
N/A
N/A
12.8
N/A
1.8
3.0
2007
107
81
0.21
0.23
13.8
12.2
23.2
35.1
0.004
N/A
N/A
N/A
14.0
N/A
2.5
3.5
2006
112
62
N/A
0.29
12.0
N/A
24.6
34.2
0.004
N/A
N/A
N/A
14.7
N/A
N/A
3.5
2005
111
67
N/A
0.28
14.3
N/A
26.3
34.3
N/A
N/A
23.0
N/A
17.1
N/A
N/A
3.2
2004
108
80
N/A
0.31
15.3
15.9
28.0
32.5
N/A
N/A
23.1
N/A
16.3
N/A
N/A
3.7
2003
110
84
N/A
0.39
17.8
16.2
22.4
33.1
N/A
N/A
N/A
N/A
13.9
N/A
N/A
3.0
2002
119
99
N/A
0.37
17.4
17.8
19.4
37.2
N/A
N/A
N/A
N/A
16.3
N/A
5.8
3.4
2001
104
92
N/A
0.44
18.2
18.2
23.9
34.9
N/A
N/A
N/A
N/A
N/A
N/A
6.0
4.1
2000
101
85
N/A
0.49
17.0
15.7
22.4
34.9
N/A
N/A
N/A
N/A
N/A
N/A
6.3
5.0
Natural disasters
Type
Baltimore
Hampton
Tornado activity compared to U.S. average
117.8%
72.9%
Earthquake activity compared to U.S. average
40.6%
37.4%
Natural disasters compared to U.S. average
0%
0%
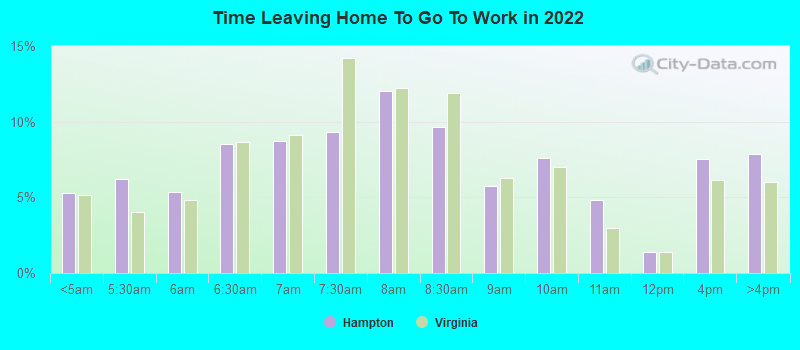
Transportation
Both cities offer robust public transport systems. Baltimore's options include buses, a subway system, a light rail, and the MARC Train for intercity commuting. In contrast, Hampton's public transport consists mainly of buses run by Hampton Roads Transit, and driving is more common.
Transport
Type
Baltimore
Hampton
Amtrak stations
2
0
Amtrak stations nearby
2
2
FAA registered aircraft
136
107
FAA registered aircraft manufacturers and dealers
2
0
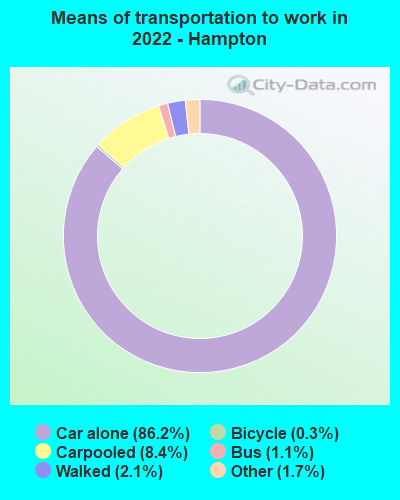
Means of transportation to work
Type
Baltimore
Hampton
Bicycle
0.4%
0.3%
Bus
6.2%
1.8%
Carpooled
7.3%
7.4%
Car alone
77.2%
86.1%
Motorcycle
0%
0.1%
Railroad
0.3%
0%
Streetcar
1.2%
0%
Subway
0.2%
0%
Taxicab
0.7%
0.2%
Walked
4.5%
2.5%
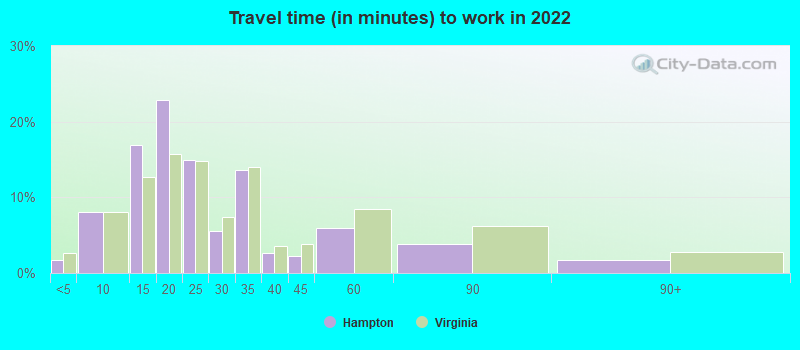
Average travel time to work
Type
Baltimore
Hampton
Average
32.3 min
24.4 min
Other means
26.3 min
22.4 min
Public transportation
46.8 min
43.8 min
Private vehicle occupancy
Type
Baltimore
Hampton
Average
1.1
1.1
Drove alone
90.7%
91.7%
In 2 person carpool
7.5%
6.6%
In 3 person carpool
1%
1.1%
In 4 person carpool
0.4%
0.4%
In 5-6 person carpool
0.3%
0.2%
In 7+ person carpool
0.2%
0.1%
How many people usually rode to work in the car, truck or van.
Real Estate
In Baltimore, housing is generally more expensive but offers a more diverse array of housing options, from urban apartments to suburban homes. In Hampton, housing prices are lower, offering affordable options for families, first-time buyers, and retirees, and property taxes are also relatively low compared to Baltimore.
Neighborhoods
Both cities provide a variety of neighborhoods catering to different lifestyles. Baltimore's neighborhoods, such as Federal Hill and Fells Point, are rich in history, while others like Canton and Mount Vernon cater to younger, more trendy crowds. Hampton's neighborhoods like Fox Hill and Victoria Boulevard Historic District offer coastal living with a laid-back vibe.
Houses and residents
Type
Baltimore
Hampton
Houses
293,487
62,528
Average household size (people)
2.4
2.4
Median year apartment built
1959
1977
Median year house/condo built
1944
1969
Length of stay in the house since moving in
15.7 years
14.7 years
Houses occupied
254,370 (86.7%)
58,181 (93%)
Houses occupied by owners
123,249 (48.5%)
31,662 (54.4%)
Houses occupied by renters
131,121 (51.5%)
26,519 (45.6%)
Median rent asked for vacant for-rent units
$1,254
$935.15
Median monthly housing costs
$1,196
$1,204
Median price asked for vacant for-sale houses and condos
$207,303
$461,923
Estimated median house or condo value
$193,100
$211,900
Median numbers of rooms
5.6
5.6
Median number of rooms in apartments
4.2
4.4
Median number of rooms in houses and condos
6.5
6.6
Median house price - detached houses
$321,473
$237,519
Median house price - in 5 or more unit structures
$257,173
$419,879
Median house price - mobile homes
$269,877
$16,007
Median house price - Townhouses or other attached units
$210,096
$155,959
Median house price - All housing units
$246,241
$230,261
Median house age
72
48
Renting percentage
52.3%
41.9%
Housing density (houses/condos per square mile)
3,632.1
1,207.5
House value disparities
38.5%
30.3%
Household income disparities
49.4%
43.1%
Median household income for houses/condes with a mortgage
$85,990
$84,995
Median household income for apartments without a mortgage
$53,334
$61,599
Housing units without a mortgage
2,415 (2.8%)
552 (2.5%)
Housing units with both a second mortgage and home equity loan
5,740 (6.6%)
1,775 (7.9%)
Housing units with a mortgage
84,578 (97.2%)
21,963 (97.5%)
Housing units with a home equity loan
579 (0.7%)
130 (0.6%)
Housing units with a second mortgage
8,544 (9.8%)
3,058 (13.6%)
House/condo owner moved in on average (years ago)
14
14
House/condo renter moved in on average (years ago)
3
1
Housing units lacking complete kitchen facilities
6%
0.6%
Housing units lacking complete plumbing facilities
5.1%
0.6%
Housing units in structures
Housing units in structures
Baltimore
Hampton
One, detached
16.4%
64.7%
One, attached
49.5%
6.6%
Two
4.5%
1.6%
3 or 4
4.9%
5.2%
5 to 9
5.5%
6.8%
10 to 19
4.8%
7.7%
20 to 49
2.8%
1.2%
50 or more
11.4%
4.1%
Mobile homes
0.2%
2.0%
Boats, RVs, vans, etc.
0.1%
0.0%
Median real estate property taxes paid for housing units
Self-employed workers in own not incorporated business
12,671
1,776
State government workers
20,410
3,850
Unpaid family workers
356
162
Industries and Occupations
Baltimore stocks a wide array of industries including healthcare, education, finance, and technology, creating opportunities for a diverse range of occupations. Johns Hopkins Hospital and University are the city's largest employers. Hampton, on the other hand, has military bases, NASA Langley Research Center, and Hampton University among the largest area employers, offering a large number of positions in public service and education.
Baltimore is renowned for its high-quality healthcare, predominantly due to the presence of Johns Hopkins Hospital. Hampton, while not having an institution as internationally well-known, does have good health care facilities, including the Sentara CarePlex Hospital and Hampton VA Medical Center.
Health (county statistics)
Type
Baltimore
Hampton
General health status score of residents in this county from 1 (poor) to 5 (excellent)
While Baltimore struggles with aged infrastructure and the associated maintenance costs, it continues to invest in upgrades and repairs, including public facilities, roads, and utilities. Hampton, being smaller, has less daunting infrastructure challenges and generally receives good ratings for its public works.
HMDA - Conventional home purchase loans - Applications denied
Year
Baltimore
Hampton
1999
2,486
0
2000
2,058
0
2001
1,371
0
2002
1,111
0
2003
1,526
295
2004
2,929
489
2005
4,981
576
2006
5,533
588
2007
3,592
376
2008
1,111
87
2009
381
29
Culture and Food
Baltimore's culture is rich in history and the arts, with a wide array of museums, theaters, and festivals. The city also boasts famous cuisine like Maryland crabs and Berger cookies. On the other hand, Hampton also has a rich heritage reflected through multiple historical sites and museums. And being a coastal city, it promises excellent seafood.
Sports Teams
For sports enthusiasts, Baltimore is home to the NFL's Ravens and MLB's Orioles. On the other hand, Hampton doesn't host any major league sports teams, but the Peninsula Pilots, a collegiate summer baseball team, and sporting events at Hampton University do provide local sports action.


 Baltimore, MD
 Hampton, VA