Boston, Massachusetts, and New Haven, Connecticut, both exhibit unique characteristics, but also share similarities due to their Northeast U.S. locations. Their similarities and differences extend across multiple domains, including safety, climate, cost of living, education, economy, and cultural attractions. Whether you're considering relocating or simply visiting these cities, it's important to take into account each city’s unique environment, resources, and opportunities.
Distance between
Boston, MA and
New Haven, CT : 117.4 miles
Boston's population is larger by 385%. Its population has grown by 65,635 people (11.1%) since 2000. The population of New Haven has grown by 11,455 people (9.3%) during that time.
Boston is a larger city and hence reports higher crime rates compared to New Haven. However, safety can vary significantly between neighborhoods in both cities. Boston has lower crime rates in areas like Back Bay and Beacon Hill, while New Haven’s Downtown and East Rock are considered safer. It’s important to research specific neighborhoods before choosing a place of residence.
City-data.com crime index counts serious crimes and violent crime more heavily. It adjusts for the number of visitors and daily workers commuting into cities. (higher means more crime, U.S. average = 301.1)
City-data.com crime index counts serious crimes and violent crime more heavily. It adjusts for the number of visitors and daily workers commuting into cities. (higher means more crime, U.S. average = 301.1)
Sex Offenders
According to our data, there are 331 registered sex offenders living in Boston and 448 registered sex offenders living in . The ratio of residents to sex offenders in Boston is 2,033 to 1; the ratio in New Haven is 290 to 1. The number of registered sex offenders compared to the number of residents is a lot smaller in Boston than in New Haven.
Cost of Living
The cost of living in Boston is significantly higher than in New Haven. Housing, in particular, is more expensive in Boston. Everyday expenses, such as groceries and transportation, are also higher in Boston, although salaries tend to match this higher cost of living.
Income Tax
Income tax in Massachusetts (Boston) is flat at 5%, while Connecticut (New Haven) has a progressive income tax ranging from 3% to 6.99%, depending on income.
Property Tax
Property taxes in both states are relatively high. Boston has an average rate of 1.22% while New Haven's average rate is 1.80%, which can add significantly to housing costs.
Sales Tax
The sales tax in Boston (Massachusetts) is 6.25%, while New Haven (Connecticut) has a sales tax of 6.35%. The slight variation has a minimal impact on daily expenditures.
Income
Type
Boston
New Haven
Estimated median household income
$79,283
$50,569
Estimated per capita income
$50,337
$29,540
Cost of living index (U.S. average is 100)
143.8
128.7
If you make $50,000 in New Haven, you will have to make $55,866 in Boston to maintain the same standard of living.
Geographical Conditions
Boston is located on the coast, offering beautiful waterfront views and beaches. New Haven is at the harbor mouth of the Quinnipiac River, and it draws people with its serene parks and squares.
Both cities are renowned for their education sectors. Boston is home to world-famous institutions like Harvard and MIT. New Haven hosts Yale University, one of the oldest and most prestigious universities in the U.S. Public school systems in both cities are robust, with Boston Public Schools being the oldest in the country.
While both cities have diverse economies, Boston’s economy is larger due to its higher population. Boston is a hub for biotechnology, finance, and tourism, whereas New Haven’s economy is bolstered by health care, education, and manufacturing. Unemployment rates are generally lower in Boston.
Biggest Employers
Boston's biggest employers include Massachusetts General Hospital, Brigham and Women's Hospital, Boston University, and Liberty Mutual Insurance. In New Haven, Yale University and Yale New Haven Hospital top the list of major employers.
There were 53 building permits issued in Boston in 2012 (20 more than in 2011) compared to 13 building permits issued in New Haven in 2012 (95 less than in 2011).
In Boston (Suffolk County), 77.4% voted for Democrats and 20.8% for Republicans in 2012 Presidential Election. In New Haven (New Haven County), 60.7% voted for Democrats and 38.3% for Republicans.
Elections
Type
Democrats
Republicans
Other
Year
Boston
New Haven
Boston
New Haven
Boston
New Haven
2020
80.6%
58.1%
17.5%
40.7%
1.9%
1.3%
2016
78.5%
54.3%
16.1%
42.0%
5.4%
3.7%
2012
77.4%
60.7%
20.8%
38.3%
1.8%
1.0%
2008
76.9%
61.0%
21.2%
37.8%
1.8%
1.2%
2004
75.9%
54.5%
22.8%
43.9%
1.3%
1.6%
2000
71.5%
58.1%
20.5%
36.1%
8.0%
5.7%
1996
73.0%
54.7%
19.9%
32.7%
7.0%
12.6%
Breakdown of population affiliated with a religious congregation
Type
Adherents
Congregations
Religion
Boston
New Haven
Boston
New Haven
CATHOLIC CHURCH
46.1%
35.2%
12.4%
17.2%
AMERICAN BAPTIST CHURCHES IN THE USA
1.2%
0.9%
8.9%
3.2%
MUSLIM ESTIMATE
1.1%
0.5%
2.4%
1.7%
EPISCOPAL CHURCH
1.0%
1.4%
4.7%
6.7%
SEVENTH DAY ADVENTIST CHURCH
0.7%
0.2%
4.0%
2.0%
SOUTHERN BAPTIST CONVENTION
0.6%
0.1%
6.9%
1.5%
EVANGELICAL LUTHERAN CHURCH IN AMERICA
0.0%
0.5%
0.7%
2.7%
Weather
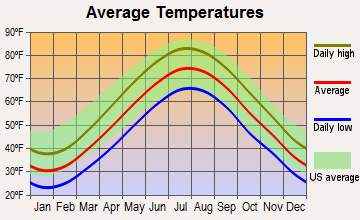
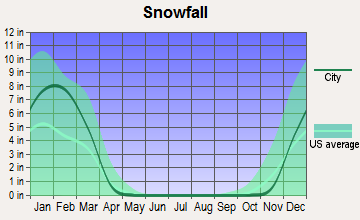
The weather in both cities is typical of the Northeastern U.S. with hot, humid summers, and cold, snowy winters. New Haven experiences slightly milder winters, while Boston has a slightly cooler summer. Boston's proximity to the Atlantic Ocean might cause heavier snowfall during winter storms.
Weather and climate
Type
Boston
New Haven
Temperature - Average
50.6°F
52.6°F
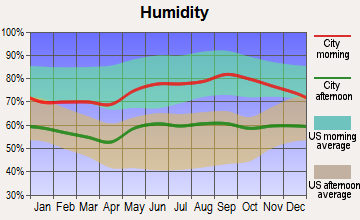
Humidity - Average morning or afternoon humidity
69.9%
72.4%
Humidity - Differences between morning and afternoon humidity
23.1%
26.2%
Humidity - Maximum monthly morning or afternoon humidity
78%
80.1%
Humidity - Minimum monthly morning or afternoon humidity
55%
53.9%
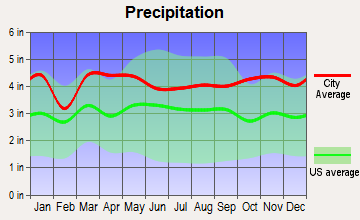
Precipitation - Yearly average
46.3 in
49.5 in
Snowfall - Yearly average
88.3 in
60 in
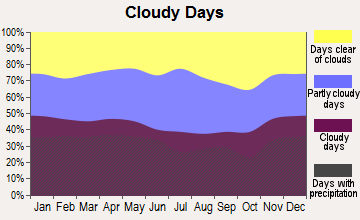
Clouds - Number of days clear of clouds
16.4%
16.5%
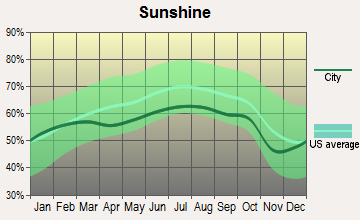
Sunshine amount - Average
63.7%
62.2%
Sunshine amount - Differences during a year
20%
17.3%
Sunshine amount - Maximum monthly
68%
64.6%
Sunshine amount - Minimum monthly
48%
47.3%
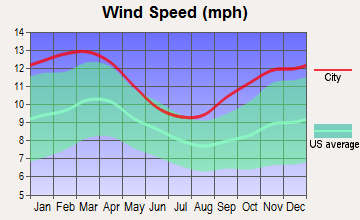
Wind speed - Average
12.5 mph
10.4 mph
Average climate in Boston, Massachusetts
Average climate in New Haven, Connecticut
Air pollution
Type
AQI
CO
NO2
OZONE
PM10
PM25
SO2
Year
Boston
New Haven
Boston
New Haven
Boston
New Haven
Boston
New Haven
New Haven
Boston
New Haven
Boston
New Haven
2018
76
84
0.24
0.25
12.3
12.4
26.1
25.7
N/A
N/A
9.2
7.6
0.5
0.2
2017
83
82
0.26
0.24
12.5
13.1
26.4
25.9
N/A
N/A
8.9
6.4
0.6
0.3
2016
75
92
0.27
0.25
14.1
13.4
24.4
26.1
N/A
N/A
7.4
6.9
0.5
0.4
2015
81
94
0.30
0.26
15.7
13.9
23.4
26.0
N/A
N/A
8.9
8.4
0.8
0.5
2014
76
88
0.30
0.25
14.0
13.1
24.5
25.5
N/A
N/A
9.3
8.8
1.2
0.9
2013
86
96
0.30
0.26
13.5
13.6
26.2
26.7
N/A
N/A
9.8
11.4
1.3
0.8
2012
89
102
0.29
0.27
11.8
13.4
23.5
25.5
N/A
N/A
9.5
11.5
1.4
1.2
2011
87
77
0.30
0.29
14.8
15.5
24.2
23.3
N/A
N/A
10.5
N/A
1.6
1.8
2010
92
75
0.26
0.29
13.8
13.6
25.0
24.1
N/A
N/A
10.0
N/A
2.3
1.5
2009
86
66
0.32
0.27
15.3
14.3
23.5
21.5
N/A
N/A
9.7
N/A
2.4
2.2
2008
96
84
0.26
0.38
16.6
15.2
22.9
23.7
N/A
N/A
12.4
N/A
3.8
2.5
2007
124
96
0.28
0.46
18.5
18.2
19.9
N/A
N/A
N/A
13.9
N/A
4.0
4.0
2006
103
95
0.38
0.49
15.8
19.7
20.9
N/A
N/A
N/A
12.5
N/A
3.5
4.9
2005
115
98
0.28
N/A
17.0
21.9
22.1
N/A
N/A
N/A
12.7
N/A
4.3
6.1
2004
104
90
0.26
0.53
15.6
20.6
22.5
N/A
41.5
N/A
13.7
N/A
4.6
4.8
2003
116
104
0.55
0.62
20.1
24.7
22.4
N/A
41.0
N/A
14.5
N/A
5.2
3.2
2002
130
111
0.35
0.64
19.8
25.4
21.8
N/A
33.7
N/A
13.5
N/A
5.0
4.3
2001
112
110
0.44
0.63
19.9
27.3
20.7
N/A
37.6
N/A
13.6
N/A
5.9
4.1
2000
88
94
0.57
0.68
18.8
25.2
19.2
27.1
31.9
N/A
10.0
N/A
5.6
3.8
Natural disasters
Type
Boston
New Haven
Tornado activity compared to U.S. average
55.3%
62%
Earthquake activity compared to U.S. average
26.6%
29.4%
Natural disasters compared to U.S. average
33%
26%
Transportation
Boston's public transportation, managed by the MBTA, offers extensive subway, bus, and commuter rail services. It's a walkable city with a reliable transportation system. New Haven has a smaller public transit system with buses and a commuter rail to NYC, and is also a very bike-friendly city.
Transport
Type
Boston
New Haven
Amtrak stations
3
1
Amtrak stations nearby
3
3
FAA registered aircraft
224
9
FAA registered aircraft manufacturers and dealers
4
0
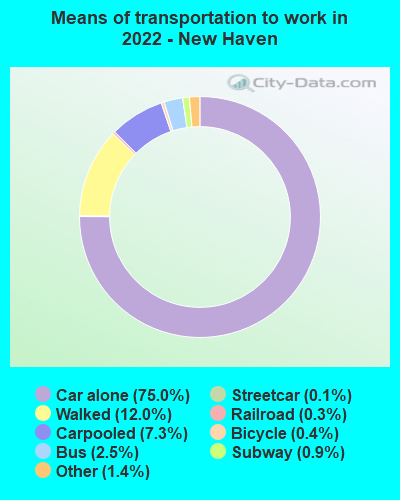
Means of transportation to work
Type
Boston
New Haven
Bicycle
1.7%
0.9%
Bus
7.1%
3.8%
Carpooled
6.8%
9.9%
Car alone
54.7%
75%
Ferryboat
0.2%
0.2%
Motorcycle
0.1%
0.2%
Railroad
0.5%
1.2%
Streetcar
13.5%
0.2%
Subway
3.2%
0.4%
Taxicab
0.4%
0.3%
Walked
10%
8.5%
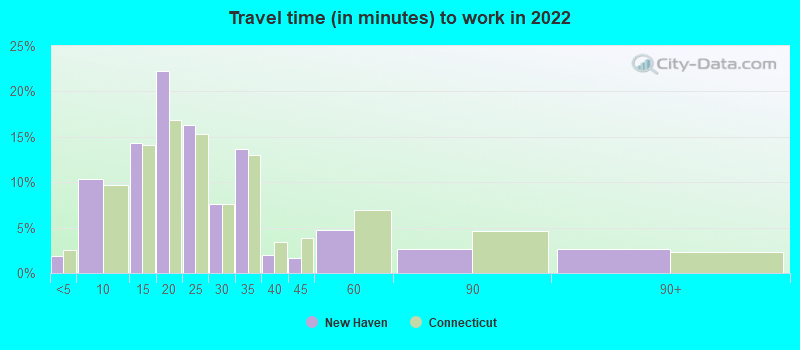
Average travel time to work
Type
Boston
New Haven
Average
38.6 min
25.7 min
Other means
26.1 min
21 min
Public transportation
38.6 min
40.3 min
Private vehicle occupancy
Type
Boston
New Haven
Average
1.2
1.2
Drove alone
87.1%
89%
In 2 person carpool
10.1%
7.9%
In 3 person carpool
1.7%
2.5%
In 4 person carpool
0.4%
0.1%
In 5-6 person carpool
0.2%
0.5%
In 7+ person carpool
0.5%
0%
How many people usually rode to work in the car, truck or van.
Real Estate
Real estate in Boston is more expensive compared to New Haven, reflecting the higher cost of living. Rental and property values in Boston are among the highest in the U.S., while New Haven offers more affordable housing options.
Neighborhoods
Both Boston and New Haven boast diverse neighborhoods with unique cultures. Boston’s Beacon Hill is known for its historic homes and narrow streets. In New Haven, Wooster Square is famous for its cherry blossom trees and Italian heritage.
Houses and residents
Type
Boston
New Haven
Houses
307,025
61,547
Average household size (people)
2.3
2.4
Median year apartment built
1957
1956
Length of stay in the house since moving in
14.6 years
14.8 years
Houses occupied
271,941 (88.6%)
56,373 (91.6%)
Houses occupied by owners
94,497 (34.7%)
14,413 (25.6%)
Houses occupied by renters
177,444 (65.3%)
41,960 (74.4%)
Median rent asked for vacant for-rent units
$2,632
$1,138
Median monthly housing costs
$1,883
$1,333
Median price asked for vacant for-sale houses and condos
$1,040,328
$129,692
Estimated median house or condo value
$659,700
$205,500
Median numbers of rooms
4.3
4.4
Median number of rooms in apartments
3.9
3.8
Median number of rooms in houses and condos
5.4
5.9
Median house price - detached houses
$683,896
$307,685
Median house price - in 2-unit structures
$639,493
$288,193
Median house price - in 3-to-4-unit structures
$745,440
$148,671
Median house price - in 5 or more unit structures
$986,433
$162,159
Median house price - Townhouses or other attached units
Over $1,000,000
$298,351
Median house price - All housing units
$793,380
$278,761
Median house age
73
67
Renting percentage
66.1%
70.5%
Housing density (houses/condos per square mile)
6,340.1
3,265.1
House value disparities
23.5%
33.4%
Household income disparities
48.2%
47.9%
Median household income for houses/condes with a mortgage
$138,364
$107,500
Median household income for apartments without a mortgage
$97,179
$67,221
Housing units without a mortgage
1,250 (1.8%)
285 (2.9%)
Housing units with both a second mortgage and home equity loan
7,686 (11.2%)
236 (2.4%)
Housing units with a mortgage
67,144 (98.2%)
9,612 (97.1%)
Housing units with a home equity loan
218 (0.3%)
0 (0%)
Housing units with a second mortgage
9,540 (13.9%)
569 (5.7%)
House/condo owner moved in on average (years ago)
12
13
House/condo renter moved in on average (years ago)
3
3
Housing units lacking complete kitchen facilities
1.4%
1.8%
Housing units lacking complete plumbing facilities
0.7%
1%
Housing units in structures
Housing units in structures
Boston
New Haven
One, detached
12.0%
17.5%
One, attached
6.4%
6.8%
Two
11.9%
13.1%
3 or 4
24.1%
24.6%
5 to 9
11.2%
10.5%
10 to 19
7.2%
6.4%
20 to 49
8.0%
6.0%
50 or more
19.0%
15.1%
Mobile homes
0.1%
0.0%
Median real estate property taxes paid for housing units
Self-employed workers in own not incorporated business
11,605
2,894
State government workers
12,810
2,552
Unpaid family workers
303
135
Industries and Occupations
In Boston, major industries include finance, healthcare, education, and technology, attracting talent in these fields. New Haven’s economy is dominated by education, health services, professional services and manufacturing.
Both cities boast excellent healthcare facilities. Boston has some of the top-ranked hospitals in the country, like Massachusetts General. New Haven is served primarily by Yale New Haven Hospital, also highly regarded.
Health (county statistics)
Type
Boston
New Haven
General health status score of residents in this county from 1 (poor) to 5 (excellent)
Boston's historical roots mean that the city's infrastructure plays a blend of new and old, with historic sites combined with modern architecture. New Haven, while smaller, boasts well-planned infrastructure with the iconic Yale campus.
Infrastructure
Type
Boston
New Haven
Hospitals
22
5
TV stations
22
16
Arenas or stadiums
3
2
Bank branches located here
146
34
Bank institutions located here
37
13
Main business address for public companies
60
8
Drinking water stations with no reported violations in the past
2
0
Drinking water stations with reported violations in the past
HMDA - Conventional home purchase loans - Applications denied
Year
Boston
New Haven
1999
1,237
354
2000
1,140
520
2001
947
329
2002
975
301
2003
1,536
481
2004
2,273
611
2005
3,225
802
2006
3,567
965
2007
2,652
527
2008
1,372
159
2009
910
92
Culture and Food
Boston is known for its lively sports culture, historical sites, and seafood. New Haven, on the other hand, is famed for its pizza, diverse arts scene, and ties to Ivy League education at Yale.
Sports Teams
Both cities are passionate about sports. Boston is home to the Celtics (NBA), Red Sox (MLB), and Bruins (NHL). New Haven doesn't have major league teams but has a strong community sporting culture, and is close to New York City’s and Boston's professional sports.


 Boston, MA
 New Haven, CT