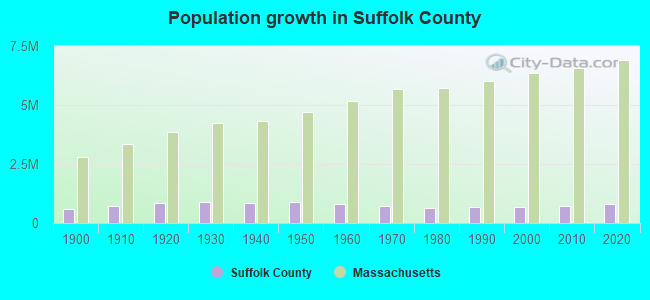
Suffolk County, Massachusetts (MA)
County owner-occupied free and clear houses and condos in 2010: 22,751
County owner-occupied houses and condos in 2000: 94,552
Renter-occupied apartments: 189,547 (it was 184,170 in 2000)
| % of renters here: | 66% |
| State: | 38% |
Land area: 59 sq. mi.
Water area: 61.7 sq. mi.
Population density: 13097 people per square mile (very high).
Industries providing employment: Educational, health and social services (30.9%), Professional, scientific, management, administrative, and waste management services (17.7%).
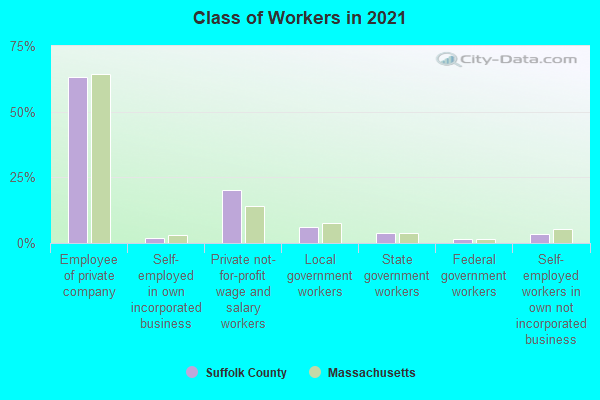
Type of workers:
- Private wage or salary: 85%
- Government: 11%
- Self-employed, not incorporated: 4%
- Unpaid family work: 0%
- OSM Map
- General Map
- Google Map
- MSN Map

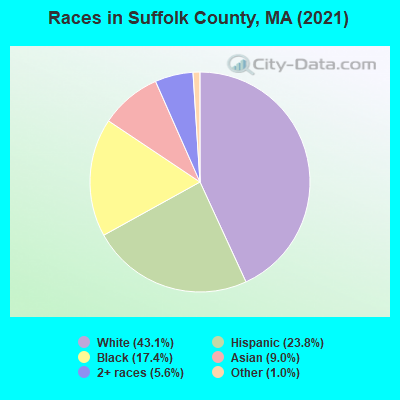
- 331,07443.2%White Non-Hispanic Alone
- 183,53523.9%Hispanic or Latino
- 132,85217.3%Black Non-Hispanic Alone
- 67,3588.8%Asian alone
- 42,5555.6%Two or more races
- 7,7451.0%Some other race alone
- 1,1920.2%American Indian and Alaska Native alone
- 700.01%Native Hawaiian and Other
Pacific Islander alone
| Median resident age: | 34.1 years |
| Massachusetts median age: | 40.3 years |
| Males: 370,947 | |
| Females: 395,434 |

 | Cars in MA (789 replies) |
| 2023 Real Estate Observations (5278 replies) |
| Population slightly down in MA 2022 (362 replies) |
| Boston Racial Stigma- is it "cool" to hate on Boston? (632 replies) |
| vehicular homicide is trendy I am just a piece of meat on the road! (129 replies) |
| "Not Prosecuting Low-Level Crimes Leads To Less Crime In Suffolk County, Research Finds" (2 replies) |
| Suffolk County: | 2.0 people |
| Massachusetts: | 2 people |
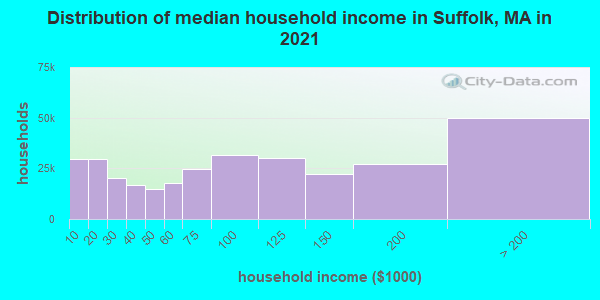
Estimated median household income in 2022: $85,358 ($39,355 in 1999)
| This county: | $85,358 |
| Massachusetts: | $94,488 |
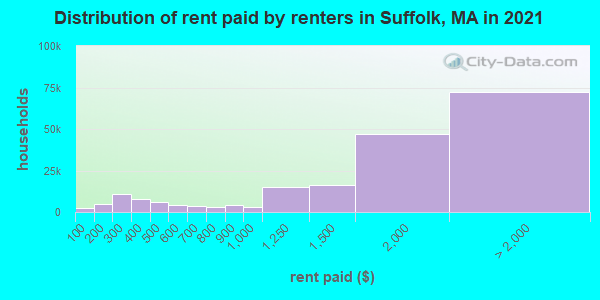
Median contract rent in 2022 for apartments: $1,784 (lower quartile is $1,008, upper quartile is $2,483)
| This county: | $1784 |
| State: | $1446 |
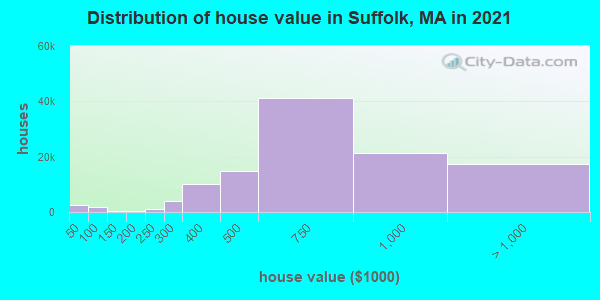
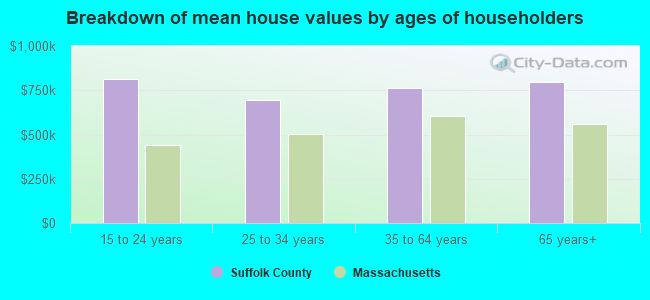
Estimated median house or condo value in 2022: $669,800 (it was $201,300 in 2000)
| Suffolk: | $669,800 |
| Massachusetts: | $534,700 |
Mean price in 2022:
Median monthly housing costs for homes and condos with a mortgage: $2,777Detached houses: $688,497
Here: $688,497 State: $651,570 Townhouses or other attached units: $1,213,410
Here: $1,213,410 State: $617,749 In 2-unit structures: $773,785
Here: $773,785 State: $594,808 In 3-to-4-unit structures: $827,903
Here: $827,903 State: $601,912 In 5-or-more-unit structures: $1,009,742
Here: $1,009,742 State: $555,768 Mobile homes: $239,132
Here: $239,132 State: $170,209
Median monthly housing costs for units without a mortgage: $1,007
Institutionalized population: 7,495
Health of residents in Suffolk County based on CDC Behavioral Risk Factor Surveillance System Survey Questionnaires from 2003 to 2012:
General health status score of residents in this county from 1 (poor) to 5 (excellent) is 3.5. This is about average.74.4% of residents exercised in the past month. This is about average.
44.4% of residents smoked 100+ cigarettes in their lives. This is about average.
76.6% of adult residents drank alcohol in the past 30 days. This is about average.
74.7% of residents visited a dentist within the past year. This is about average.
Average weight of males is 187 pounds. This is less than average.
Average weight of females is 159 pounds. This is about average.
4.1% of residents keep firearms around their homes. This is less than average.
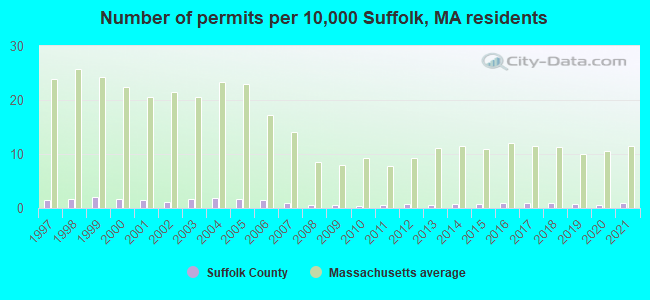
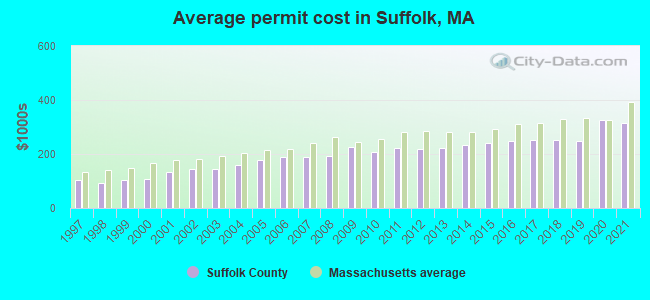
Single-family new house construction building permits:
- 2022: 68 buildings, average cost: $336,500
- 2021: 65 buildings, average cost: $316,100
- 2020: 33 buildings, average cost: $324,700
- 2019: 45 buildings, average cost: $248,300
- 2018: 59 buildings, average cost: $251,100
- 2017: 60 buildings, average cost: $252,600
- 2016: 66 buildings, average cost: $247,200
- 2015: 55 buildings, average cost: $242,300
- 2014: 54 buildings, average cost: $231,500
- 2013: 38 buildings, average cost: $223,800
- 2012: 54 buildings, average cost: $219,600
- 2011: 35 buildings, average cost: $224,000
- 2010: 27 buildings, average cost: $206,500
- 2009: 39 buildings, average cost: $224,600
- 2008: 37 buildings, average cost: $192,900
- 2007: 62 buildings, average cost: $190,000
- 2006: 105 buildings, average cost: $188,800
- 2005: 111 buildings, average cost: $177,800
- 2004: 125 buildings, average cost: $160,300
- 2003: 115 buildings, average cost: $146,400
- 2002: 82 buildings, average cost: $143,300
- 2001: 96 buildings, average cost: $135,100
- 2000: 110 buildings, average cost: $107,400
- 1999: 145 buildings, average cost: $102,500
- 1998: 109 buildings, average cost: $92,600
- 1997: 107 buildings, average cost: $102,900
Median real estate property taxes paid for housing units with mortgages in 2022: $4,269 (0.6%)
Median real estate property taxes paid for housing units with no mortgage in 2022: $4,964 (0.8%)
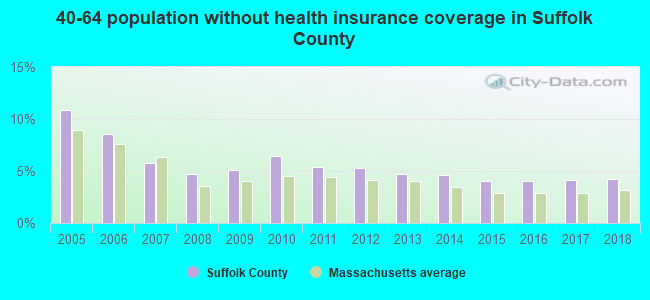
| Suffolk County: | 16.4% |
| Massachusetts: | 10.4% |
Median age of residents in 2022: 34.1 years old
(Males: 33.6 years old, Females: 34.6 years old)
(Median age for: White residents: 34.9 years old, Black residents: 35.8 years old, American Indian residents: 38.0 years old, Asian residents: 34.1 years old, Hispanic or Latino residents: 31.6 years old, Other race residents: 32.5 years old)
Area name: Boston-Cambridge-Quincy, MA-NH HUD Metro FMR Area
Fair market rent in 2006 for a 1-bedroom apartment in Suffolk County is $1128 a month.
Fair market rent for a 2-bedroom apartment is $1324 a month.
Fair market rent for a 3-bedroom apartment is $1584 a month.
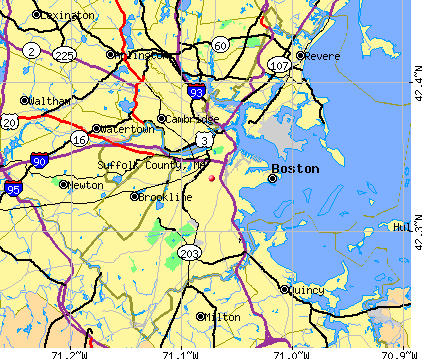
Cities in this county include: Boston, Revere, Chelsea, Winthrop, Winthrop Town.
2023 air pollution in Suffolk County:
Carbon Monoxide: 0.226 ppm (standard limit: 9 ppm). Near U.S. average.
Nitrogen Dioxide: 0.01 ppm (standard limit: 0.053 ppm). Above U.S. average.
Ozone (1-hour): 0.031 ppm (standard limit: 0.12 ppm). Near U.S. average.
Particulate Matter (PM10) Annual: 17.3 µg/m3. Near U.S. average.
Particulate Matter (PM2.5) Annual: 7.5 µg/m3(standard limit: 15.0 µg/m3). Near U.S. average.
Sulfur Oxides Annual: 0.000 ppm (standard limit: 0.03 ppm). Near U.S. average.
Neighboring counties: Bannock County, Idaho  , Dawes County, Nebraska , Garden County, Nebraska , Morrill County, Nebraska , Sioux County, Nebraska .
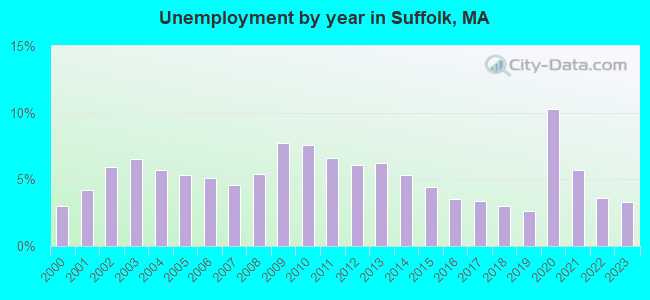
| Here: | 3.3% |
| Massachusetts: | 3.5% |
Current college students: 91,260
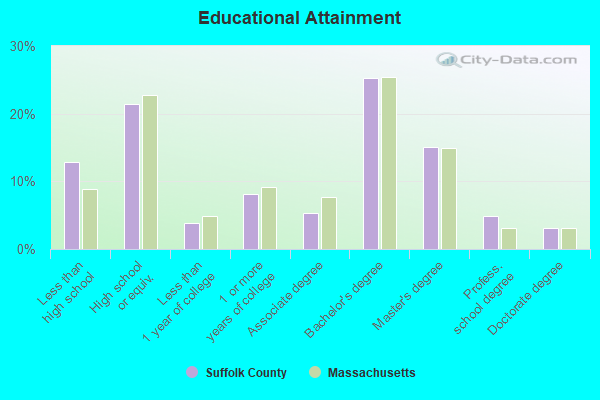
People 25 years of age or older with a high school degree or higher: 87.9%
People 25 years of age or older with a bachelor's degree or higher: 49.9%
Number of foreign born residents: 227,433 (54.3% naturalized citizens)
| Suffolk County: | 29.7% |
| Whole state: | 18.0% |
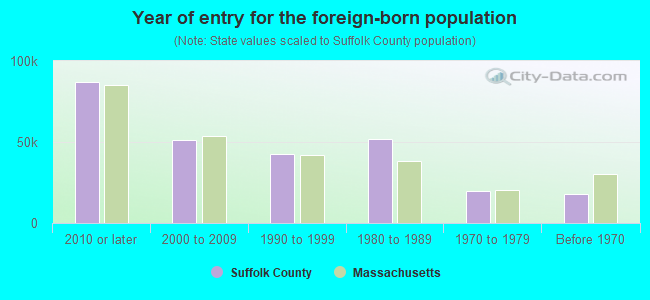
- Year of entry for the foreign-born population
- 94,2172010 or later
- 47,5402000 to 2009
- 37,6941990 to 1999
- 52,0891980 to 1989
- 19,4971970 to 1979
- 18,037Before 1970
Mean travel time to work (commute): minutes
Percentage of county residents living and working in this county: 99.0%
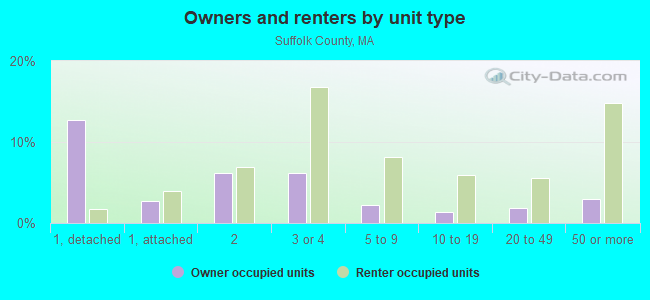
Housing units in structures:
- One, detached: 47,080
- One, attached: 20,555
- Two: 50,173
- 3 or 4: 79,523
- 5 to 9: 39,814
- 10 to 19: 24,312
- 20 to 49: 29,884
- 50 or more: 65,113
- Mobile homes: 859
- Boats, RVs, vans, etc.: 38
Housing units in Suffolk County with a mortgage: 81,348 (10,354 second mortgage, 582 home equity loan, 8,358 both second mortgage and home equity loan)
Houses without a mortgage: 1,784
| Here: | 98.8% with mortgage |
| State: | 96.2% with mortgage |
Religion statistics for Suffolk County
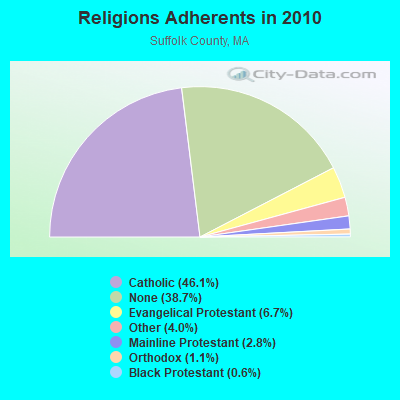
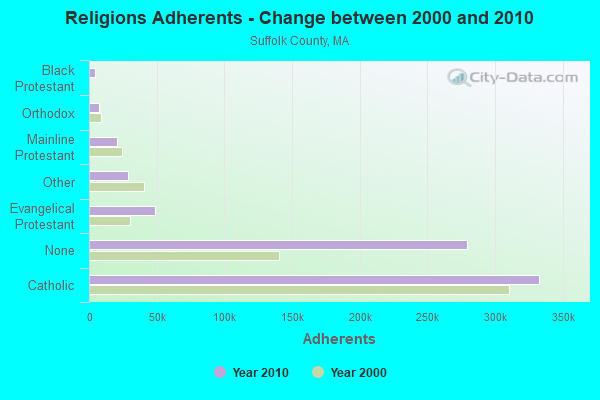
| Religion | Adherents | Congregations |
|---|---|---|
| Catholic | 332,744 | 56 |
| Evangelical Protestant | 48,562 | 180 |
| Other | 29,094 | 71 |
| Mainline Protestant | 20,380 | 103 |
| Orthodox | 7,693 | 17 |
| Black Protestant | 4,176 | 23 |
| None | 279,374 | - |
Source: Clifford Grammich, Kirk Hadaway, Richard Houseal, Dale E.Jones, Alexei Krindatch, Richie Stanley and Richard H.Taylor. 2012. 2010 U.S.Religion Census: Religious Congregations & Membership Study. Association of Statisticians of American Religious Bodies. Jones, Dale E., et al. 2002. Congregations and Membership in the United States 2000. Nashville, TN: Glenmary Research Center.
Food Environment Statistics:
| Suffolk County: | 2.47 / 10,000 pop. |
| State: | 1.98 / 10,000 pop. |
| This county: | 3.29 / 10,000 pop. |
| Massachusetts: | 2.22 / 10,000 pop. |
| Suffolk County: | 0.74 / 10,000 pop. |
| Massachusetts: | 1.77 / 10,000 pop. |
| This county: | 10.53 / 10,000 pop. |
| State: | 8.76 / 10,000 pop. |
| Suffolk County: | 8.0% |
| Massachusetts: | 8.1% |
| Suffolk County: | 21.4% |
| State: | 22.5% |
| Here: | 17.1% |
| State: | 16.5% |
Agriculture in Suffolk County:
Average value of agricultural products sold per farm: $44,250The value of livestock, poultry, and their products as a percentage of the total market value of agricultural products sold: 19.77%
Average total farm production expenses per farm: $29,469
The percentage of farms operated by a family or individual: 37.50%
Average age of principal farm operators: 50 years
Earthquake activity:
Suffolk County-area historical earthquake activity is significantly above Massachusetts state average. It is 73% smaller than the overall U.S. average.On 10/7/1983 at 10:18:46, a magnitude 5.3 (5.1 MB, 5.3 LG, 5.1 ML, Class: Moderate, Intensity: VI - VII) earthquake occurred 199.3 miles away from Suffolk County center
On 4/20/2002 at 10:50:47, a magnitude 5.3 (5.3 ML, Depth: 3.0 mi) earthquake occurred 200.1 miles away from the county center
On 1/19/1982 at 00:14:42, a magnitude 4.7 (4.5 MB, 4.7 MD, 4.5 LG, Class: Light, Intensity: IV - V) earthquake occurred 84.9 miles away from the county center
On 10/16/2012 at 23:12:25, a magnitude 4.7 (4.7 ML, Depth: 10.0 mi) earthquake occurred 89.8 miles away from the county center
On 4/20/2002 at 10:50:47, a magnitude 5.2 (5.2 MB, 4.2 MS, 5.2 MW, 5.0 MW) earthquake occurred 199.5 miles away from Suffolk County center
On 8/22/1992 at 12:20:32, a magnitude 4.8 (4.8 MB, 3.8 MS, 4.7 LG, Depth: 6.2 mi) earthquake occurred 226.8 miles away from the county center
Magnitude types: regional Lg-wave magnitude (LG), body-wave magnitude (MB), duration magnitude (MD), local magnitude (ML), surface-wave magnitude (MS), moment magnitude (MW)
Most recent natural disasters:
- Massachusetts Covid-19 Pandemic, Incident Period: January 20, 2020, FEMA Id: 4496, Natural disaster type: Other
- Massachusetts Severe Winter Storm And Snowstorm, Incident Period: March 13, 2018 - March 14, 2018, FEMA Id: 4379, Natural disaster type: Snowstorm, Winter Storm
- Massachusetts Severe Winter Storm, Snowstorm, and Flooding, Incident Period: January 26, 2015 to January 29, 2015, Major Disaster (Presidential) Declared DR-4214: April 13, 2015, FEMA Id: 4214, Natural disaster type: Snowstorm, Winter Storm, Flood
- Massachusetts Explosions, Incident Period: April 15, 2013 to April 22, 2013, Emergency Declared EM-3362: April 17, 2013, FEMA Id: 3362, Natural disaster type: Explosion
- Massachusetts Severe Winter Storm, Snowstorm, and Flooding, Incident Period: February 08, 2013 to February 10, 2013, Major Disaster (Presidential) Declared DR-4110: April 19, 2013, FEMA Id: 4110, Natural disaster type: Snowstorm, Winter Storm, Flood
- Massachusetts Hurricane Sandy, Incident Period: October 27, 2012 to November 08, 2012, Emergency Declared EM-3350: October 28, 2012, FEMA Id: 3350, Natural disaster type: Hurricane
- Massachusetts Hurricane Sandy, Incident Period: October 27, 2012 to November 08, 2012, Major Disaster (Presidential) Declared DR-4097: December 19, 2012, FEMA Id: 4097, Natural disaster type: Hurricane
- Massachusetts Hurricane Irene, Incident Period: August 26, 2011 to September 05, 2011, Emergency Declared EM-3330: August 26, 2011, FEMA Id: 3330, Natural disaster type: Hurricane
- Massachusetts Severe Winter Storm and Snowstorm, Incident Period: January 11, 2011 to January 12, 2011, Major Disaster (Presidential) Declared DR-1959: March 07, 2011, FEMA Id: 1959, Natural disaster type: Snowstorm, Winter Storm
- Massachusetts Hurricane Earl, Incident Period: September 01, 2010 to September 04, 2010, Emergency Declared EM-3315: September 02, 2010, FEMA Id: 3315, Natural disaster type: Hurricane
- 23 other natural disasters have been reported since 1953.
The number of natural disasters in Suffolk County (33) is a lot greater than the US average (15).
Major Disasters (Presidential) Declared: 18
Emergencies Declared: 13
Causes of natural disasters: Floods: 11, Storms: 8, Hurricanes: 7, Snowstorms: 6, Winter Storms: 5, Blizzards: 3, Snows: 3, Explosion: 1, Fire: 1, Heavy Rain: 1, Snowfall: 1, Water Main Break: 1, Wind: 1, Other: 1 (Note: some incidents may be assigned to more than one category).
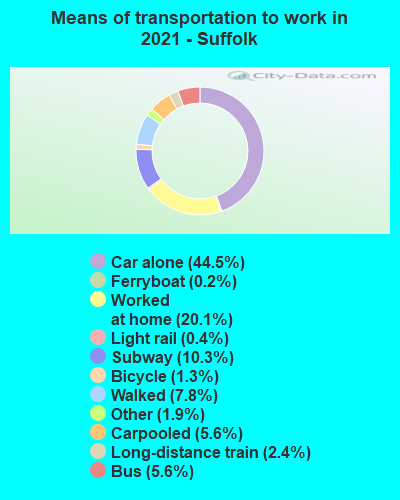
Means of transportation to work:
- Drove a car alone: 281,699 (43.4%)
- Carpooled: 46,473 (7.2%)
- Bus: 47,306 (7.3%)
- Subway or elevated rail: 85,515 (13.2%)
- Long-distance train or commuter rail: 25,578 (3.9%)
- Light rail, streetcar or trolley: 3,185 (0.5%)
- Ferryboat: 2,010 (0.3%)
- Taxicab, motorcycle, or other means: 11,681 (1.8%)
- Bicycle: 10,081 (1.6%)
- Walked: 53,740 (8.3%)
- Worked at home: 81,957 (12.6%)

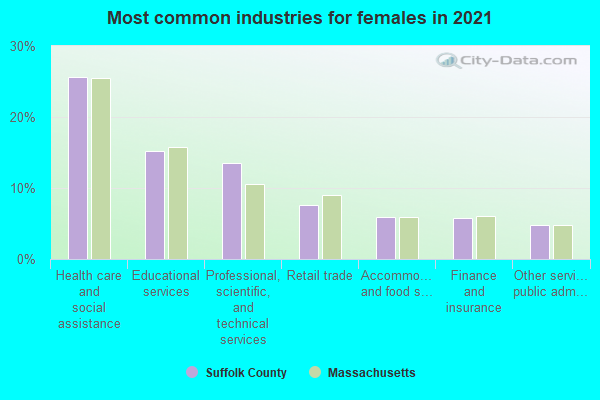
- Health care and social assistance (27%)
- Educational services (17%)
- Professional, scientific, and technical services (12%)
- Retail trade (9%)
- Accommodation and food services (6%)
- Finance and insurance (6%)
- Other services, except public administration (5%)
- Health care and social assistance (26%)
- Educational services (17%)
- Professional, scientific, and technical services (12%)
- Retail trade (9%)
- Accommodation and food services (6%)
- Finance and insurance (6%)
- Other services, except public administration (4%)
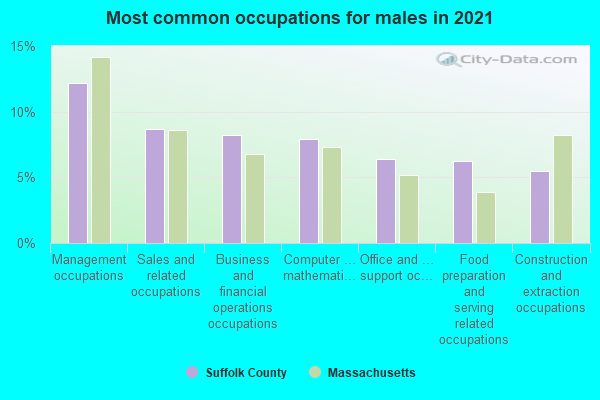
- Management occupations (14%)
- Business and financial operations occupations (9%)
- Sales and related occupations (7%)
- Computer and mathematical occupations (7%)
- Construction and extraction occupations (6%)
- Food preparation and serving related occupations (6%)
- Office and administrative support occupations (6%)
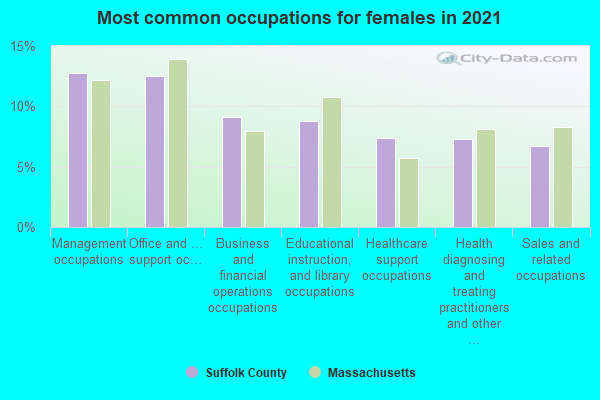
- Management occupations (13%)
- Office and administrative support occupations (10%)
- Educational instruction, and library occupations (9%)
- Health diagnosing and treating practitioners and other technical occupations (8%)
- Business and financial operations occupations (8%)
- Sales and related occupations (8%)
- Healthcare support occupations (6%)
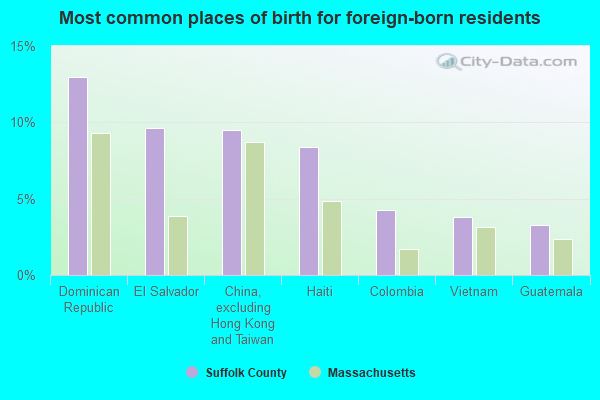
- Dominican Republic (11%)
- China, excluding Hong Kong and Taiwan (8%)
- El Salvador (8%)
- Colombia (8%)
- Haiti (7%)
- Guatemala (4%)
- Cabo Verde (4%)
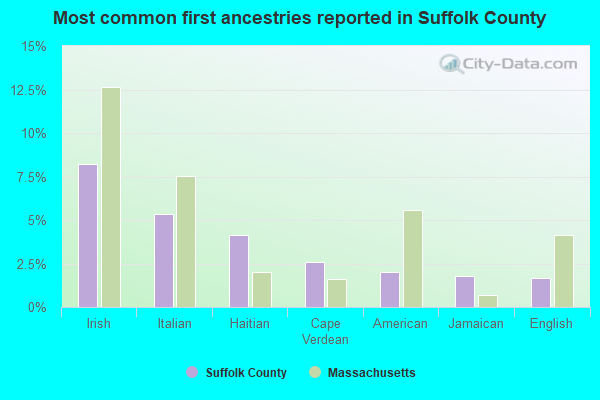
- Irish (8%)
- Italian (5%)
- Haitian (4%)
- Cape Verdean (2%)
- American (2%)
- Jamaican (2%)
- English (2%)
People in group quarters in Suffolk County, Massachusetts in 2010:
- 33,381 people in college/university student housing
- 4,078 people in nursing facilities/skilled-nursing facilities
- 2,952 people in emergency and transitional shelters (with sleeping facilities) for people experiencing homelessness
- 2,239 people in local jails and other municipal confinement facilities
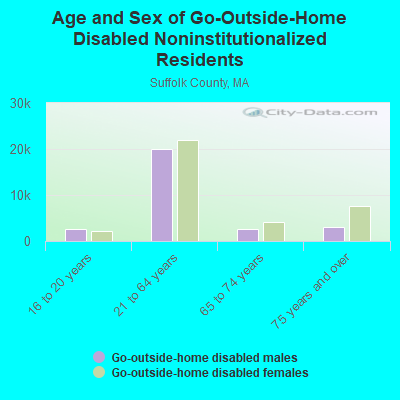
- 1,166 people in other noninstitutional facilities
- 1,001 people in group homes intended for adults
- 646 people in residential treatment centers for adults
- 336 people in mental (psychiatric) hospitals and psychiatric units in other hospitals
- 280 people in military ships
- 253 people in workers' group living quarters and job corps centers
- 218 people in state prisons
- 186 people in hospitals with patients who have no usual home elsewhere
- 165 people in correctional residential facilities
- 111 people in residential treatment centers for juveniles (non-correctional)
- 77 people in group homes for juveniles (non-correctional)
- 77 people in correctional facilities intended for juveniles
- 54 people in military barracks and dormitories (nondisciplinary)
- 8 people in in-patient hospice facilities
People in group quarters in Suffolk County, Massachusetts in 2000:
- 20,275 people in college dormitories (includes college quarters off campus)
- 5,252 people in nursing homes
- 2,984 people in other noninstitutional group quarters
- 2,171 people in local jails and other confinement facilities (including police lockups)
- 929 people in hospitals/wards and hospices for chronically ill
- 903 people in homes or halfway houses for drug/alcohol abuse
- 720 people in other nonhousehold living situations
- 705 people in hospices or homes for chronically ill
- 586 people in religious group quarters
- 418 people in mental (psychiatric) hospitals or wards
- 389 people in homes for the mentally retarded
- 372 people in other group homes
- 336 people in homes for the mentally ill
- 224 people in other hospitals or wards for chronically ill
- 209 people in orthopedic wards and institutions for the physically handicapped
- 145 people in halfway houses
- 136 people in training schools for juvenile delinquents
- 115 people in state prisons
- 97 people in military ships
- 94 people in wards in general hospitals for patients who have no usual home elsewhere
- 85 people in unknown juvenile institutions
- 79 people in military barracks, etc.
- 75 people in residential treatment centers for emotionally disturbed children
- 60 people in short-term care, detention or diagnostic centers for delinquent children
- 52 people in other types of correctional institutions
- 32 people in homes for abused, dependent, and neglected children
- 30 people in homes for the physically handicapped
- 17 people in hospitals or wards for drug/alcohol abuse
- 16 people in agriculture workers' dormitories on farms
- 13 people in schools, hospitals, or wards for the intellectually disabled
- 3 people in other workers' dormitories
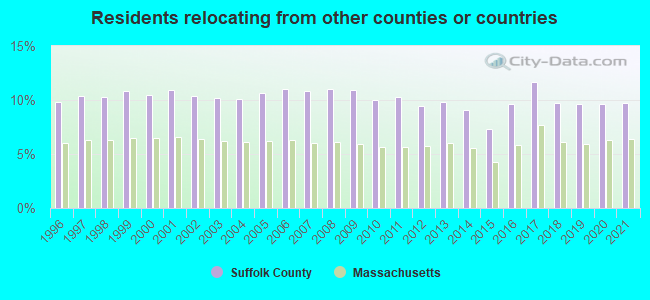
9.75% of this county's 2021 resident taxpayers lived in other counties in 2020 ($100,939 average adjusted gross income)
| Here: | 9.75% |
| Massachusetts average: | 6.35% |
0.01% of residents moved from foreign countries ($81 average AGI)
Suffolk County: 0.01% Massachusetts average: 0.01%
5.53% relocated from other counties in Massachusetts ($58,712 average AGI)
4.21% relocated from other states ($42,146 average AGI)
Suffolk County: 4.21% Massachusetts average: 2.58%
Top counties from which taxpayers relocated into this county between 2020 and 2021:
| from Middlesex County, MA | |
| from Norfolk County, MA | |
| from Essex County, MA | |
| from Plymouth County, MA | |
| from New York County, NY | |
| from Worcester County, MA | |
| from Bristol County, MA |
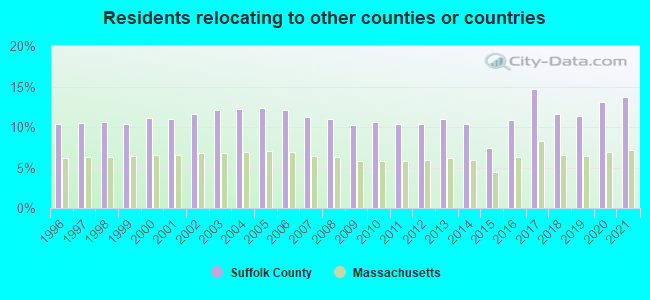
13.75% of this county's 2020 resident taxpayers moved to other counties in 2021 ($123,761 average adjusted gross income)
| Here: | 13.75% |
| Massachusetts average: | 7.18% |
0.03% of residents moved to foreign countries ($317 average AGI)
Suffolk County: 0.03% Massachusetts average: 0.02%
8.25% relocated to other counties in Massachusetts ($68,377 average AGI)
5.47% relocated to other states ($55,067 average AGI)
Suffolk County: 5.47% Massachusetts average: 3.43%
Top counties to which taxpayers relocated from this county between 2020 and 2021:
| to Middlesex County, MA | |
| to Norfolk County, MA | |
| to Essex County, MA | |
| to Plymouth County, MA | |
| to Worcester County, MA | |
| to Bristol County, MA | |
| to New York County, NY |
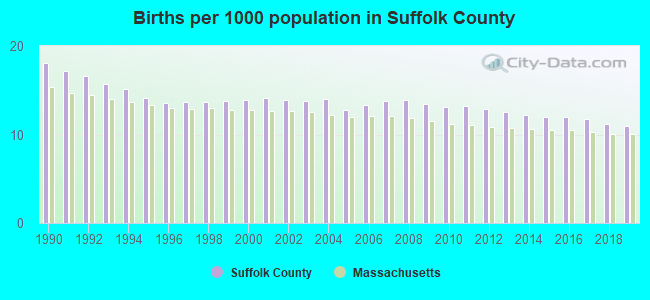
Births per 1000 population from 1990 to 1999: 15.2
Births per 1000 population from 2000 to 2009: 13.7
Births per 1000 population from 2010 to 2022: 10.2
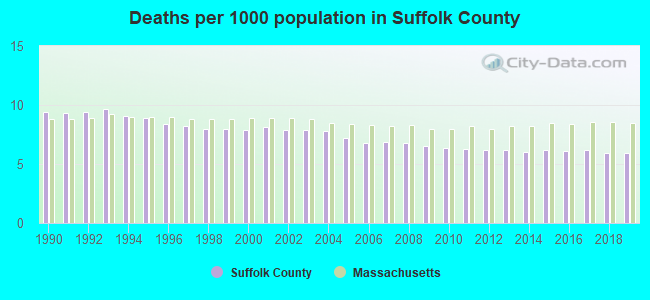
Deaths per 1000 population from 1990 to 1999: 8.8
Deaths per 1000 population from 2000 to 2009: 7.4
Deaths per 1000 population from 2010 to 2020: 6.2
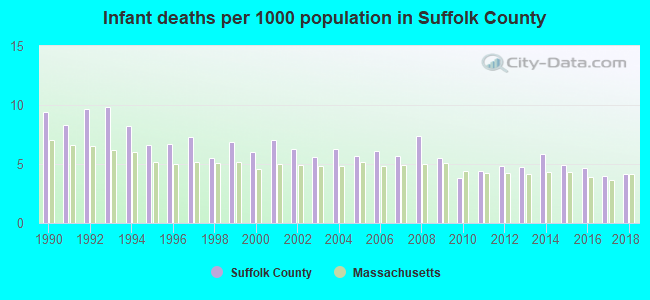
Infant deaths per 1000 live births from 1990 to 1999: 7.8
Infant deaths per 1000 live births from 2000 to 2009: 6.2
Infant deaths per 1000 live births from 2010 to 2021: 4.5
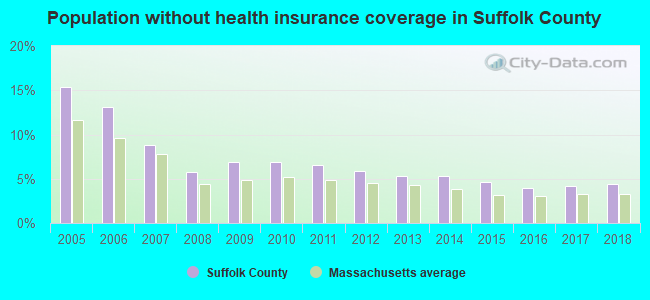
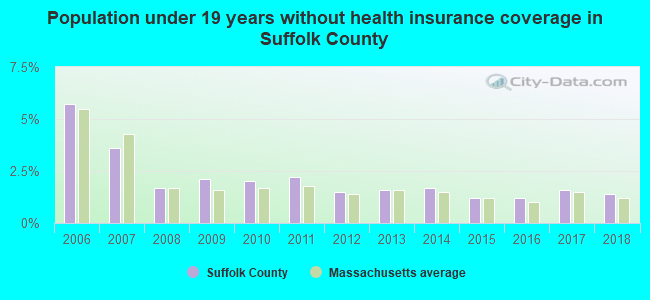
Persons under 19 years old without health insurance coverage in 2018: 1.4%
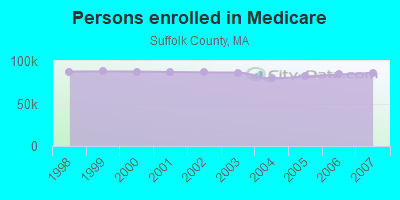
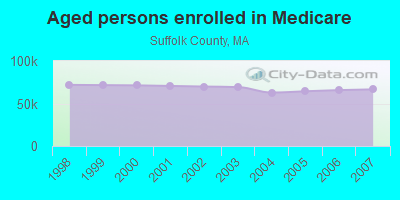
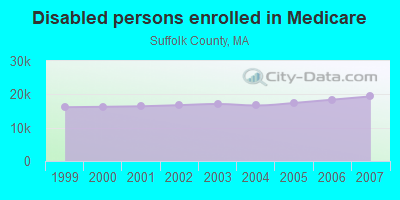
Persons enrolled in hospital insurance and/or supplemental medical insurance (Medicare) in July 1, 2007: 86,006 (66,615 aged, 19,391 disabled)
Children under 18 without health insurance coverage in 2007: 10,863 (7%)
Most common underlying causes of death in Suffolk County, Massachusetts in 1999 - 2019:
- Bronchus or lung, unspecified - Malignant neoplasms (6,360)
- Atherosclerotic heart disease (5,620)
- Unspecified dementia (5,343)
- Acute myocardial infarction, unspecified (4,107)
- Chronic obstructive pulmonary disease, unspecified (3,031)
- Atherosclerotic cardiovascular disease, so described (2,772)
- Pneumonia, unspecified (2,524)
- Stroke, not specified as haemorrhage or infarction (2,334)
- Alzheimer disease, unspecified (2,315)
- Congestive heart failure (2,302)
Population without health insurance coverage in 2000: 14%
Children under 18 without health insurance coverage in 2000: 6%
Short term general hospital admissions per 100,000 population in 2004: 31,676
Short term general hospital beds per 100,000 population in 2004: 635
Emergency room visits per 100,000 population in 2004: 69,478
General practice office based MDs per 100,000 population in 2005: 1,457
Medical specialist MDs per 100,000 population in 2005: 809
Dentists per 100,000 population in 1998: 23
Total births per 100,000 population, July 2005 - July 2006 : 59
Total deaths per 100,000 population, July 2005 - July 2006: 133
Limited-service eating places per 100,000 population in 2005 : 16
Beer, wine & liquor stores per 100,000 population in 2005: 1
Fitness & recreation sports centers per 100,000 population in 2005: 8,367
EPA green book nonattainment status in 2004-2006: 1
Homicides per 1,000,000 population from 2000 to 2006: 86.4. This is more than state average.
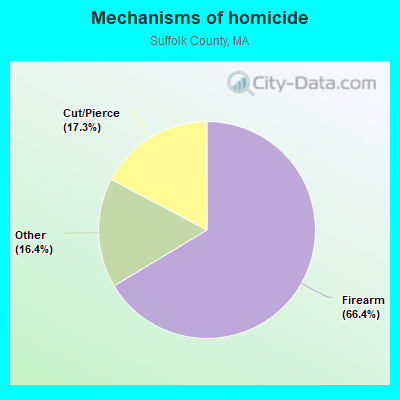
- Firearm - 57.3
- Cut/Pierce - 14.9
- Other - 14.1
Suicides per 1,000,000 population from 2000 to 2006: 53.3. This is less than state average.
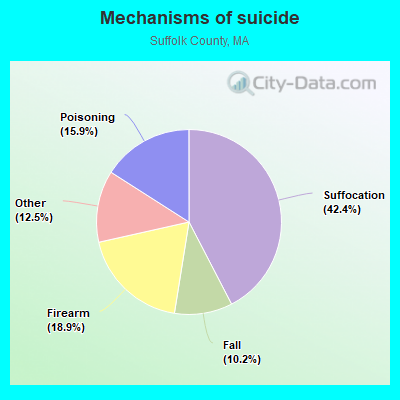
- Suffocation - 22.6
- Firearm - 10.1
- Poisoning - 8.5
- Fall - 5.4
- Other - 6.7
Household type by relationship:
Households: 766,381- Male householders: 146,623 (54,026 living alone), Female householders: 183,478 (67,531 living alone)
93,014 spouses (90,014 opposite-sex spouses), 28,480 unmarried partners, (26,734 opposite-sex unmarried partners), 160,821 children (156,148 natural, 1,317 adopted, 3,356 stepchildren), 10,729 grandchildren, 12,312 brothers or sisters, 14,637 parents, 79 foster children, 15,515 other relatives, 54,816 non-relatives
- In group quarters: 45,877
Size of family households: 67,489 2-persons, 41,712 3-persons, 26,356 4-persons, 14,356 5-persons, 3,912 6-persons, 3,794 7-or-more-persons.
Size of nonfamily households: 121,557 1-person, 36,541 2-persons, 9,125 3-persons, 3,038 4-persons, 1,419 5-persons, 548 6-persons, 254 7-or-more-persons.
62,590 married couples with children.
45,186 single-parent households (9,023 men, 36,163 women).
61.7% of residents of Suffolk speak English at home.
20.0% of residents speak Spanish at home (48% speak English very well, 22% speak English well, 18% speak English not well, 12% don't speak English at all).
9.5% of residents speak other Indo-European language at home (64% speak English very well, 19% speak English well, 13% speak English not well, 5% don't speak English at all).
5.9% of residents speak Asian or Pacific Island language at home (50% speak English very well, 18% speak English well, 21% speak English not well, 11% don't speak English at all).
2.8% of residents speak other language at home (65% speak English very well, 23% speak English well, 11% speak English not well, 2% don't speak English at all).
In fiscal year 2004:
Federal Government expenditure: $9,891,313,000 ($14,851 per capita)
Department of Defense expenditure: $294,240,000
Federal direct payments to individuals for retirement and disability: $1,695,686,000
Federal other direct payments to individuals: $1,287,154,000
Federal direct payments not to individuals: $73,607,000
Federal grants: $5,313,861,000
Federal procurement contracts: $433,763,000 ($133,333,000 Department of Defense)
Federal salaries and wages: $1,087,243,000 ($74,016,000 Department of Defense)
Federal Government direct loans: $510,613,000
Federal guaranteed/insured loans: $239,913,000
Federal Government insurance: $471,773,000
Population change from April 1, 2000 to July 1, 2005:
Births: 52,416| Here: | 80 per 1000 residents |
| State: | 67 per 1000 residents |
Deaths: 28,277
| Here: | 43 per 1000 residents |
| State: | 46 per 1000 residents |
Net international migration: +43,673
| Here: | +67 per 1000 residents |
| State: | +25 per 1000 residents |
Net internal migration: -102,023
| Here: | |
| State: |
Total withdrawal of fresh water for public supply: 0.00 millions of gallons per day (all from surface)
| Here: | 5.5 |
| State: | 6.5 |
| Here: | 3.8 |
| State: | 4.0 |
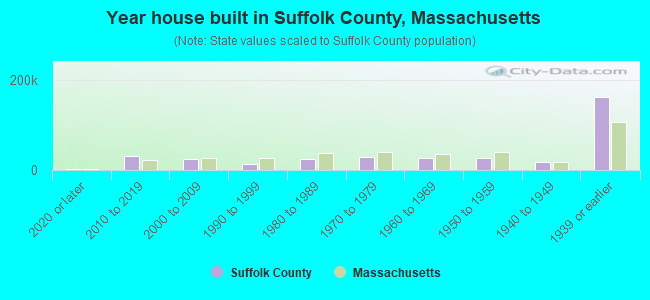
- Year house built in Suffolk County, Massachusetts
- 5,8982020 or later
- 36,0862010 to 2019
- 23,5492000 to 2009
- 14,3031990 to 1999
- 22,3411980 to 1989
- 29,1241970 to 1979
- 25,5891960 to 1969
- 25,6681950 to 1959
- 17,8701940 to 1949
- 156,9231939 or earlier
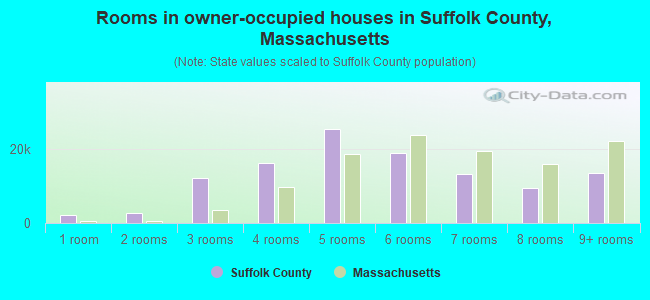
- Rooms in owner-occupied houses in Suffolk County, Massachusetts
- 2,0531 room
- 3,7292 rooms
- 13,0113 rooms
- 19,4334 rooms
- 21,5895 rooms
- 22,9376 rooms
- 12,9887 rooms
- 8,8708 rooms
- 14,5099+ rooms
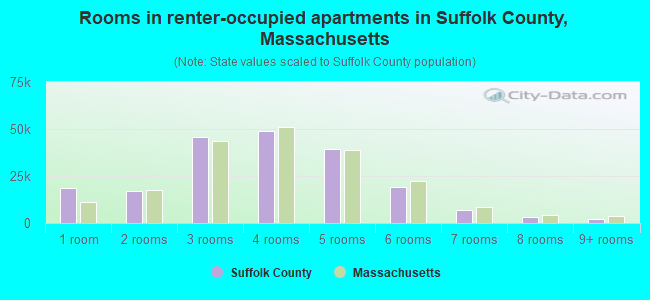
- Rooms in renter-occupied apartments in Suffolk County, Massachusetts
- 18,1951 room
- 24,2952 rooms
- 46,6833 rooms
- 50,1454 rooms
- 35,0635 rooms
- 24,9256 rooms
- 6,2437 rooms
- 2,9428 rooms
- 2,4919+ rooms
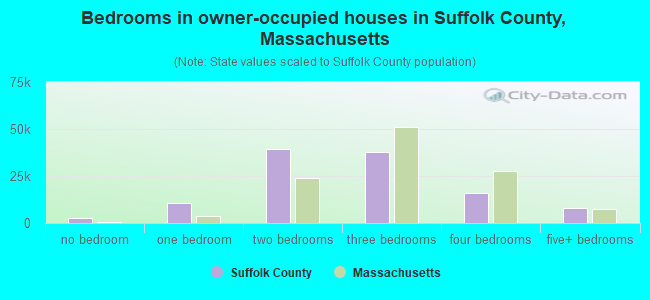
- Bedrooms in owner-occupied houses in Suffolk County, Massachusetts
- 2,364no bedroom
- 12,4491 bedroom
- 40,0882 bedrooms
- 39,2113 bedrooms
- 16,8554 bedrooms
- 8,1525+ bedrooms
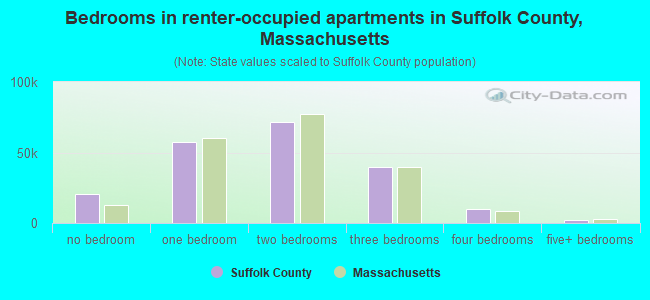
- Bedrooms in renter-occupied apartments in Suffolk County, Massachusetts
- 21,143no bedroom
- 64,3321 bedroom
- 71,6152 bedrooms
- 40,9903 bedrooms
- 10,2134 bedrooms
- 2,6895+ bedrooms

- Cars and other vehicles available in Suffolk County in owner-occupied houses/condos
- 13,990no vehicle
- 57,5011 vehicle
- 35,6802 vehicles
- 7,8743 vehicles
- 2,7484 vehicles
- 1,3265+ vehicles
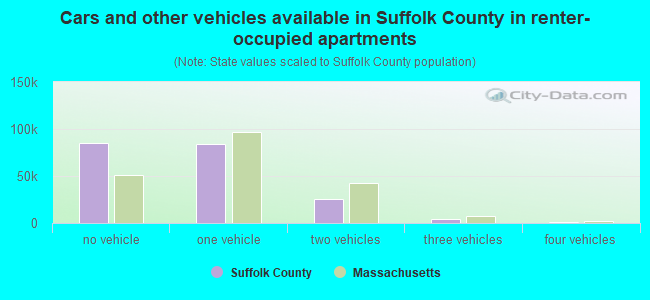
- Cars and other vehicles available in Suffolk County in renter-occupied apartments
- 94,665no vehicle
- 82,3191 vehicle
- 26,1932 vehicles
- 6,8153 vehicles
- 6404 vehicles
- 3505+ vehicles
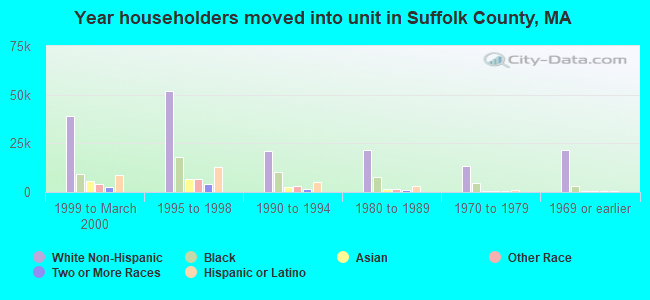
79.5% of Suffolk County residents lived in the same house 1 years ago.
Out of people who lived in different houses, 31% lived in this county.
Out of people who lived in different counties, 45% lived in Massachusetts.
| Suffolk County: | 79.5% |
| State average: | 87.7% |
Place of birth for U.S.-born residents:
- This state: 330,289
- Other state: 183,477
- Northeast: 90,267
- Midwest: 23,499
- South: 46,649
- West: 23,062
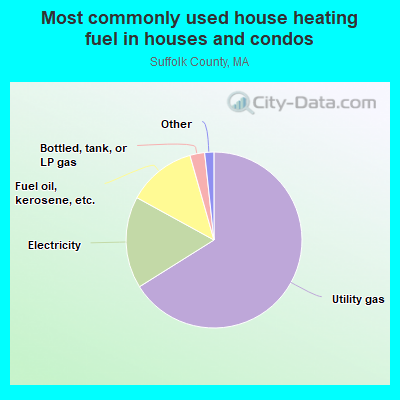
- 68.6%Utility gas
- 14.7%Electricity
- 12.9%Fuel oil, kerosene, etc.
- 2.9%Bottled, tank, or LP gas
- 0.5%No fuel used
- 0.3%Other fuel
- 0.1%Solar energy
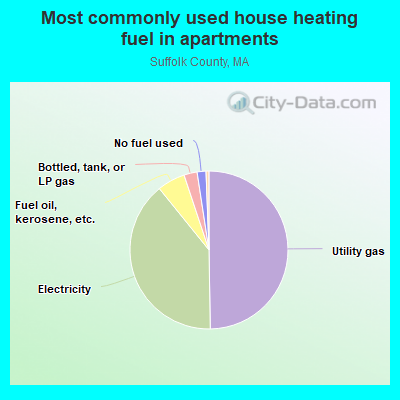
- 49.8%Utility gas
- 38.5%Electricity
- 4.7%Fuel oil, kerosene, etc.
- 3.2%Bottled, tank, or LP gas
- 2.7%No fuel used
- 1.1%Other fuel
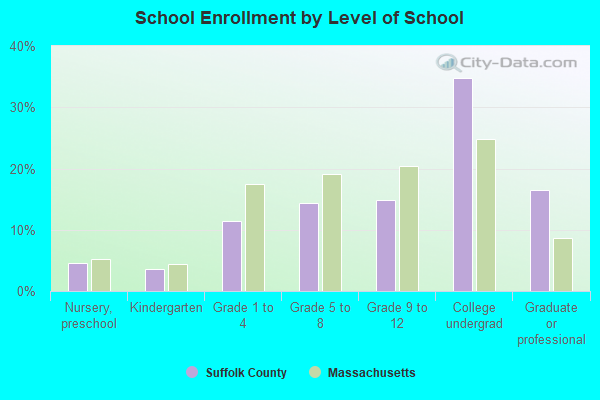
Private vs. public school enrollment:
| Here: | 12.8% |
| Massachusetts: | 10.3% |
| Here: | 14.5% |
| Massachusetts: | 12.3% |
| Here: | 75.6% |
| Massachusetts: | 51.2% |
Supplemental Security Income (SSI) in 2006:
- Total number of recipients: 35,158
- Number of aged recipients: 11,859
- Number of blind and disabled recipients: 23,299
- Number of recipients under 18: 3,505
- Number of recipients between 18 and 64: 19,073
- Number of recipients older than 64: 12,580
- Number of recipients also receiving OASDI: 11,217
- Amount of payments (thousands of dollars): 18,390
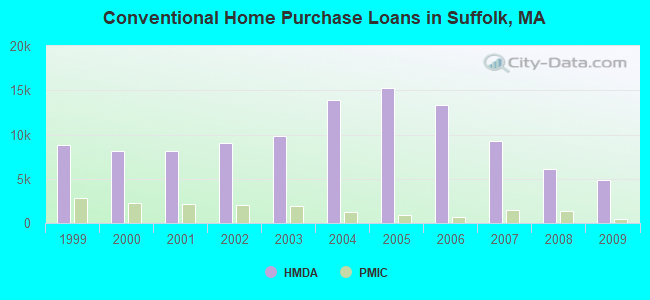
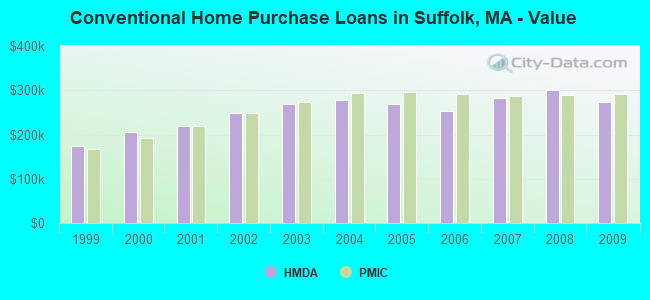
| Home Mortgage Disclosure Act Aggregated Statistics For Year 2009 (Based on 173 full tracts) | ||||||||||||||
| A) FHA, FSA/RHS & VA Home Purchase Loans | B) Conventional Home Purchase Loans | C) Refinancings | D) Home Improvement Loans | E) Loans on Dwellings For 5+ Families | F) Non-occupant Loans on < 5 Family Dwellings (A B C & D) | G) Loans On Manufactured Home Dwelling (A B C & D) | ||||||||
|---|---|---|---|---|---|---|---|---|---|---|---|---|---|---|
| Number | Average Value | Number | Average Value | Number | Average Value | Number | Average Value | Number | Average Value | Number | Average Value | Number | Average Value | |
| LOANS ORIGINATED | 1,148 | $281,543 | 4,890 | $272,958 | 11,709 | $295,207 | 416 | $133,464 | 127 | $2,120,559 | 1,552 | $301,737 | 2 | $227,500 |
| APPLICATIONS APPROVED, NOT ACCEPTED | 108 | $264,519 | 372 | $278,543 | 880 | $304,464 | 71 | $151,465 | 7 | $904,571 | 145 | $289,862 | 1 | $202,000 |
| APPLICATIONS DENIED | 406 | $261,938 | 1,095 | $232,012 | 3,875 | $299,623 | 370 | $96,676 | 17 | $2,192,000 | 675 | $278,335 | 5 | $52,200 |
| APPLICATIONS WITHDRAWN | 214 | $265,136 | 773 | $276,343 | 2,296 | $296,336 | 79 | $243,025 | 7 | $957,000 | 333 | $285,366 | 1 | $258,000 |
| FILES CLOSED FOR INCOMPLETENESS | 58 | $241,155 | 186 | $244,613 | 725 | $274,710 | 48 | $208,979 | 1 | $40,000 | 77 | $285,247 | 1 | $39,000 |
| Private Mortgage Insurance Companies Aggregated Statistics For Year 2009 (Based on 152 full tracts) | ||||||
| A) Conventional Home Purchase Loans | B) Refinancings | C) Non-occupant Loans on < 5 Family Dwellings (A & B) | ||||
|---|---|---|---|---|---|---|
| Number | Average Value | Number | Average Value | Number | Average Value | |
| LOANS ORIGINATED | 479 | $291,455 | 283 | $307,491 | 7 | $330,714 |
| APPLICATIONS APPROVED, NOT ACCEPTED | 165 | $272,485 | 110 | $295,691 | 9 | $177,889 |
| APPLICATIONS DENIED | 162 | $295,333 | 135 | $305,452 | 2 | $379,000 |
| APPLICATIONS WITHDRAWN | 37 | $300,946 | 30 | $314,467 | 0 | $0 |
| FILES CLOSED FOR INCOMPLETENESS | 19 | $297,632 | 11 | $300,182 | 2 | $286,500 |
| Most common first names in Suffolk County, MA among deceased individuals | ||
| Name | Count | Lived (average) |
|---|---|---|
| Mary | 6,567 | 80.6 years |
| John | 5,431 | 73.1 years |
| Joseph | 3,434 | 73.6 years |
| William | 3,098 | 72.8 years |
| James | 2,831 | 70.9 years |
| Margaret | 2,373 | 80.2 years |
| Helen | 1,872 | 79.6 years |
| Charles | 1,806 | 73.7 years |
| Robert | 1,797 | 66.2 years |
| Anna | 1,770 | 81.1 years |
| Most common last names in Suffolk County, MA among deceased individuals | ||
| Last name | Count | Lived (average) |
|---|---|---|
| Smith | 917 | 74.7 years |
| Sullivan | 739 | 76.8 years |
| Johnson | 648 | 72.8 years |
| Williams | 618 | 70.9 years |
| Murphy | 555 | 76.4 years |
| Brown | 535 | 74.0 years |
| Jones | 522 | 72.0 years |
| Obrien | 417 | 76.1 years |
| Mccarthy | 408 | 76.6 years |
| White | 399 | 74.4 years |
| Businesses in Suffolk County, MA | ||||
| Name | Count | Name | Count | |
|---|---|---|---|---|
| 7-Eleven | 35 | Jones New York | 3 | |
| ALDO | 3 | KFC | 6 | |
| AT&T | 9 | LensCrafters | 1 | |
| Abercrombie & Fitch | 1 | Levi Strauss & Co. | 1 | |
| Ace Hardware | 6 | Long John Silver's | 1 | |
| Advance Auto Parts | 8 | Macy's | 2 | |
| American Eagle Outfitters | 2 | Marriott | 10 | |
| Ann Taylor | 5 | Marshalls | 4 | |
| Apple Store | 2 | MasterBrand Cabinets | 16 | |
| Applebee's | 2 | McDonald's | 32 | |
| Ashley Furniture | 6 | Men's Wearhouse | 3 | |
| AutoZone | 8 | Motherhood Maternity | 2 | |
| Avenue | 1 | New Balance | 11 | |
| BMW | 1 | Nike | 17 | |
| Bally Total Fitness | 3 | OfficeMax | 2 | |
| Banana Republic | 4 | Old Navy | 2 | |
| Barnes & Noble | 2 | Olive Garden | 1 | |
| Bath & Body Works | 3 | Panda Express | 3 | |
| Bebe | 2 | Panera Bread | 5 | |
| Bed Bath & Beyond | 3 | Papa John's Pizza | 4 | |
| Ben & Jerry's | 6 | Payless | 11 | |
| Best Western | 3 | Penske | 1 | |
| Blockbuster | 3 | PetSmart | 1 | |
| Brooks Brothers | 3 | Pizza Hut | 2 | |
| Brookstone | 3 | Popeyes | 2 | |
| Budget Car Rental | 2 | Pottery Barn | 1 | |
| Burger King | 16 | Pottery Barn Kids | 1 | |
| CVS | 39 | Qdoba Mexican Grill | 7 | |
| Cache | 1 | Quiznos | 3 | |
| Chico's | 2 | RadioShack | 12 | |
| Chipotle | 4 | Ramada | 1 | |
| Clarks | 1 | Rite Aid | 12 | |
| Cold Stone Creamery | 2 | Rodeway Inn | 1 | |
| Comfort Inn | 2 | Ryder Rental & Truck Leasing | 1 | |
| Costco | 1 | Saks Fifth Avenue | 1 | |
| Crate & Barrel | 2 | Sephora | 2 | |
| Curves | 2 | Shaw's | 10 | |
| DHL | 5 | Sheraton | 1 | |
| Dairy Queen | 1 | Skechers USA | 1 | |
| Decora Cabinetry | 8 | Soma Intimates | 1 | |
| Domino's Pizza | 10 | Sprint Nextel | 6 | |
| DressBarn | 1 | Staples | 7 | |
| Dressbarn | 1 | Starbucks | 56 | |
| Dunkin Donuts | 152 | Stop & Shop | 12 | |
| Eddie Bauer | 1 | Suburban | 1 | |
| Express | 1 | Subway | 27 | |
| Famous Footwear | 3 | T-Mobile | 26 | |
| FedEx | 143 | T.G.I. Driday's | 2 | |
| Firestone Complete Auto Care | 3 | T.J.Maxx | 2 | |
| Foot Locker | 3 | Taco Bell | 3 | |
| Forever 21 | 1 | Talbots | 1 | |
| GNC | 10 | Target | 3 | |
| GameStop | 7 | The Cheesecake Factory | 2 | |
| Gap | 3 | The Room Place | 1 | |
| Goodwill | 2 | Toyota | 3 | |
| Gymboree | 1 | Toys"R"Us | 4 | |
| H&M | 2 | Trader Joe's | 1 | |
| H&R Block | 23 | True Value | 9 | |
| Haworth | 2 | U-Haul | 10 | |
| Hilton | 9 | UPS | 142 | |
| Holiday Inn | 3 | Urban Outfitters | 3 | |
| Home Depot | 4 | Verizon Wireless | 7 | |
| Honda | 3 | Victoria's Secret | 3 | |
| Howard Johnson | 2 | Walgreens | 17 | |
| Hyatt | 2 | Wendy's | 9 | |
| IHOP | 2 | Westin | 2 | |
| J. Jill | 2 | Wet Seal | 1 | |
| J.Crew | 3 | Whole Foods Market | 3 | |
| Jamba Juice | 1 | YMCA | 14 | |
| JoS. A. Bank | 2 | |||
Suffolk County on our top lists:
- #5 on the list of "Top 101 counties with the lowest percentage of residents that keep firearms around their homes"
- #9 on the list of "Top 101 counties with the largest decrease in the number of deaths per 1000 residents 2000-2006 to 2007-2013 (pop. 50,000+)"
- #19 on the list of "Top 101 counties with highest percentage of residents voting for Obama (Democrat) in the 2012 Presidential Election (pop. 50,000+)"
- #20 on the list of "Top 101 counties with the most Orthodox congregations (pop. 50,000+)"
- #21 on the list of "Top 101 counties with the most Orthodox congregations"
- #31 on the list of "Top 101 counties with the most Catholic adherents"
- #31 on the list of "Top 101 counties with the most Catholic adherents (pop. 50,000+)"
- #37 on the list of "Top 101 counties with the most Orthodox adherents"
- #37 on the list of "Top 101 counties with the most Orthodox adherents (pop. 50,000+)"
- #38 on the list of "Top 101 counties with highest percentage of residents voting for Obama (Democrat) in the 2012 Presidential Election"
- #47 on the list of "Top 101 counties with the most Catholic congregations (pop. 50,000+)"
- #51 on the list of "Top 101 counties with the most Catholic congregations"
- #52 on the list of "Top 101 counties with the lowest Ozone (1-hour) air pollution readings in 2012 (ppm)"
- #52 on the list of "Top 101 counties with the highest percentage of residents relocating to other counties in 2011 (pop. 50,000+)"
- #55 on the list of "Top 101 counties with the lowest Particulate Matter (PM10) Annual air pollution readings in 2012 (µg/m3)"
- #59 on the list of "Top 101 counties with the highest carbon monoxide air pollution readings in 2012 (ppm)"
- #64 on the list of "Top 101 counties with the highest percentage of residents relocating from other counties between 2010 and 2011 (pop. 50,000+)"
- #75 on the list of "Top 101 counties with the largest decrease in the number of infant deaths per 1000 residents 2000-2006 to 2007-2013 (pop. 50,000+)"
- #81 on the list of "Top 101 counties with the lowest number of infant deaths per 1000 residents 2007-2013 (pop. 50,000+)"
- #82 on the list of "Top 101 counties with the highest Nitrogen Dioxide air pollution readings in 2012 (ppm)"