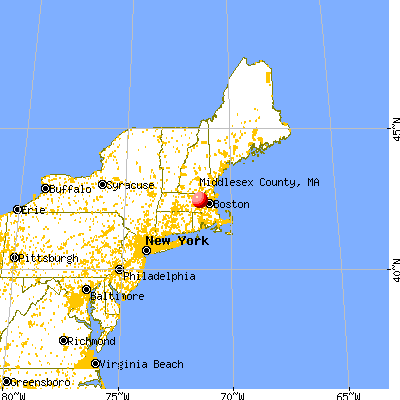
Middlesex County, Massachusetts (MA)
County owner-occupied free and clear houses and condos in 2010: 92,942
County owner-occupied houses and condos in 2000: 346,591
Renter-occupied apartments: 219,599 (it was 214,629 in 2000)
| % of renters here: | 38% |
| State: | 38% |
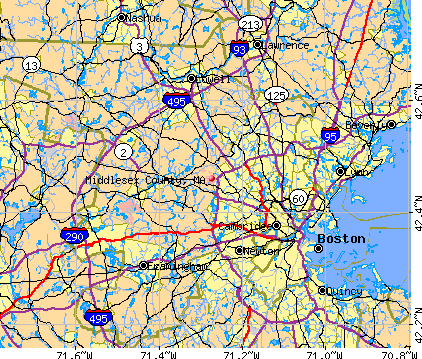
Land area: 823 sq. mi.
Water area: 24.1 sq. mi.
Population density: 1964 people per square mile (very high).
Industries providing employment: Educational, health and social services (27.1%), Professional, scientific, management, administrative, and waste management services (21.3%), Manufacturing (11.0%).
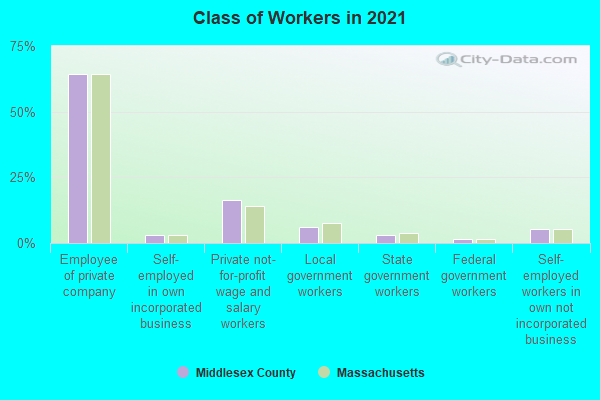
Type of workers:
- Private wage or salary: 84%
- Government: 11%
- Self-employed, not incorporated: 5%
- Unpaid family work: 0%
- OSM Map
- General Map
- Google Map
- MSN Map

- 1,063,47165.8%White Non-Hispanic Alone
- 218,60813.5%Asian alone
- 142,2158.8%Hispanic or Latino
- 88,1895.5%Two or more races
- 78,2284.8%Black Non-Hispanic Alone
- 25,6281.6%Some other race alone
- 5210.03%American Indian and Alaska Native alone
- 2450.02%Native Hawaiian and Other
Pacific Islander alone

| Median resident age: | 39.3 years |
| Massachusetts median age: | 40.3 years |
| Males: 799,408 | |
| Females: 817,697 |

 | 2023 Real Estate Observations (5278 replies) |
| Population slightly down in MA 2022 (362 replies) |
| Home Prices By Town for 2022 (190 replies) |
| 2021 Real Estate Observations (1729 replies) |
| MA residents are leaving the state (65 replies) |
| Dedham (79 replies) |
| Middlesex County: | 2.0 people |
| Massachusetts: | 2 people |
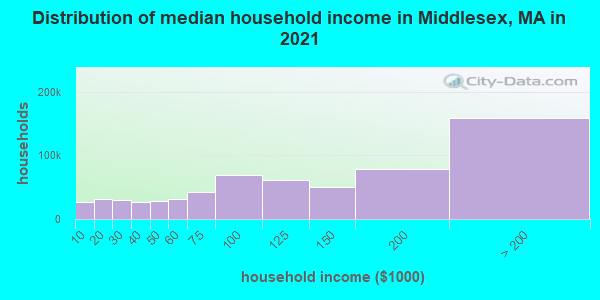
Estimated median household income in 2022: $118,800 ($60,821 in 1999)
| This county: | $118,800 |
| Massachusetts: | $94,488 |
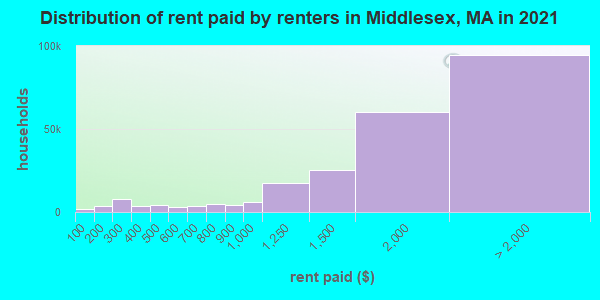
Median contract rent in 2022 for apartments: $1,835 (lower quartile is $1,260, upper quartile is $2,424)
| This county: | $1835 |
| State: | $1446 |
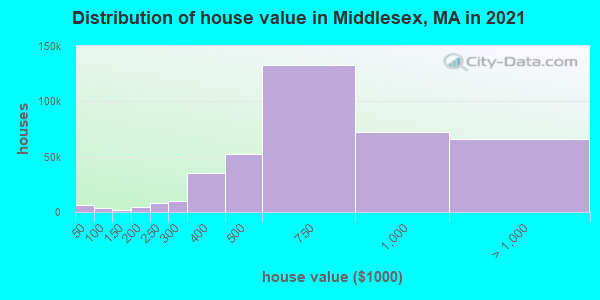
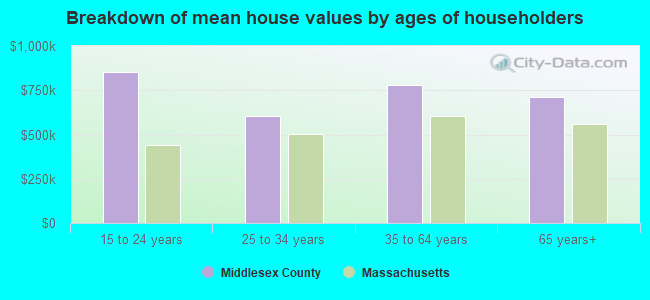
Estimated median house or condo value in 2022: $690,800 (it was $244,400 in 2000)
| Middlesex: | $690,800 |
| Massachusetts: | $534,700 |
Mean price in 2022:
Median monthly housing costs for homes and condos with a mortgage: $2,929Detached houses: $834,667
Here: $834,667 State: $651,570 Townhouses or other attached units: $772,440
Here: $772,440 State: $617,749 In 2-unit structures: $786,250
Here: $786,250 State: $594,808 In 3-to-4-unit structures: $655,835
Here: $655,835 State: $601,912 In 5-or-more-unit structures: $590,321
Here: $590,321 State: $555,768 Mobile homes: $144,935
Here: $144,935 State: $170,209
Median monthly housing costs for units without a mortgage: $1,116
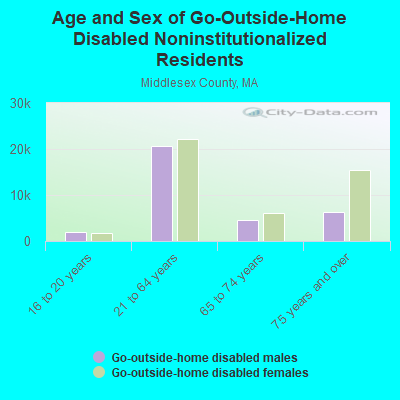
Institutionalized population: 13,773
Health of residents in Middlesex County based on CDC Behavioral Risk Factor Surveillance System Survey Questionnaires from 2003 to 2012:
General health status score of residents in this county from 1 (poor) to 5 (excellent) is 3.7. This is better than average.76.1% of residents exercised in the past month. This is about average.
45.8% of residents smoked 100+ cigarettes in their lives. This is about average.
79.7% of adult residents drank alcohol in the past 30 days. This is about average.
77.5% of residents visited a dentist within the past year. This is more than average.
Average weight of males is 191 pounds. This is about average.
Average weight of females is 156 pounds. This is about average.
6.4% of residents keep firearms around their homes. This is less than average.
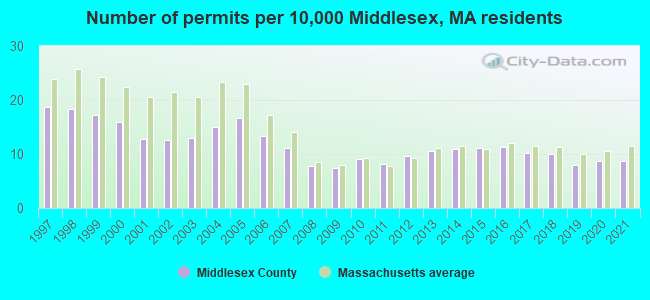
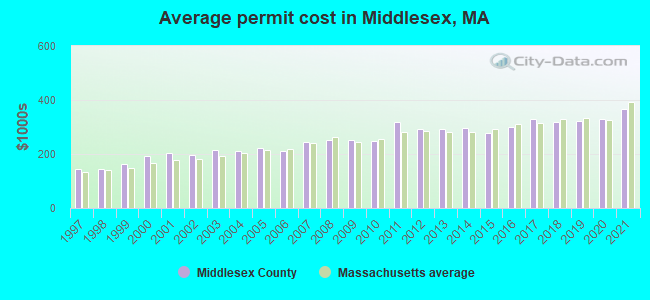
Single-family new house construction building permits:
- 2022: 999 buildings, average cost: $417,200
- 2021: 1279 buildings, average cost: $366,600
- 2020: 1278 buildings, average cost: $330,400
- 2019: 1161 buildings, average cost: $321,300
- 2018: 1452 buildings, average cost: $317,200
- 2017: 1485 buildings, average cost: $329,500
- 2016: 1668 buildings, average cost: $300,500
- 2015: 1617 buildings, average cost: $278,400
- 2014: 1610 buildings, average cost: $294,900
- 2013: 1558 buildings, average cost: $293,500
- 2012: 1416 buildings, average cost: $291,100
- 2011: 1186 buildings, average cost: $318,000
- 2010: 1336 buildings, average cost: $249,800
- 2009: 1089 buildings, average cost: $250,800
- 2008: 1139 buildings, average cost: $252,500
- 2007: 1639 buildings, average cost: $242,600
- 2006: 1948 buildings, average cost: $209,800
- 2005: 2450 buildings, average cost: $222,600
- 2004: 2207 buildings, average cost: $210,600
- 2003: 1913 buildings, average cost: $213,700
- 2002: 1845 buildings, average cost: $198,000
- 2001: 1865 buildings, average cost: $203,800
- 2000: 2330 buildings, average cost: $191,800
- 1999: 2526 buildings, average cost: $162,400
- 1998: 2697 buildings, average cost: $146,400
- 1997: 2730 buildings, average cost: $145,800
Median real estate property taxes paid for housing units with mortgages in 2022: $6,858 (1.0%)
Median real estate property taxes paid for housing units with no mortgage in 2022: $6,898 (1.0%)
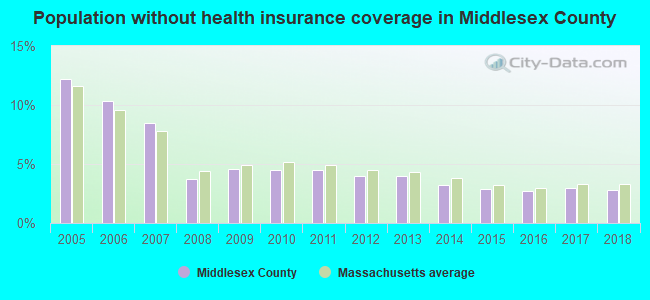
| Middlesex County: | 8.2% |
| Massachusetts: | 10.4% |
Median age of residents in 2022: 39.3 years old
(Males: 38.3 years old, Females: 40.1 years old)
(Median age for: White residents: 44.1 years old, Black residents: 33.4 years old, American Indian residents: 37.9 years old, Asian residents: 35.2 years old, Hispanic or Latino residents: 29.7 years old, Other race residents: 32.3 years old)
Area name: Boston-Cambridge-Quincy, MA-NH HUD Metro FMR Area
Fair market rent in 2006 for a 1-bedroom apartment in Middlesex County is $1128 a month.
Fair market rent for a 2-bedroom apartment is $1324 a month.
Fair market rent for a 3-bedroom apartment is $1584 a month.
Cities in this county include: Lowell, Cambridge, Newton, Somerville, Framingham, Waltham, Malden, Medford, Arlington, Billerica.
2023 air pollution in Middlesex County:
Nitrogen Dioxide: 0.01 ppm (standard limit: 0.053 ppm). Above U.S. average.
Ozone (1-hour): 0.031 ppm (standard limit: 0.12 ppm). Near U.S. average.
Particulate Matter (PM2.5) Annual: 6.9 µg/m3(standard limit: 15.0 µg/m3). Near U.S. average.
Notable locations in this county outside city limits:
Notable locations in Middlesex County: Central Wharf (A), Auburn Industrial Park (B), Blissful Meadows Golf Course (C), Boy Scouts of America Camp Watalin Camping Area (D), Brookfield Orchards and Touring Center (E), Ellinwood Country Club (F), Freeman Farm (G), Gardner Sewage Disposal Plant (H), Hemlock Ridge Golf Course (I), Hillcrest Country Club (J), Hills Farm Industrial Park (K), Holden Hills Country Club (L), Hopedale Country Club (M), Lakeside Campground (N), Maplewood Golf Course (O), Massachusetts Microelectronic Center (P), Mendon Industrial Park (Q), Nichols Golf Course (R), Norco Sportsmens Club (S), Otter River Sportsmens Club (T). Display/hide their locations on the map
Shopping Centers: Allouette Plaza Shopping Center (1), Auburn Mall Shopping Center (2), Auburn Plaza Shopping Center (3), Dudley Plaza Shopping Center (4), Factory Town USA Shopping Center (5), Federal Plaza Shopping Center (6), Heritage Mall Shopping Center (7), Olde Shrewsbury Village Shopping Center (8), Shrewsbury Crossing Shopping Center (9). Display/hide their locations on the map
Churches in Middlesex County include: Saint Joseph Church (A), Trinity Church (B), Church in the Wildewood (C), Saint Francis Xavier Church (D), Emmanuel Missionary Baptist Church (E), Church of God (F), Saint Michaels Church (G), Friends Church (H), Convent of the Cenacle (I). Display/hide their locations on the map
Cemeteries: South Cemetery (1), Hillcrest Cemetery (2), North Village Cemetery (3), New Sherborn Cemetery (4), West Cemetery (5), Ellinwood Cemetery (6), Eastwood Cemetery (7). Display/hide their locations on the map
Lakes, reservoirs, and swamps: Cranberry Pond (A), Dead Pond (B), Hecla Pond (C), Little Pond (D), Mansfield Pond (E), Nipmack Pond (F), Pout Pond (G), Reilly Pond (H). Display/hide their locations on the map
Streams, rivers, and creeks: Fever Brook (A), Barefoot Brook (B), Cooledge Brook (C), French Brook (D), Goodridge Brook (E), Howard Brook (F), McGovern Brook (G), Malagasco Brook (H), Road Brook (I). Display/hide their locations on the map
Parks in Middlesex County include: Wells State Park (1), Crow Hill State Reservation (2), Wachusett Mountain State Reservation (3), Hubbardston Wildlife Management Area (4), Minns Wildlife Sanctuary (5), Sudbury Dam Historic District (6), Central Woolen Mills District (7), Boyce Street Park (8), Birch Hill State Wildlife Management Area (9). Display/hide their locations on the map
Beaches: Point Rok Beach (A), Sterling Town Beach (B), Harvard Town Beach (C). Display/hide their locations on the map
Neighboring counties: Hartford County, Connecticut  , Franklin County
  , Hampden County , Windham County, Connecticut
  , Chenango County, New York , Norfolk County
  , Clinton County, Iowa , Iowa County, Wisconsin , Madison County, New York , Grundy County, Iowa .
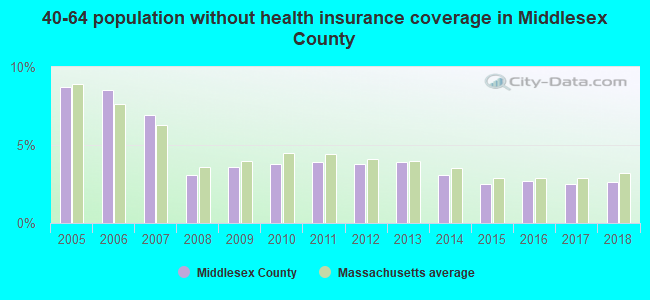
| Here: | 3.0% |
| Massachusetts: | 3.5% |
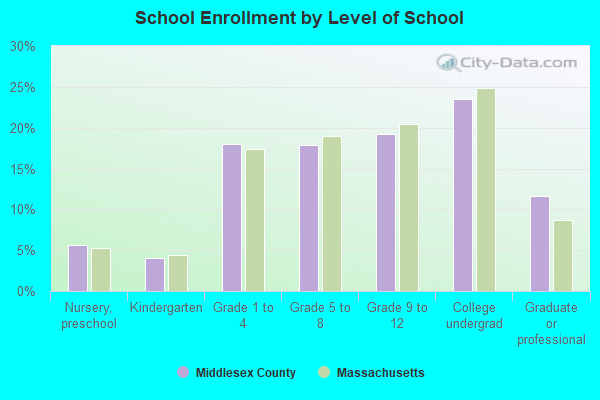
Current college students: 121,081
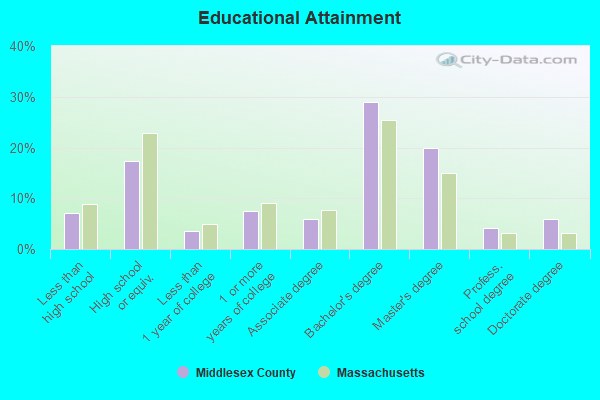
People 25 years of age or older with a high school degree or higher: 93.0%
People 25 years of age or older with a bachelor's degree or higher: 59.1%
Number of foreign born residents: 373,338 (52.4% naturalized citizens)
| Middlesex County: | 23.1% |
| Whole state: | 18.0% |
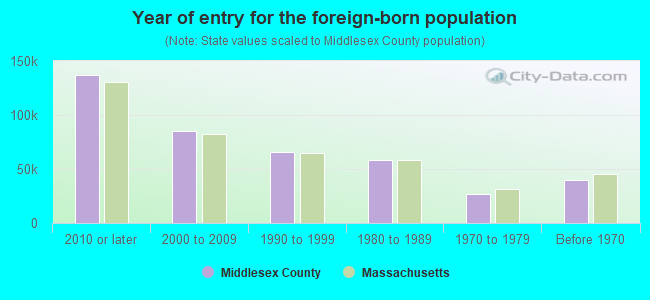
- Year of entry for the foreign-born population
- 149,9992010 or later
- 78,1092000 to 2009
- 64,6811990 to 1999
- 57,9461980 to 1989
- 27,0501970 to 1979
- 40,150Before 1970
Mean travel time to work (commute): minutes
Percentage of county residents living and working in this county: 97.6%
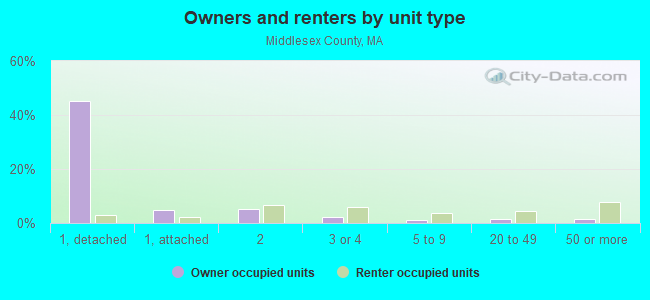
Housing units in structures:
- One, detached: 308,509
- One, attached: 46,787
- Two: 79,899
- 3 or 4: 58,384
- 5 to 9: 31,773
- 10 to 19: 33,426
- 20 to 49: 43,487
- 50 or more: 62,549
- Mobile homes: 2,728
- Boats, RVs, vans, etc.: 422
Housing units in Middlesex County with a mortgage: 253,590 (39,996 second mortgage, 806 home equity loan, 35,484 both second mortgage and home equity loan)
Houses without a mortgage: 8,296
| Here: | 96.9% with mortgage |
| State: | 96.2% with mortgage |
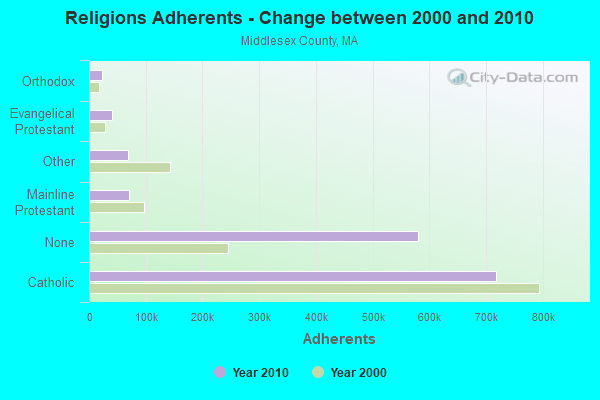
Religion statistics for Middlesex County
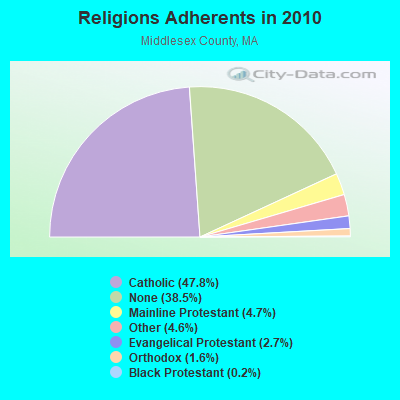
| Religion | Adherents | Congregations |
|---|---|---|
| Catholic | 718,209 | 107 |
| Mainline Protestant | 70,053 | 269 |
| Other | 68,480 | 199 |
| Evangelical Protestant | 41,270 | 304 |
| Orthodox | 23,641 | 28 |
| Black Protestant | 2,276 | 8 |
| None | 579,156 | - |
Source: Clifford Grammich, Kirk Hadaway, Richard Houseal, Dale E.Jones, Alexei Krindatch, Richie Stanley and Richard H.Taylor. 2012. 2010 U.S.Religion Census: Religious Congregations & Membership Study. Association of Statisticians of American Religious Bodies. Jones, Dale E., et al. 2002. Congregations and Membership in the United States 2000. Nashville, TN: Glenmary Research Center.
Food Environment Statistics:
| Middlesex County: | 1.71 / 10,000 pop. |
| State: | 1.98 / 10,000 pop. |
| Here: | 0.03 / 10,000 pop. |
| Massachusetts: | 0.05 / 10,000 pop. |
| This county: | 2.14 / 10,000 pop. |
| Massachusetts: | 2.22 / 10,000 pop. |
| Middlesex County: | 1.38 / 10,000 pop. |
| Massachusetts: | 1.77 / 10,000 pop. |
| This county: | 7.84 / 10,000 pop. |
| State: | 8.76 / 10,000 pop. |
| Middlesex County: | 7.8% |
| Massachusetts: | 8.1% |
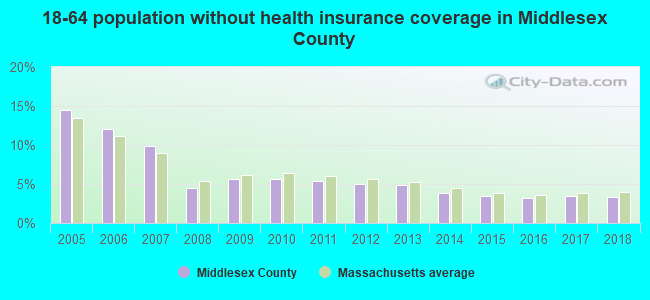
| Middlesex County: | 21.5% |
| State: | 22.5% |
| Here: | 18.0% |
| State: | 16.5% |
Agriculture in Middlesex County:
Average size of farms: 57 acresAverage value of agricultural products sold per farm: $113,844
Average value of crops sold per acre for harvested cropland: $4714.43
The value of nursery, greenhouse, floriculture, and sod as a percentage of the total market value of agricultural products sold: 71.89%
The value of livestock, poultry, and their products as a percentage of the total market value of agricultural products sold: 16.27%
Average total farm production expenses per farm: $98,369
Harvested cropland as a percentage of land in farms: 35.30%
Irrigated harvested cropland as a percentage of land in farms: 11.98%
Average market value of all machinery and equipment per farm: $43,038
The percentage of farms operated by a family or individual: 79.62%
Average age of principal farm operators: 55 years
Average number of cattle and calves per 100 acres of all land in farms: 8.53
Milk cows as a percentage of all cattle and calves: 29.43%
Vegetables: 1,792 harvested acres
Land in orchards: 894 acres
Tornado activity:
Middlesex County historical area-adjusted tornado activity is significantly below Massachusetts state average. It is 1526145.8 times below overall U.S. average.Tornadoes in this county have caused 93 fatalities and 1269 injuries recorded between 1950 and 2004.
On 6/9/1953, a category 4 (max. wind speeds 207-260 mph) tornado killed 90 people and injured 1228 people and caused between $50,000,000 and $500,000,000 in damages.
Earthquake activity:
Middlesex County-area historical earthquake activity is significantly above Massachusetts state average. It is 73% smaller than the overall U.S. average.On 10/7/1983 at 10:18:46, a magnitude 5.3 (5.1 MB, 5.3 LG, 5.1 ML, Class: Moderate, Intensity: VI - VII) earthquake occurred 185.9 miles away from Middlesex County center
On 4/20/2002 at 10:50:47, a magnitude 5.3 (5.3 ML, Depth: 3.0 mi) earthquake occurred 186.9 miles away from the county center
On 1/19/1982 at 00:14:42, a magnitude 4.7 (4.5 MB, 4.7 MD, 4.5 LG, Class: Light, Intensity: IV - V) earthquake occurred 73.8 miles away from the county center
On 4/20/2002 at 10:50:47, a magnitude 5.2 (5.2 MB, 4.2 MS, 5.2 MW, 5.0 MW) earthquake occurred 186.3 miles away from the county center
On 10/16/2012 at 23:12:25, a magnitude 4.7 (4.7 ML, Depth: 10.0 mi) earthquake occurred 84.7 miles away from Middlesex County center
On 8/22/1992 at 12:20:32, a magnitude 4.8 (4.8 MB, 3.8 MS, 4.7 LG, Depth: 6.2 mi) earthquake occurred 237.3 miles away from the county center
Magnitude types: regional Lg-wave magnitude (LG), body-wave magnitude (MB), duration magnitude (MD), local magnitude (ML), surface-wave magnitude (MS), moment magnitude (MW)
Most recent natural disasters:
- Massachusetts Severe Winter Storm, Snowstorm, and Flooding, Incident Period: January 26, 2015 to January 29, 2015, Major Disaster (Presidential) Declared DR-4214: April 13, 2015, FEMA Id: 4214, Natural disaster type: Snowstorm, Winter Storm, Flood
- Massachusetts Explosions, Incident Period: April 15, 2013 to April 22, 2013, Emergency Declared EM-3362: April 17, 2013, FEMA Id: 3362, Natural disaster type: Explosion
- Massachusetts Severe Winter Storm, Snowstorm, and Flooding, Incident Period: February 08, 2013 to February 10, 2013, Major Disaster (Presidential) Declared DR-4110: April 19, 2013, FEMA Id: 4110, Natural disaster type: Snowstorm, Winter Storm, Flood
- Massachusetts Hurricane Sandy, Incident Period: October 27, 2012 to November 08, 2012, Emergency Declared EM-3350: October 28, 2012, FEMA Id: 3350, Natural disaster type: Hurricane
- Massachusetts Severe Storm, Incident Period: October 29, 2011 to October 30, 2011, Emergency Declared EM-3343: November 01, 2011, FEMA Id: 3343, Natural disaster type: Storm
- Massachusetts Severe Storm and Snowstorm, Incident Period: October 29, 2011 to October 30, 2011, Major Disaster (Presidential) Declared DR-4051: January 06, 2012, FEMA Id: 4051, Natural disaster type: Snowstorm, Storm
- Massachusetts Hurricane Irene, Incident Period: August 26, 2011 to September 05, 2011, Emergency Declared EM-3330: August 26, 2011, FEMA Id: 3330, Natural disaster type: Hurricane
- Massachusetts Severe Winter Storm and Snowstorm, Incident Period: January 11, 2011 to January 12, 2011, Major Disaster (Presidential) Declared DR-1959: March 07, 2011, FEMA Id: 1959, Natural disaster type: Snowstorm, Winter Storm
- Massachusetts Hurricane Earl, Incident Period: September 01, 2010 to September 04, 2010, Emergency Declared EM-3315: September 02, 2010, FEMA Id: 3315, Natural disaster type: Hurricane
- Massachusetts Water Main Break, Incident Period: May 01, 2010 to May 05, 2010, Emergency Declared EM-3312: May 03, 2010, FEMA Id: 3312, Natural disaster type: Water Main Break
- 21 other natural disasters have been reported since 1953.
The number of natural disasters in Middlesex County (31) is a lot greater than the US average (15).
Major Disasters (Presidential) Declared: 17
Emergencies Declared: 14
Causes of natural disasters: Floods: 12, Storms: 9, Hurricanes: 6, Snowstorms: 6, Winter Storms: 5, Blizzards: 2, Snows: 2, Explosion: 1, Heavy Rain: 1, Snowfall: 1, Water Main Break: 1, Wind: 1 (Note: some incidents may be assigned to more than one category).
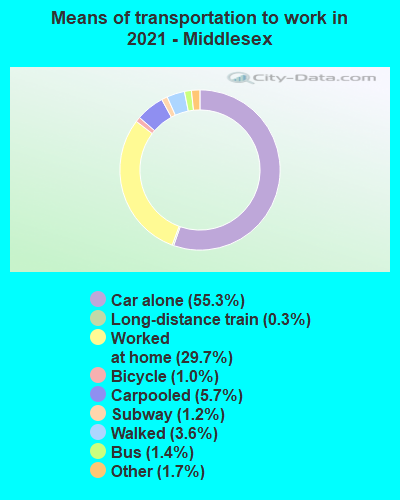
Means of transportation to work:
- Drove a car alone: 566,195 (59.4%)
- Carpooled: 60,038 (6.3%)
- Bus: 13,437 (1.4%)
- Subway or elevated rail: 21,185 (2.2%)
- Long-distance train or commuter rail: 4,708 (0.5%)
- Light rail, streetcar or trolley: 833 (0.1%)
- Ferryboat: 137 (0.0%)
- Taxicab, motorcycle, or other means: 17,047 (1.8%)
- Bicycle: 13,344 (1.4%)
- Walked: 38,727 (4.1%)
- Worked at home: 218,253 (22.9%)
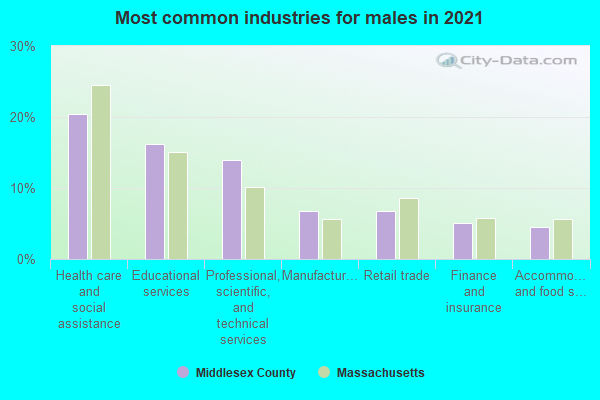
- Health care and social assistance (20%)
- Educational services (15%)
- Professional, scientific, and technical services (14%)
- Manufacturing (8%)
- Retail trade (7%)
- Finance and insurance (5%)
- Other services, except public administration (5%)
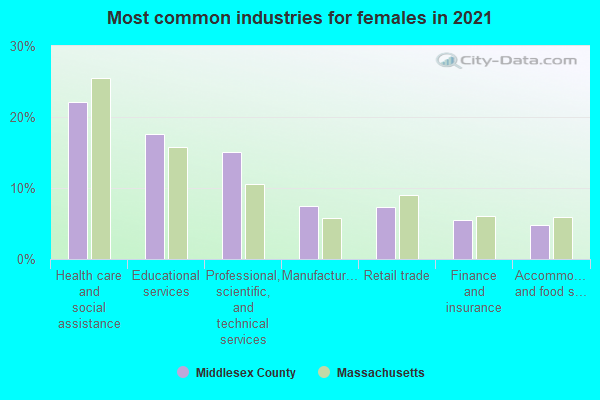
- Health care and social assistance (22%)
- Educational services (17%)
- Professional, scientific, and technical services (16%)
- Manufacturing (9%)
- Retail trade (7%)
- Finance and insurance (5%)
- Other services, except public administration (5%)
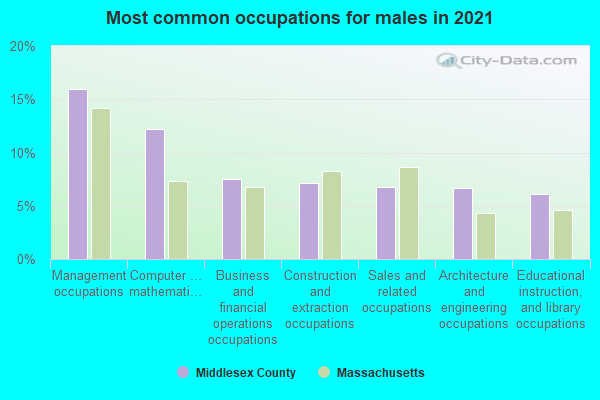
- Management occupations (17%)
- Computer and mathematical occupations (11%)
- Sales and related occupations (7%)
- Business and financial operations occupations (7%)
- Architecture and engineering occupations (6%)
- Construction and extraction occupations (6%)
- Educational instruction, and library occupations (6%)
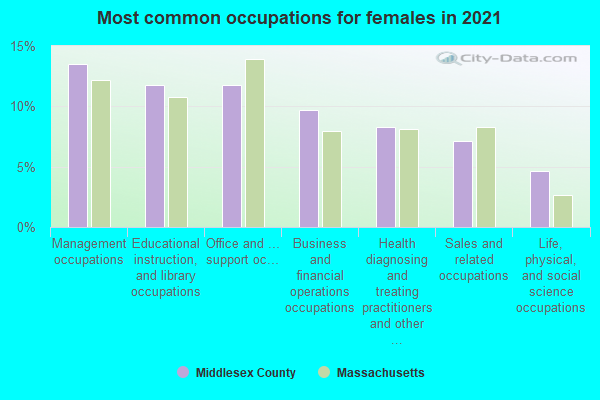
- Management occupations (13%)
- Educational instruction, and library occupations (11%)
- Office and administrative support occupations (10%)
- Business and financial operations occupations (10%)
- Health diagnosing and treating practitioners and other technical occupations (8%)
- Sales and related occupations (7%)
- Life, physical, and social science occupations (5%)
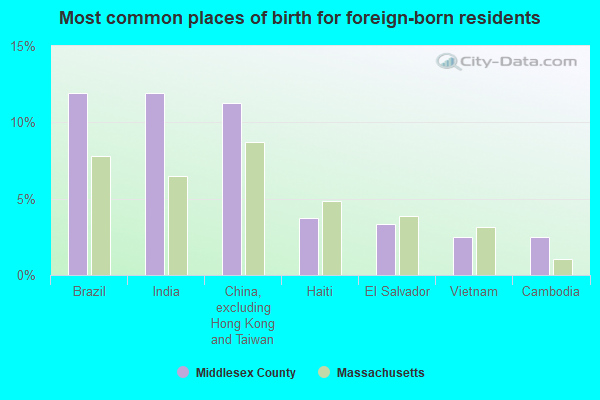
- Brazil (12%)
- India (11%)
- China, excluding Hong Kong and Taiwan (10%)
- Cambodia (3%)
- Haiti (3%)
- El Salvador (3%)
- Guatemala (3%)
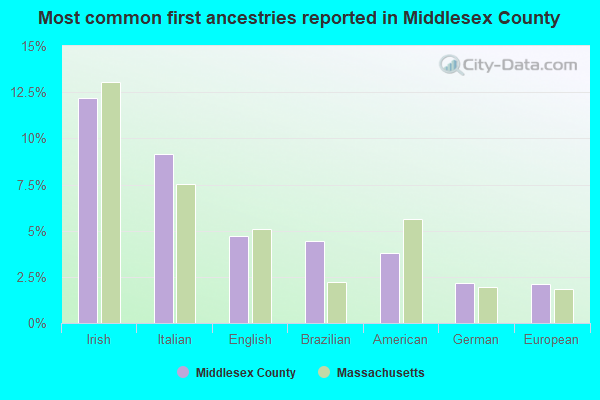
- Irish (12%)
- Italian (8%)
- American (4%)
- English (4%)
- Brazilian (4%)
- German (2%)
- European (2%)
People in group quarters in Middlesex County, Massachusetts in 2010:
- 36,147 people in college/university student housing
- 8,123 people in nursing facilities/skilled-nursing facilities
- 3,611 people in state prisons
- 1,663 people in group homes intended for adults
- 1,477 people in other noninstitutional facilities
- 822 people in emergency and transitional shelters (with sleeping facilities) for people experiencing homelessness
- 798 people in local jails and other municipal confinement facilities
- 755 people in workers' group living quarters and job corps centers
- 640 people in residential treatment centers for adults
- 313 people in residential treatment centers for juveniles (non-correctional)
- 253 people in residential schools for people with disabilities
- 233 people in in-patient hospice facilities
- 173 people in mental (psychiatric) hospitals and psychiatric units in other hospitals
- 135 people in military barracks and dormitories (nondisciplinary)
- 119 people in group homes for juveniles (non-correctional)
- 84 people in correctional facilities intended for juveniles
- 46 people in hospitals with patients who have no usual home elsewhere
- 20 people in correctional residential facilities
People in group quarters in Middlesex County, Massachusetts in 2000:
- 30,361 people in college dormitories (includes college quarters off campus)
- 11,018 people in nursing homes
- 3,202 people in state prisons
- 1,568 people in other noninstitutional group quarters
- 1,092 people in religious group quarters
- 973 people in other types of correctional institutions
- 811 people in homes for the mentally retarded
- 757 people in other nonhousehold living situations
- 568 people in homes or halfway houses for drug/alcohol abuse
- 496 people in hospitals/wards and hospices for chronically ill
- 493 people in other hospitals or wards for chronically ill
- 416 people in homes for the mentally ill
- 310 people in schools, hospitals, or wards for the intellectually disabled
- 272 people in job corps and vocational training facilities
- 227 people in local jails and other confinement facilities (including police lockups)
- 212 people in other group homes
- 163 people in military barracks, etc.
- 129 people in mental (psychiatric) hospitals or wards
- 120 people in institutions for the blind
- 36 people in homes for the physically handicapped
- 33 people in agriculture workers' dormitories on farms
- 21 people in military transient quarters for temporary residents
- 20 people in hospitals or wards for drug/alcohol abuse
- 16 people in unknown juvenile institutions
- 15 people in homes for abused, dependent, and neglected children
- 15 people in short-term care, detention or diagnostic centers for delinquent children
- 14 people in residential treatment centers for emotionally disturbed children
- 14 people in training schools for juvenile delinquents
- 8 people in military disciplinary barracks
- 3 people in hospices or homes for chronically ill
- 3 people in wards in general hospitals for patients who have no usual home elsewhere
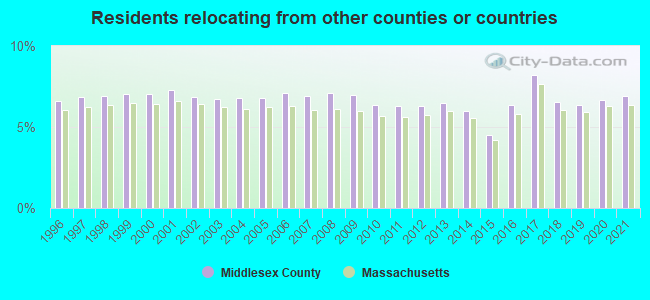
6.91% of this county's 2021 resident taxpayers lived in other counties in 2020 ($102,955 average adjusted gross income)
| Here: | 6.91% |
| Massachusetts average: | 6.35% |
0.01% of residents moved from foreign countries ($137 average AGI)
Middlesex County: 0.01% Massachusetts average: 0.01%
3.71% relocated from other counties in Massachusetts ($56,191 average AGI)
3.18% relocated from other states ($46,627 average AGI)
Middlesex County: 3.18% Massachusetts average: 2.58%
Top counties from which taxpayers relocated into this county between 2020 and 2021:
| from Suffolk County, MA | |
| from Essex County, MA | |
| from Norfolk County, MA | |
| from Worcester County, MA | |
| from Hillsborough County, NH | |
| from New York County, NY | |
| from Plymouth County, MA |
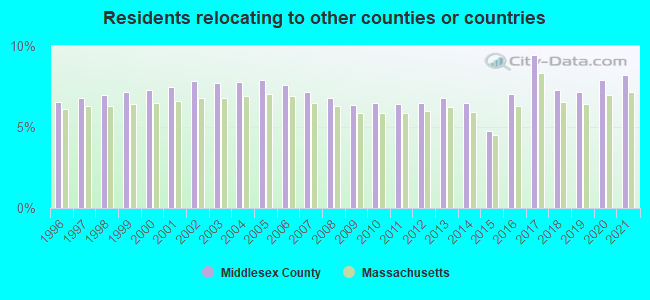
8.22% of this county's 2020 resident taxpayers moved to other counties in 2021 ($123,369 average adjusted gross income)
| Here: | 8.22% |
| Massachusetts average: | 7.18% |
0.01% of residents moved to foreign countries ($124 average AGI)
Middlesex County: 0.01% Massachusetts average: 0.02%
4.00% relocated to other counties in Massachusetts ($53,207 average AGI)
4.21% relocated to other states ($70,039 average AGI)
Middlesex County: 4.21% Massachusetts average: 3.43%
Top counties to which taxpayers relocated from this county between 2020 and 2021:
| to Suffolk County, MA | |
| to Essex County, MA | |
| to Worcester County, MA | |
| to Norfolk County, MA | |
| to Hillsborough County, NH | |
| to Rockingham County, NH | |
| to Plymouth County, MA |
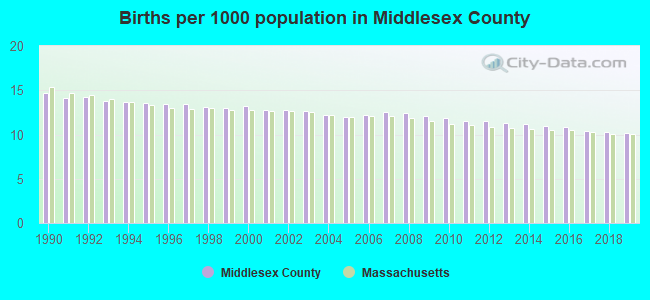
Births per 1000 population from 1990 to 1999: 13.7
Births per 1000 population from 2000 to 2009: 12.5
Births per 1000 population from 2010 to 2022: 9.2
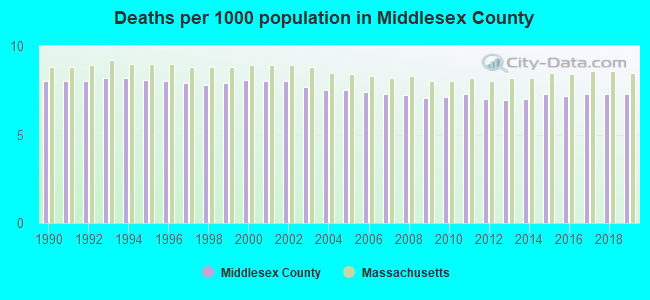
Deaths per 1000 population from 1990 to 1999: 8.0
Deaths per 1000 population from 2000 to 2009: 7.6
Deaths per 1000 population from 2010 to 2020: 7.3
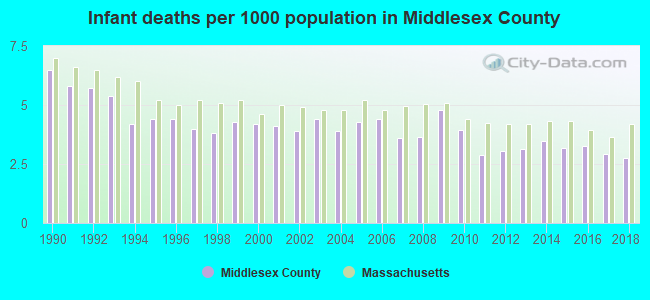
Infant deaths per 1000 live births from 1990 to 1999: 4.8
Infant deaths per 1000 live births from 2000 to 2009: 4.1
Infant deaths per 1000 live births from 2010 to 2021: 3.1
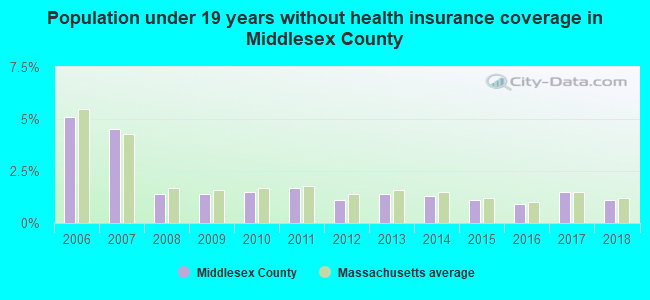
Persons under 19 years old without health insurance coverage in 2018: 1.1%
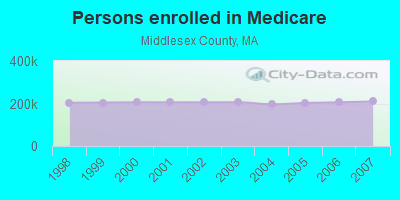
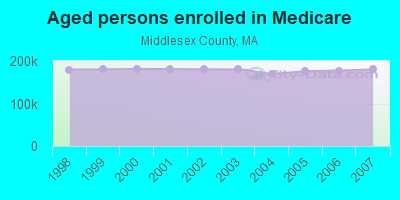
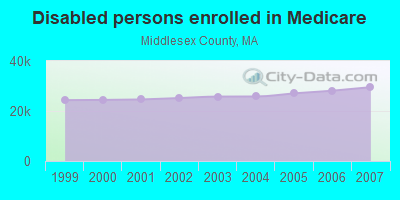
Persons enrolled in hospital insurance and/or supplemental medical insurance (Medicare) in July 1, 2007: 209,655 (180,120 aged, 29,535 disabled)
Children under 18 without health insurance coverage in 2007: 14,076 (4%)
Most common underlying causes of death in Middlesex County, Massachusetts in 1999 - 2019:
- Bronchus or lung, unspecified - Malignant neoplasms (14,714)
- Atherosclerotic heart disease (14,494)
- Unspecified dementia (13,029)
- Acute myocardial infarction, unspecified (11,445)
- Chronic obstructive pulmonary disease, unspecified (7,537)
- Alzheimer disease, unspecified (6,884)
- Congestive heart failure (6,506)
- Pneumonia, unspecified (5,917)
- Stroke, not specified as haemorrhage or infarction (5,862)
- Atherosclerotic cardiovascular disease, so described (5,122)
Population without health insurance coverage in 2000: 8%
Children under 18 without health insurance coverage in 2000: 6%
Short term general hospital admissions per 100,000 population in 2004: 9,588
Short term general hospital beds per 100,000 population in 2004: 175
Emergency room visits per 100,000 population in 2004: 38,116
General practice office based MDs per 100,000 population in 2005: 1,220
Medical specialist MDs per 100,000 population in 2005: 758
Dentists per 100,000 population in 1998: 16
Total births per 100,000 population, July 2005 - July 2006 : 72
Total deaths per 100,000 population, July 2005 - July 2006: 98
Limited-service eating places per 100,000 population in 2005 : 19
Beer, wine & liquor stores per 100,000 population in 2005: 1
Fitness & recreation sports centers per 100,000 population in 2005: 2,842
Suicides per 1,000,000 population from 2000 to 2006: 60.2. This is less than state average.
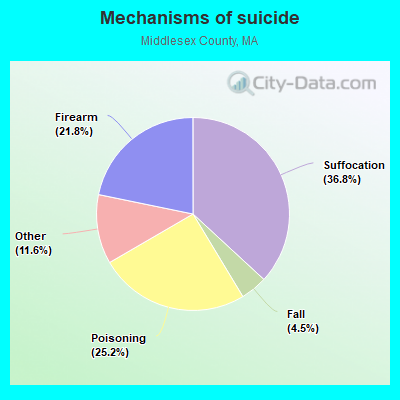
- Suffocation - 22.2
- Poisoning - 15.2
- Firearm - 13.1
- Fall - 2.7
- Other - 7.0
Household type by relationship:
Households: 1,617,105- Male householders: 312,429 (71,169 living alone), Female householders: 325,788 (101,223 living alone)
312,614 spouses (306,234 opposite-sex spouses), 53,834 unmarried partners, (49,609 opposite-sex unmarried partners), 414,159 children (396,646 natural, 6,990 adopted, 10,523 stepchildren), 17,545 grandchildren, 17,859 brothers or sisters, 23,014 parents, 884 foster children, 21,750 other relatives, 58,930 non-relatives
- In group quarters: 58,299
Size of family households: 160,419 2-persons, 97,823 3-persons, 91,284 4-persons, 29,710 5-persons, 11,802 6-persons, 6,148 7-or-more-persons.
Size of nonfamily households: 172,392 1-person, 54,913 2-persons, 7,953 3-persons, 3,809 4-persons, 1,633 5-persons, 137 6-persons, 194 7-or-more-persons.
233,538 married couples with children.
54,820 single-parent households (14,370 men, 40,450 women).
70.9% of residents of Middlesex speak English at home.
6.2% of residents speak Spanish at home (62% speak English very well, 18% speak English well, 14% speak English not well, 7% don't speak English at all).
12.7% of residents speak other Indo-European language at home (67% speak English very well, 17% speak English well, 10% speak English not well, 6% don't speak English at all).
8.2% of residents speak Asian or Pacific Island language at home (62% speak English very well, 22% speak English well, 11% speak English not well, 5% don't speak English at all).
2.1% of residents speak other language at home (67% speak English very well, 24% speak English well, 9% speak English not well, 1% don't speak English at all).
In fiscal year 2004:
Federal Government expenditure: $13,924,030,000 ($9,507 per capita)
Department of Defense expenditure: $4,485,506,000
Federal direct payments to individuals for retirement and disability: $2,936,481,000
Federal other direct payments to individuals: $2,071,601,000
Federal direct payments not to individuals: $24,966,000
Federal grants: $2,767,626,000
Federal procurement contracts: $5,160,820,000 ($3,945,633,000 Department of Defense)
Federal salaries and wages: $962,536,000 ($362,493,000 Department of Defense)
Federal Government direct loans: $129,245,000
Federal guaranteed/insured loans: $336,710,000
Federal Government insurance: $567,039,000
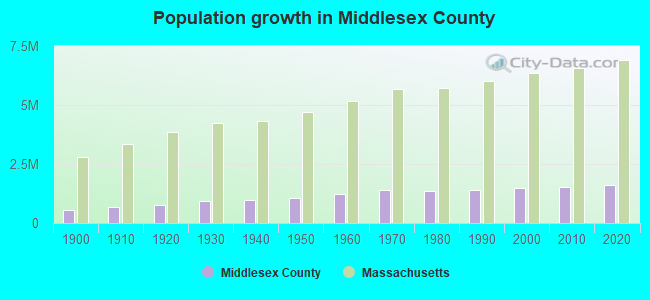
Population change from April 1, 2000 to July 1, 2005:
Births: 97,126| Here: | 67 per 1000 residents |
| State: | 67 per 1000 residents |
Deaths: 60,099
| Here: | 41 per 1000 residents |
| State: | 46 per 1000 residents |
Net international migration: +53,762
| Here: | +37 per 1000 residents |
| State: | +25 per 1000 residents |
Net internal migration: -96,279
| Here: | |
| State: |
Total withdrawal of fresh water for public supply: 67.35 millions of gallons per day (63% from ground, 37% from surface)
| Here: | 6.9 |
| State: | 6.5 |
| Here: | 4.0 |
| State: | 4.0 |
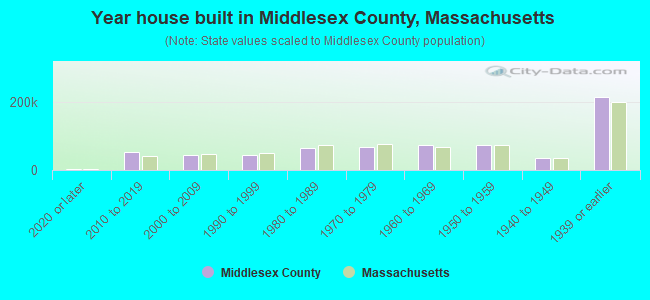
- Year house built in Middlesex County, Massachusetts
- 6,4942020 or later
- 50,2512010 to 2019
- 44,8272000 to 2009
- 47,0831990 to 1999
- 64,9891980 to 1989
- 68,4931970 to 1979
- 67,6841960 to 1969
- 72,5391950 to 1959
- 30,7481940 to 1949
- 214,8561939 or earlier
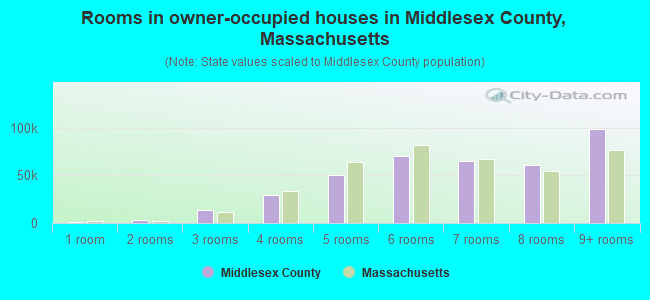
- Rooms in owner-occupied houses in Middlesex County, Massachusetts
- 1,1281 room
- 2,0402 rooms
- 14,0263 rooms
- 33,2134 rooms
- 51,0105 rooms
- 69,6166 rooms
- 66,2027 rooms
- 60,4108 rooms
- 94,5649+ rooms
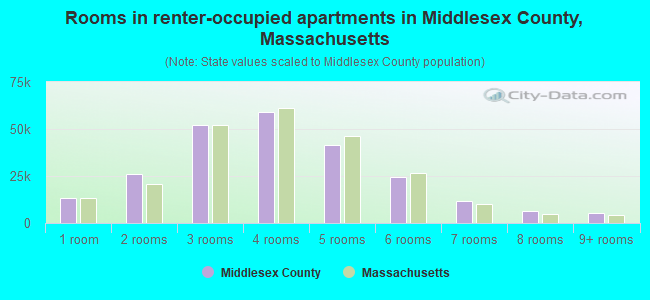
- Rooms in renter-occupied apartments in Middlesex County, Massachusetts
- 11,9771 room
- 26,4012 rooms
- 56,9043 rooms
- 59,9864 rooms
- 44,7215 rooms
- 24,8946 rooms
- 10,0127 rooms
- 6,8798 rooms
- 4,2349+ rooms
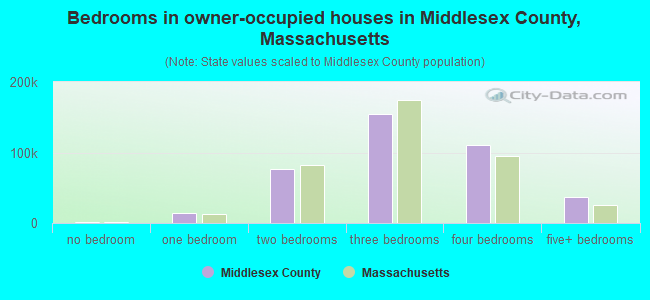
- Bedrooms in owner-occupied houses in Middlesex County, Massachusetts
- 1,326no bedroom
- 11,4261 bedroom
- 79,5462 bedrooms
- 159,4253 bedrooms
- 107,1764 bedrooms
- 33,3105+ bedrooms
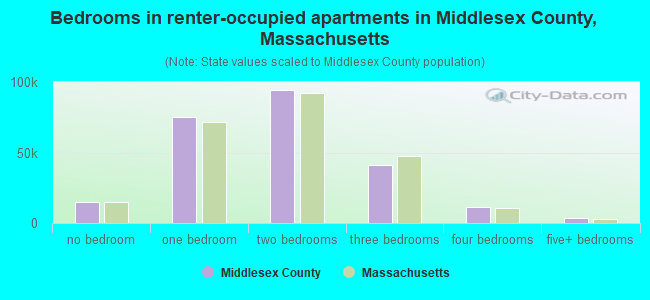
- Bedrooms in renter-occupied apartments in Middlesex County, Massachusetts
- 14,683no bedroom
- 77,4691 bedroom
- 98,6432 bedrooms
- 41,3393 bedrooms
- 10,7754 bedrooms
- 3,0995+ bedrooms
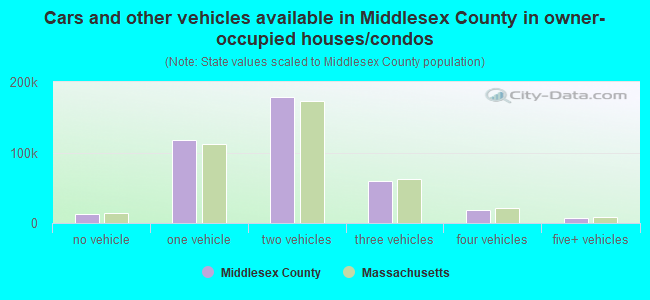
- Cars and other vehicles available in Middlesex County in owner-occupied houses/condos
- 12,215no vehicle
- 117,6521 vehicle
- 179,5242 vehicles
- 57,0463 vehicles
- 18,7424 vehicles
- 7,0305+ vehicles
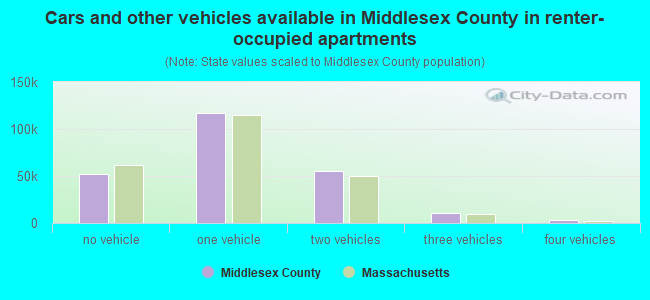
- Cars and other vehicles available in Middlesex County in renter-occupied apartments
- 52,532no vehicle
- 118,9301 vehicle
- 63,3572 vehicles
- 8,1253 vehicles
- 2,1564 vehicles
- 9085+ vehicles
86.3% of Middlesex County residents lived in the same house 1 years ago.
Out of people who lived in different houses, 34% lived in this county.
Out of people who lived in different counties, 52% lived in Massachusetts.
| Middlesex County: | 86.3% |
| State average: | 87.7% |
Place of birth for U.S.-born residents:
- This state: 840,955
- Other state: 370,552
- Northeast: 196,342
- Midwest: 52,529
- South: 70,477
- West: 51,204
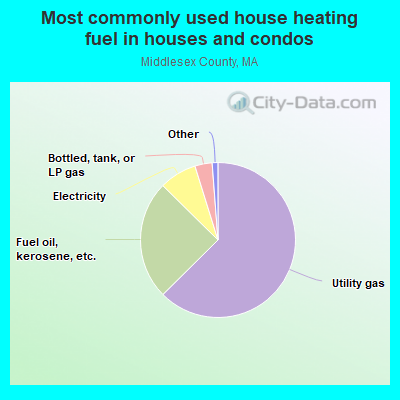
- 61.2%Utility gas
- 25.3%Fuel oil, kerosene, etc.
- 8.5%Electricity
- 3.7%Bottled, tank, or LP gas
- 0.5%Other fuel
- 0.5%Wood
- 0.2%Solar energy
- 0.1%No fuel used
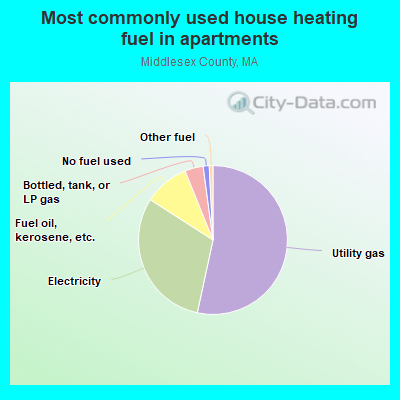
- 54.8%Utility gas
- 32.6%Electricity
- 7.3%Fuel oil, kerosene, etc.
- 3.2%Bottled, tank, or LP gas
- 1.3%No fuel used
- 0.6%Other fuel
- 0.2%Coal or coke
Private vs. public school enrollment:
| Here: | 9.5% |
| Massachusetts: | 10.3% |
| Here: | 13.6% |
| Massachusetts: | 12.3% |
| Here: | 56.6% |
| Massachusetts: | 51.2% |
Supplemental Security Income (SSI) in 2006:
- Total number of recipients: 24,857
- Number of aged recipients: 7,707
- Number of blind and disabled recipients: 17,150
- Number of recipients under 18: 2,043
- Number of recipients between 18 and 64: 14,528
- Number of recipients older than 64: 8,286
- Number of recipients also receiving OASDI: 9,226
- Amount of payments (thousands of dollars): 12,129
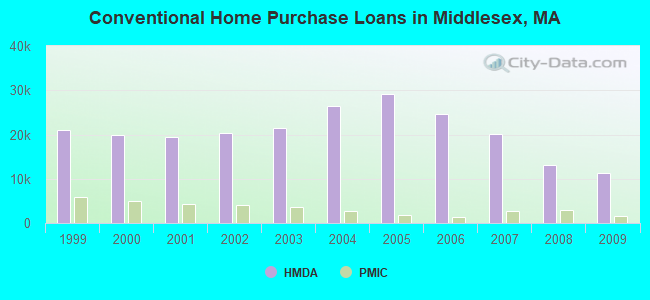
| Home Mortgage Disclosure Act Aggregated Statistics For Year 2009 (Based on 296 full tracts) | ||||||||||||||
| A) FHA, FSA/RHS & VA Home Purchase Loans | B) Conventional Home Purchase Loans | C) Refinancings | D) Home Improvement Loans | E) Loans on Dwellings For 5+ Families | F) Non-occupant Loans on < 5 Family Dwellings (A B C & D) | G) Loans On Manufactured Home Dwelling (A B C & D) | ||||||||
|---|---|---|---|---|---|---|---|---|---|---|---|---|---|---|
| Number | Average Value | Number | Average Value | Number | Average Value | Number | Average Value | Number | Average Value | Number | Average Value | Number | Average Value | |
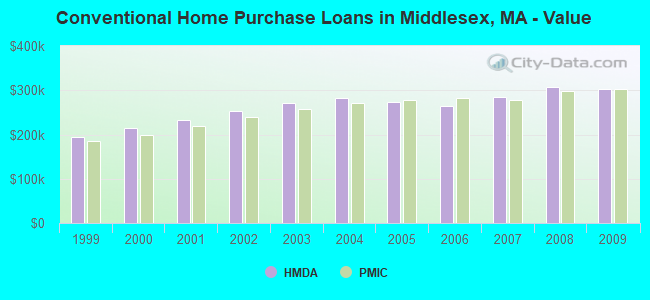
| LOANS ORIGINATED | 3,044 | $280,042 | 11,198 | $302,497 | 49,046 | $291,652 | 2,185 | $171,721 | 144 | $1,924,056 | 1,902 | $274,195 | 27 | $102,333 |
| APPLICATIONS APPROVED, NOT ACCEPTED | 185 | $253,076 | 726 | $335,895 | 3,028 | $309,596 | 243 | $114,942 | 11 | $3,261,727 | 110 | $311,264 | 9 | $49,333 |
| APPLICATIONS DENIED | 571 | $262,648 | 1,562 | $261,978 | 9,245 | $313,489 | 754 | $121,635 | 20 | $1,464,450 | 673 | $241,287 | 23 | $49,652 |
| APPLICATIONS WITHDRAWN | 463 | $268,322 | 1,402 | $311,137 | 6,969 | $297,569 | 223 | $234,197 | 12 | $2,186,417 | 338 | $274,204 | 2 | $83,500 |
| FILES CLOSED FOR INCOMPLETENESS | 76 | $261,500 | 313 | $293,195 | 2,303 | $293,166 | 124 | $172,685 | 1 | $167,000 | 99 | $247,040 | 1 | $38,000 |
| Private Mortgage Insurance Companies Aggregated Statistics For Year 2009 (Based on 291 full tracts) | ||||||
| A) Conventional Home Purchase Loans | B) Refinancings | C) Non-occupant Loans on < 5 Family Dwellings (A & B) | ||||
|---|---|---|---|---|---|---|
| Number | Average Value | Number | Average Value | Number | Average Value | |
| LOANS ORIGINATED | 1,523 | $303,557 | 1,094 | $319,151 | 3 | $194,667 |
| APPLICATIONS APPROVED, NOT ACCEPTED | 453 | $297,770 | 429 | $312,839 | 7 | $176,857 |
| APPLICATIONS DENIED | 279 | $303,538 | 271 | $314,336 | 3 | $242,000 |
| APPLICATIONS WITHDRAWN | 97 | $285,918 | 108 | $317,713 | 1 | $151,000 |
| FILES CLOSED FOR INCOMPLETENESS | 30 | $316,400 | 22 | $339,136 | 0 | $0 |
| Most common first names in Middlesex County, MA among deceased individuals | ||
| Name | Count | Lived (average) |
|---|---|---|
| Mary | 18,142 | 81.3 years |
| John | 14,277 | 74.5 years |
| Joseph | 8,704 | 75.2 years |
| William | 8,460 | 74.5 years |
| James | 6,719 | 73.6 years |
| Margaret | 6,651 | 81.4 years |
| Helen | 6,165 | 80.8 years |
| George | 5,576 | 75.6 years |
| Robert | 5,511 | 69.4 years |
| Charles | 5,038 | 75.4 years |
| Most common last names in Middlesex County, MA among deceased individuals | ||
| Last name | Count | Lived (average) |
|---|---|---|
| Smith | 2,249 | 77.7 years |
| Sullivan | 1,988 | 77.0 years |
| Murphy | 1,892 | 77.0 years |
| Johnson | 1,527 | 78.0 years |
| Brown | 1,398 | 77.9 years |
| Mccarthy | 1,077 | 76.7 years |
| Obrien | 1,056 | 77.2 years |
| White | 1,002 | 78.0 years |
| Walsh | 958 | 76.8 years |
| Anderson | 934 | 78.2 years |
| Businesses in Middlesex County, MA | ||||
| Name | Count | Name | Count | |
|---|---|---|---|---|
| 7-Eleven | 22 | Journeys | 4 | |
| ALDO | 9 | Justice | 4 | |
| AT&T | 22 | KFC | 10 | |
| Abercrombie & Fitch | 3 | Kincaid | 1 | |
| Abercrombie Kids | 3 | Kmart | 4 | |
| Ace Hardware | 14 | Kohl's | 5 | |
| Advance Auto Parts | 9 | LA Fitness | 1 | |
| Aeropostale | 5 | La Quinta | 1 | |
| American Eagle Outfitters | 6 | La-Z-Boy | 2 | |
| Ann Taylor | 10 | Lane Bryant | 3 | |
| Apple Store | 3 | Lane Furniture | 7 | |
| Applebee's | 5 | LensCrafters | 7 | |
| Arby's | 1 | Levi Strauss & Co. | 1 | |
| Ashley Furniture | 4 | Little Caesars Pizza | 2 | |
| Audi | 2 | Lowe's | 4 | |
| AutoZone | 13 | Macy's | 5 | |
| Avenue | 3 | Marriott | 18 | |
| BMW | 1 | Marshalls | 11 | |
| Bakers | 3 | MasterBrand Cabinets | 147 | |
| Bally Total Fitness | 2 | Mazda | 2 | |
| Banana Republic | 4 | McDonald's | 41 | |
| Barnes & Noble | 2 | Men's Wearhouse | 9 | |
| Baskin-Robbins | 2 | Motel 6 | 1 | |
| Bath & Body Works | 6 | Motherhood Maternity | 9 | |
| Bebe | 3 | New Balance | 23 | |
| Bed Bath & Beyond | 2 | New York & Co | 2 | |
| Ben & Jerry's | 2 | Nike | 16 | |
| Bentleymotors.Com | 1 | Nissan | 5 | |
| Best Western | 5 | Nordstrom | 3 | |
| Blockbuster | 8 | Office Depot | 2 | |
| Brooks Brothers | 1 | OfficeMax | 2 | |
| Brookstone | 4 | Old Country Buffet | 2 | |
| Brunswick Bowling & Billiards | 1 | Old Navy | 5 | |
| Budget Car Rental | 2 | Olive Garden | 3 | |
| Burger King | 21 | On The Border | 1 | |
| CVS | 60 | Outback | 3 | |
| Cache | 2 | Outback Steakhouse | 3 | |
| Casual Male XL | 4 | Pac Sun | 3 | |
| Catherines | 1 | Panda Express | 1 | |
| Charlotte Russe | 1 | Panera Bread | 10 | |
| Chevrolet | 6 | Papa John's Pizza | 2 | |
| Chick-Fil-A | 1 | Payless | 19 | |
| Chico's | 4 | Penske | 8 | |
| Chipotle | 6 | PetSmart | 3 | |
| Cinnabon | 2 | Pier 1 Imports | 3 | |
| Circle K | 14 | Pizza Hut | 2 | |
| Clarks | 3 | Pottery Barn | 1 | |
| Cold Stone Creamery | 2 | Pottery Barn Kids | 3 | |
| Coldwater Creek | 3 | Qdoba Mexican Grill | 2 | |
| Comfort Inn | 2 | Quiznos | 10 | |
| Costco | 1 | RadioShack | 24 | |
| Cracker Barrel | 1 | Red Roof Inn | 2 | |
| Crate & Barrel | 2 | Rite Aid | 30 | |
| Curves | 10 | Ruby Tuesday | 1 | |
| DHL | 9 | Ryder Rental & Truck Leasing | 2 | |
| Dairy Queen | 4 | SONIC Drive-In | 1 | |
| Decora Cabinetry | 32 | Sears | 12 | |
| Domino's Pizza | 13 | Sephora | 4 | |
| DressBarn | 5 | Shaw's | 17 | |
| Dressbarn | 4 | Sheraton | 2 | |
| Dunkin Donuts | 211 | Skechers USA | 2 | |
| Econo Lodge | 2 | Soma Intimates | 1 | |
| Eddie Bauer | 1 | Spencer Gifts | 4 | |
| Express | 4 | Sprint Nextel | 10 | |
| Extended Stay America | 1 | Staples | 13 | |
| Extended Stay Deluxe | 2 | Starbucks | 40 | |
| Famous Footwear | 4 | Stop & Shop | 21 | |
| Fashion Bug | 5 | Subaru | 5 | |
| FedEx | 317 | Subway | 48 | |
| Finish Line | 4 | Super 8 | 1 | |
| Firestone Complete Auto Care | 3 | T-Mobile | 21 | |
| Foot Locker | 3 | T.G.I. Driday's | 2 | |
| Ford | 9 | T.J.Maxx | 12 | |
| Forever 21 | 4 | Taco Bell | 8 | |
| Fredericks Of Hollywood | 1 | Talbots | 7 | |
| GNC | 25 | Target | 6 | |
| GameStop | 21 | The Cheesecake Factory | 3 | |
| Gap | 5 | The Limited | 3 | |
| Goodwill | 4 | The Room Place | 1 | |
| Gymboree | 5 | Toyota | 4 | |
| H&M | 1 | Toys"R"Us | 8 | |
| H&R Block | 37 | Trader Joe's | 7 | |
| Hilton | 12 | Travelodge | 2 | |
| Holiday Inn | 13 | True Value | 20 | |
| Hollister Co. | 4 | U-Haul | 33 | |
| Home Depot | 6 | UPS | 291 | |
| Homestead Studio Suites | 3 | Urban Outfitters | 1 | |
| Honda | 6 | Verizon Wireless | 13 | |
| Hot Topic | 1 | Victoria's Secret | 5 | |
| Hyatt | 3 | Volkswagen | 4 | |
| Hyundai | 2 | Walgreens | 30 | |
| IHOP | 1 | Walmart | 5 | |
| J. Jill | 4 | Wendy's | 15 | |
| J.Crew | 3 | Westin | 1 | |
| JCPenney | 2 | Wet Seal | 4 | |
| JoS. A. Bank | 2 | Whole Foods Market | 9 | |
| Johnny Rockets | 1 | YMCA | 14 | |
| Jones New York | 15 | |||
Middlesex County on our top lists:
- #4 on the list of "Top 101 counties with the most Orthodox adherents"
- #4 on the list of "Top 101 counties with the most Orthodox adherents (pop. 50,000+)"
- #7 on the list of "Top 101 counties with the most Catholic adherents"
- #7 on the list of "Top 101 counties with the most Catholic adherents (pop. 50,000+)"
- #7 on the list of "Top 101 counties with the most Mainline Protestant congregations"
- #7 on the list of "Top 101 counties with the most Mainline Protestant congregations (pop. 50,000+)"
- #7 on the list of "Top 101 counties with the most Orthodox congregations"
- #7 on the list of "Top 101 counties with the most Orthodox congregations (pop. 50,000+)"
- #8 on the list of "Top 101 counties with the lowest percentage of residents that keep firearms around their homes"
- #13 on the list of "Top 101 counties with the most Catholic congregations"
- #13 on the list of "Top 101 counties with the most Catholic congregations (pop. 50,000+)"
- #23 on the list of "Top 101 counties with the most Other congregations"
- #23 on the list of "Top 101 counties with the most Other congregations (pop. 50,000+)"
- #26 on the list of "Top 101 counties with the lowest number of infant deaths per 1000 residents 2007-2013 (pop. 50,000+)"
- #35 on the list of "Top 101 counties with the most Other adherents"
- #35 on the list of "Top 101 counties with the most Other adherents (pop. 50,000+)"
- #38 on the list of "Top 101 counties with the lowest Particulate Matter (PM10) Annual air pollution readings in 2012 (µg/m3)"
- #44 on the list of "Top 101 counties with the most Mainline Protestant adherents"
- #44 on the list of "Top 101 counties with the most Mainline Protestant adherents (pop. 50,000+)"
- #56 on the list of "Top 101 counties with the best general health status score of residents (1-5), 3 years of data"