Lowell, Massachusetts
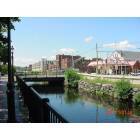
Lowell: Lowell Canal On Dutton Street
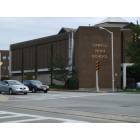
Lowell: The High School Of Lowell MA

Lowell: Lowell City Hall
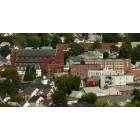
Lowell: St Michaels Church & School from the Top of River Place
Lowell: The High School Of Lowell MA User comment: park along dutton st.

Lowell: Lowell, Ma mills and canal.
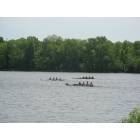
Lowell: High School State Crew Meet along Merrimack River.
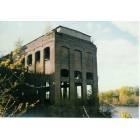
Lowell: We Call this Old Mill Building "Pigeon Palace" This is where the Concord River empties into the Merrimack River best view from the Bridge at SMMC
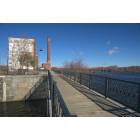
Lowell: Mill condos on the Merrimack
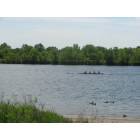
Lowell: High School State Crew Meet along Merrimack River.
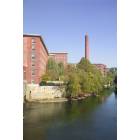
Lowell: lowell mills
- see
32
more - add
your
Submit your own pictures of this city and show them to the world
- OSM Map
- General Map
- Google Map
- MSN Map
Population change since 2000: +8.0%
 |
| Males: 54,812 | |
| Females: 58,796 |
| Median resident age: | 35.6 years |
| Massachusetts median age: | 40.3 years |
Zip codes: 01850, 01851, 01852, 01854.
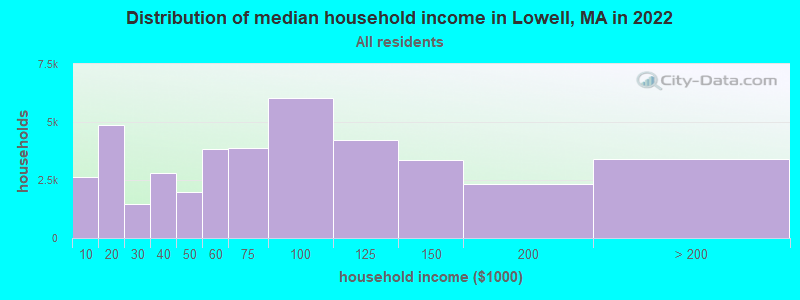
Lowell Zip Code Map| Lowell: | $72,349 |
| MA: | $94,488 |
Estimated per capita income in 2022: $32,155 (it was $17,557 in 2000)
Lowell city income, earnings, and wages data
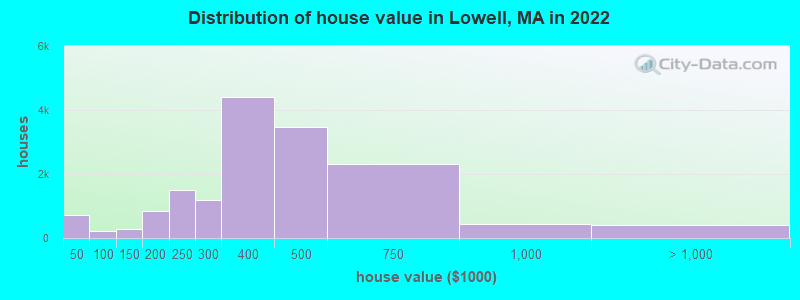
Estimated median house or condo value in 2022: $420,200 (it was $130,500 in 2000)
| Lowell: | $420,200 |
| MA: | $534,700 |
Mean prices in 2022: all housing units: $404,872; detached houses: $402,607; townhouses or other attached units: $332,514; in 2-unit structures: $495,573; in 3-to-4-unit structures: $867,095; in 5-or-more-unit structures: $287,265; mobile homes: $85,628
Median gross rent in 2022: $1,513.
(15.3% for White Non-Hispanic residents, 13.3% for Black residents, 26.0% for Hispanic or Latino residents, 17.6% for American Indian residents, 0.7% for Native Hawaiian and other Pacific Islander residents, 18.3% for other race residents, 22.8% for two or more races residents)
Detailed information about poverty and poor residents in Lowell, MA


- 44,45539.1%White alone
- 30,51726.9%Asian alone
- 21,89419.3%Hispanic
- 8,2787.3%Two or more races
- 8,0917.1%Black alone
- 3590.3%Other race alone
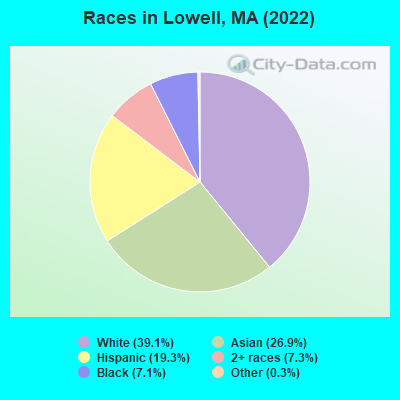
Races in Lowell detailed stats: ancestries, foreign born residents, place of birth
According to our research of Massachusetts and other state lists, there were 124 registered sex offenders living in Lowell, Massachusetts as of April 27, 2024.
The ratio of all residents to sex offenders in Lowell is 892 to 1.
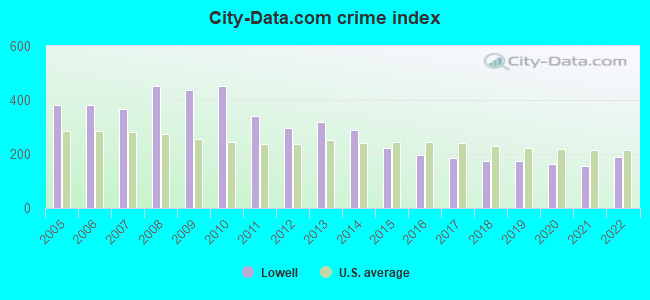
The City-Data.com crime index weighs serious crimes and violent crimes more heavily. Higher means more crime, U.S. average is 246.1. It adjusts for the number of visitors and daily workers commuting into cities.
- means the value is smaller than the state average.- means the value is about the same as the state average.
- means the value is bigger than the state average.
- means the value is much bigger than the state average.
Crime rate in Lowell detailed stats: murders, rapes, robberies, assaults, burglaries, thefts, arson
Full-time law enforcement employees in 2021, including police officers: 306 (236 officers - 214 male; 22 female).
| Officers per 1,000 residents here: | 2.10 |
| Massachusetts average: | 2.53 |
 Recent articles from our blog. Our writers, many of them Ph.D. graduates or candidates, create easy-to-read articles on a wide variety of topics.

 | Safety Concerns Spark Gender Controversy Following Game Involving Lowell School (6 replies) |
| Relocating to MA- Burlington or North Chelmsford or Lowell or Woburn (30 replies) |
| Shrewsbury to Lowell commute? (5 replies) |
| What is commutable to Lowell, MA? (11 replies) |
| How is Highlands area in Lowell (and general Lowell)? (5 replies) |
| Lowell vs. Waltham (46 replies) |
Latest news from Lowell, MA collected exclusively by city-data.com from local newspapers, TV, and radio stations
Lowell, MA City Guides:
Ancestries: Irish (10.7%), Portuguese (5.0%), Brazilian (3.9%), Italian (3.5%), French (3.3%), African (3.1%).
Current Local Time: EST time zone
Elevation: 102 feet
Land area: 13.8 square miles.
Population density: 8,248 people per square mile (high).
34,100 residents are foreign born (14.3% Asia, 7.7% Latin America, 4.2% Africa).
| This city: | 29.8% |
| Massachusetts: | 17.6% |
Median real estate property taxes paid for housing units with mortgages in 2022: $4,190 (1.0%)
Median real estate property taxes paid for housing units with no mortgage in 2022: $4,673 (1.1%)
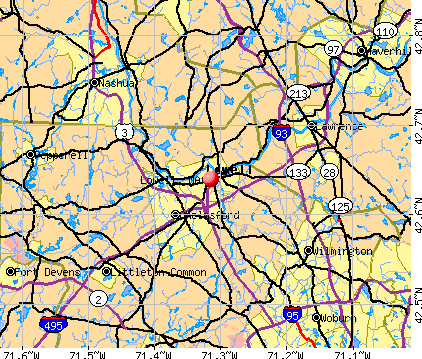
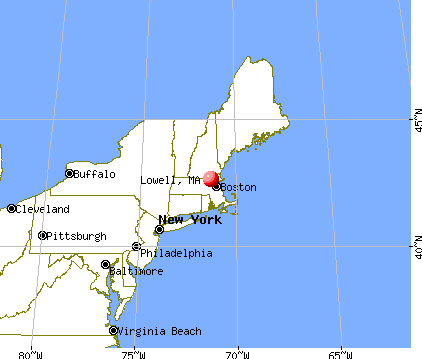
Nearest city with pop. 200,000+: Boston, MA  (24.8 miles , pop. 589,141).
Nearest city with pop. 1,000,000+: Bronx, NY (181.1 miles , pop. 1,332,650).
Nearest cities:
), ), Latitude: 42.64 N, Longitude: 71.31 W
Daytime population change due to commuting: -11,241 (-9.9%)
Workers who live and work in this city: 16,818 (31.3%)
Area code: 978
Detailed articles:
- Lowell: Introduction
- Lowell Basic Facts
- Lowell: Communications
- Lowell: Convention Facilities
- Lowell: Economy
- Lowell: Education and Research
- Lowell: Geography and Climate
- Lowell: Health Care
- Lowell: History
- Lowell: Municipal Government
- Lowell: Population Profile
- Lowell: Recreation
- Lowell: Transportation
Lowell, Massachusetts accommodation & food services, waste management - Economy and Business Data
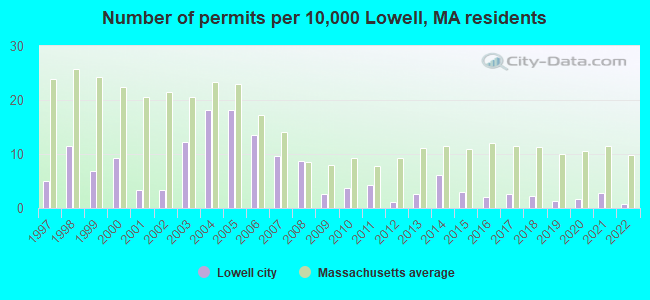
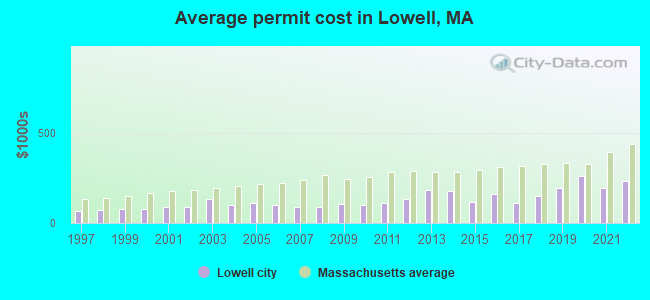
Single-family new house construction building permits:
- 2022: 7 buildings, average cost: $232,100
- 2021: 29 buildings, average cost: $194,500
- 2020: 18 buildings, average cost: $259,800
- 2019: 13 buildings, average cost: $193,400
- 2018: 23 buildings, average cost: $148,300
- 2017: 27 buildings, average cost: $109,000
- 2016: 22 buildings, average cost: $161,500
- 2015: 32 buildings, average cost: $117,400
- 2014: 65 buildings, average cost: $176,100
- 2013: 27 buildings, average cost: $181,100
- 2012: 11 buildings, average cost: $134,800
- 2011: 44 buildings, average cost: $113,000
- 2010: 39 buildings, average cost: $100,500
- 2009: 27 buildings, average cost: $102,500
- 2008: 92 buildings, average cost: $85,600
- 2007: 101 buildings, average cost: $88,900
- 2006: 143 buildings, average cost: $100,300
- 2005: 191 buildings, average cost: $108,500
- 2004: 191 buildings, average cost: $101,000
- 2003: 129 buildings, average cost: $134,600
- 2002: 35 buildings, average cost: $85,600
- 2001: 35 buildings, average cost: $87,800
- 2000: 98 buildings, average cost: $78,100
- 1999: 73 buildings, average cost: $75,500
- 1998: 120 buildings, average cost: $71,200
- 1997: 53 buildings, average cost: $66,500
| Here: | 4.2% |
| Massachusetts: | 3.5% |

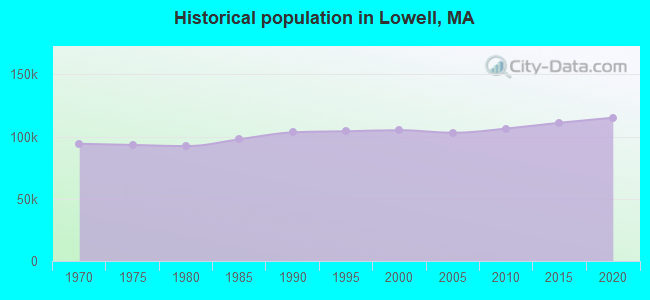
Population change in the 1990s: +1,749 (+1.7%).
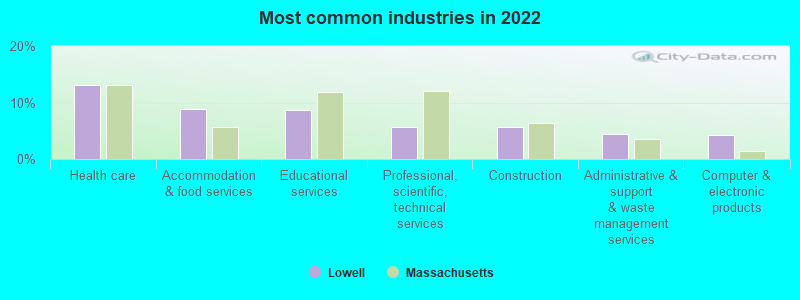
- Health care (13.1%)
- Accommodation & food services (8.9%)
- Educational services (8.7%)
- Professional, scientific, technical services (5.6%)
- Construction (5.6%)
- Administrative & support & waste management services (4.4%)
- Computer & electronic products (4.2%)
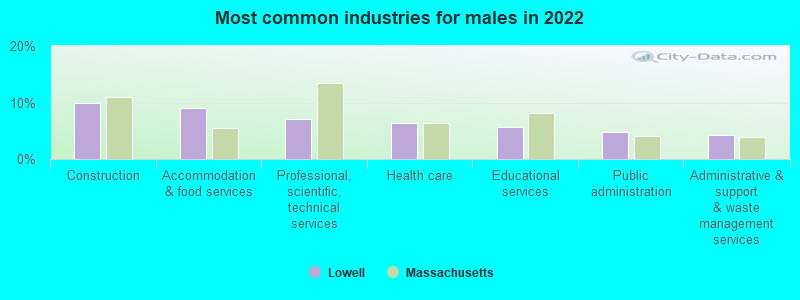
- Construction (9.9%)
- Accommodation & food services (9.0%)
- Professional, scientific, technical services (7.1%)
- Health care (6.4%)
- Educational services (5.7%)
- Public administration (4.8%)
- Administrative & support & waste management services (4.3%)
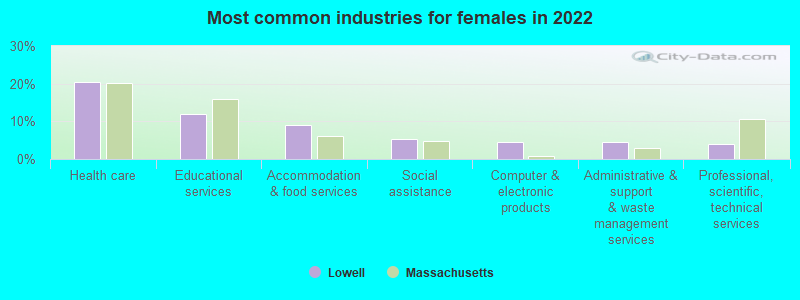
- Health care (20.4%)
- Educational services (12.0%)
- Accommodation & food services (8.9%)
- Social assistance (5.3%)
- Computer & electronic products (4.5%)
- Administrative & support & waste management services (4.4%)
- Professional, scientific, technical services (4.1%)
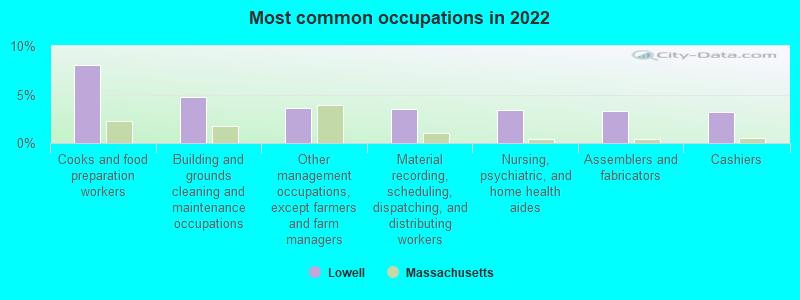
- Cooks and food preparation workers (8.0%)
- Building and grounds cleaning and maintenance occupations (4.8%)
- Other management occupations, except farmers and farm managers (3.6%)
- Material recording, scheduling, dispatching, and distributing workers (3.5%)
- Nursing, psychiatric, and home health aides (3.4%)
- Assemblers and fabricators (3.3%)
- Cashiers (3.1%)
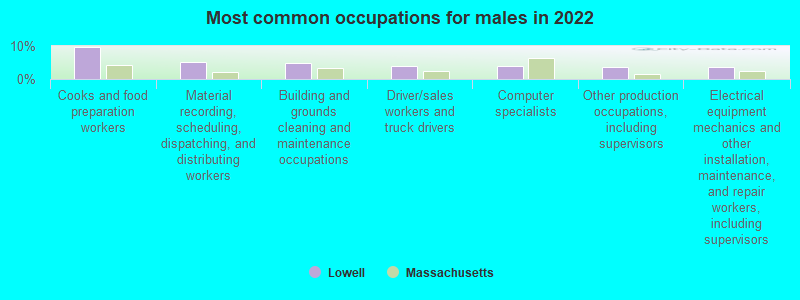
- Cooks and food preparation workers (9.6%)
- Material recording, scheduling, dispatching, and distributing workers (5.0%)
- Building and grounds cleaning and maintenance occupations (4.8%)
- Driver/sales workers and truck drivers (4.0%)
- Computer specialists (3.8%)
- Other production occupations, including supervisors (3.6%)
- Electrical equipment mechanics and other installation, maintenance, and repair workers, including supervisors (3.6%)
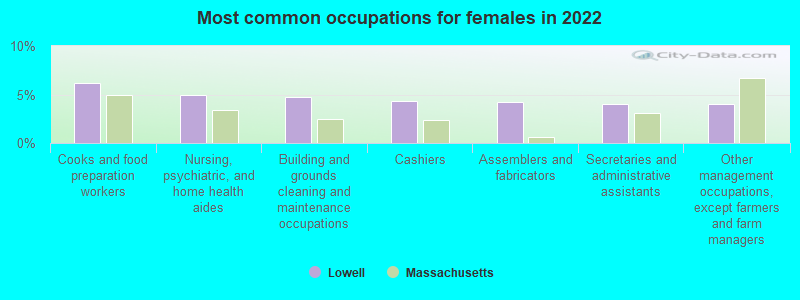
- Cooks and food preparation workers (6.2%)
- Nursing, psychiatric, and home health aides (5.0%)
- Building and grounds cleaning and maintenance occupations (4.8%)
- Cashiers (4.4%)
- Assemblers and fabricators (4.2%)
- Secretaries and administrative assistants (4.0%)
- Other management occupations, except farmers and farm managers (4.0%)
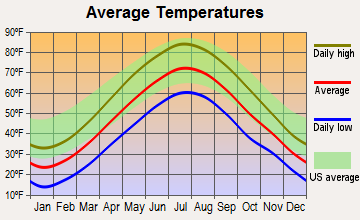
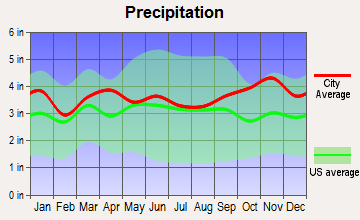
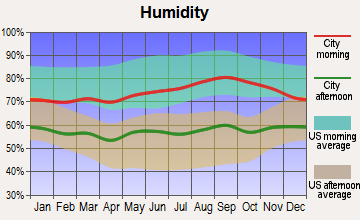
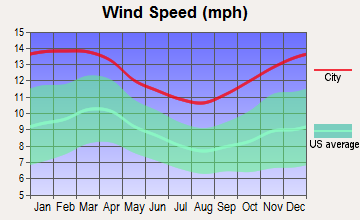
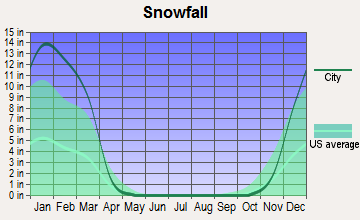
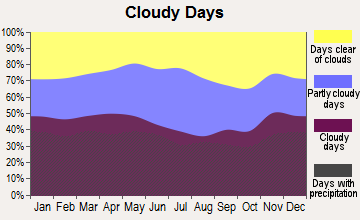
Average climate in Lowell, Massachusetts
Based on data reported by over 4,000 weather stations

|
|


(lower is better)
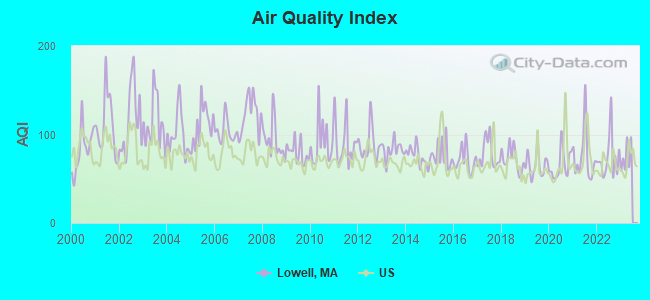
Air Quality Index (AQI) level in 2022 was 73.9. This is about average.
| City: | 73.9 |
| U.S.: | 72.6 |
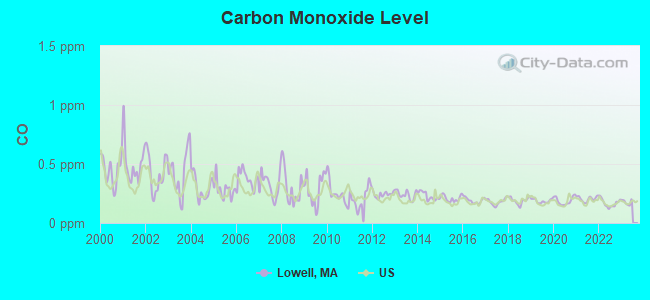
Carbon Monoxide (CO) [ppm] level in 2022 was 0.169. This is significantly better than average. Closest monitor was 0.5 miles away from the city center.
| City: | 0.169 |
| U.S.: | 0.251 |
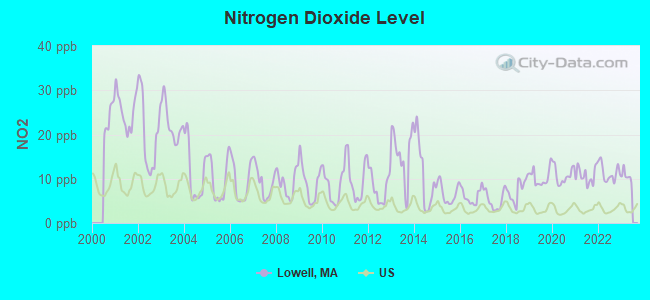
Nitrogen Dioxide (NO2) [ppb] level in 2022 was 11.3. This is significantly worse than average. Closest monitor was 0.2 miles away from the city center.
| City: | 11.3 |
| U.S.: | 5.1 |
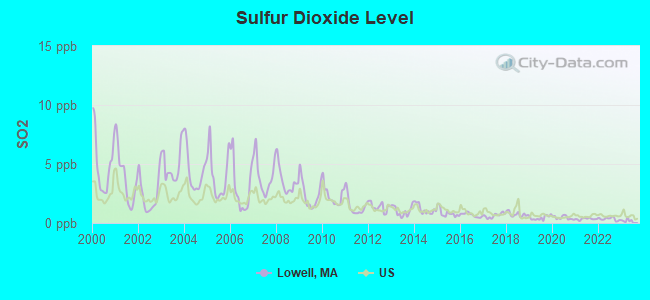
Sulfur Dioxide (SO2) [ppb] level in 2022 was 0.345. This is significantly better than average. Closest monitor was 0.2 miles away from the city center.
| City: | 0.345 |
| U.S.: | 1.515 |
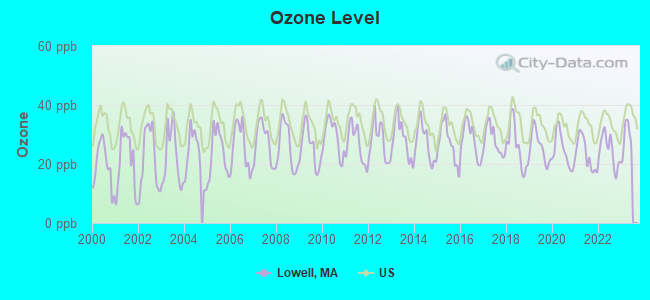
Ozone [ppb] level in 2022 was 24.5. This is better than average. Closest monitor was 0.5 miles away from the city center.
| City: | 24.5 |
| U.S.: | 33.3 |
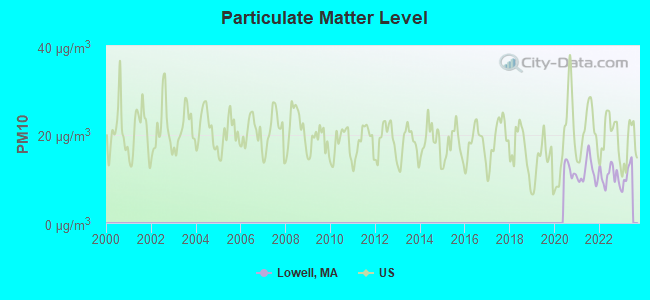
Particulate Matter (PM10) [µg/m3] level in 2022 was 10.6. This is significantly better than average. Closest monitor was 2.6 miles away from the city center.
| City: | 10.6 |
| U.S.: | 19.2 |
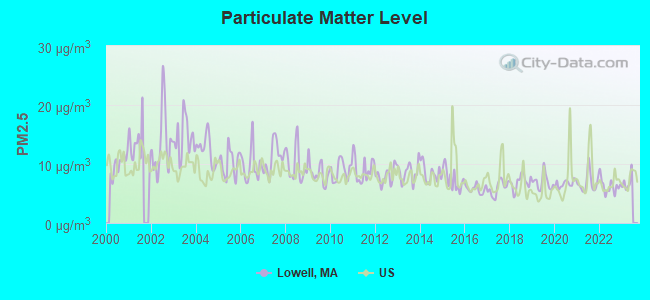
Particulate Matter (PM2.5) [µg/m3] level in 2022 was 6.25. This is better than average. Closest monitor was 0.6 miles away from the city center.
| City: | 6.25 |
| U.S.: | 8.11 |
Tornado activity:
Lowell-area historical tornado activity is near Massachusetts state average. It is 34% smaller than the overall U.S. average.
On 6/9/1953, a category F4 (max. wind speeds 207-260 mph) tornado 25.7 miles away from the Lowell city center killed 90 people and injured 1228 people and caused between $50,000,000 and $500,000,000 in damages.
On 9/29/1974, a category F3 (max. wind speeds 158-206 mph) tornado 5.1 miles away from the city center injured one person and caused between $50,000 and $500,000 in damages.
Earthquake activity:
Lowell-area historical earthquake activity is significantly above Massachusetts state average. It is 72% smaller than the overall U.S. average.On 4/20/2002 at 10:50:47, a magnitude 5.3 (5.3 ML, Depth: 3.0 mi, Class: Moderate, Intensity: VI - VII) earthquake occurred 176.2 miles away from the city center
On 10/7/1983 at 10:18:46, a magnitude 5.3 (5.1 MB, 5.3 LG, 5.1 ML) earthquake occurred 177.4 miles away from Lowell center
On 1/19/1982 at 00:14:42, a magnitude 4.7 (4.5 MB, 4.7 MD, 4.5 LG, Class: Light, Intensity: IV - V) earthquake occurred 61.2 miles away from the city center
On 4/20/2002 at 10:50:47, a magnitude 5.2 (5.2 MB, 4.2 MS, 5.2 MW, 5.0 MW) earthquake occurred 175.6 miles away from the city center
On 10/16/2012 at 23:12:25, a magnitude 4.7 (4.7 ML, Depth: 10.0 mi) earthquake occurred 74.1 miles away from the city center
On 8/22/1992 at 12:20:32, a magnitude 4.8 (4.8 MB, 3.8 MS, 4.7 LG, Depth: 6.2 mi) earthquake occurred 249.9 miles away from Lowell center
Magnitude types: regional Lg-wave magnitude (LG), body-wave magnitude (MB), duration magnitude (MD), local magnitude (ML), surface-wave magnitude (MS), moment magnitude (MW)
Natural disasters:
The number of natural disasters in Middlesex County (31) is a lot greater than the US average (15).Major Disasters (Presidential) Declared: 17
Emergencies Declared: 14
Causes of natural disasters: Floods: 12, Storms: 9, Hurricanes: 6, Snowstorms: 6, Winter Storms: 5, Blizzards: 2, Snows: 2, Explosion: 1, Heavy Rain: 1, Snowfall: 1, Water Main Break: 1, Wind: 1 (Note: some incidents may be assigned to more than one category).
Main business address for: DATAWATCH CORP (SERVICES-PREPACKAGED SOFTWARE), ENTERPRISE BANCORP INC /MA/ (STATE COMMERCIAL BANKS).
Hospitals in Lowell:
- DR HARRY SOLOMON MHC (391 VARNUM AVE)
- LOWELL GENERAL HOSPITAL (Voluntary non-profit - Private, provides emergency services, 295 VARNUM AVENUE)
- SAINTS MEDICAL CENTER INC (Voluntary non-profit - Church, 1 HOSPITAL DRIVE)
- ST JOSEPHS HOSPITAL (220 PAUTUCKET ST)
Nursing Homes in Lowell:
- ARCADIA N H (841 MERRIMACK ST)
- CHRISTIAN HILL CONV MOME (19 VARNUM ST)
- D'YOUVILLE SENIOR CARE (981 VARNUM AVENUE)
- FAIRHAVEN HEALTHCARE CENTER (476 VARNUM AVENUE)
- FAIRHAVEN NURSING HOME (476 VARNUM AVE)
- LOWELL HEALTH CARE CENTER (19 VARNUM STREET)
- NORTHWOOD CONV HME (1010 VARNUM AVE)
- ST JOHNS NH OF LOWELL (500 WENTWORTH AVE)
- TOWN AND COUNTRY NURSING HOME (915 WESTFORD ST)
- WILLOW MANOR (30 PRINCETON BOULEVARD)
- WINGATE AT BELVIDERE REHAB AND SKILLED NURSING RES (500 WENTWORTH AVENUE)
Dialysis Facilities in Lowell:
Home Health Centers in Lowell:
Heliports located in Lowell:
See details about Heliports located in Lowell, MAColleges/Universities in Lowell:
- University of Massachusetts-Lowell (Full-time enrollment: 12,341; Location: 1 University Ave; Public; Website: www.uml.edu; Offers Doctor's degree)
- Lincoln Technical Institute-Lowell (Full-time enrollment: 306; Location: 211 Plain St; Private, for-profit; Website: www.lincolntech.com)
- Lowell Academy Hairstyling Institute (Full-time enrollment: 135; Location: 136 Central St; Private, for-profit; Website: www.lowellacademy.com)
- Empire Beauty School-Lowell (Full-time enrollment: 114; Location: 231 Central St; Private, for-profit; Website: www.empire.edu)
Other colleges/universities with over 2000 students near Lowell:
- Middlesex Community College (about 9 miles; Bedford, MA; Full-time enrollment: 6,040)
- Merrimack College (about 10 miles; North Andover, MA; FT enrollment: 2,734)
- Northern Essex Community College (about 18 miles; Haverhill, MA; FT enrollment: 4,737)
- North Shore Community College (about 18 miles; Danvers, MA; FT enrollment: 5,195)
- Bentley University (about 18 miles; Waltham, MA; FT enrollment: 5,229)
- Tufts University (about 19 miles; Medford, MA; FT enrollment: 9,041)
- Brandeis University (about 20 miles; Waltham, MA; FT enrollment: 6,966)
Public high schools in Lowell:
- LOWELL HIGH (Students: 3,732, Location: 50 FATHER MORRISSETTE BOULEVAR, Grades: 9-12)
- LOWELL MIDDLESEX ACADEMY CHARTER SCHOOL (Students: 113, Location: 67 MIDDLE STREET, Grades: 9-12, Charter school)
- LEBLANC THERAPEUTIC DAY SCHOOL (Location: 58 SYCAMORE STREET, Grades: 8-12)
Private high schools in Lowell:
- LOWELL CATHOLIC (Students: 390, Location: 530 STEVENS ST, Grades: 9-12)
- COMMUNITY CHRISTIAN ACADEMY (Students: 171, Location: 105R PRINCETON BLVD, Grades: PK-12)
- LOWELL TREATMENT CENTER (Students: 68, Location: 391 VARNUM AVE, Grades: 6-12)
- RIVERSIDE SCHOOL (Students: 19, Location: 34 BERRY RD, Grades: 6-12)
Biggest public elementary/middle schools in Lowell:
- LOWELL COMMUNITY CHARTER PUBLIC SCHOOL (Students: 867, Location: 206 JACKSON STREET, Grades: PK-7, Charter school)
- JAMES S DALEY MIDDLE SCHOOL (Students: 702, Location: 150 FLEMING STREET, Grades: 5-8)
- DR AN WANG SCHOOL (Students: 636, Location: 365 WEST MEADOW ROAD, Grades: 5-8)
- JAMES SULLIVAN MIDDLE SCHOOL (Students: 606, Location: 150 DRAPER STREET, Grades: 5-8)
- KATHRYN P. STOKLOSA MIDDLE SCHOOL (Students: 578, Location: 560 BROADWAY STREET, Grades: 5-8)
- HENRY J ROBINSON MIDDLE (Students: 546, Location: 110 JUNE STREET, Grades: 5-8)
- PETER W REILLY (Students: 516, Location: 115 DOUGLAS ROAD, Grades: KG-4)
- JOSEPH MCAVINNUE (Students: 494, Location: 131 MAMMOTH ROAD, Grades: PK-4)
- DR GERTRUDE BAILEY (Students: 472, Location: 175 CAMPBELL DRIVE, Grades: PK-4)
- CHARLOTTE M MURKLAND ELEMENTARY (Students: 467, Location: 350 ADAMS STREET, Grades: PK-4)
Private elementary/middle schools in Lowell:
- ST MICHAEL SCHOOL (Students: 411, Location: 21 6TH ST, Grades: PK-8)
- STE JEANNE D'ARC ELEMENTARY SCHOOL (Students: 398, Location: 68 DRACUT ST, Grades: PK-8)
- ST LOUIS SCHOOL (Students: 313, Location: 77 BOISVERT ST, Grades: PK-8)
- IMMACULATE CONCEPTION SCHOOL (Students: 277, Location: 218 E MERRIMACK ST, Grades: PK-8)
- FRANCO AMERICAN SCHOOL (Students: 228, Location: 357 PAWTUCKET ST, Grades: PK-8)
- ST MARGARET ELEMENTARY SCHOOL (Students: 228, Location: 486 STEVENS ST, Grades: PK-8)
- HELLENIC AMERICAN ACADEMY (Students: 153, Location: 41 BROADWAY ST, Grades: PK-8)
- ST PATRICK SCHOOL & EDUCATION CENTER (Students: 151, Location: 311 ADAMS ST, Grades: PK-8)
User-submitted facts and corrections:
- SMMC is located at 1 Hospital Dr. not 220 Pawtucket St
- Hellenic American School 62 Lewis Street. Lowell, MA 01854 Tel.: (978) 453-8092 Fax: (978) 970-0935 Principal: Dr. James A. Demos Pre-K to sixth grade 2004-05 enrollment: 138
- Sacred Heart School (private) was closed by the Archdiocise.
- Middlesex Community College is located in downtown Lowell, Massachusetts at 33 Kearney Square as well as in Bedford Massachusetts. We have approximately 11,500 credit students
Points of interest:
Notable locations in Lowell: Lowell Station (A), Lawrence Mill (B), Massachusetts Mill (C), Appleton Mill (D), Saint Louis Field (E), Hadley Field (F), Boott Mills (G), Hamilton Mill (H), Lowell Industrial Park (I), Market Mills (J), Mount Pleasant Golf Club (K), Suffolk Mill Turbine Exhibit (L), Wamesit Canal-Whipple Mill Industrial Complex (M), Welles Block (N), Lowell National Historic Park Offices (O), Lowell Manufacturing Company (P), PrideStar Ambulance Service (Q), Lowell Fire Department Station 1 (R), Lowell Fire Department Station 4 (S), Lowell Fire Department Station 11 (T). Display/hide their locations on the map
Shopping Centers: Eastgate Plaza Shopping Center (1), Middlesex Plaza Shopping Center (2), Sunrise Shopping Center (3). Display/hide their locations on the map
Main business address in Lowell include: DATAWATCH CORP (A), ENTERPRISE BANCORP INC /MA/ (B). Display/hide their locations on the map
Churches in Lowell include: Saint Annes Church and Rectory (A), Temple Emanuel-Reform (B), Seventh Day Adventist Spanish Church (C), Seventh Day Adventist Church (D), Saint Ritas Shrine (E), Saint Peters Healing Church (F), Saint Pauls United Methodist Church (G), Saint Patricks Church (H), Saint Michaels Church (I). Display/hide their locations on the map
Cemeteries: Edson Cemetery (1), Saint Patricks Cemetery (2), Saint Peters Cemetery (3), Westlawn Cemetery (4), Lowell Cemetery (5), Clark Cemetery (6), Saint Marys Cemetery (7). Display/hide their locations on the map
Reservoirs: Concord River Reservoir (A), Lower Pawtucket Canal Reservoir (B), Upper Pawtucket Canal Reservoir (C), Pawtucket Canal Reservoir (D), Merrimack River Reservoir (E), Beaver Brook Reservoir (F), Lowell Reservoir (G). Display/hide their locations on the map
Streams, rivers, and creeks: Concord River (A), Beaver Brook (B), Marbles Brook (C), Scarlet Brook (D), Black Brook (E), Claypit Brook (F), Marginal Brook (G), River Meadow Brook (H). Display/hide their locations on the map
Parks in Lowell include: Merrimack-Middle Street Historic District (1), Wash Park (2), Washington Square Historic District (3), Kerouac Commemorative (4), Tyler Park (5), Lucy Larcom Park (6), City Hall Historic District (7), South Common Historic District (8), Memorial Stadium (9). Display/hide their locations on the map
Tourist attractions: American Textile History Museum (491 Dutton Street) (1), Lowell National Historical Park (Recreation Areas; 67 Kirk Street) (2), Perpetual Motion (Amusement & Theme Parks; 345 Chelmsford Street) (3), Jump On In (Amusement & Theme Parks; 100 Phoenix Ave.) (4), New England Quilt Museum (18 Shattuck Street) (5). Display/hide their approximate locations on the map
Hotels: Courtyard by Marriott (30 Industrial Avenue) (1), Doubletree Hotel (50 Warren Street) (2). Display/hide their approximate locations on the map
Courts: Massachusetts Commonwealth - Superior Court (360 Gorham Street) (1), Mass Commonwealth - Courts- Superior Court (360 Gorham Street) (2), Mass Commonwealth - Courts- Lowell Juvenile Court- Probation Office (89 Appleton Street) (3), Middlesex County - Court House- Registry Paging Number (360 Gorham Street) (4). Display/hide their approximate locations on the map
Birthplace of: Micky Ward - Boxer, William Henry O'Connell - Roman Catholic cardinal, Jack Kerouac - (1922-1969), writer, Bette Davis - Actress of film, Henry Livermore Abbott - Union Army General, Richard M. Linnehan - (born 1957), astronaut, David H. McNerney - Army Medal of Honor recipient, Brian C. Mitchell - University president, Elbridge Streeter Brooks - Children's writer, Charles Sweeney - General.
Drinking water stations with addresses in Lowell and their reported violations in the past:
RIVER CROSSING CONDOMINIUM (Address: 1201 WESTFORD STREET , Population served: 150, Groundwater):Past monitoring violations:BOUMIL GROVE CONDOS (Serves NH, Population served: 75, Groundwater):
- Follow-up Or Routine LCR Tap M/R - In JAN-01-2007, Contaminant: Lead and Copper Rule. Follow-up actions: St AO (w/o penalty) issued (JAN-04-2008), St Compliance achieved (JAN-14-2008)
- One routine major monitoring violation
- 24 regular monitoring violations
Past health violations:Past monitoring violations:
- MCL, Monthly (TCR) - In JUL-2011, Contaminant: Coliform. Follow-up actions: St Public Notif requested (AUG-04-2011), St Violation/Reminder Notice (AUG-04-2011), St Public Notif received (AUG-12-2011), St Compliance achieved (FEB-24-2012)
- Failure To Address Deficiency - In APR-18-2013, Contaminant: GROUNDWATER RULE. Follow-up actions: St Public Notif requested (APR-29-2013), St Formal NOV issued (APR-29-2013), St Public Notif received (AUG-05-2013), St Compliance achieved (AUG-20-2013)
- Monitoring, Source Water (GWR) - Between AUG-01-2011 and SEP-01-2011, Contaminant: E. COLI. Follow-up actions: St Public Notif requested (OCT-20-2011), St Violation/Reminder Notice (OCT-20-2011), St Compliance achieved (NOV-01-2011), St Public Notif received (NOV-04-2011)
- 2 routine major monitoring violations
Drinking water stations with addresses in Lowell that have no violations reported:
- LOWELL REGIONAL WATER UTILITY (Population served: 106,519, Primary Water Source Type: Surface water)
| This city: | 2.7 people |
| Massachusetts: | 2.5 people |
| This city: | 61.6% |
| Whole state: | 63.0% |
| This city: | 9.7% |
| Whole state: | 7.0% |
Likely homosexual households (counted as self-reported same-sex unmarried-partner households)
- Lesbian couples: 0.4% of all households
- Gay men: 0.4% of all households
People in group quarters in Lowell in 2010:
- 2,785 people in college/university student housing
- 1,101 people in nursing facilities/skilled-nursing facilities
- 149 people in emergency and transitional shelters (with sleeping facilities) for people experiencing homelessness
- 147 people in other noninstitutional facilities
- 80 people in residential treatment centers for adults
- 73 people in group homes intended for adults
- 11 people in group homes for juveniles (non-correctional)
People in group quarters in Lowell in 2000:
- 1,898 people in college dormitories (includes college quarters off campus)
- 1,120 people in nursing homes
- 469 people in other noninstitutional group quarters
- 127 people in religious group quarters
- 70 people in homes for the mentally retarded
- 67 people in homes for the mentally ill
- 62 people in homes or halfway houses for drug/alcohol abuse
- 28 people in other group homes
Banks with most branches in Lowell (2011 data):
- Sovereign Bank, National Association: Stadium Plaza Office Branch, Wood Street Branch, Lowell-City Hall Branch, Merrimack Street Branch. Info updated 2012/01/31: Bank assets: $78,146.9 mil, Deposits: $48,042.9 mil, headquarters in Wilmington, DE, positive income, Commercial Lending Specialization, 718 total offices, Holding Company: Banco Santander, S.A.
- Enterprise Bank and Trust Company: Enterprise Bank And Trust Company, Lowell Connector Branch, Online Banking Branch. Info updated 2006/11/03: Bank assets: $1,488.4 mil, Deposits: $1,333.6 mil, local headquarters, positive income, Commercial Lending Specialization, 20 total offices, Holding Company: Enterprise Bancorp, Inc.
- TD Bank, National Association: Lowell Branch, Mammoth Road Branch, Lowell Main Branch. Info updated 2010/10/04: Bank assets: $188,912.6 mil, Deposits: $153,149.8 mil, headquarters in Wilmington, DE, positive income, 1314 total offices, Holding Company: Toronto-Dominion Bank, The
- The Lowell Five Cent Savings Bank: Wood Street Branch at 13 Wood Street, branch established on 1978/09/01; at 34 John Street, branch established on 1854/04/12. Info updated 2011/09/19: Bank assets: $738.4 mil, Deposits: $601.2 mil, local headquarters, positive income, Mortgage Lending Specialization, 13 total offices, Holding Company: Lowell Five Bancorp Mhc
- Bank of America, National Association: Centralville Branch at 501 Bridge Street, branch established on 1963/07/29; Lowell -stairway Plaza Branch at 724 Chelmsford St, Suite 6, branch established on 1968/04/08. Info updated 2009/11/18: Bank assets: $1,451,969.3 mil, Deposits: $1,077,176.8 mil, headquarters in Charlotte, NC, positive income, 5782 total offices, Holding Company: Bank Of America Corporation
- Lowell Co-operative Bank: Lowell Co-Operative Bank at 18 Hurd Street, branch established on 1885/01/01; Rogers Street Branch at 691 Rogers Street, branch established on 2004/04/05. Info updated 2012/02/10: Bank assets: $168.6 mil, Deposits: $120.7 mil, local headquarters, positive income, Mortgage Lending Specialization, 2 total offices
- Eastern Bank: Lakeview Branch at 755 Lakeview Avenue, branch established on 1977/11/01; Lowell/Central Branch at 50 Central Street, branch established on 1871/03/03. Info updated 2011/03/30: Bank assets: $7,812.9 mil, Deposits: $6,295.8 mil, headquarters in Boston, MA, positive income, Commercial Lending Specialization, 94 total offices, Holding Company: Eastern Bank Corporation
- Washington Savings Bank: at 30 Middlesex Street, branch established on 1892/04/06. Info updated 2012/03/30: Bank assets: $181.8 mil, Deposits: $141.5 mil, local headquarters, positive income, 3 total offices
- People's United Bank: Butler Bank Branch at 10 George Street, branch established on 1901/01/01. Info updated 2012/02/16: Bank assets: $27,319.3 mil, Deposits: $20,835.4 mil, headquarters in Bridgeport, CT, positive income, Commercial Lending Specialization, 374 total offices
For population 15 years and over in Lowell:
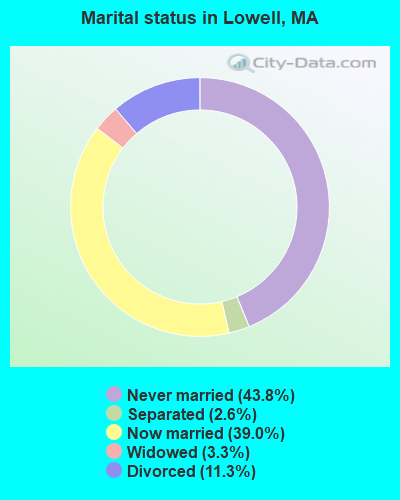
- Never married: 43.8%
- Now married: 39.0%
- Separated: 2.6%
- Widowed: 3.3%
- Divorced: 11.3%
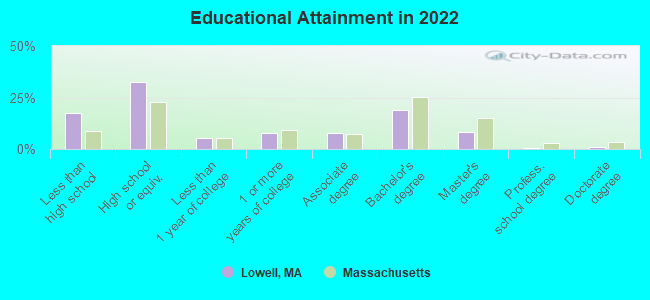
For population 25 years and over in Lowell:
- High school or higher: 82.4%
- Bachelor's degree or higher: 28.7%
- Graduate or professional degree: 10.0%
- Unemployed: 6.6%
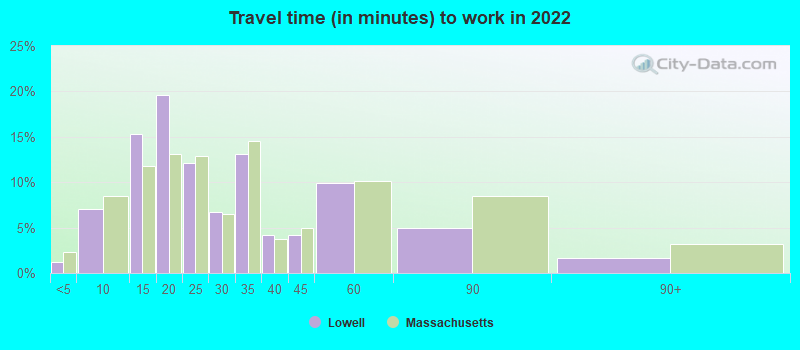
- Mean travel time to work (commute): 23.0 minutes
| Here: | 16.3 |
| Massachusetts average: | 13.0 |
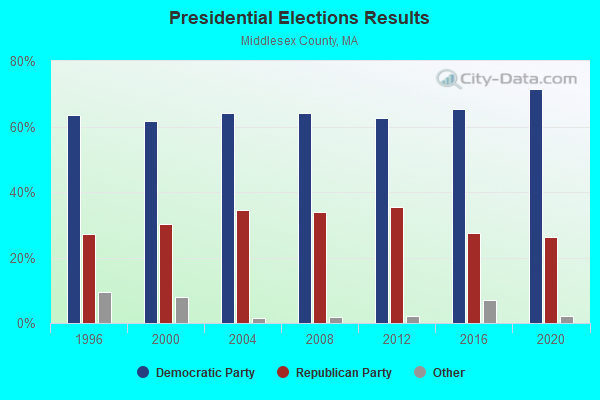
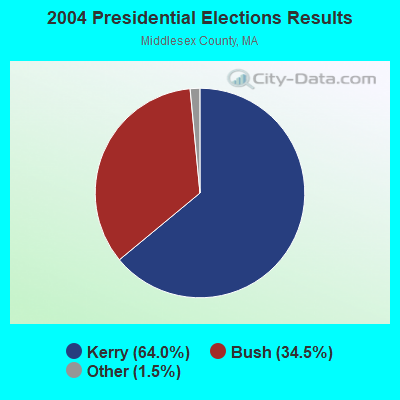
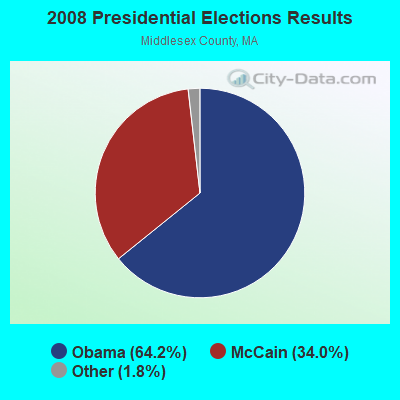
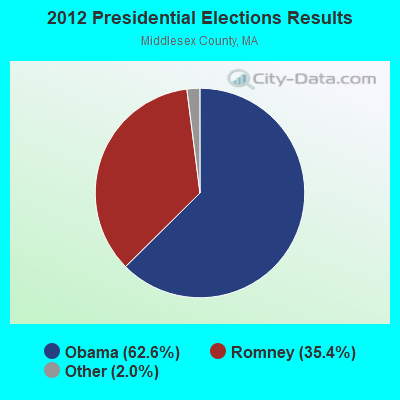
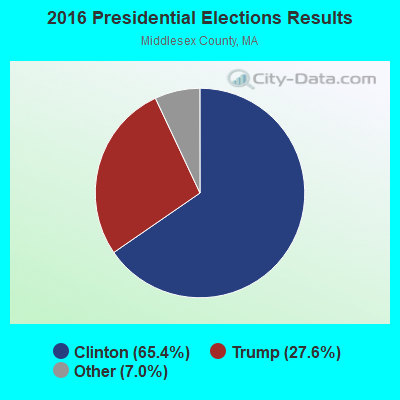
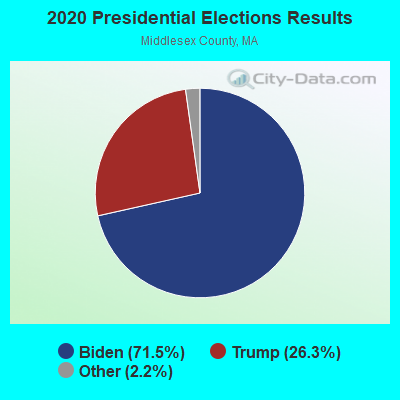
Graphs represent county-level data. Detailed 2008 Election Results
Neighborhoods in Lowell:
(Lowell, Massachusetts Neighborhood Map)Religion statistics for Lowell, MA (based on Middlesex County data)
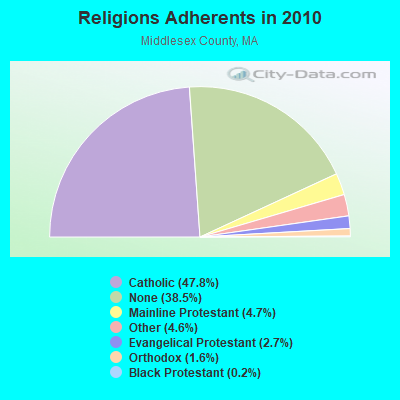
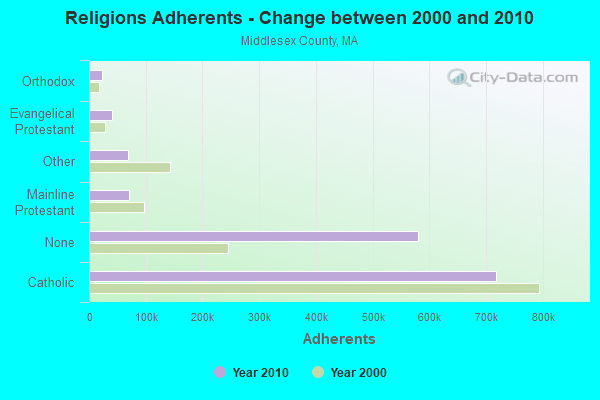
| Religion | Adherents | Congregations |
|---|---|---|
| Catholic | 718,209 | 107 |
| Mainline Protestant | 70,053 | 269 |
| Other | 68,480 | 199 |
| Evangelical Protestant | 41,270 | 304 |
| Orthodox | 23,641 | 28 |
| Black Protestant | 2,276 | 8 |
| None | 579,156 | - |
Food Environment Statistics:
| Middlesex County: | 1.71 / 10,000 pop. |
| Massachusetts: | 1.98 / 10,000 pop. |
| Middlesex County: | 0.03 / 10,000 pop. |
| Massachusetts: | 0.05 / 10,000 pop. |
| This county: | 2.14 / 10,000 pop. |
| Massachusetts: | 2.22 / 10,000 pop. |
| This county: | 1.38 / 10,000 pop. |
| State: | 1.77 / 10,000 pop. |
| Middlesex County: | 7.84 / 10,000 pop. |
| Massachusetts: | 8.76 / 10,000 pop. |
| Middlesex County: | 7.8% |
| Massachusetts: | 8.1% |
| Middlesex County: | 21.5% |
| State: | 22.5% |
| This county: | 18.0% |
| Massachusetts: | 16.5% |
Health and Nutrition:
| This city: | 49.7% |
| Massachusetts: | 50.5% |
| Lowell: | 47.0% |
| Massachusetts: | 48.0% |
| This city: | 28.1 |
| State: | 28.4 |
| Here: | 20.4% |
| State: | 20.7% |
| Lowell: | 12.3% |
| State: | 10.4% |
| This city: | 6.8 |
| Massachusetts: | 6.8 |
| This city: | 30.5% |
| Massachusetts: | 33.4% |
| Lowell: | 56.4% |
| State: | 57.1% |
| Lowell: | 80.3% |
| Massachusetts: | 79.2% |
More about Health and Nutrition of Lowell, MA Residents
| Local government employment and payroll (March 2022) | |||||
| Function | Full-time employees | Monthly full-time payroll | Average yearly full-time wage | Part-time employees | Monthly part-time payroll |
|---|---|---|---|---|---|
| Elementary and Secondary - Instruction | 1,860 | $12,006,620 | $77,462 | 26 | $154,302 |
| Elementary and Secondary - Other Total | 299 | $1,487,883 | $59,714 | 131 | $255,680 |
| Police Protection - Officers | 239 | $2,002,972 | $100,568 | 0 | $0 |
| Firefighters | 206 | $1,602,926 | $93,374 | 0 | $0 |
| Police - Other | 73 | $352,080 | $57,876 | 26 | $25,522 |
| Other and Unallocable | 66 | $315,429 | $57,351 | 8 | $8,436 |
| Health | 49 | $290,355 | $71,107 | 7 | $6,178 |
| Streets and Highways | 45 | $268,402 | $71,574 | 1 | $461 |
| Financial Administration | 44 | $284,381 | $77,558 | 1 | $349 |
| Sewerage | 44 | $281,905 | $76,883 | 2 | $2,174 |
| Water Supply | 36 | $186,044 | $62,015 | 2 | $1,300 |
| Housing and Community Development (Local) | 31 | $186,655 | $72,254 | 0 | $0 |
| Other Government Administration | 30 | $155,399 | $62,160 | 0 | $0 |
| Local Libraries | 19 | $89,470 | $56,507 | 14 | $14,557 |
| Judicial and Legal | 15 | $103,327 | $82,662 | 0 | $0 |
| Welfare | 13 | $53,223 | $49,129 | 2 | $1,534 |
| Parks and Recreation | 12 | $62,571 | $62,571 | 41 | $18,308 |
| Fire - Other | 5 | $26,886 | $64,526 | 2 | $5,328 |
| Solid Waste Management | 5 | $23,414 | $56,194 | 0 | $0 |
| Electric Power | 4 | $24,556 | $73,668 | 0 | $0 |
| Totals for Government | 3,095 | $19,804,500 | $76,786 | 263 | $494,128 |
Lowell government finances - Expenditure in 2021 (per resident):
- Construction - Elementary and Secondary Education: $23,081,000 ($203.16)
General - Other: $15,605,000 ($137.36)
Regular Highways: $11,337,000 ($99.79)
Sewerage: $3,665,000 ($32.26)
Housing and Community Development: $562,000 ($4.95)
Parks and Recreation: $72,000 ($0.63)
- Current Operations - Elementary and Secondary Education: $253,803,000 ($2234.02)
General - Other: $52,186,000 ($459.35)
Police Protection: $28,101,000 ($247.35)
Local Fire Protection: $20,198,000 ($177.79)
Sewerage: $11,445,000 ($100.74)
Solid Waste Management: $6,645,000 ($58.49)
Central Staff Services: $5,896,000 ($51.90)
Water Utilities: $5,128,000 ($45.14)
Regular Highways: $4,939,000 ($43.47)
Housing and Community Development: $4,464,000 ($39.29)
Parking Facilities: $3,776,000 ($33.24)
Parks and Recreation: $2,887,000 ($25.41)
Health - Other: $2,817,000 ($24.80)
General Public Buildings: $2,463,000 ($21.68)
Financial Administration: $2,003,000 ($17.63)
Judicial and Legal Services: $1,979,000 ($17.42)
Libraries: $1,423,000 ($12.53)
Protective Inspection and Regulation - Other: $1,110,000 ($9.77)
Public Welfare - Other: $654,000 ($5.76)
- General - Interest on Debt: $8,601,000 ($75.71)
- Intergovernmental to Local - Other - Elementary and Secondary Education: $10,207,000 ($89.84)
Other - Health - Other: $106,000 ($0.93)
- Intergovernmental to State - Transit Utilities: $1,070,000 ($9.42)
General - Other: $325,000 ($2.86)
- Other Capital Outlay - Elementary and Secondary Education: $18,208,000 ($160.27)
General - Other: $17,834,000 ($156.98)
Housing and Community Development: $1,156,000 ($10.18)
Water Utilities: $1,054,000 ($9.28)
Police Protection: $605,000 ($5.33)
Parks and Recreation: $436,000 ($3.84)
Regular Highways: $136,000 ($1.20)
Local Fire Protection: $122,000 ($1.07)
Sewerage: $85,000 ($0.75)
Libraries: $35,000 ($0.31)
Health - Other: $14,000 ($0.12)
- Total Salaries and Wages: $156,035,000 ($1373.45)
- Water Utilities - Interest on Debt: $1,023,000 ($9.00)
Lowell government finances - Revenue in 2021 (per resident):
- Charges - Sewerage: $24,803,000 ($218.32)
Other: $7,220,000 ($63.55)
Parking Facilities: $5,322,000 ($46.85)
Solid Waste Management: $3,303,000 ($29.07)
Elementary and Secondary Education School Lunch: $1,137,000 ($10.01)
Parks and Recreation: $412,000 ($3.63)
Elementary and Secondary Education School Tuition and Transportation: $286,000 ($2.52)
Miscellaneous Commercial Activities: $129,000 ($1.14)
Elementary and Secondary Education - Other: $9,000 ($0.08)
- Federal Intergovernmental - Other: $45,299,000 ($398.73)
Housing and Community Development: $6,208,000 ($54.64)
Education: $1,311,000 ($11.54)
- Local Intergovernmental - Education: $35,000 ($0.31)
- Miscellaneous - General Revenue - Other: $5,741,000 ($50.53)
Interest Earnings: $546,000 ($4.81)
Fines and Forfeits: $461,000 ($4.06)
Donations From Private Sources: $5,000 ($0.04)
- Revenue - Water Utilities: $12,152,000 ($106.96)
- State Intergovernmental - Education: $202,729,000 ($1784.46)
General Local Government Support: $27,516,000 ($242.20)
Highways: $9,081,000 ($79.93)
Other: $6,653,000 ($58.56)
Public Welfare: $495,000 ($4.36)
Housing and Community Development: $265,000 ($2.33)
- Tax - Property: $156,025,000 ($1373.36)
Other License: $2,337,000 ($20.57)
Other Selective Sales: $1,991,000 ($17.53)
Lowell government finances - Debt in 2021 (per resident):
- Long Term Debt - Outstanding Unspecified Public Purpose: $297,599,000 ($2619.53)
Beginning Outstanding - Unspecified Public Purpose: $264,438,000 ($2327.64)
Issue, Unspecified Public Purpose: $59,945,000 ($527.65)
Retired Unspecified Public Purpose: $26,784,000 ($235.76)
- Short Term Debt Outstanding - Beginning: $39,365,000 ($346.50)
End of Fiscal Year: $15,009,000 ($132.11)
Lowell government finances - Cash and Securities in 2021 (per resident):
- Bond Funds - Cash and Securities: $27,937,000 ($245.91)
- Other Funds - Cash and Securities: $118,381,000 ($1042.01)
6.91% of this county's 2021 resident taxpayers lived in other counties in 2020 ($102,955 average adjusted gross income)
| Here: | 6.91% |
| Massachusetts average: | 6.35% |
0.01% of residents moved from foreign countries ($137 average AGI)
Middlesex County: 0.01% Massachusetts average: 0.01%
Top counties from which taxpayers relocated into this county between 2020 and 2021:
| from Suffolk County, MA | |
| from Essex County, MA | |
| from Norfolk County, MA |
8.22% of this county's 2020 resident taxpayers moved to other counties in 2021 ($123,369 average adjusted gross income)
| Here: | 8.22% |
| Massachusetts average: | 7.18% |
0.01% of residents moved to foreign countries ($124 average AGI)
Middlesex County: 0.01% Massachusetts average: 0.02%
Top counties to which taxpayers relocated from this county between 2020 and 2021:
| to Suffolk County, MA | |
| to Essex County, MA | |
| to Worcester County, MA |
| Businesses in Lowell, MA | ||||
| Name | Count | Name | Count | |
|---|---|---|---|---|
| 7-Eleven | 3 | Kincaid | 1 | |
| AT&T | 1 | Lane Furniture | 1 | |
| Ace Hardware | 1 | Lowe's | 1 | |
| Advance Auto Parts | 2 | Marriott | 1 | |
| Ashley Furniture | 1 | Mazda | 1 | |
| AutoZone | 1 | McDonald's | 3 | |
| Ben & Jerry's | 1 | Nike | 2 | |
| Blockbuster | 2 | Outback | 1 | |
| Brunswick Bowling & Billiards | 1 | Outback Steakhouse | 1 | |
| Burger King | 2 | Penske | 1 | |
| CVS | 3 | Pizza Hut | 1 | |
| Chevrolet | 1 | RadioShack | 1 | |
| Chuck E. Cheese's | 1 | Rite Aid | 3 | |
| Circle K | 1 | Starbucks | 1 | |
| DHL | 1 | Subway | 5 | |
| Domino's Pizza | 3 | T-Mobile | 2 | |
| Dunkin Donuts | 14 | Taco Bell | 1 | |
| Fashion Bug | 1 | Target | 1 | |
| FedEx | 11 | U-Haul | 3 | |
| Ford | 1 | UPS | 12 | |
| GNC | 2 | Walgreens | 2 | |
| H&R Block | 3 | Wendy's | 3 | |
| Jones New York | 1 | YMCA | 1 | |
| KFC | 1 | |||
Strongest AM radio stations in Lowell:
- WCAP (980 AM; 5 kW; LOWELL, MA; Owner: NORTHEAST RADIO, INC.)
- WRKO (680 AM; 50 kW; BOSTON, MA; Owner: ENTERCOM BOSTON LICENSE, LLC)
- WLLH (1400 AM; 1 kW; LOWELL, MA; Owner: MEGA COMMUNICATIONS OF LOWELL LICENSEE, LLC)
- WWZN (1510 AM; 50 kW; BOSTON, MA; Owner: ROSE CITY RADIO CORPORATION)
- WEEI (850 AM; 50 kW; BOSTON, MA; Owner: ENTERCOM BOSTON LICENSE, LLC)
- WKOX (1200 AM; 50 kW; FRAMINGHAM, MA; Owner: CAPSTAR TX LIMITED PARTNERSHIP)
- WBIX (1060 AM; 40 kW; NATICK, MA; Owner: LANGER BROADCASTING CORPORATION)
- WCEC (1110 AM; daytime; 5 kW; SALEM, NH; Owner: COSTA-EAGLE RADIO VENTURES LTD PARTNERSHIP)
- WRCA (1330 AM; 25 kW; WALTHAM, MA; Owner: WRCA LICENSE, LLC)
- WBZ (1030 AM; 50 kW; BOSTON, MA; Owner: INFINITY BROADCASTING OPERATIONS, INC.)
- WAMG (890 AM; 25 kW; DEDHAM, MA; Owner: MEGA COMMUNICATIONS OF DEDHAM LICENSEE, LLC)
- WCRN (830 AM; 50 kW; WORCESTER, MA; Owner: CARTER BROADCASTING CORPORATION)
- WDER (1320 AM; 10 kW; DERRY, NH; Owner: BLOUNT COMMUNICATIONS, INC. OF NH)
Strongest FM radio stations in Lowell:
- WJUL (91.5 FM; LOWELL, MA; Owner: UNIVERSITY OF MASSACHUSETTS, LOWELL)
- WKLB-FM (99.5 FM; LOWELL, MA; Owner: GREATER BOSTON RADIO, INC.)
- W227AM (93.3 FM; ANDOVER, MA; Owner: GREATER BOSTON RADIO, INC.)
- WHOB (106.3 FM; NASHUA, NH; Owner: TELE-MEDIA COMPANY OF NEW HAMPSHIRE, L.L.C.)
- WXRV (92.5 FM; HAVERHILL, MA; Owner: BEANPOT BROADCASTING CORP.)
- WXKS-FM (107.9 FM; MEDFORD, MA; Owner: AMFM RADIO LICENSES, L.L.C.)
- WBMX (98.5 FM; BOSTON, MA; Owner: INFINITY RADIO OPERATIONS INC.)
- WJMN (94.5 FM; BOSTON, MA; Owner: AMFM RADIO LICENSES, L.L.C.)
- WMJX (106.7 FM; BOSTON, MA; Owner: GREATER BOSTON RADIO, INC.)
- WCRB (102.5 FM; WALTHAM, MA; Owner: CHARLES RIVER BROADCASTING WCRB LICE)
- WTKK (96.9 FM; BOSTON, MA; Owner: GREATER BOSTON RADIO, INC.)
- WROR-FM (105.7 FM; FRAMINGHAM, MA; Owner: GREATER BOSTON RADIO, INC.)
- WBOS (92.9 FM; BROOKLINE, MA; Owner: GREATER BOSTON RADIO, INC.)
- WGBH (89.7 FM; BOSTON, MA; Owner: WGBH EDUCATIONAL FOUNDATION)
- WBUR-FM (90.9 FM; BOSTON, MA; Owner: TRUSTEES OF BOSTON UNIVERSITY)
- WFEX (92.1 FM; PETERBOROUGH, NH; Owner: FNX BROADCASTING OF NEW HAMPSHIRE LLC)
- WQSX (93.7 FM; LAWRENCE, MA; Owner: ENTERCOM BOSTON LICENSE, LLC)
- WODS (103.3 FM; BOSTON, MA; Owner: INFINITY BROADCASTING OPERATIONS, INC.)
- WGIR-FM (101.1 FM; MANCHESTER, NH; Owner: CAPSTAR TX LIMITED PARTNERSHIP)
- WQLL (96.5 FM; BEDFORD, NH; Owner: SAGA COMMUNICATIONS OF NEW ENGLAND, LLC)
TV broadcast stations around Lowell:
- WFXZ-CA (Channel 24; BOSTON, MA; Owner: BOSTON BROADCASTING CORP.)
- WNDS (Channel 50; DERRY, NH; Owner: CTV OF DERRY, INC)
- WCVB-TV (Channel 5; BOSTON, MA; Owner: WCVB HEARST-ARGYLE TV, INC.)
- WGBH-TV (Channel 2; BOSTON, MA; Owner: WGBH EDUCATIONAL FOUNDATION)
- WUTF (Channel 66; MARLBOROUGH, MA; Owner: TELEFUTURA BOSTON LLC)
- WHDH-TV (Channel 7; BOSTON, MA; Owner: WHDH-TV)
- WMFP (Channel 62; LAWRENCE, MA; Owner: WSAH LICENSE, INC.)
- WBZ-TV (Channel 4; BOSTON, MA; Owner: VIACOM INC.)
- WGBX-TV (Channel 44; BOSTON, MA; Owner: WGBH EDUCATIONAL FOUNDATION)
- WSBK-TV (Channel 38; BOSTON, MA; Owner: VIACOM INC.)
- WLVI-TV (Channel 56; CAMBRIDGE, MA; Owner: WLVI, INC.)
- WFXT (Channel 25; BOSTON, MA; Owner: FOX TELEVISION STATIONS INC.)
- WBPX (Channel 68; BOSTON, MA; Owner: PAXSON BOSTON-68 LICENSE, INC.)
- WUNI (Channel 27; WORCESTER, MA; Owner: ENTRAVISION HOLDINGS, LLC)
- W40BO (Channel 40; BOSTON, MA; Owner: PAXSON COMMUNICATIONS LPTV, INC.)
- WTMU-LP (Channel 32; BOSTON, MA; Owner: ZGS BOSTON, INC.)
- WCEA-LP (Channel 58; BOSTON, MA; Owner: CHANNEL 19 TV CORPORATION)
- WHDN-LP (Channel 26; BOSTON, MA; Owner: GUENTER MARKSTEINER)
- WWDP (Channel 46; NORWELL, MA; Owner: NORWELL TELEVISION, LLC)
- WYCN-LP (Channel 13; NASHUA, NH; Owner: CENTER BROADCASTING CORP. OF NEW HAMPSHIRE)
- W33AK (Channel 33; NASHUA, NH; Owner: CENTER B/CING CORPORATION OF NEW HAMPSHIRE)
Medal of Honor Recipients
Medal of Honor Recipients born in Lowell: David H. McNerney, Edwin M. Truell, George Charette, James F. Sullivan, Joseph R. Ouellette.
- National Bridge Inventory (NBI) Statistics
- 82Number of bridges
- 1,148ft / 350mTotal length
- $259,241,000Total costs
- 1,941,524Total average daily traffic
- 116,432Total average daily truck traffic
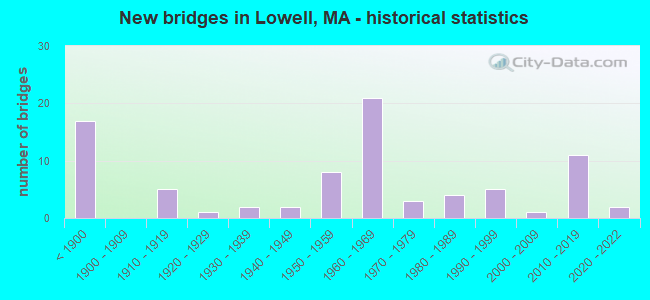
- New bridges - historical statistics
- 17Before 1900
- 51910-1919
- 11920-1929
- 21930-1939
- 21940-1949
- 81950-1959
- 211960-1969
- 31970-1979
- 41980-1989
- 51990-1999
- 12000-2009
- 112010-2019
- 22020-2022
FCC Registered Commercial Land Mobile Towers: 4 (See the full list of FCC Registered Commercial Land Mobile Towers in Lowell, MA)
FCC Registered Private Land Mobile Towers: 3 (See the full list of FCC Registered Private Land Mobile Towers)
FCC Registered Broadcast Land Mobile Towers: 52 (See the full list of FCC Registered Broadcast Land Mobile Towers)
FCC Registered Microwave Towers: 56 (See the full list of FCC Registered Microwave Towers in this town)
FCC Registered Paging Towers: 7 (See the full list of FCC Registered Paging Towers)
FCC Registered Amateur Radio Licenses: 190 (See the full list of FCC Registered Amateur Radio Licenses in Lowell)
FAA Registered Aircraft Manufacturers and Dealers: 1 (See the full list of FAA Registered Manufacturers and Dealers in Lowell)
FAA Registered Aircraft: 9 (See the full list of FAA Registered Aircraft)
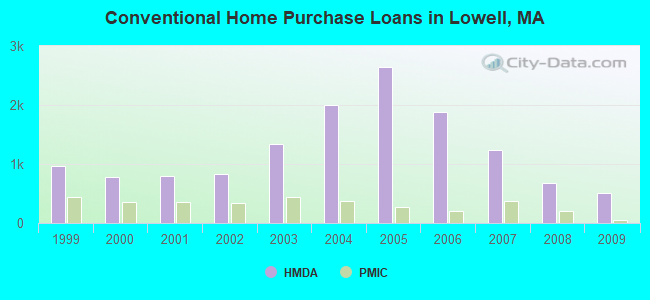
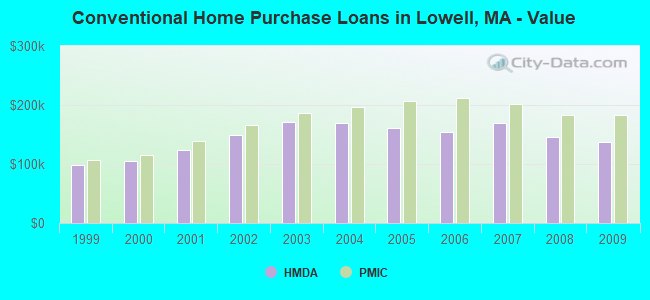
| Home Mortgage Disclosure Act Aggregated Statistics For Year 2009 (Based on 26 full tracts) | ||||||||||||||
| A) FHA, FSA/RHS & VA Home Purchase Loans | B) Conventional Home Purchase Loans | C) Refinancings | D) Home Improvement Loans | E) Loans on Dwellings For 5+ Families | F) Non-occupant Loans on < 5 Family Dwellings (A B C & D) | G) Loans On Manufactured Home Dwelling (A B C & D) | ||||||||
|---|---|---|---|---|---|---|---|---|---|---|---|---|---|---|
| Number | Average Value | Number | Average Value | Number | Average Value | Number | Average Value | Number | Average Value | Number | Average Value | Number | Average Value | |
| LOANS ORIGINATED | 338 | $186,269 | 511 | $136,973 | 1,171 | $188,512 | 142 | $91,782 | 15 | $420,667 | 161 | $145,143 | 1 | $100,000 |
| APPLICATIONS APPROVED, NOT ACCEPTED | 24 | $165,250 | 27 | $144,000 | 85 | $191,729 | 14 | $33,643 | 0 | $0 | 7 | $92,143 | 0 | $0 |
| APPLICATIONS DENIED | 77 | $177,779 | 125 | $128,536 | 558 | $192,987 | 90 | $70,344 | 4 | $272,500 | 77 | $129,857 | 4 | $39,000 |
| APPLICATIONS WITHDRAWN | 53 | $166,491 | 70 | $120,786 | 275 | $200,935 | 12 | $71,250 | 2 | $303,000 | 27 | $134,333 | 0 | $0 |
| FILES CLOSED FOR INCOMPLETENESS | 14 | $205,929 | 17 | $147,235 | 109 | $202,312 | 12 | $64,917 | 0 | $0 | 7 | $202,857 | 0 | $0 |
Detailed mortgage data for all 26 tracts in Lowell, MA
| Private Mortgage Insurance Companies Aggregated Statistics For Year 2009 (Based on 24 full tracts) | ||||||
| A) Conventional Home Purchase Loans | B) Refinancings | C) Non-occupant Loans on < 5 Family Dwellings (A & B) | ||||
|---|---|---|---|---|---|---|
| Number | Average Value | Number | Average Value | Number | Average Value | |
| LOANS ORIGINATED | 59 | $183,492 | 27 | $219,852 | 0 | $0 |
| APPLICATIONS APPROVED, NOT ACCEPTED | 23 | $170,391 | 17 | $224,000 | 2 | $101,000 |
| APPLICATIONS DENIED | 15 | $147,733 | 10 | $216,700 | 0 | $0 |
| APPLICATIONS WITHDRAWN | 2 | $171,000 | 2 | $234,000 | 0 | $0 |
| FILES CLOSED FOR INCOMPLETENESS | 1 | $189,000 | 1 | $237,000 | 0 | $0 |
2002 - 2018 National Fire Incident Reporting System (NFIRS) incidents
- Fire incident types reported to NFIRS in Lowell, MA
- 3,73863.3%Structure Fires
- 1,55626.4%Outside Fires
- 5088.6%Mobile Property/Vehicle Fires
- 1001.7%Other
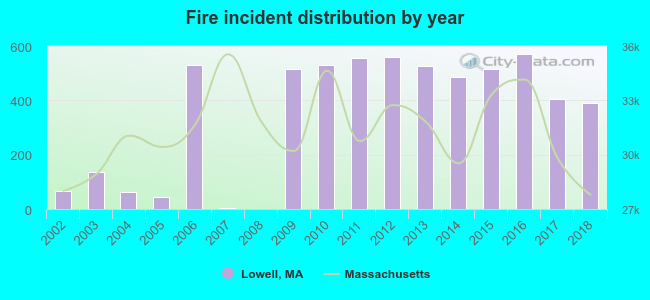 Based on the data from the years 2002 - 2018 the average number of fires per year is 347. The highest number of reported fire incidents - 570 took place in 2016, and the least - 0 in 2008. The data has an increasing trend.
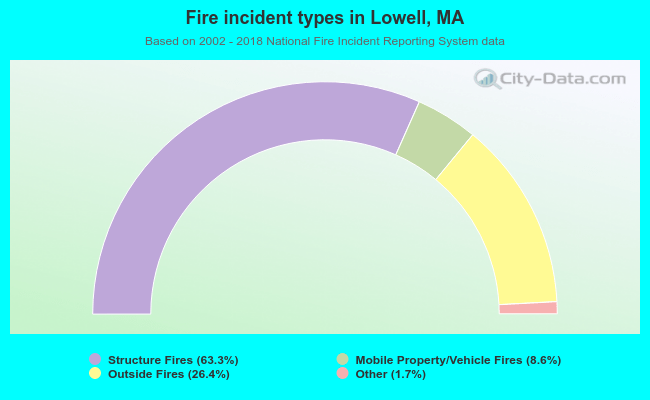 When looking into fire subcategories, the most incidents belonged to: Structure Fires (63.3%), and Outside Fires (26.4%).
| Most common first names in Lowell, MA among deceased individuals | ||
| Name | Count | Lived (average) |
|---|---|---|
| Mary | 1,482 | 80.6 years |
| John | 1,134 | 73.6 years |
| Joseph | 898 | 74.2 years |
| William | 667 | 73.0 years |
| James | 595 | 72.4 years |
| George | 586 | 74.0 years |
| Helen | 531 | 79.8 years |
| Margaret | 472 | 80.5 years |
| Alice | 435 | 81.1 years |
| Edward | 399 | 73.4 years |
| Most common last names in Lowell, MA among deceased individuals | ||
| Last name | Count | Lived (average) |
|---|---|---|
| Sullivan | 181 | 76.5 years |
| Silva | 156 | 73.9 years |
| Smith | 152 | 75.0 years |
| Murphy | 137 | 77.5 years |
| Martin | 95 | 77.0 years |
| Gagnon | 90 | 71.7 years |
| Brown | 87 | 76.0 years |
| Obrien | 85 | 79.1 years |
| Mccarthy | 77 | 75.8 years |
| Cote | 77 | 75.5 years |
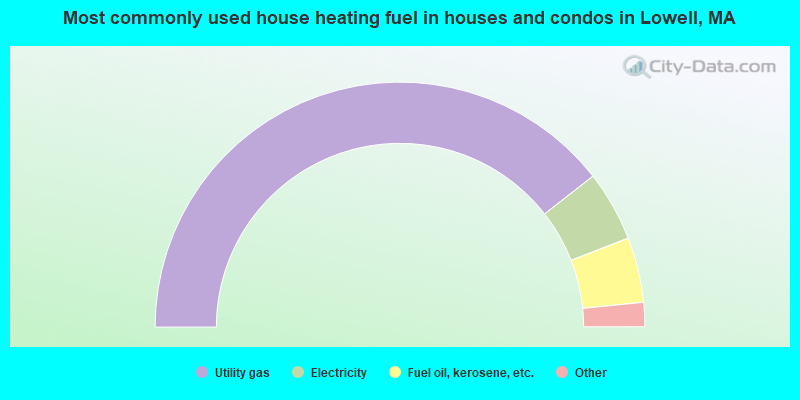
- 78.9%Utility gas
- 9.3%Electricity
- 8.6%Fuel oil, kerosene, etc.
- 2.0%Bottled, tank, or LP gas
- 0.6%Other fuel
- 0.3%Solar energy
- 0.2%Wood
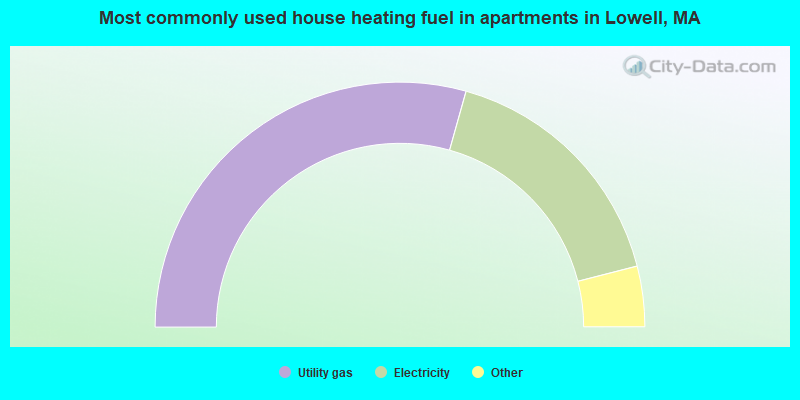
- 58.7%Utility gas
- 33.3%Electricity
- 3.0%Fuel oil, kerosene, etc.
- 2.8%Bottled, tank, or LP gas
- 1.3%No fuel used
- 0.4%Other fuel
- 0.3%Coal or coke
- 0.2%Wood
Lowell compared to Massachusetts state average:
- Unemployed percentage below state average.
- Median age below state average.
- Foreign-born population percentage above state average.
Lowell on our top lists:
- #2 on the list of "Top 101 cities with the most residents born in Cambodia (population 500+)"
- #16 on the list of "Top 101 cities with largest percentage of females in occupations: architecture and engineering occupations (population 50,000+)"
- #18 on the list of "Top 101 cities with largest percentage of females in industries: manufacturing (population 50,000+)"
- #18 on the list of "Top 101 cities with the highest average wind speeds (population 50,000+)"
- #20 on the list of "Top 101 cities with largest percentage of males in occupations: personal care and service occupations (population 50,000+)"
- #21 on the list of "Top 101 cities with the smallest racial income disparities between White and Black householders (with at least 2,000 householders)"
- #26 on the list of "Top 101 cities with largest percentage of females in occupations: production occupations (population 50,000+)"
- #30 on the list of "Top 101 cities with the lowest percentage of workers working at home, population 50,000+"
- #31 on the list of "Top 101 cities with largest percentage of females in industries: management of companies and enterprises (population 50,000+)"
- #39 on the list of "Top 101 cities with largest percentage of males in occupations: office and administrative support occupations (population 50,000+)"
- #40 on the list of "Top 101 cities with largest percentage of males in occupations: healthcare support occupations (population 50,000+)"
- #41 on the list of "Top 101 cities with the largest percentage of unmarried partner households (population 50,000+)"
- #50 on the list of "Top 101 cities with largest percentage of males in occupations: food preparation and serving related occupations (population 50,000+)"
- #55 on the list of "Top 101 cities with the largest city-data.com crime index decrease from 2011 to 2012 (population 50,000+)"
- #55 on the list of "Top 100 cities with old houses but young residents (pop. 50,000+)"
- #60 on the list of "Top 101 cities with the lowest number of murders per 100,000 residents (population 50,000+)"
- #61 on the list of "Top 101 cities with the smallest differences between morning and afternoon humidity (population 50,000+)"
- #61 on the list of "Top 101 cities with the smallest humidity differences during a year (population 50,000+)"
- #61 on the list of "Top 100 cities with oldest houses (pop. 50,000+)"
- #61 on the list of "Top 101 cities with the most users submitting photos to our site per 10,000 residents (population 50,000+)"
- #57 (01854) on the list of "Top 101 zip codes with the largest percentage of Greek first ancestries (pop 5,000+)"
- #4 on the list of "Top 101 counties with the most Orthodox adherents"
- #7 on the list of "Top 101 counties with the most Catholic adherents"
- #7 on the list of "Top 101 counties with the most Mainline Protestant congregations"
- #7 on the list of "Top 101 counties with the most Orthodox congregations"
- #8 on the list of "Top 101 counties with the lowest percentage of residents that keep firearms around their homes"

|
|
Total of 857 patent applications in 2008-2024.