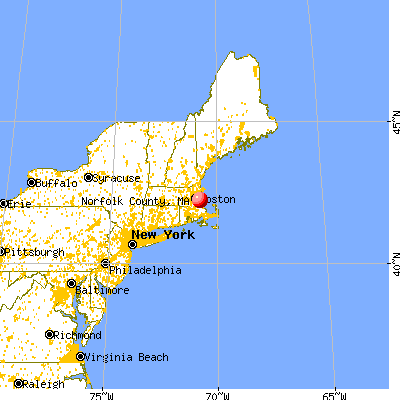
Norfolk County, Massachusetts (MA)
County owner-occupied free and clear houses and condos in 2010: 45,807
County owner-occupied houses and condos in 2000: 173,413
Renter-occupied apartments: 79,545 (it was 75,414 in 2000)
| % of renters here: | 30% |
| State: | 38% |
Land area: 400 sq. mi.
Water area: 44.4 sq. mi.
Population density: 1816 people per square mile (very high).
Industries providing employment: Educational, health and social services (29.2%), Professional, scientific, management, administrative, and waste management services (16.6%), Finance, insurance, real estate, and rental and leasing (10.4%).
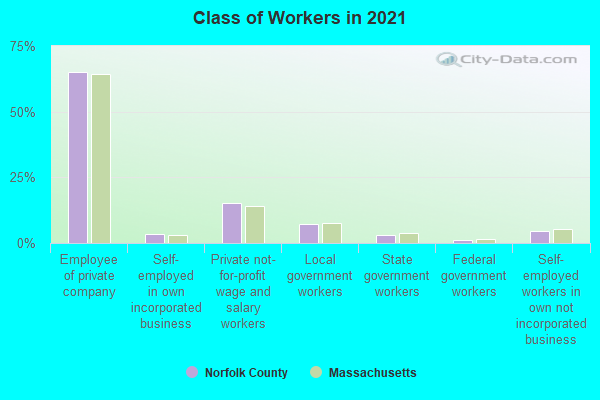
Type of workers:
- Private wage or salary: 83%
- Government: 12%
- Self-employed, not incorporated: 5%
- Unpaid family work: 0%
- OSM Map
- General Map
- Google Map
- MSN Map


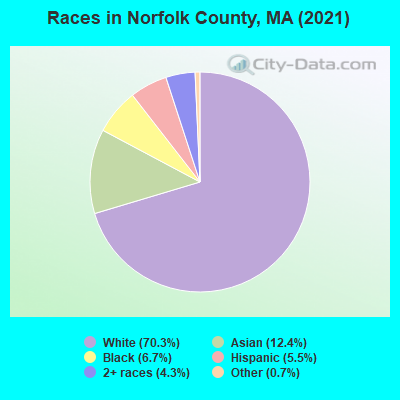
- 499,08568.8%White Non-Hispanic Alone
- 88,50412.2%Asian alone
- 50,1916.9%Black Non-Hispanic Alone
- 41,2785.7%Hispanic or Latino
- 35,9205.0%Two or more races
- 9,9321.4%Some other race alone
- 6210.09%American Indian and Alaska Native alone
| Median resident age: | 40.9 years |
| Massachusetts median age: | 40.3 years |
| Males: 351,809 | |
| Females: 373,722 |

 | 2023 Real Estate Observations (5278 replies) |
| How About Those Patriots? (1129 replies) |
| Population slightly down in MA 2022 (362 replies) |
| 2021 Real Estate Observations (1729 replies) |
| Wow, $206K over list! (236 replies) |
| MA residents are leaving the state (65 replies) |
| Norfolk County: | 2.0 people |
| Massachusetts: | 2 people |
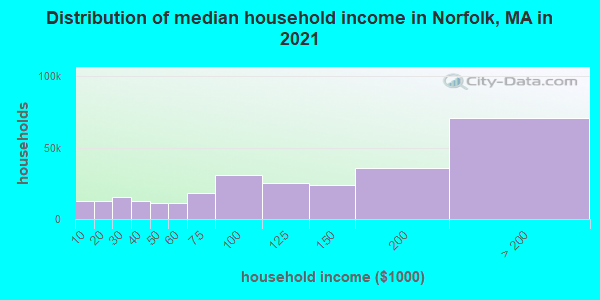
Estimated median household income in 2022: $115,969 ($63,432 in 1999)
| This county: | $115,969 |
| Massachusetts: | $94,488 |
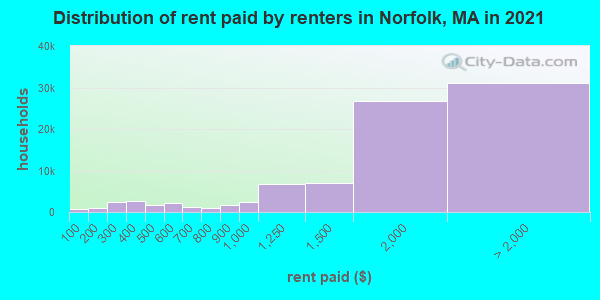
Median contract rent in 2022 for apartments: $1,841 (lower quartile is $1,262, upper quartile is $2,436)
| This county: | $1841 |
| State: | $1446 |
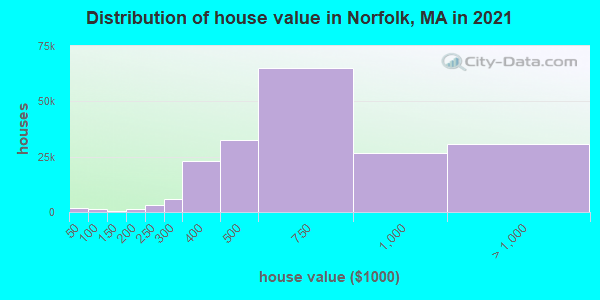
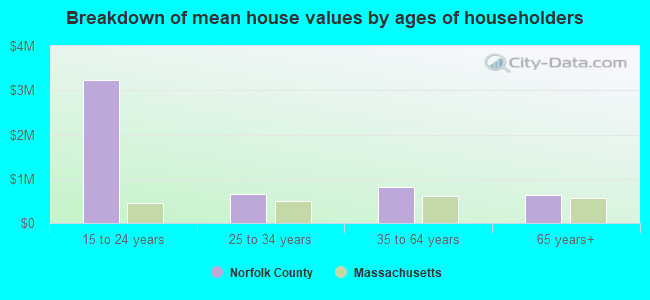
Estimated median house or condo value in 2022: $651,000 (it was $226,700 in 2000)
| Norfolk: | $651,000 |
| Massachusetts: | $534,700 |
Mean price in 2022:
Median monthly housing costs for homes and condos with a mortgage: $2,935Detached houses: $851,375
Here: $851,375 State: $651,570 Townhouses or other attached units: $650,242
Here: $650,242 State: $617,749 In 2-unit structures: $825,093
Here: $825,093 State: $594,808 In 3-to-4-unit structures: $853,292
Here: $853,292 State: $601,912 In 5-or-more-unit structures: $584,259
Here: $584,259 State: $555,768 Mobile homes: $91,001
Here: $91,001 State: $170,209
Median monthly housing costs for units without a mortgage: $1,112
Institutionalized population: 8,991
Health of residents in Norfolk County based on CDC Behavioral Risk Factor Surveillance System Survey Questionnaires from 2003 to 2012:
General health status score of residents in this county from 1 (poor) to 5 (excellent) is 3.7. This is significantly better than average.78.1% of residents exercised in the past month. This is about average.
46.5% of residents smoked 100+ cigarettes in their lives. This is about average.
79.2% of adult residents drank alcohol in the past 30 days. This is about average.
81.8% of residents visited a dentist within the past year. This is more than average.
Average weight of males is 190 pounds. This is about average.
Average weight of females is 155 pounds. This is less than average.
8.5% of residents keep firearms around their homes. This is less than average.
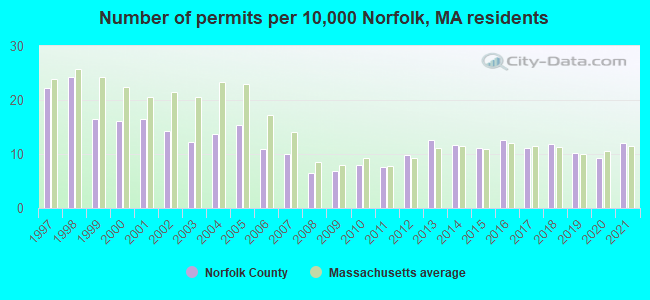
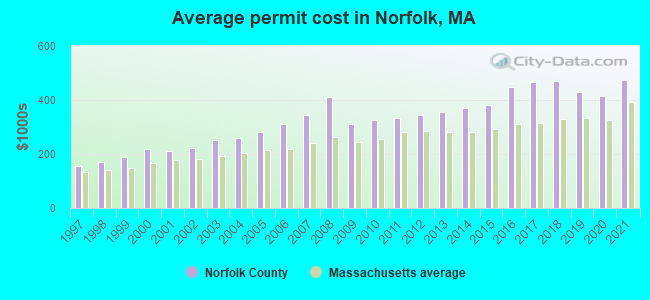
Single-family new house construction building permits:
- 2022: 653 buildings, average cost: $510,600
- 2021: 784 buildings, average cost: $475,000
- 2020: 607 buildings, average cost: $415,200
- 2019: 658 buildings, average cost: $427,600
- 2018: 774 buildings, average cost: $472,100
- 2017: 723 buildings, average cost: $464,500
- 2016: 818 buildings, average cost: $447,100
- 2015: 719 buildings, average cost: $382,800
- 2014: 758 buildings, average cost: $371,100
- 2013: 815 buildings, average cost: $354,100
- 2012: 639 buildings, average cost: $345,500
- 2011: 494 buildings, average cost: $335,400
- 2010: 519 buildings, average cost: $324,800
- 2009: 441 buildings, average cost: $311,400
- 2008: 423 buildings, average cost: $410,300
- 2007: 653 buildings, average cost: $345,500
- 2006: 707 buildings, average cost: $311,200
- 2005: 1005 buildings, average cost: $281,100
- 2004: 892 buildings, average cost: $258,400
- 2003: 793 buildings, average cost: $251,400
- 2002: 926 buildings, average cost: $223,000
- 2001: 1077 buildings, average cost: $211,900
- 2000: 1049 buildings, average cost: $220,100
- 1999: 1077 buildings, average cost: $189,700
- 1998: 1576 buildings, average cost: $171,800
- 1997: 1443 buildings, average cost: $154,500
Median real estate property taxes paid for housing units with mortgages in 2022: $6,797 (1.0%)
Median real estate property taxes paid for housing units with no mortgage in 2022: $6,777 (1.1%)
| Norfolk County: | 6.5% |
| Massachusetts: | 10.4% |
Median age of residents in 2022: 40.9 years old
(Males: 39.9 years old, Females: 42.0 years old)
(Median age for: White residents: 45.2 years old, Black residents: 33.9 years old, American Indian residents: 36.4 years old, Asian residents: 38.4 years old, Hispanic or Latino residents: 31.6 years old, Other race residents: 34.2 years old)
Area name: Brockton, MA HUD Metro FMR Area
Fair market rent in 2006 for a 1-bedroom apartment in Norfolk County is $876 a month.
Fair market rent for a 2-bedroom apartment is $1103 a month.
Fair market rent for a 3-bedroom apartment is $1319 a month.
Cities in this county include: Quincy, Brookline, Weymouth, Weymouth Town, Braintree Town, Braintree, Franklin Town, Randolph, Franklin, Needham.
2023 air pollution in Norfolk County:
Nitrogen Dioxide: 0.00 ppm (standard limit: 0.053 ppm). Below U.S. average.
Ozone (1-hour): 0.036 ppm (standard limit: 0.12 ppm). Near U.S. average.
Particulate Matter (PM2.5) Annual: 6.9 µg/m3(standard limit: 15.0 µg/m3). Near U.S. average.
Notable locations in this county outside city limits:
Notable locations in Norfolk County: Blandford Ski Area (A), East Longmeadow Industrial Park (B), Golden Acres Campground (C), Hampden Country Club (D), Quaboag Valley Golf Course (E), Sodom Mountain Campground (F), Southwick Country Club (G), Westover Industrial Park (H), Echo Hill Orchards (I), Mountain Orchards (J), Rice Fruit Farm (K), West Parish Orchards (L), Appalachian Mountain Club (M), Barber Camp (N), Wilbraham Country Club (O), Ludlow Country Club (P), East Longmeadow Rod and Gun Club (Q), Garden Plaza (R), Heritage Park Plaza (S), Ludlow Shopping Plaza (T). Display/hide their locations on the map
Shopping Centers: Garden Plaza Shopping Center (1), Hampden Mini-Mall Shopping Center (2), Heritage Park Plaza Shopping Center (3), Ludlow Plaza Shopping Center (4), Southwick Plaza Shopping Center (5), Stony Hill Plaza Shopping Center (6), The Shops at Gillett Corners Shopping Center (7), Dunbar Shopping Center (8), North Main Shopping Center (9). Display/hide their locations on the map
Churches in Norfolk County include: Westfield Evangelical Free Church (A), Wales Baptist Church (B), United Church of Christ (C), Union Church of Christ (D), Southwick Assembly of God Church (E), Saint Peter and Paul Ukranian Catholic Church (F), Saint Pauls United Methodist Church (G), Saint Pauls Church (H), Saint Marys Church (I). Display/hide their locations on the map
Cemeteries: South Quarter Cemetery (1), Tolland Cemetery (2), North Blanford Cemetery (3), North Blandford Cemetery (4), Pine Hill Cemetery (5), Webster Cemetery (6), Moulton Hill Cemetery (7). Display/hide their locations on the map
Lakes, reservoirs, and swamps: Red Stone Lake (A), Congamond Lakes (B), South Pond (C), Shatterack Pond (D), North Pond (E), Middle Pond (F), Goose Pond (G), Round Hill Pond (H). Display/hide their locations on the map
Streams, rivers, and creeks: Big Brook (A), Broad Brook (B), Cadwell Brook (C), Calkins Brook (D), Harris Brook (E), Higher Brook (F), Maxwell Brook (G), Spear Brook (H), Temple Brook (I). Display/hide their locations on the map
Parks in Norfolk County include: Gerrish Park (1), Hampden Memorial Recreational Park (2), Heritage Park (3), Chester Wildlife Management Area (4), Laughing Brook Wildlife Sanctuary (5), Leahy Field (6), Ludlow Center Historic District (7), Red Bridge State Park (8), Wilbraham Wildlife Area (9). Display/hide their locations on the map
Beach: Babbs Beach (A). Display/hide its location on the map
Neighboring counties: Hartford County, Connecticut  , Middlesex County
  , Burt County, Nebraska
  , Cass County, Michigan , Dixon County, Nebraska , Grundy County, Iowa .
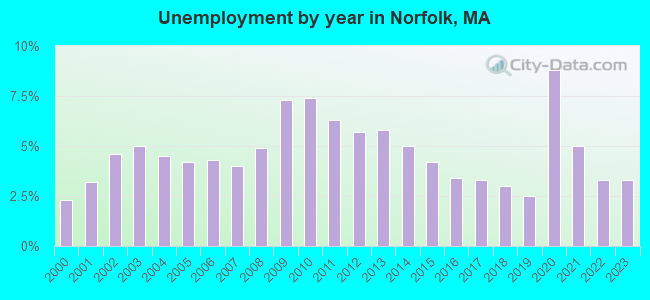
| Here: | 3.1% |
| Massachusetts: | 3.5% |
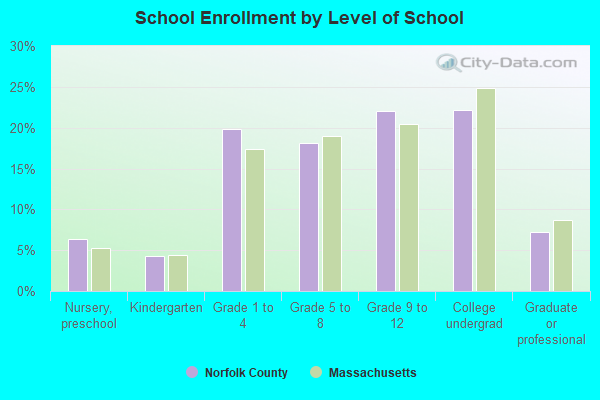
Current college students: 42,232
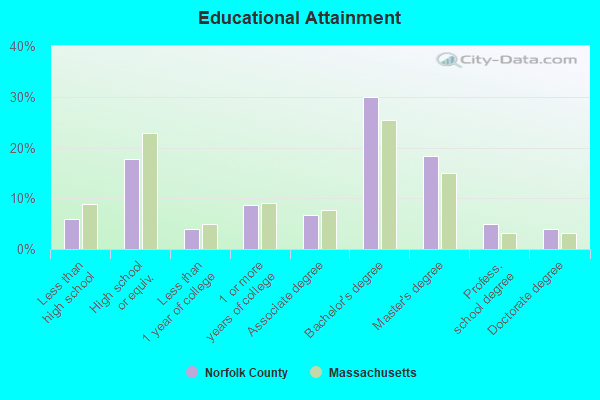
People 25 years of age or older with a high school degree or higher: 93.9%
People 25 years of age or older with a bachelor's degree or higher: 57.0%
Number of foreign born residents: 143,602 (59.7% naturalized citizens)
| Norfolk County: | 19.8% |
| Whole state: | 18.0% |
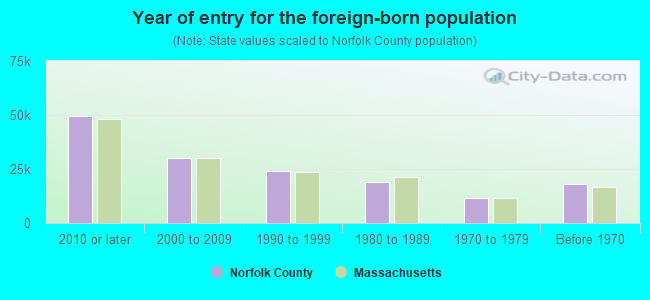
- Year of entry for the foreign-born population
- 53,3712010 or later
- 29,0302000 to 2009
- 24,4221990 to 1999
- 18,7691980 to 1989
- 11,8041970 to 1979
- 17,889Before 1970
Mean travel time to work (commute): minutes
Percentage of county residents living and working in this county: 97.8%
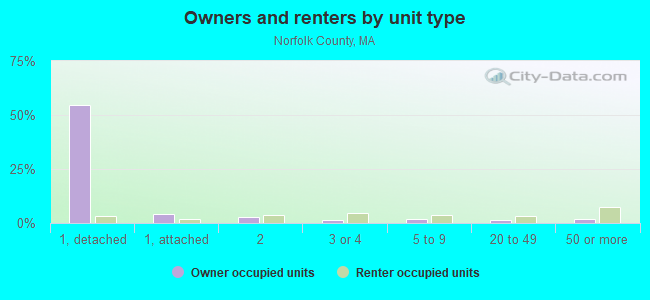
Housing units in structures:
- One, detached: 167,240
- One, attached: 15,832
- Two: 19,079
- 3 or 4: 16,185
- 5 to 9: 16,279
- 10 to 19: 11,858
- 20 to 49: 16,889
- 50 or more: 30,920
- Mobile homes: 1,360
- Boats, RVs, vans, etc.: 86
Housing units in Norfolk County with a mortgage: 129,031 (20,947 second mortgage, 671 home equity loan, 18,093 both second mortgage and home equity loan)
Houses without a mortgage: 4,614
| Here: | 97.0% with mortgage |
| State: | 96.2% with mortgage |
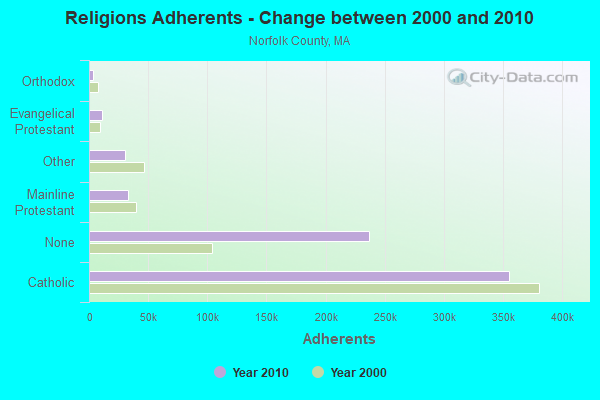
Religion statistics for Norfolk County
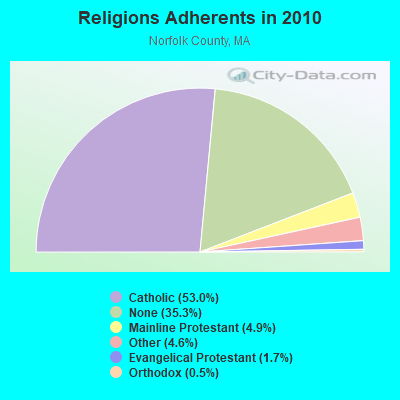
| Religion | Adherents | Congregations |
|---|---|---|
| Catholic | 355,321 | 52 |
| Mainline Protestant | 33,086 | 115 |
| Other | 30,593 | 75 |
| Evangelical Protestant | 11,323 | 89 |
| Orthodox | 3,539 | 9 |
| None | 236,988 | - |
Source: Clifford Grammich, Kirk Hadaway, Richard Houseal, Dale E.Jones, Alexei Krindatch, Richie Stanley and Richard H.Taylor. 2012. 2010 U.S.Religion Census: Religious Congregations & Membership Study. Association of Statisticians of American Religious Bodies. Jones, Dale E., et al. 2002. Congregations and Membership in the United States 2000. Nashville, TN: Glenmary Research Center.
Food Environment Statistics:
| Norfolk County: | 1.65 / 10,000 pop. |
| State: | 1.98 / 10,000 pop. |
| Here: | 0.09 / 10,000 pop. |
| Massachusetts: | 0.05 / 10,000 pop. |
| This county: | 2.04 / 10,000 pop. |
| Massachusetts: | 2.22 / 10,000 pop. |
| Norfolk County: | 1.57 / 10,000 pop. |
| Massachusetts: | 1.77 / 10,000 pop. |
| This county: | 8.48 / 10,000 pop. |
| State: | 8.76 / 10,000 pop. |
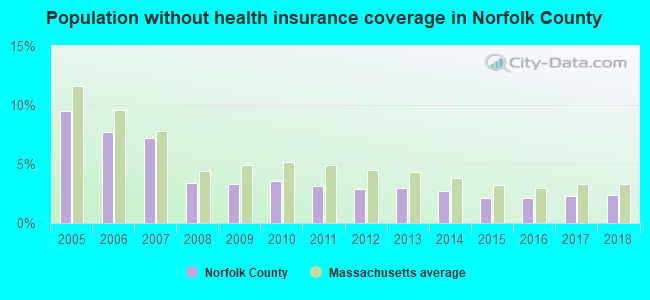
| Norfolk County: | 7.1% |
| Massachusetts: | 8.1% |
| Norfolk County: | 19.1% |
| State: | 22.5% |
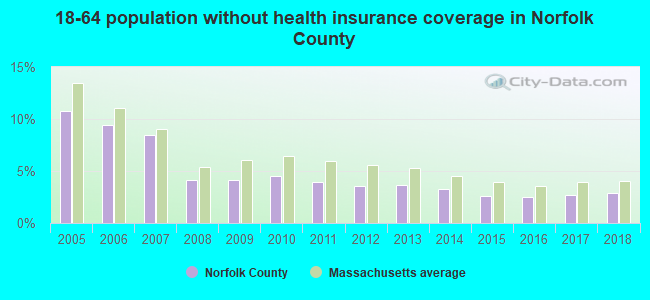
| Here: | 12.9% |
| State: | 16.5% |
Agriculture in Norfolk County:
Average size of farms: 61 acresAverage value of agricultural products sold per farm: $54,357
Average value of crops sold per acre for harvested cropland: $4381.74
The value of nursery, greenhouse, floriculture, and sod as a percentage of the total market value of agricultural products sold: 76.15%
The value of livestock, poultry, and their products as a percentage of the total market value of agricultural products sold: 6.87%
Average total farm production expenses per farm: $54,491
Harvested cropland as a percentage of land in farms: 19.00%
Average market value of all machinery and equipment per farm: $44,484
The percentage of farms operated by a family or individual: 77.40%
Average age of principal farm operators: 55 years
Average number of cattle and calves per 100 acres of all land in farms: 5.84
Milk cows as a percentage of all cattle and calves: 20.19%
Vegetables: 605 harvested acres
Land in orchards: 66 acres
Tornado activity:
Norfolk County historical area-adjusted tornado activity is significantly below Massachusetts state average. It is 3140449.0 times below overall U.S. average.Tornadoes in this county have caused one injury recorded between 1950 and 2004.
On 8/10/1979, a category 1 (max. wind speeds 73-112 mph) tornado injured one person and caused between $5000 and $50,000 in damages.
Earthquake activity:
Norfolk County-area historical earthquake activity is significantly above Massachusetts state average. It is 73% smaller than the overall U.S. average.On 10/7/1983 at 10:18:46, a magnitude 5.3 (5.1 MB, 5.3 LG, 5.1 ML, Class: Moderate, Intensity: VI - VII) earthquake occurred 201.6 miles away from Norfolk County center
On 4/20/2002 at 10:50:47, a magnitude 5.3 (5.3 ML, Depth: 3.0 mi) earthquake occurred 204.8 miles away from the county center
On 1/19/1982 at 00:14:42, a magnitude 4.7 (4.5 MB, 4.7 MD, 4.5 LG, Class: Light, Intensity: IV - V) earthquake occurred 92.8 miles away from the county center
On 10/16/2012 at 23:12:25, a magnitude 4.7 (4.7 ML, Depth: 10.0 mi) earthquake occurred 100.0 miles away from the county center
On 4/20/2002 at 10:50:47, a magnitude 5.2 (5.2 MB, 4.2 MS, 5.2 MW, 5.0 MW) earthquake occurred 204.1 miles away from Norfolk County center
On 8/22/1992 at 12:20:32, a magnitude 4.8 (4.8 MB, 3.8 MS, 4.7 LG, Depth: 6.2 mi) earthquake occurred 218.4 miles away from the county center
Magnitude types: regional Lg-wave magnitude (LG), body-wave magnitude (MB), duration magnitude (MD), local magnitude (ML), surface-wave magnitude (MS), moment magnitude (MW)
Most recent natural disasters:
- Massachusetts Severe Winter Storm, Snowstorm, and Flooding, Incident Period: January 26, 2015 to January 29, 2015, Major Disaster (Presidential) Declared DR-4214: April 13, 2015, FEMA Id: 4214, Natural disaster type: Snowstorm, Winter Storm, Flood
- Massachusetts Explosions, Incident Period: April 15, 2013 to April 22, 2013, Emergency Declared EM-3362: April 17, 2013, FEMA Id: 3362, Natural disaster type: Explosion
- Massachusetts Severe Winter Storm, Snowstorm, and Flooding, Incident Period: February 08, 2013 to February 10, 2013, Major Disaster (Presidential) Declared DR-4110: April 19, 2013, FEMA Id: 4110, Natural disaster type: Snowstorm, Winter Storm, Flood
- Massachusetts Hurricane Sandy, Incident Period: October 27, 2012 to November 08, 2012, Emergency Declared EM-3350: October 28, 2012, FEMA Id: 3350, Natural disaster type: Hurricane
- Massachusetts Severe Storm, Incident Period: October 29, 2011 to October 30, 2011, Emergency Declared EM-3343: November 01, 2011, FEMA Id: 3343, Natural disaster type: Storm
- Massachusetts Tropical Storm Irene, Incident Period: August 27, 2011 to August 29, 2011, Major Disaster (Presidential) Declared DR-4028: September 03, 2011, FEMA Id: 4028, Natural disaster type: Tropical Storm
- Massachusetts Hurricane Irene, Incident Period: August 26, 2011 to September 05, 2011, Emergency Declared EM-3330: August 26, 2011, FEMA Id: 3330, Natural disaster type: Hurricane
- Massachusetts Severe Winter Storm and Snowstorm, Incident Period: January 11, 2011 to January 12, 2011, Major Disaster (Presidential) Declared DR-1959: March 07, 2011, FEMA Id: 1959, Natural disaster type: Snowstorm, Winter Storm
- Massachusetts Hurricane Earl, Incident Period: September 01, 2010 to September 04, 2010, Emergency Declared EM-3315: September 02, 2010, FEMA Id: 3315, Natural disaster type: Hurricane
- Massachusetts Water Main Break, Incident Period: May 01, 2010 to May 05, 2010, Emergency Declared EM-3312: May 03, 2010, FEMA Id: 3312, Natural disaster type: Water Main Break
- 21 other natural disasters have been reported since 1953.
The number of natural disasters in Norfolk County (31) is a lot greater than the US average (15).
Major Disasters (Presidential) Declared: 18
Emergencies Declared: 13
Causes of natural disasters: Floods: 12, Storms: 10, Hurricanes: 6, Snowstorms: 5, Snows: 3, Winter Storms: 3, Blizzards: 2, Explosion: 1, Heavy Rain: 1, Snowfall: 1, Tropical Storm: 1, Water Main Break: 1, Wind: 1 (Note: some incidents may be assigned to more than one category).
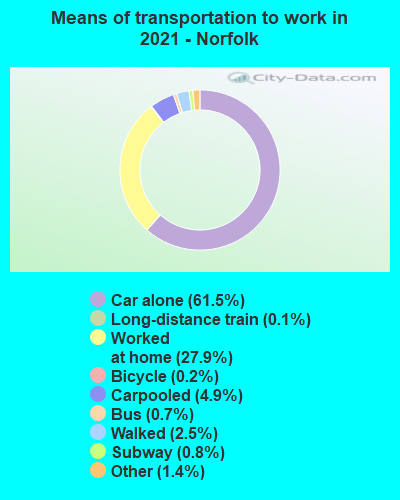
Means of transportation to work:
- Drove a car alone: 245,520 (64.6%)
- Carpooled: 22,877 (6.0%)
- Bus: 3,361 (0.9%)
- Subway or elevated rail: 4,776 (1.3%)
- Long-distance train or commuter rail: 1,064 (0.3%)
- Light rail, streetcar or trolley: 146 (0.0%)
- Ferryboat: 158 (0.0%)
- Taxicab, motorcycle, or other means: 5,245 (1.4%)
- Bicycle: 716 (0.2%)
- Walked: 9,601 (2.5%)
- Worked at home: 86,600 (22.8%)
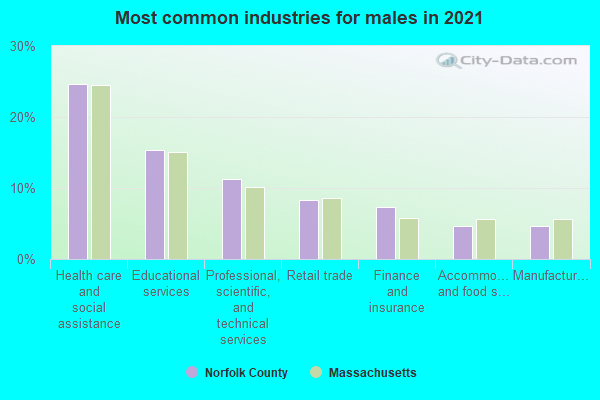
- Health care and social assistance (25%)
- Educational services (16%)
- Professional, scientific, and technical services (12%)
- Retail trade (9%)
- Finance and insurance (7%)
- Accommodation and food services (6%)
- Other services, except public administration (5%)
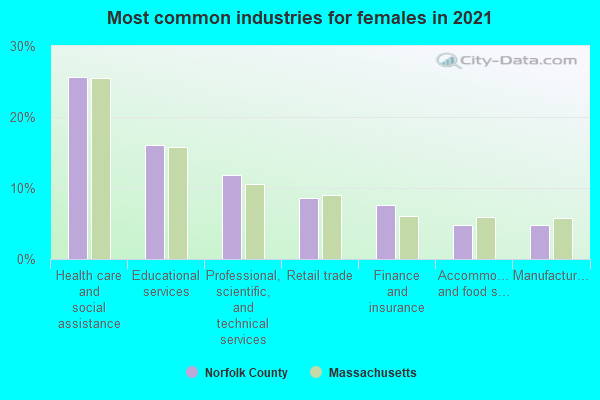
- Health care and social assistance (26%)
- Educational services (16%)
- Professional, scientific, and technical services (12%)
- Retail trade (9%)
- Finance and insurance (7%)
- Accommodation and food services (6%)
- Other services, except public administration (5%)
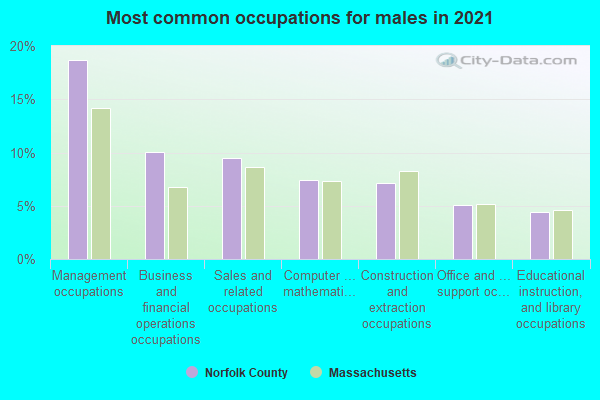
- Management occupations (16%)
- Sales and related occupations (10%)
- Business and financial operations occupations (9%)
- Computer and mathematical occupations (8%)
- Construction and extraction occupations (7%)
- Office and administrative support occupations (5%)
- Educational instruction, and library occupations (4%)
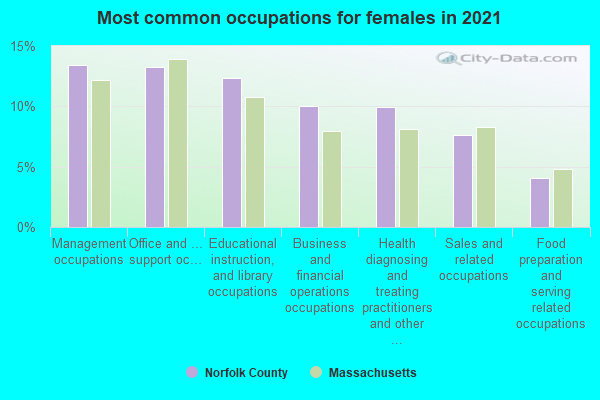
- Office and administrative support occupations (13%)
- Management occupations (12%)
- Educational instruction, and library occupations (12%)
- Health diagnosing and treating practitioners and other technical occupations (10%)
- Business and financial operations occupations (9%)
- Sales and related occupations (9%)
- Food preparation and serving related occupations (5%)
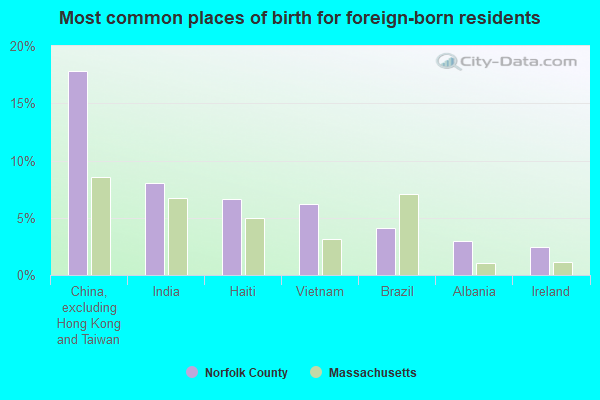
- China, excluding Hong Kong and Taiwan (16%)
- India (8%)
- Haiti (7%)
- Vietnam (6%)
- Brazil (5%)
- Russia (2%)
- Israel (2%)
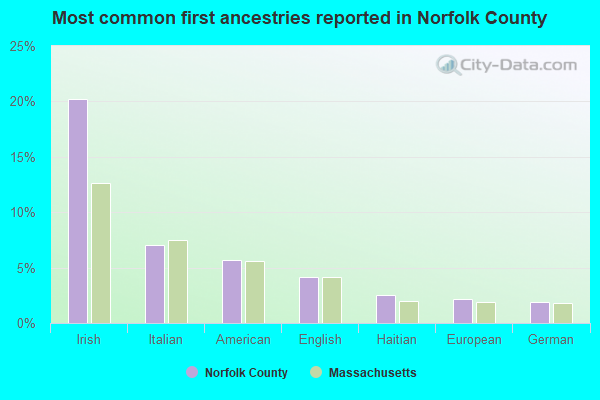
- Irish (19%)
- Italian (7%)
- American (5%)
- English (4%)
- Haitian (2%)
- German (2%)
- European (2%)
People in group quarters in Norfolk County, Massachusetts in 2010:
- 7,451 people in college/university student housing
- 4,971 people in nursing facilities/skilled-nursing facilities
- 2,816 people in state prisons
- 610 people in local jails and other municipal confinement facilities
- 316 people in other noninstitutional facilities
- 304 people in emergency and transitional shelters (with sleeping facilities) for people experiencing homelessness
- 283 people in group homes intended for adults
- 200 people in workers' group living quarters and job corps centers
- 186 people in correctional residential facilities
- 133 people in residential schools for people with disabilities
- 119 people in residential treatment centers for juveniles (non-correctional)
- 75 people in mental (psychiatric) hospitals and psychiatric units in other hospitals
- 66 people in residential treatment centers for adults
- 43 people in group homes for juveniles (non-correctional)
- 25 people in hospitals with patients who have no usual home elsewhere
- 10 people in correctional facilities intended for juveniles
- 3 people in in-patient hospice facilities
People in group quarters in Norfolk County, Massachusetts in 2000:
- 5,963 people in college dormitories (includes college quarters off campus)
- 5,859 people in nursing homes
- 2,436 people in state prisons
- 617 people in local jails and other confinement facilities (including police lockups)
- 380 people in other noninstitutional group quarters
- 348 people in schools, hospitals, or wards for the intellectually disabled
- 271 people in homes for the mentally retarded
- 257 people in mental (psychiatric) hospitals or wards
- 172 people in religious group quarters
- 161 people in orthopedic wards and institutions for the physically handicapped
- 160 people in other types of correctional institutions
- 160 people in hospitals or wards for drug/alcohol abuse
- 137 people in hospitals/wards and hospices for chronically ill
- 131 people in other hospitals or wards for chronically ill
- 102 people in homes or halfway houses for drug/alcohol abuse
- 102 people in other nonhousehold living situations
- 97 people in other group homes
- 54 people in homes for the mentally ill
- 46 people in homes for the physically handicapped
- 40 people in training schools for juvenile delinquents
- 27 people in unknown juvenile institutions
- 17 people in institutions for the blind
- 10 people in homes for abused, dependent, and neglected children
- 9 people in residential treatment centers for emotionally disturbed children
- 6 people in hospices or homes for chronically ill
- 5 people in agriculture workers' dormitories on farms
- 2 people in other workers' dormitories
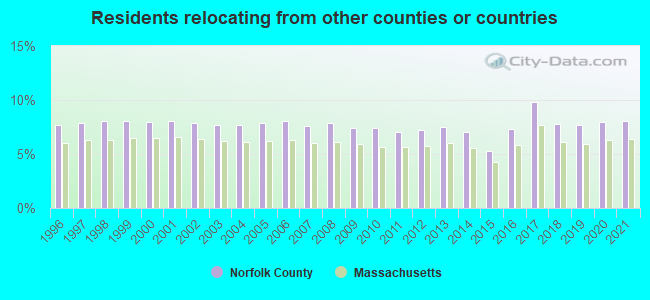
8.01% of this county's 2021 resident taxpayers lived in other counties in 2020 ($110,572 average adjusted gross income)
| Here: | 8.01% |
| Massachusetts average: | 6.35% |
0.01% of residents moved from foreign countries ($78 average AGI)
Norfolk County: 0.01% Massachusetts average: 0.01%
5.76% relocated from other counties in Massachusetts ($77,041 average AGI)
2.25% relocated from other states ($33,453 average AGI)
Norfolk County: 2.25% Massachusetts average: 2.58%
Top counties from which taxpayers relocated into this county between 2020 and 2021:
| from Suffolk County, MA | |
| from Middlesex County, MA | |
| from Plymouth County, MA | |
| from Bristol County, MA | |
| from Worcester County, MA | |
| from Providence County, RI | |
| from Essex County, MA |
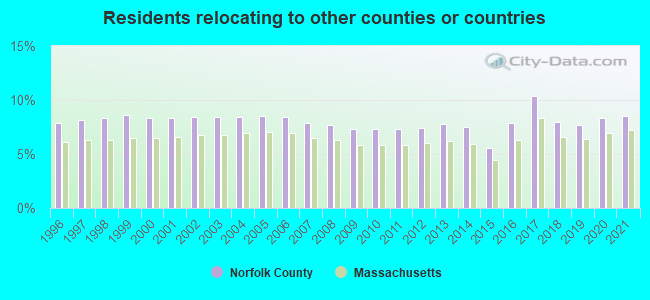
8.55% of this county's 2020 resident taxpayers moved to other counties in 2021 ($128,358 average adjusted gross income)
| Here: | 8.55% |
| Massachusetts average: | 7.18% |
0.01% of residents moved to foreign countries ($348 average AGI)
Norfolk County: 0.01% Massachusetts average: 0.02%
5.48% relocated to other counties in Massachusetts ($74,311 average AGI)
3.06% relocated to other states ($53,699 average AGI)
Norfolk County: 3.06% Massachusetts average: 3.43%
Top counties to which taxpayers relocated from this county between 2020 and 2021:
| to Suffolk County, MA | |
| to Middlesex County, MA | |
| to Plymouth County, MA | |
| to Bristol County, MA | |
| to Worcester County, MA | |
| to Barnstable County, MA | |
| to Providence County, RI |
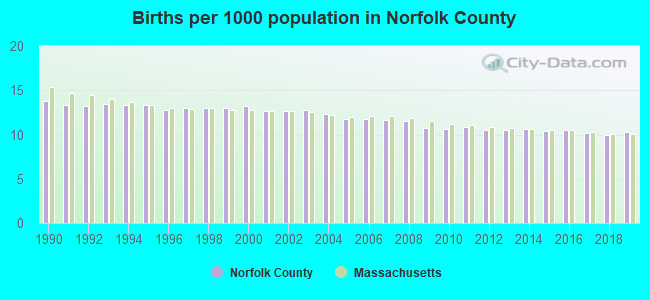
Births per 1000 population from 1990 to 1999: 13.2
Births per 1000 population from 2000 to 2009: 12.1
Births per 1000 population from 2010 to 2022: 8.8
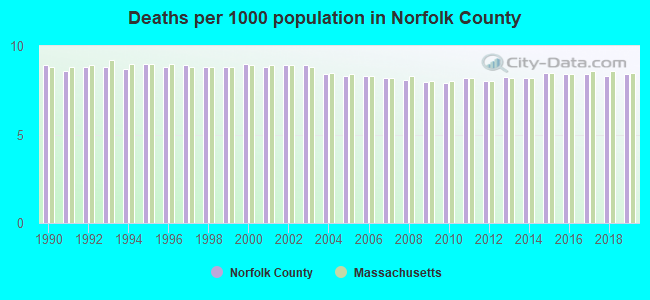
Deaths per 1000 population from 1990 to 1999: 8.8
Deaths per 1000 population from 2000 to 2009: 8.5
Deaths per 1000 population from 2010 to 2020: 8.4
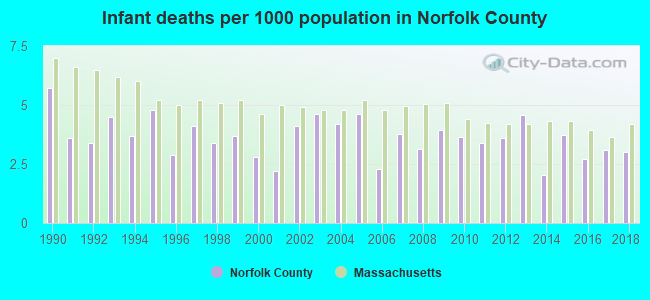
Infant deaths per 1000 live births from 1990 to 1999: 4.0
Infant deaths per 1000 live births from 2000 to 2009: 3.6
Infant deaths per 1000 live births from 2010 to 2021: 3.3
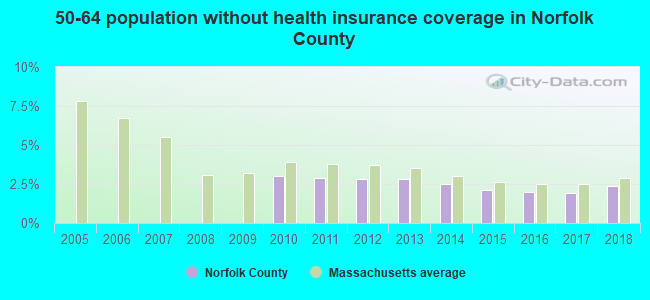
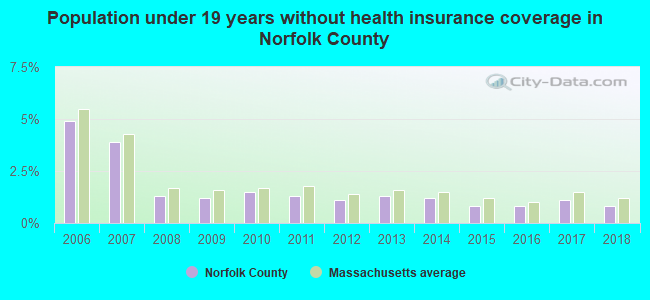
Persons under 19 years old without health insurance coverage in 2018: 0.8%

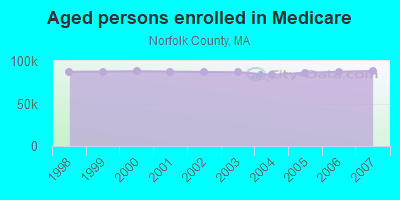
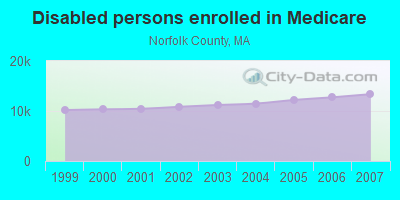
Persons enrolled in hospital insurance and/or supplemental medical insurance (Medicare) in July 1, 2007: 101,640 (88,270 aged, 13,370 disabled)
Children under 18 without health insurance coverage in 2007: 5,106 (3%)

Most common underlying causes of death in Norfolk County, Massachusetts in 1999 - 2019:
- Atherosclerotic heart disease (8,392)
- Bronchus or lung, unspecified - Malignant neoplasms (7,680)
- Unspecified dementia (7,453)
- Acute myocardial infarction, unspecified (5,209)
- Chronic obstructive pulmonary disease, unspecified (3,957)
- Congestive heart failure (3,473)
- Alzheimer disease, unspecified (3,414)
- Pneumonia, unspecified (3,147)
- Stroke, not specified as haemorrhage or infarction (2,840)
- Atherosclerotic cardiovascular disease, so described (2,303)
Population without health insurance coverage in 2000: 6%
Children under 18 without health insurance coverage in 2000: 4%
Short term general hospital admissions per 100,000 population in 2004: 6,926
Short term general hospital beds per 100,000 population in 2004: 116
Emergency room visits per 100,000 population in 2004: 26,765
General practice office based MDs per 100,000 population in 2005: 1,209
Medical specialist MDs per 100,000 population in 2005: 880
Dentists per 100,000 population in 1998: 19
Total births per 100,000 population, July 2005 - July 2006 : 88
Total deaths per 100,000 population, July 2005 - July 2006: 92
Limited-service eating places per 100,000 population in 2005 : 16
Beer, wine & liquor stores per 100,000 population in 2005: 1
Fitness & recreation sports centers per 100,000 population in 2005: 2,227
Homicides per 1,000,000 population from 2000 to 2006: 9.6. This is less than state average.
Suicides per 1,000,000 population from 2000 to 2006: 65.5. This is less than state average.
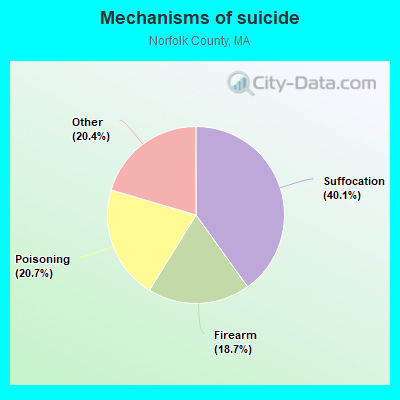
- Suffocation - 26.3
- Poisoning - 13.6
- Firearm - 12.3
- Other - 13.4
Household type by relationship:
Households: 725,531- Male householders: 133,912 (30,035 living alone), Female householders: 147,927 (48,007 living alone)
144,017 spouses (142,175 opposite-sex spouses), 18,547 unmarried partners, (17,824 opposite-sex unmarried partners), 210,028 children (202,896 natural, 2,653 adopted, 4,479 stepchildren), 6,134 grandchildren, 6,452 brothers or sisters, 11,899 parents, 258 foster children, 8,013 other relatives, 19,485 non-relatives
- In group quarters: 18,859
Size of family households: 68,906 2-persons, 46,496 3-persons, 41,526 4-persons, 16,214 5-persons, 5,966 6-persons, 1,783 7-or-more-persons.
Size of nonfamily households: 78,042 1-person, 19,012 2-persons, 3,009 3-persons, 753 4-persons, 132 5-persons.
114,007 married couples with children.
24,718 single-parent households (5,707 men, 19,011 women).
76.0% of residents of Norfolk speak English at home.
3.8% of residents speak Spanish at home (71% speak English very well, 21% speak English well, 6% speak English not well, 2% don't speak English at all).
9.3% of residents speak other Indo-European language at home (67% speak English very well, 21% speak English well, 9% speak English not well, 3% don't speak English at all).
8.8% of residents speak Asian or Pacific Island language at home (51% speak English very well, 23% speak English well, 19% speak English not well, 7% don't speak English at all).
2.0% of residents speak other language at home (83% speak English very well, 12% speak English well, 3% speak English not well, 2% don't speak English at all).
In fiscal year 2004:
Federal Government expenditure: $3,803,812,000 ($5,820 per capita)
Department of Defense expenditure: $873,900,000
Federal direct payments to individuals for retirement and disability: $1,191,231,000
Federal other direct payments to individuals: $996,064,000
Federal direct payments not to individuals: $4,631,000
Federal grants: $553,090,000
Federal procurement contracts: $919,083,000 ($836,571,000 Department of Defense)
Federal salaries and wages: $139,713,000 ($6,696,000 Department of Defense)
Federal Government direct loans: $3,280,000
Federal guaranteed/insured loans: $212,568,000
Federal Government insurance: $601,051,000
Population change from April 1, 2000 to July 1, 2005:
Births: 43,247| Here: | 66 per 1000 residents |
| State: | 67 per 1000 residents |
Deaths: 30,123
| Here: | 46 per 1000 residents |
| State: | 46 per 1000 residents |
Net international migration: +13,640
| Here: | +21 per 1000 residents |
| State: | +25 per 1000 residents |
Net internal migration: -22,660
| Here: | |
| State: |
Total withdrawal of fresh water for public supply: 44.69 millions of gallons per day (74% from ground, 26% from surface)
| Here: | 6.9 |
| State: | 6.5 |
| Here: | 3.8 |
| State: | 4.0 |
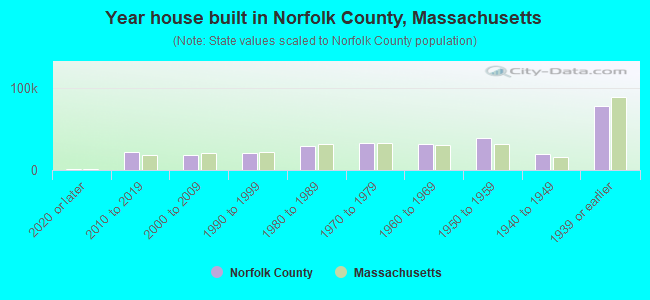
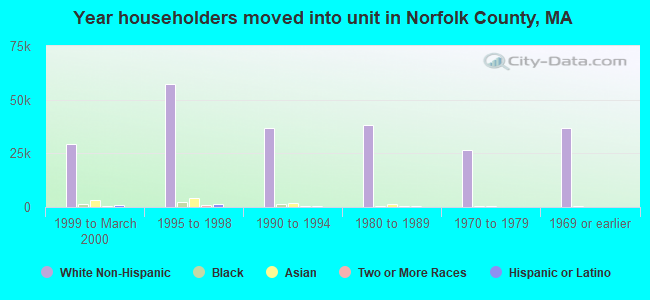
- Year house built in Norfolk County, Massachusetts
- 2,1772020 or later
- 23,7182010 to 2019
- 19,8402000 to 2009
- 22,9061990 to 1999
- 29,6381980 to 1989
- 32,9281970 to 1979
- 31,4371960 to 1969
- 37,2331950 to 1959
- 18,0221940 to 1949
- 77,8291939 or earlier
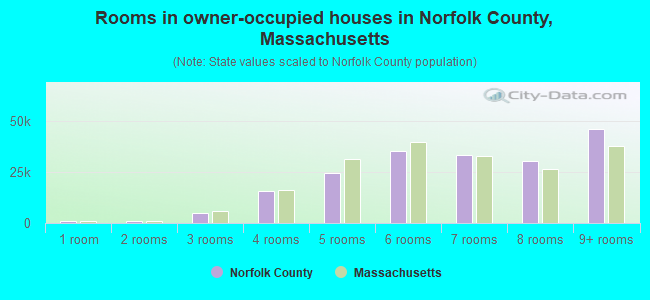
- Rooms in owner-occupied houses in Norfolk County, Massachusetts
- 1,6391 room
- 1,4152 rooms
- 6,0883 rooms
- 14,7674 rooms
- 24,8795 rooms
- 35,8326 rooms
- 29,8037 rooms
- 30,3038 rooms
- 49,9369+ rooms
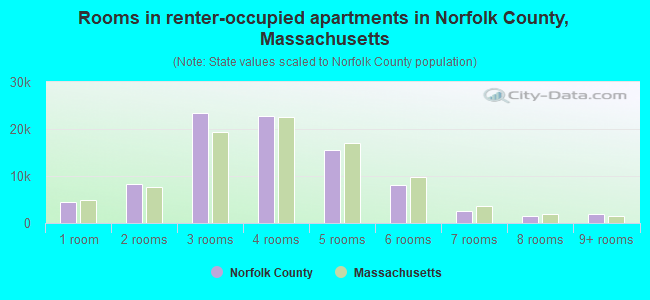
- Rooms in renter-occupied apartments in Norfolk County, Massachusetts
- 5,9651 room
- 9,0352 rooms
- 21,0173 rooms
- 21,9904 rooms
- 17,1785 rooms
- 5,5316 rooms
- 2,8227 rooms
- 1,5748 rooms
- 2,0659+ rooms
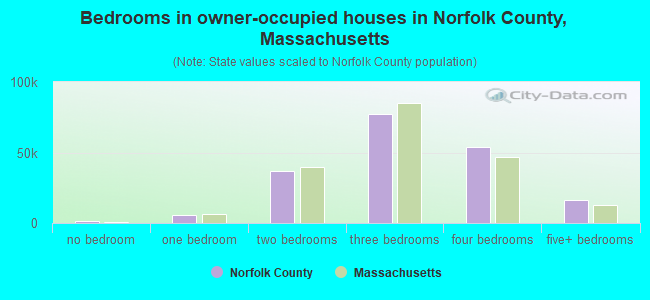
- Bedrooms in owner-occupied houses in Norfolk County, Massachusetts
- 1,639no bedroom
- 6,7041 bedroom
- 36,0852 bedrooms
- 75,0933 bedrooms
- 58,1224 bedrooms
- 17,0195+ bedrooms
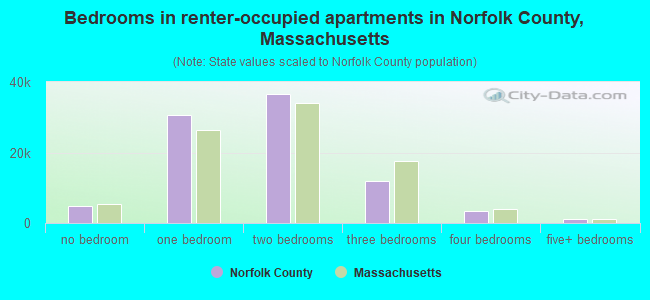
- Bedrooms in renter-occupied apartments in Norfolk County, Massachusetts
- 6,801no bedroom
- 29,1731 bedroom
- 34,8232 bedrooms
- 12,9993 bedrooms
- 2,5854 bedrooms
- 7965+ bedrooms
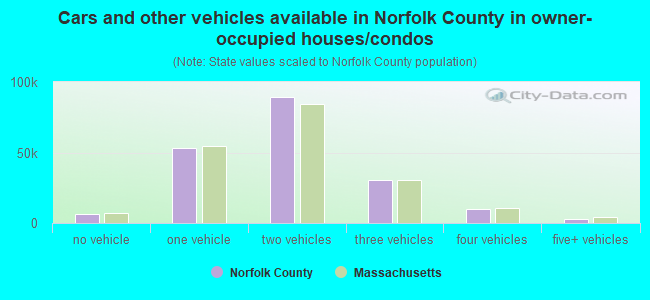
- Cars and other vehicles available in Norfolk County in owner-occupied houses/condos
- 7,216no vehicle
- 55,5881 vehicle
- 89,2302 vehicles
- 30,4213 vehicles
- 8,8744 vehicles
- 3,3335+ vehicles
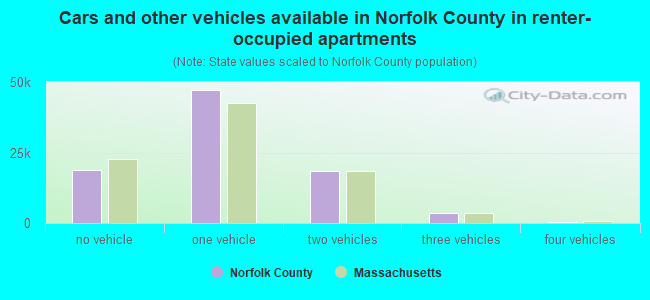
- Cars and other vehicles available in Norfolk County in renter-occupied apartments
- 18,528no vehicle
- 47,8651 vehicle
- 17,1222 vehicles
- 3,3003 vehicles
- 2864 vehicles
- 765+ vehicles
88.4% of Norfolk County residents lived in the same house 1 years ago.
Out of people who lived in different houses, 27% lived in this county.
Out of people who lived in different counties, 57% lived in Massachusetts.
| Norfolk County: | 88.4% |
| State average: | 87.7% |
Place of birth for U.S.-born residents:
- This state: 423,062
- Other state: 147,647
- Northeast: 77,784
- Midwest: 24,183
- South: 29,448
- West: 16,232
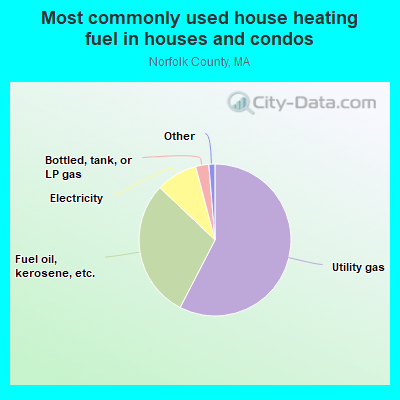
- 58.6%Utility gas
- 27.8%Fuel oil, kerosene, etc.
- 9.4%Electricity
- 2.7%Bottled, tank, or LP gas
- 0.5%Other fuel
- 0.4%Wood
- 0.3%No fuel used
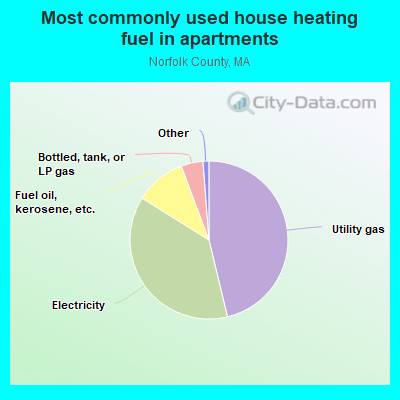
- 45.3%Utility gas
- 38.8%Electricity
- 9.3%Fuel oil, kerosene, etc.
- 4.5%Bottled, tank, or LP gas
- 1.0%No fuel used
- 0.8%Other fuel
- 0.2%Coal or coke
Private vs. public school enrollment:
| Here: | 10.1% |
| Massachusetts: | 10.3% |
| Here: | 14.8% |
| Massachusetts: | 12.3% |
| Here: | 52.1% |
| Massachusetts: | 51.2% |
Norfolk County government finances - Expenditure in 2018:
- Charges - Other: $12,703,000
Other: $8,664,000
Parks and Recreation: $1,217,000
Parks and Recreation: $1,162,000
Parking Facilities: $83,000
Elementary and Secondary Education - Other: $40,000
Elementary and Secondary Education - Other: $22,000
- Construction - General - Other: $2,373,000
- Current Operations - Elementary and Secondary Education: $12,785,000
Elementary and Secondary Education: $11,414,000
General - Other: $10,687,000
Central Staff Services: $8,210,000
General - Other: $4,746,000
General Public Buildings: $3,266,000
General Public Buildings: $3,122,000
Police Protection: $1,730,000
Central Staff Services: $1,622,000
Parks and Recreation: $975,000
Parks and Recreation: $923,000
Regular Highways: $657,000
Financial Administration: $524,000
Financial Administration: $518,000
Regular Highways: $467,000
- General - Interest on Debt: $457,000
Interest on Debt: $335,000
- Local Intergovernmental - Education: $7,009,000
Education: $6,623,000
- Long Term Debt - Beginning Outstanding - Unspecified Public Purpose: $14,204,000
Outstanding Unspecified Public Purpose: $13,710,000
Beginning Outstanding - Unspecified Public Purpose: $13,175,000
Outstanding Unspecified Public Purpose: $12,640,000
Retired Unspecified Public Purpose: $535,000
Retired Unspecified Public Purpose: $494,000
- Miscellaneous - General Revenue - Other: $733,000
General Revenue - Other: $451,000
Interest Earnings: $177,000
Interest Earnings: $95,000
Donations From Private Sources: $9,000
Donations From Private Sources: $9,000
- Other Capital Outlay - Elementary and Secondary Education: $225,000
Elementary and Secondary Education: $200,000
- Other Funds - Cash and Securities: $21,733,000
Cash and Securities: $12,116,000
- State Intergovernmental - Other: $2,535,000
Other: $2,417,000
Education: $2,085,000
Education: $1,960,000
- Tax - Property: $6,149,000
Property: $6,045,000
Other Selective Sales: $5,959,000
Other Selective Sales: $4,080,000
- Total Salaries and Wages: $8,509,000
: $7,963,000
Norfolk County government finances - Revenue in 2018:
- Charges - Other: $12,703,000
Other: $8,664,000
Parks and Recreation: $1,217,000
Parks and Recreation: $1,162,000
Parking Facilities: $83,000
Elementary and Secondary Education - Other: $40,000
Elementary and Secondary Education - Other: $22,000
- Construction - General - Other: $2,373,000
- Current Operations - Elementary and Secondary Education: $12,785,000
Elementary and Secondary Education: $11,414,000
General - Other: $10,687,000
Central Staff Services: $8,210,000
General - Other: $4,746,000
General Public Buildings: $3,266,000
General Public Buildings: $3,122,000
Police Protection: $1,730,000
Central Staff Services: $1,622,000
Parks and Recreation: $975,000
Parks and Recreation: $923,000
Regular Highways: $657,000
Financial Administration: $524,000
Financial Administration: $518,000
Regular Highways: $467,000
- General - Interest on Debt: $457,000
Interest on Debt: $335,000
- Local Intergovernmental - Education: $7,009,000
Education: $6,623,000
- Long Term Debt - Beginning Outstanding - Unspecified Public Purpose: $14,204,000
Outstanding Unspecified Public Purpose: $13,710,000
Beginning Outstanding - Unspecified Public Purpose: $13,175,000
Outstanding Unspecified Public Purpose: $12,640,000
Retired Unspecified Public Purpose: $535,000
Retired Unspecified Public Purpose: $494,000
- Miscellaneous - General Revenue - Other: $733,000
General Revenue - Other: $451,000
Interest Earnings: $177,000
Interest Earnings: $95,000
Donations From Private Sources: $9,000
Donations From Private Sources: $9,000
- Other Capital Outlay - Elementary and Secondary Education: $225,000
Elementary and Secondary Education: $200,000
- Other Funds - Cash and Securities: $21,733,000
Cash and Securities: $12,116,000
- State Intergovernmental - Other: $2,535,000
Other: $2,417,000
Education: $2,085,000
Education: $1,960,000
- Tax - Property: $6,149,000
Property: $6,045,000
Other Selective Sales: $5,959,000
Other Selective Sales: $4,080,000
- Total Salaries and Wages: $8,509,000
: $7,963,000
Norfolk County government finances - Debt in 2018:
- Charges - Other: $12,703,000
Other: $8,664,000
Parks and Recreation: $1,217,000
Parks and Recreation: $1,162,000
Parking Facilities: $83,000
Elementary and Secondary Education - Other: $40,000
Elementary and Secondary Education - Other: $22,000
- Construction - General - Other: $2,373,000
- Current Operations - Elementary and Secondary Education: $12,785,000
Elementary and Secondary Education: $11,414,000
General - Other: $10,687,000
Central Staff Services: $8,210,000
General - Other: $4,746,000
General Public Buildings: $3,266,000
General Public Buildings: $3,122,000
Police Protection: $1,730,000
Central Staff Services: $1,622,000
Parks and Recreation: $975,000
Parks and Recreation: $923,000
Regular Highways: $657,000
Financial Administration: $524,000
Financial Administration: $518,000
Regular Highways: $467,000
- General - Interest on Debt: $457,000
Interest on Debt: $335,000
- Local Intergovernmental - Education: $7,009,000
Education: $6,623,000
- Long Term Debt - Beginning Outstanding - Unspecified Public Purpose: $14,204,000
Outstanding Unspecified Public Purpose: $13,710,000
Beginning Outstanding - Unspecified Public Purpose: $13,175,000
Outstanding Unspecified Public Purpose: $12,640,000
Retired Unspecified Public Purpose: $535,000
Retired Unspecified Public Purpose: $494,000
- Miscellaneous - General Revenue - Other: $733,000
General Revenue - Other: $451,000
Interest Earnings: $177,000
Interest Earnings: $95,000
Donations From Private Sources: $9,000
Donations From Private Sources: $9,000
- Other Capital Outlay - Elementary and Secondary Education: $225,000
Elementary and Secondary Education: $200,000
- Other Funds - Cash and Securities: $21,733,000
Cash and Securities: $12,116,000
- State Intergovernmental - Other: $2,535,000
Other: $2,417,000
Education: $2,085,000
Education: $1,960,000
- Tax - Property: $6,149,000
Property: $6,045,000
Other Selective Sales: $5,959,000
Other Selective Sales: $4,080,000
- Total Salaries and Wages: $8,509,000
: $7,963,000
Norfolk County government finances - Cash and Securities in 2018:
- Charges - Other: $12,703,000
Other: $8,664,000
Parks and Recreation: $1,217,000
Parks and Recreation: $1,162,000
Parking Facilities: $83,000
Elementary and Secondary Education - Other: $40,000
Elementary and Secondary Education - Other: $22,000
- Construction - General - Other: $2,373,000
- Current Operations - Elementary and Secondary Education: $12,785,000
Elementary and Secondary Education: $11,414,000
General - Other: $10,687,000
Central Staff Services: $8,210,000
General - Other: $4,746,000
General Public Buildings: $3,266,000
General Public Buildings: $3,122,000
Police Protection: $1,730,000
Central Staff Services: $1,622,000
Parks and Recreation: $975,000
Parks and Recreation: $923,000
Regular Highways: $657,000
Financial Administration: $524,000
Financial Administration: $518,000
Regular Highways: $467,000
- General - Interest on Debt: $457,000
Interest on Debt: $335,000
- Local Intergovernmental - Education: $7,009,000
Education: $6,623,000
- Long Term Debt - Beginning Outstanding - Unspecified Public Purpose: $14,204,000
Outstanding Unspecified Public Purpose: $13,710,000
Beginning Outstanding - Unspecified Public Purpose: $13,175,000
Outstanding Unspecified Public Purpose: $12,640,000
Retired Unspecified Public Purpose: $535,000
Retired Unspecified Public Purpose: $494,000
- Miscellaneous - General Revenue - Other: $733,000
General Revenue - Other: $451,000
Interest Earnings: $177,000
Interest Earnings: $95,000
Donations From Private Sources: $9,000
Donations From Private Sources: $9,000
- Other Capital Outlay - Elementary and Secondary Education: $225,000
Elementary and Secondary Education: $200,000
- Other Funds - Cash and Securities: $21,733,000
Cash and Securities: $12,116,000
- State Intergovernmental - Other: $2,535,000
Other: $2,417,000
Education: $2,085,000
Education: $1,960,000
- Tax - Property: $6,149,000
Property: $6,045,000
Other Selective Sales: $5,959,000
Other Selective Sales: $4,080,000
- Total Salaries and Wages: $8,509,000
: $7,963,000
Supplemental Security Income (SSI) in 2006:
- Total number of recipients: 9,635
- Number of aged recipients: 3,226
- Number of blind and disabled recipients: 6,409
- Number of recipients under 18: 742
- Number of recipients between 18 and 64: 5,449
- Number of recipients older than 64: 3,444
- Number of recipients also receiving OASDI: 3,602
- Amount of payments (thousands of dollars): 4,507
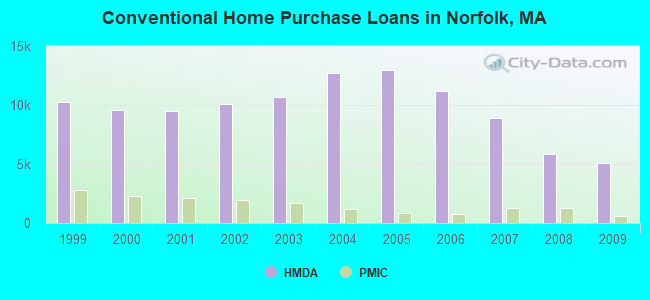
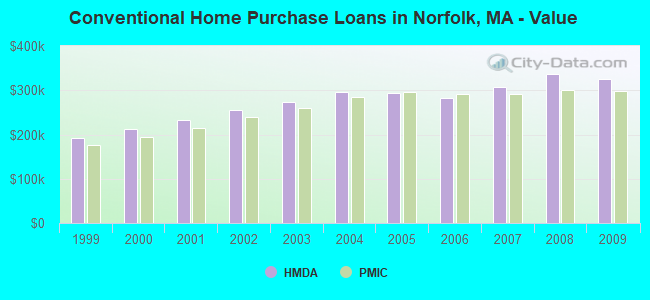
| Home Mortgage Disclosure Act Aggregated Statistics For Year 2009 (Based on 121 full tracts) | ||||||||||||||
| A) FHA, FSA/RHS & VA Home Purchase Loans | B) Conventional Home Purchase Loans | C) Refinancings | D) Home Improvement Loans | E) Loans on Dwellings For 5+ Families | F) Non-occupant Loans on < 5 Family Dwellings (A B C & D) | G) Loans On Manufactured Home Dwelling (A B C & D) | ||||||||
|---|---|---|---|---|---|---|---|---|---|---|---|---|---|---|
| Number | Average Value | Number | Average Value | Number | Average Value | Number | Average Value | Number | Average Value | Number | Average Value | Number | Average Value | |
| LOANS ORIGINATED | 1,658 | $284,659 | 5,113 | $324,738 | 23,994 | $292,299 | 1,163 | $174,937 | 52 | $2,013,250 | 631 | $287,151 | 17 | $75,647 |
| APPLICATIONS APPROVED, NOT ACCEPTED | 91 | $252,352 | 306 | $335,533 | 1,491 | $303,695 | 104 | $81,519 | 4 | $508,250 | 49 | $223,612 | 4 | $48,250 |
| APPLICATIONS DENIED | 277 | $272,433 | 665 | $285,316 | 4,536 | $305,631 | 316 | $133,500 | 7 | $1,537,000 | 253 | $246,328 | 3 | $61,000 |
| APPLICATIONS WITHDRAWN | 184 | $276,832 | 679 | $331,541 | 3,454 | $300,036 | 150 | $199,273 | 2 | $2,088,500 | 120 | $244,383 | 2 | $35,000 |
| FILES CLOSED FOR INCOMPLETENESS | 29 | $269,931 | 165 | $319,970 | 1,107 | $289,316 | 66 | $184,212 | 0 | $0 | 39 | $238,128 | 0 | $0 |
| Private Mortgage Insurance Companies Aggregated Statistics For Year 2009 (Based on 118 full tracts) | ||||||
| A) Conventional Home Purchase Loans | B) Refinancings | C) Non-occupant Loans on < 5 Family Dwellings (A & B) | ||||
|---|---|---|---|---|---|---|
| Number | Average Value | Number | Average Value | Number | Average Value | |
| LOANS ORIGINATED | 574 | $299,092 | 396 | $307,318 | 0 | $0 |
| APPLICATIONS APPROVED, NOT ACCEPTED | 182 | $310,505 | 195 | $317,021 | 2 | $223,000 |
| APPLICATIONS DENIED | 123 | $284,691 | 118 | $324,983 | 1 | $413,000 |
| APPLICATIONS WITHDRAWN | 42 | $325,357 | 48 | $304,271 | 2 | $268,500 |
| FILES CLOSED FOR INCOMPLETENESS | 18 | $314,833 | 6 | $306,500 | 0 | $0 |
| Most common first names in Norfolk County, MA among deceased individuals | ||
| Name | Count | Lived (average) |
|---|---|---|
| Mary | 8,518 | 81.6 years |
| John | 7,122 | 74.7 years |
| William | 4,364 | 74.6 years |
| Joseph | 3,790 | 75.3 years |
| Margaret | 3,330 | 81.5 years |
| James | 3,305 | 73.7 years |
| Helen | 3,239 | 81.6 years |
| Robert | 2,966 | 70.6 years |
| George | 2,753 | 76.1 years |
| Charles | 2,435 | 76.1 years |
| Most common last names in Norfolk County, MA among deceased individuals | ||
| Last name | Count | Lived (average) |
|---|---|---|
| Smith | 1,335 | 77.8 years |
| Sullivan | 1,068 | 77.3 years |
| Murphy | 893 | 77.5 years |
| Johnson | 876 | 79.4 years |
| Brown | 704 | 77.2 years |
| Walsh | 582 | 77.7 years |
| Mccarthy | 547 | 77.9 years |
| Anderson | 545 | 78.9 years |
| Obrien | 540 | 76.3 years |
| White | 527 | 77.3 years |
| Businesses in Norfolk County, MA | ||||
| Name | Count | Name | Count | |
|---|---|---|---|---|
| 7-Eleven | 17 | Jones New York | 4 | |
| ALDO | 4 | Journeys | 3 | |
| AT&T | 11 | Justice | 3 | |
| Abercrombie & Fitch | 1 | KFC | 3 | |
| Abercrombie Kids | 1 | Kmart | 1 | |
| Ace Hardware | 10 | Kohl's | 1 | |
| Advance Auto Parts | 6 | LA Fitness | 1 | |
| Aeropostale | 3 | La-Z-Boy | 3 | |
| Aerosoles | 1 | Lane Bryant | 2 | |
| American Eagle Outfitters | 3 | Lane Furniture | 4 | |
| Ann Taylor | 6 | LensCrafters | 3 | |
| Apple Store | 2 | Levi Strauss & Co. | 2 | |
| Applebee's | 2 | Lowe's | 4 | |
| Ashley Furniture | 6 | Macy's | 1 | |
| Audi | 2 | Marriott | 9 | |
| AutoZone | 6 | Marshalls | 5 | |
| Avenue | 1 | MasterBrand Cabinets | 59 | |
| BMW | 1 | Mazda | 2 | |
| Bakers | 1 | McDonald's | 22 | |
| Banana Republic | 3 | Men's Wearhouse | 5 | |
| Barnes & Noble | 2 | Motel 6 | 1 | |
| Baskin-Robbins | 2 | Motherhood Maternity | 3 | |
| Bath & Body Works | 6 | New Balance | 9 | |
| Bebe | 2 | Nike | 21 | |
| Bed Bath & Beyond | 4 | Nissan | 2 | |
| Ben & Jerry's | 3 | Nordstrom | 1 | |
| Best Western | 1 | OfficeMax | 1 | |
| Blockbuster | 4 | Old Navy | 3 | |
| Brooks Brothers | 2 | Olive Garden | 2 | |
| Brookstone | 2 | Outback | 3 | |
| Budget Car Rental | 3 | Outback Steakhouse | 3 | |
| Burger King | 11 | Pac Sun | 2 | |
| CVS | 34 | Panda Express | 1 | |
| Cache | 1 | Panera Bread | 7 | |
| Casual Male XL | 2 | Papa John's Pizza | 2 | |
| Charlotte Russe | 1 | Payless | 4 | |
| Chevrolet | 3 | Penske | 6 | |
| Chico's | 3 | PetSmart | 1 | |
| Chipotle | 4 | Pier 1 Imports | 3 | |
| Circle K | 6 | Pizza Hut | 2 | |
| Clarks | 3 | Qdoba Mexican Grill | 2 | |
| Cold Stone Creamery | 2 | Quiznos | 1 | |
| Coldwater Creek | 1 | RadioShack | 5 | |
| Comfort Inn | 2 | Red Robin | 1 | |
| Costco | 2 | Rite Aid | 13 | |
| Cracker Barrel | 1 | Ruby Tuesday | 1 | |
| Crate & Barrel | 1 | Rue21 | 1 | |
| Curves | 3 | Ryder Rental & Truck Leasing | 1 | |
| DHL | 5 | Sears | 5 | |
| Dairy Queen | 4 | Sephora | 2 | |
| Decora Cabinetry | 18 | Shaw's | 14 | |
| Domino's Pizza | 8 | Sheraton | 1 | |
| DressBarn | 7 | Skechers USA | 1 | |
| Dressbarn | 6 | Soma Intimates | 1 | |
| Dunkin Donuts | 112 | Spencer Gifts | 1 | |
| Econo Lodge | 1 | Sprint Nextel | 10 | |
| Eddie Bauer | 1 | Staples | 9 | |
| Express | 3 | Starbucks | 19 | |
| Extended Stay America | 1 | Stop & Shop | 14 | |
| Famous Footwear | 2 | Subaru | 2 | |
| FedEx | 127 | Subway | 14 | |
| Finish Line | 1 | Super 8 | 1 | |
| Firestone Complete Auto Care | 2 | T-Mobile | 20 | |
| Foot Locker | 1 | T.G.I. Driday's | 4 | |
| Ford | 7 | T.J.Maxx | 6 | |
| Forever 21 | 1 | Taco Bell | 3 | |
| GNC | 7 | Talbots | 2 | |
| GameStop | 8 | Target | 3 | |
| Gap | 5 | The Cheesecake Factory | 1 | |
| Gymboree | 3 | The Limited | 1 | |
| H&M | 2 | The Room Place | 1 | |
| H&R Block | 18 | Toyota | 3 | |
| Hawthorn | 1 | Toys"R"Us | 5 | |
| Hilton | 4 | Trader Joe's | 1 | |
| Holiday Inn | 5 | True Value | 3 | |
| Hollister Co. | 2 | U-Haul | 21 | |
| Home Depot | 5 | UPS | 151 | |
| Honda | 2 | Urban Outfitters | 1 | |
| Hot Topic | 1 | Verizon Wireless | 9 | |
| Hyatt | 1 | Victoria's Secret | 2 | |
| Hyundai | 2 | Volkswagen | 3 | |
| IHOP | 3 | Walgreens | 19 | |
| IKEA | 1 | Walmart | 5 | |
| IZOD | 1 | Wendy's | 4 | |
| J. Jill | 2 | Wet Seal | 1 | |
| J.Crew | 4 | Whole Foods Market | 3 | |
| JoS. A. Bank | 3 | World Gym | 1 | |
| Johnny Rockets | 1 | YMCA | 5 | |
Norfolk County on our top lists:
- #7 on the list of "Top 101 counties with the highest percentage of residents that visited a dentist within the past year"
- #12 on the list of "Top 101 counties with the lowest percentage of residents that keep firearms around their homes"
- #13 on the list of "Top 101 counties with the best general health status score of residents (1-5), 3 years of data"
- #18 on the list of "Top 101 counties with the lowest Nitrogen Dioxide air pollution readings in 2012 (ppm)"
- #25 on the list of "Top 101 counties with the lowest number of infant deaths per 1000 residents 2007-2013 (pop. 50,000+)"
- #25 on the list of "Top 101 counties with the most Catholic adherents"
- #25 on the list of "Top 101 counties with the most Catholic adherents (pop. 50,000+)"
- #40 on the list of "Top 101 counties with the largest increase in the number of infant deaths per 1000 residents 2000-2006 to 2007-2013 (pop. 50,000+)"
- #62 on the list of "Top 101 counties with the most Catholic congregations (pop. 50,000+)"
- #63 on the list of "Top 101 counties with the most Catholic congregations"
- #68 on the list of "Top 101 counties with the highest ground withdrawal of fresh water for public supply (pop. 50,000+)"
- #69 on the list of "Top 101 counties with the highest ground withdrawal of fresh water for public supply"
- #75 on the list of "Top 101 counties with the most Orthodox adherents"
- #75 on the list of "Top 101 counties with the most Orthodox adherents (pop. 50,000+)"
- #77 on the list of "Top 101 counties with the largest decrease in the number of births per 1000 residents 2000-2006 to 2007-2013 (pop 50,000+)"
- #77 on the list of "Top 101 counties with the most Orthodox congregations"
- #77 on the list of "Top 101 counties with the most Other congregations (pop. 50,000+)"
- #78 on the list of "Top 101 counties with the most Orthodox congregations (pop. 50,000+)"
- #81 on the list of "Top 101 counties with the most Other congregations"
- #86 on the list of "Top 101 counties with the highest percentage of residents that exercised in the past month"