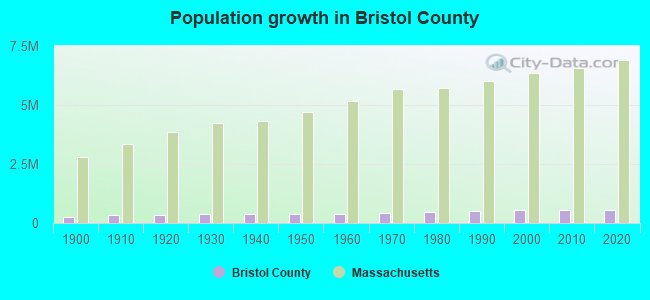
Bristol County, Massachusetts (MA)
County owner-occupied free and clear houses and condos in 2010: 34,735
County owner-occupied houses and condos in 2000: 126,531
Renter-occupied apartments: 80,217 (it was 78,880 in 2000)
| % of renters here: | 38% |
| State: | 38% |
Land area: 556 sq. mi.
Water area: 135.2 sq. mi.
Population density: 1043 people per square mile (very high).
Industries providing employment: Educational, health and social services (26.5%), Professional, scientific, management, administrative, and waste management services (11.7%), Retail trade (10.8%), Manufacturing (10.8%).
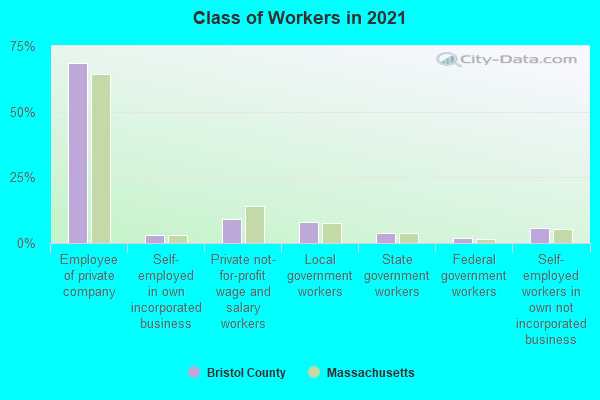
Type of workers:
- Private wage or salary: 83%
- Government: 13%
- Self-employed, not incorporated: 4%
- Unpaid family work: 0%
- OSM Map
- General Map
- Google Map
- MSN Map

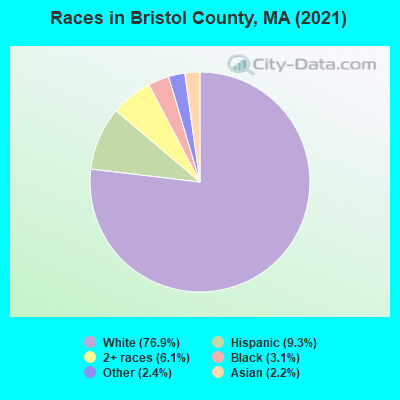
- 440,85176.0%White Non-Hispanic Alone
- 55,9509.6%Hispanic or Latino
- 29,3065.1%Two or more races
- 29,0255.0%Black Non-Hispanic Alone
- 14,4822.5%Asian alone
- 9,9781.7%Some other race alone
- 4380.08%American Indian and Alaska Native alone
- 380.01%Native Hawaiian and Other
Pacific Islander alone
| Median resident age: | 40.9 years |
| Massachusetts median age: | 40.3 years |
| Males: 283,450 | |
| Females: 296,618 |

 | Population slightly down in MA 2022 (362 replies) |
| $4 gas (313 replies) |
| Hillbilly Massachusetts (103 replies) |
| Best coastal town in Mass for young retirees (106 replies) |
| Boston area population lost 2020-2021 (122 replies) |
| 2021 Real Estate Observations (1729 replies) |
| Bristol County: | 2.0 people |
| Massachusetts: | 2 people |
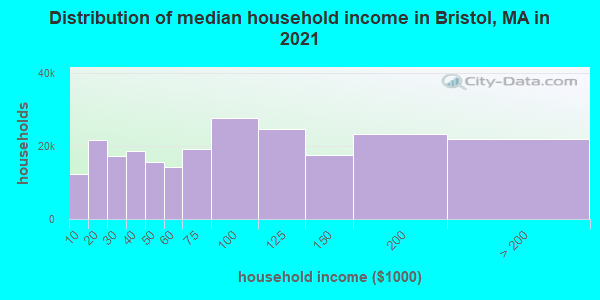
Estimated median household income in 2022: $81,551 ($43,496 in 1999)
| This county: | $81,551 |
| Massachusetts: | $94,488 |
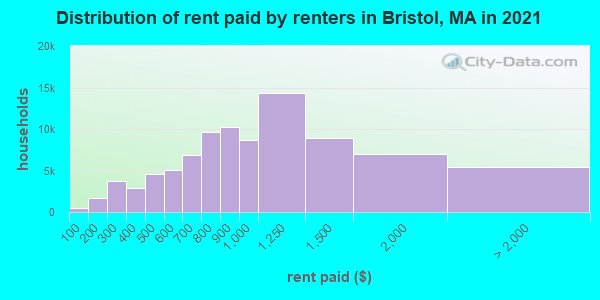
Median contract rent in 2022 for apartments: $945 (lower quartile is $674, upper quartile is $1,374)
| This county: | $945 |
| State: | $1446 |
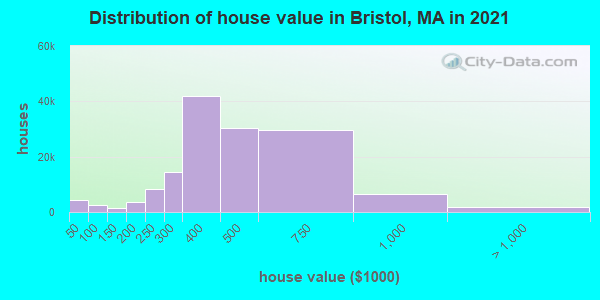
Estimated median house or condo value in 2022: $432,000 (it was $147,100 in 2000)
| Bristol: | $432,000 |
| Massachusetts: | $534,700 |
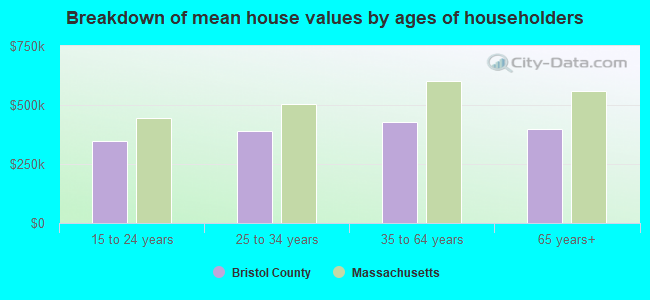
Mean price in 2022:
Median monthly housing costs for homes and condos with a mortgage: $2,177Detached houses: $484,124
Here: $484,124 State: $651,570 Townhouses or other attached units: $382,766
Here: $382,766 State: $617,749 In 2-unit structures: $322,469
Here: $322,469 State: $594,808 In 3-to-4-unit structures: $355,875
Here: $355,875 State: $601,912 In 5-or-more-unit structures: $269,714
Here: $269,714 State: $555,768 Mobile homes: $156,871
Here: $156,871 State: $170,209 Occupied boats, RVs, vans, etc.: $49,834
Here: $49,834 State: $207,873
Median monthly housing costs for units without a mortgage: $796
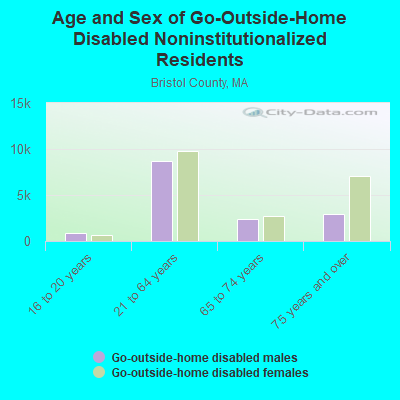
Institutionalized population: 6,219
Health of residents in Bristol County based on CDC Behavioral Risk Factor Surveillance System Survey Questionnaires from 2013 to 2021:
General health status score of residents in this county from 1 (poor) to 5 (excellent) is 3.5. This is about average.71.2% of residents exercised in the past month. This is about average.
46.3% of residents smoked 100+ cigarettes in their lives. This is about average.
60.3% of adult residents drank alcohol in the past 30 days. This is less than average.
75.0% of residents visited a dentist within the past year. This is about average.
Average weight of males is 195 pounds. This is about average.
Average weight of females is 159 pounds. This is about average.
Health of residents in Bristol County based on CDC Behavioral Risk Factor Surveillance System Survey Questionnaires from 2003 to 2012:
General health status score of residents in this county from 1 (poor) to 5 (excellent) is 3.3. This is worse than average.68.2% of residents exercised in the past month. This is less than average.
52.1% of residents smoked 100+ cigarettes in their lives. This is more than average.
76.8% of adult residents drank alcohol in the past 30 days. This is about average.
69.0% of residents visited a dentist within the past year. This is about average.
Average weight of males is 192 pounds. This is about average.
Average weight of females is 159 pounds. This is about average.
8.6% of residents keep firearms around their homes. This is less than average.
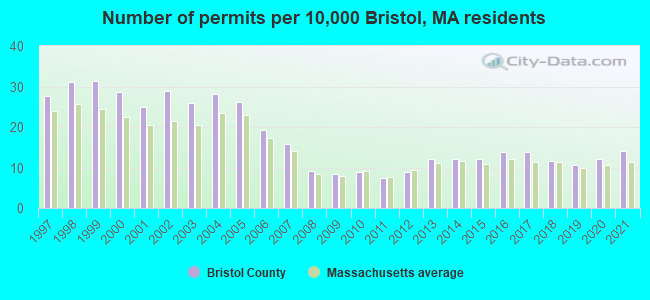
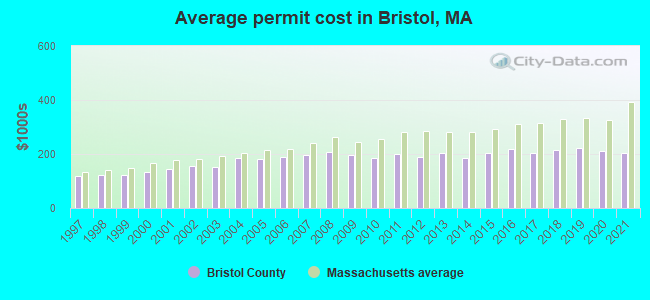
Single-family new house construction building permits:
- 2022: 600 buildings, average cost: $212,300
- 2021: 755 buildings, average cost: $202,500
- 2020: 645 buildings, average cost: $209,700
- 2019: 572 buildings, average cost: $222,300
- 2018: 617 buildings, average cost: $214,700
- 2017: 741 buildings, average cost: $204,500
- 2016: 743 buildings, average cost: $217,600
- 2015: 641 buildings, average cost: $205,000
- 2014: 645 buildings, average cost: $185,100
- 2013: 653 buildings, average cost: $203,400
- 2012: 479 buildings, average cost: $189,900
- 2011: 392 buildings, average cost: $200,800
- 2010: 478 buildings, average cost: $185,200
- 2009: 454 buildings, average cost: $194,700
- 2008: 494 buildings, average cost: $208,600
- 2007: 846 buildings, average cost: $196,200
- 2006: 1030 buildings, average cost: $188,400
- 2005: 1394 buildings, average cost: $181,900
- 2004: 1500 buildings, average cost: $184,500
- 2003: 1390 buildings, average cost: $151,700
- 2002: 1540 buildings, average cost: $155,000
- 2001: 1337 buildings, average cost: $144,200
- 2000: 1526 buildings, average cost: $134,700
- 1999: 1683 buildings, average cost: $122,200
- 1998: 1666 buildings, average cost: $123,800
- 1997: 1473 buildings, average cost: $118,200
Median real estate property taxes paid for housing units with mortgages in 2022: $4,520 (1.0%)
Median real estate property taxes paid for housing units with no mortgage in 2022: $4,398 (1.1%)
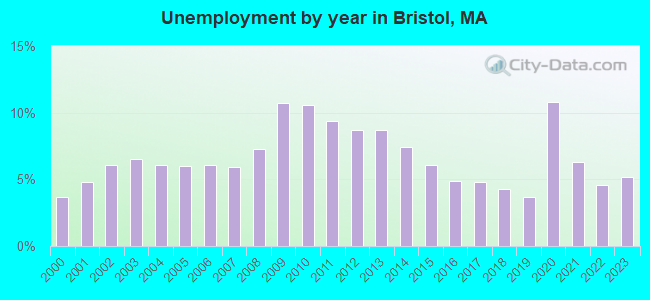
| Bristol County: | 11.5% |
| Massachusetts: | 10.4% |
Median age of residents in 2022: 40.9 years old
(Males: 39.9 years old, Females: 42.3 years old)
(Median age for: White residents: 45.9 years old, Black residents: 26.9 years old, American Indian residents: 28.8 years old, Asian residents: 36.3 years old, Hispanic or Latino residents: 25.5 years old, Other race residents: 28.0 years old)
Area name: New Bedford, MA HUD Metro FMR Area
Fair market rent in 2006 for a 1-bedroom apartment in Bristol County is $658 a month.
Fair market rent for a 2-bedroom apartment is $753 a month.
Fair market rent for a 3-bedroom apartment is $902 a month.
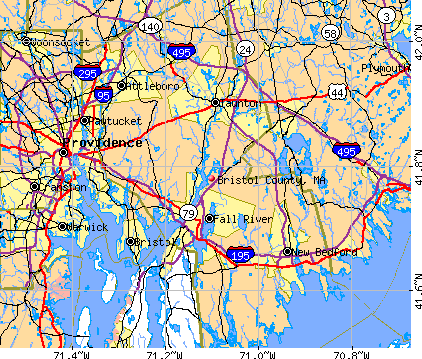
Cities in this county include: New Bedford, Fall River, Taunton, Attleboro, Dartmouth, North Attleborough, Mansfield, Easton, Somerset, Norton.
2023 air pollution in Bristol County:
Ozone (1-hour): 0.036 ppm (standard limit: 0.12 ppm). Near U.S. average.
Neighboring counties: Antelope County, Nebraska  , Blaine County, Nebraska , Greene County, New York , Logan County, Nebraska .
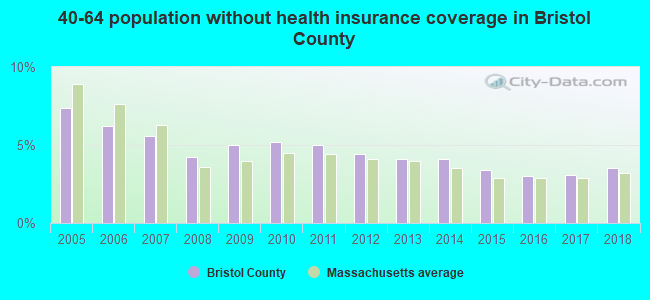
| Here: | 4.1% |
| Massachusetts: | 3.5% |
Current college students: 28,891
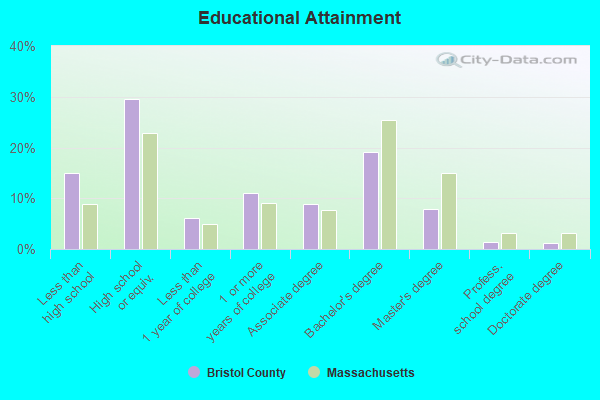
People 25 years of age or older with a high school degree or higher: 86.9%
People 25 years of age or older with a bachelor's degree or higher: 31.1%
Number of foreign born residents: 79,709 (61.6% naturalized citizens)
| Bristol County: | 13.7% |
| Whole state: | 18.0% |
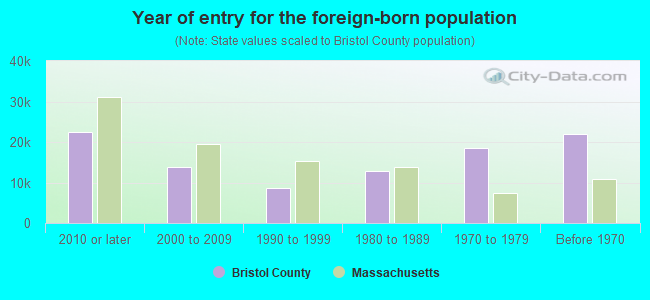
- Year of entry for the foreign-born population
- 23,4072010 or later
- 13,0882000 to 2009
- 10,2691990 to 1999
- 12,8061980 to 1989
- 18,6021970 to 1979
- 22,006Before 1970
Mean travel time to work (commute): minutes
Percentage of county residents living and working in this county: 91.5%
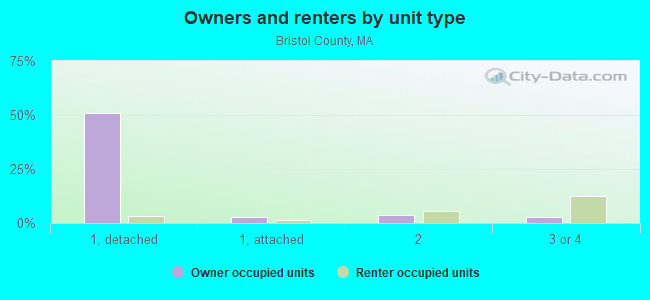
Housing units in structures:
- One, detached: 129,693
- One, attached: 9,535
- Two: 25,476
- 3 or 4: 35,597
- 5 to 9: 16,851
- 10 to 19: 9,561
- 20 to 49: 6,256
- 50 or more: 8,893
- Mobile homes: 2,701
- Boats, RVs, vans, etc.: 481
Housing units in Bristol County with a mortgage: 93,808 (12,385 second mortgage, 365 home equity loan, 10,754 both second mortgage and home equity loan)
Houses without a mortgage: 4,624
| Here: | 95.9% with mortgage |
| State: | 96.2% with mortgage |
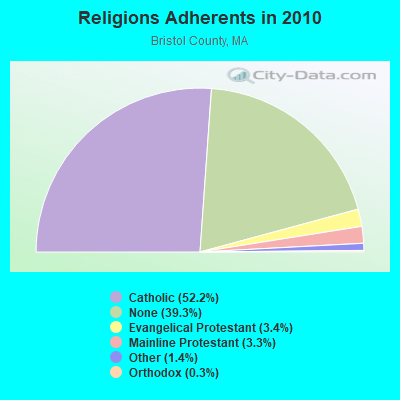
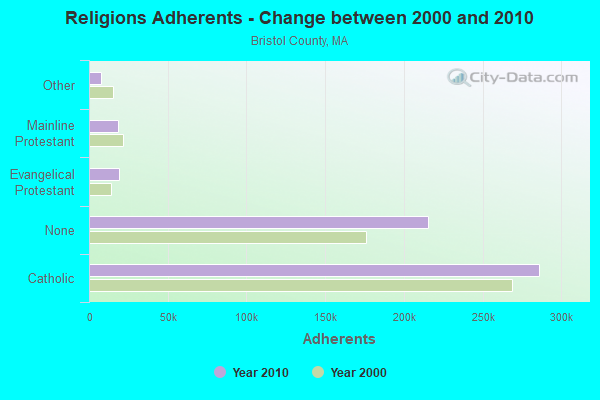
Religion statistics for Bristol County
| Religion | Adherents | Congregations |
|---|---|---|
| Catholic | 286,113 | 72 |
| Evangelical Protestant | 18,765 | 128 |
| Mainline Protestant | 18,246 | 83 |
| Other | 7,807 | 33 |
| Orthodox | 1,565 | 4 |
| Black Protestant | 511 | 5 |
| None | 215,278 | - |
Source: Clifford Grammich, Kirk Hadaway, Richard Houseal, Dale E.Jones, Alexei Krindatch, Richie Stanley and Richard H.Taylor. 2012. 2010 U.S.Religion Census: Religious Congregations & Membership Study. Association of Statisticians of American Religious Bodies. Jones, Dale E., et al. 2002. Congregations and Membership in the United States 2000. Nashville, TN: Glenmary Research Center.
Food Environment Statistics:
| Bristol County: | 2.00 / 10,000 pop. |
| State: | 1.98 / 10,000 pop. |
| Here: | 0.09 / 10,000 pop. |
| Massachusetts: | 0.05 / 10,000 pop. |
| This county: | 1.93 / 10,000 pop. |
| Massachusetts: | 2.22 / 10,000 pop. |
| Bristol County: | 2.35 / 10,000 pop. |
| Massachusetts: | 1.77 / 10,000 pop. |
| This county: | 8.20 / 10,000 pop. |
| State: | 8.76 / 10,000 pop. |
| Bristol County: | 9.5% |
| Massachusetts: | 8.1% |
| Bristol County: | 26.9% |
| State: | 22.5% |
| Here: | 14.4% |
| State: | 16.5% |
Agriculture in Bristol County:
Average size of farms: 58 acresAverage value of agricultural products sold per farm: $47,053
Average value of crops sold per acre for harvested cropland: $1863.34
The value of nursery, greenhouse, floriculture, and sod as a percentage of the total market value of agricultural products sold: 43.98%
The value of livestock, poultry, and their products as a percentage of the total market value of agricultural products sold: 23.96%
Average total farm production expenses per farm: $37,318
Harvested cropland as a percentage of land in farms: 33.20%
Irrigated harvested cropland as a percentage of land in farms: 16.64%
Average market value of all machinery and equipment per farm: $36,804
The percentage of farms operated by a family or individual: 82.69%
Average age of principal farm operators: 55 years
Average number of cattle and calves per 100 acres of all land in farms: 16.00
Milk cows as a percentage of all cattle and calves: 36.83%
Corn for grain: 241 harvested acres
Vegetables: 1,872 harvested acres
Land in orchards: 294 acres
Earthquake activity:
Bristol County-area historical earthquake activity is significantly above Massachusetts state average. It is 74% smaller than the overall U.S. average.On 10/7/1983 at 10:18:46, a magnitude 5.3 (5.1 MB, 5.3 LG, 5.1 ML, Class: Moderate, Intensity: VI - VII) earthquake occurred 222.7 miles away from Bristol County center
On 4/20/2002 at 10:50:47, a magnitude 5.3 (5.3 ML, Depth: 3.0 mi) earthquake occurred 230.0 miles away from the county center
On 1/19/1982 at 00:14:42, a magnitude 4.7 (4.5 MB, 4.7 MD, 4.5 LG, Class: Light, Intensity: IV - V) earthquake occurred 121.7 miles away from the county center
On 10/16/2012 at 23:12:25, a magnitude 4.7 (4.7 ML, Depth: 10.0 mi) earthquake occurred 127.8 miles away from the county center
On 4/20/2002 at 10:50:47, a magnitude 5.2 (5.2 MB, 4.2 MS, 5.2 MW, 5.0 MW) earthquake occurred 229.2 miles away from Bristol County center
On 8/22/1992 at 12:20:32, a magnitude 4.8 (4.8 MB, 3.8 MS, 4.7 LG, Depth: 6.2 mi) earthquake occurred 189.4 miles away from the county center
Magnitude types: regional Lg-wave magnitude (LG), body-wave magnitude (MB), duration magnitude (MD), local magnitude (ML), surface-wave magnitude (MS), moment magnitude (MW)
Most recent natural disasters:
- Massachusetts Severe Winter Storm, Snowstorm, and Flooding, Incident Period: January 26, 2015 to January 29, 2015, Major Disaster (Presidential) Declared DR-4214: April 13, 2015, FEMA Id: 4214, Natural disaster type: Snowstorm, Winter Storm, Flood
- Massachusetts Explosions, Incident Period: April 15, 2013 to April 22, 2013, Emergency Declared EM-3362: April 17, 2013, FEMA Id: 3362, Natural disaster type: Explosion
- Massachusetts Severe Winter Storm, Snowstorm, and Flooding, Incident Period: February 08, 2013 to February 10, 2013, Major Disaster (Presidential) Declared DR-4110: April 19, 2013, FEMA Id: 4110, Natural disaster type: Snowstorm, Winter Storm, Flood
- Massachusetts Hurricane Sandy, Incident Period: October 27, 2012 to November 08, 2012, Emergency Declared EM-3350: October 28, 2012, FEMA Id: 3350, Natural disaster type: Hurricane
- Massachusetts Hurricane Sandy, Incident Period: October 27, 2012 to November 08, 2012, Major Disaster (Presidential) Declared DR-4097: December 19, 2012, FEMA Id: 4097, Natural disaster type: Hurricane
- Massachusetts Tropical Storm Irene, Incident Period: August 27, 2011 to August 29, 2011, Major Disaster (Presidential) Declared DR-4028: September 03, 2011, FEMA Id: 4028, Natural disaster type: Tropical Storm
- Massachusetts Hurricane Irene, Incident Period: August 26, 2011 to September 05, 2011, Emergency Declared EM-3330: August 26, 2011, FEMA Id: 3330, Natural disaster type: Hurricane
- Massachusetts Hurricane Earl, Incident Period: September 01, 2010 to September 04, 2010, Emergency Declared EM-3315: September 02, 2010, FEMA Id: 3315, Natural disaster type: Hurricane
- Massachusetts Severe Storm and Flooding, Incident Period: March 12, 2010 to April 26, 2010, Major Disaster (Presidential) Declared DR-1895: March 29, 2010, FEMA Id: 1895, Natural disaster type: Storm, Flood
- Massachusetts Severe Winter Storm, Incident Period: December 11, 2008 to December 18, 2008, Emergency Declared EM-3296: December 13, 2008, FEMA Id: 3296, Natural disaster type: Winter Storm
- 13 other natural disasters have been reported since 1953.
The number of natural disasters in Bristol County (23) is greater than the US average (15).
Major Disasters (Presidential) Declared: 12
Emergencies Declared: 11
Causes of natural disasters: Floods: 8, Hurricanes: 7, Storms: 5, Snows: 3, Snowstorms: 3, Winter Storms: 3, Blizzards: 2, Explosion: 1, Heavy Rain: 1, Snowfall: 1, Tropical Storm: 1, Wind: 1 (Note: some incidents may be assigned to more than one category).
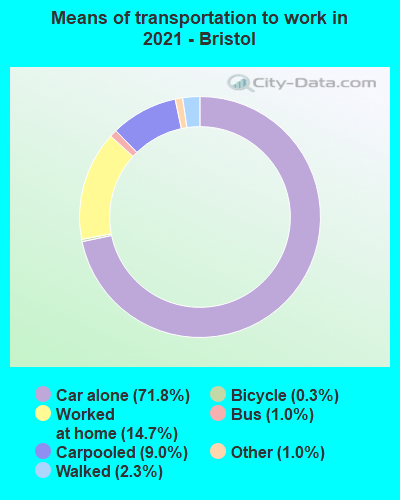
Means of transportation to work:
- Drove a car alone: 183,987 (72.9%)
- Carpooled: 24,423 (9.7%)
- Bus: 1,589 (0.6%)
- Long-distance train or commuter rail: 621 (0.2%)
- Ferryboat: 165 (0.1%)
- Taxicab, motorcycle, or other means: 3,120 (1.2%)
- Bicycle: 281 (0.1%)
- Walked: 3,969 (1.6%)
- Worked at home: 34,115 (13.5%)
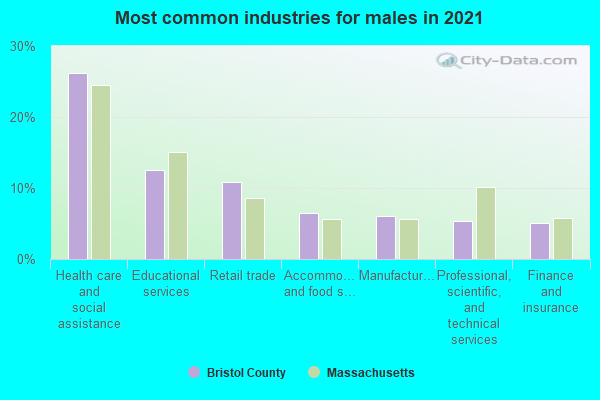
- Health care and social assistance (27%)
- Educational services (13%)
- Retail trade (10%)
- Professional, scientific, and technical services (8%)
- Accommodation and food services (7%)
- Manufacturing (7%)
- Finance and insurance (5%)

- Health care and social assistance (28%)
- Educational services (13%)
- Retail trade (10%)
- Professional, scientific, and technical services (9%)
- Accommodation and food services (7%)
- Manufacturing (7%)
- Finance and insurance (6%)
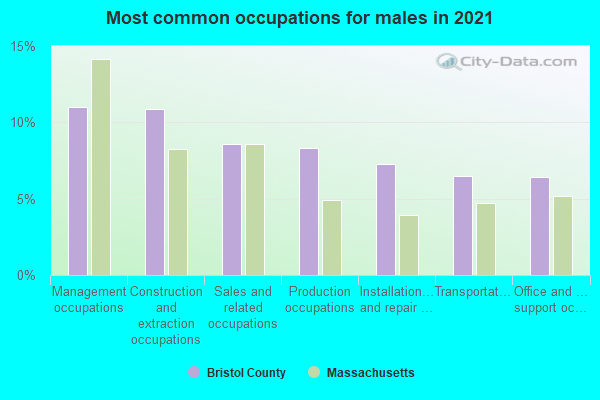
- Construction and extraction occupations (12%)
- Management occupations (12%)
- Sales and related occupations (10%)
- Production occupations (8%)
- Transportation occupations (6%)
- Installation, maintenance, and repair occupations (5%)
- Material moving occupations (5%)
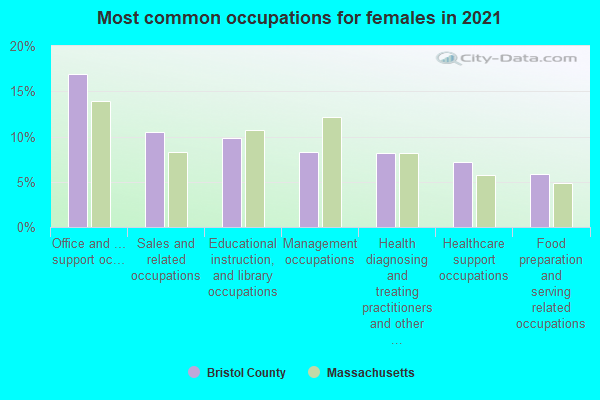
- Office and administrative support occupations (15%)
- Sales and related occupations (10%)
- Educational instruction, and library occupations (10%)
- Management occupations (9%)
- Business and financial operations occupations (7%)
- Healthcare support occupations (7%)
- Health diagnosing and treating practitioners and other technical occupations (6%)
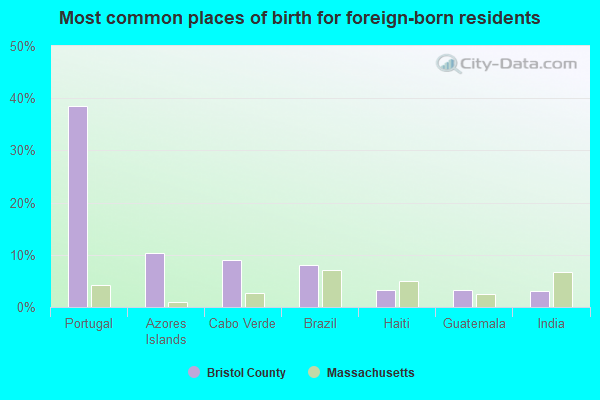
- Portugal (36%)
- Brazil (9%)
- Cabo Verde (8%)
- Azores Islands (7%)
- Guatemala (4%)
- Haiti (3%)
- India (3%)
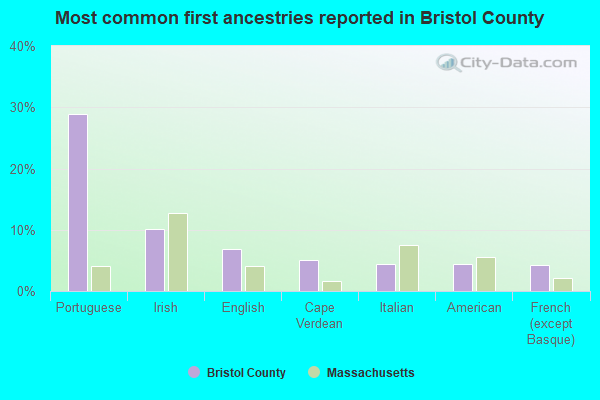
- Portuguese (30%)
- Irish (10%)
- English (6%)
- Italian (5%)
- Cape Verdean (4%)
- American (4%)
- French (except Basque) (4%)
People in group quarters in Bristol County, Massachusetts in 2010:
- 7,506 people in college/university student housing
- 4,394 people in nursing facilities/skilled-nursing facilities
- 1,318 people in local jails and other municipal confinement facilities
- 678 people in other noninstitutional facilities
- 640 people in group homes intended for adults
- 591 people in residential treatment centers for adults
- 168 people in mental (psychiatric) hospitals and psychiatric units in other hospitals
- 157 people in emergency and transitional shelters (with sleeping facilities) for people experiencing homelessness
- 127 people in group homes for juveniles (non-correctional)
- 98 people in residential treatment centers for juveniles (non-correctional)
- 98 people in residential schools for people with disabilities
- 77 people in workers' group living quarters and job corps centers
- 10 people in correctional facilities intended for juveniles
- 6 people in hospitals with patients who have no usual home elsewhere
People in group quarters in Bristol County, Massachusetts in 2000:
- 5,193 people in college dormitories (includes college quarters off campus)
- 5,051 people in nursing homes
- 1,058 people in local jails and other confinement facilities (including police lockups)
- 510 people in homes for the mentally retarded
- 419 people in other noninstitutional group quarters
- 309 people in homes or halfway houses for drug/alcohol abuse
- 255 people in homes for the mentally ill
- 218 people in religious group quarters
- 172 people in mental (psychiatric) hospitals or wards
- 108 people in residential treatment centers for emotionally disturbed children
- 105 people in other nonhousehold living situations
- 69 people in homes for abused, dependent, and neglected children
- 55 people in military ships
- 52 people in schools, hospitals, or wards for the intellectually disabled
- 36 people in other group homes
- 29 people in training schools for juvenile delinquents
- 14 people in unknown juvenile institutions
- 13 people in short-term care, detention or diagnostic centers for delinquent children
- 8 people in homes for the physically handicapped
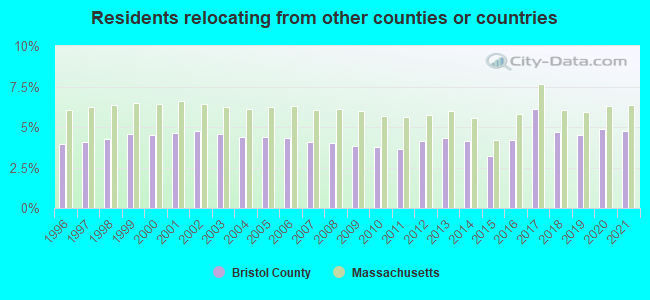
4.76% of this county's 2021 resident taxpayers lived in other counties in 2020 ($70,162 average adjusted gross income)
| Here: | 4.76% |
| Massachusetts average: | 6.35% |
0.01% of residents moved from foreign countries ($64 average AGI)
Bristol County: 0.01% Massachusetts average: 0.01%
2.95% relocated from other counties in Massachusetts ($43,024 average AGI)
1.80% relocated from other states ($27,074 average AGI)
Bristol County: 1.80% Massachusetts average: 2.58%
Top counties from which taxpayers relocated into this county between 2020 and 2021:
| from Plymouth County, MA | |
| from Norfolk County, MA | |
| from Providence County, RI | |
| from Suffolk County, MA | |
| from Middlesex County, MA | |
| from Worcester County, MA | |
| from Barnstable County, MA |
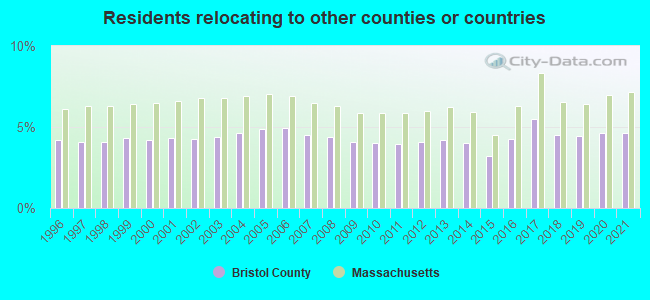
4.63% of this county's 2020 resident taxpayers moved to other counties in 2021 ($72,404 average adjusted gross income)
| Here: | 4.63% |
| Massachusetts average: | 7.18% |
0.01% of residents moved to foreign countries ($83 average AGI)
Bristol County: 0.01% Massachusetts average: 0.02%
2.14% relocated to other counties in Massachusetts ($33,174 average AGI)
2.48% relocated to other states ($39,147 average AGI)
Bristol County: 2.48% Massachusetts average: 3.43%
Top counties to which taxpayers relocated from this county between 2020 and 2021:
| to Plymouth County, MA | |
| to Providence County, RI | |
| to Norfolk County, MA | |
| to Suffolk County, MA | |
| to Middlesex County, MA | |
| to Worcester County, MA | |
| to Barnstable County, MA |
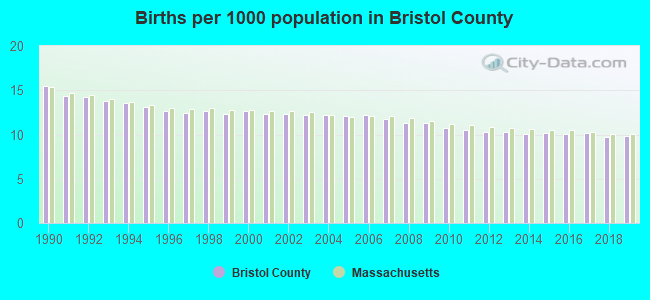
Births per 1000 population from 1990 to 1999: 13.5
Births per 1000 population from 2000 to 2009: 12.0
Births per 1000 population from 2010 to 2022: 8.6
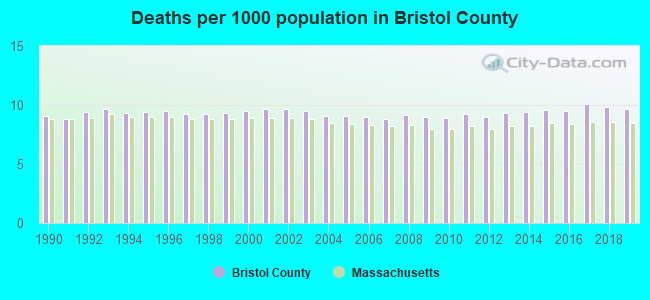
Deaths per 1000 population from 1990 to 1999: 9.3
Deaths per 1000 population from 2000 to 2009: 9.3
Deaths per 1000 population from 2010 to 2020: 9.6
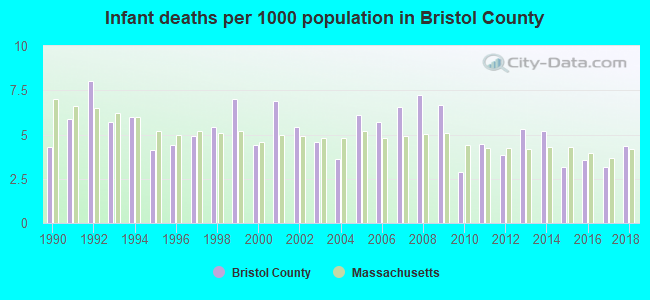
Infant deaths per 1000 live births from 1990 to 1999: 5.6
Infant deaths per 1000 live births from 2000 to 2009: 5.7
Infant deaths per 1000 live births from 2010 to 2021: 4.2
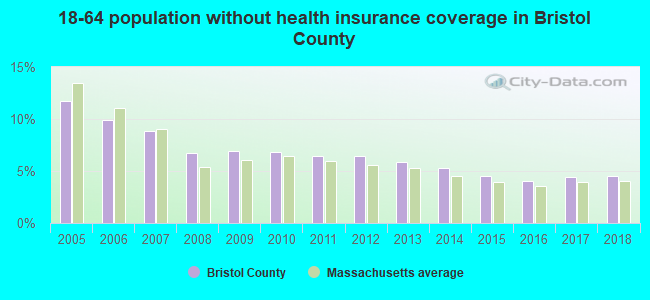
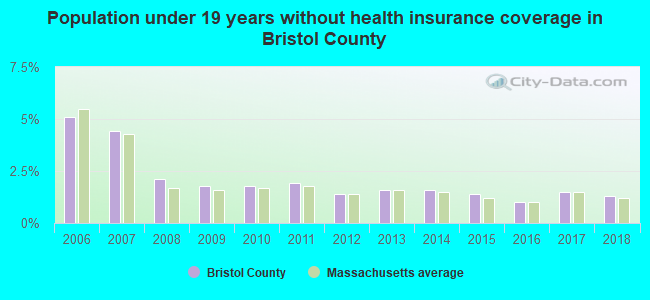
Persons under 19 years old without health insurance coverage in 2018: 1.3%
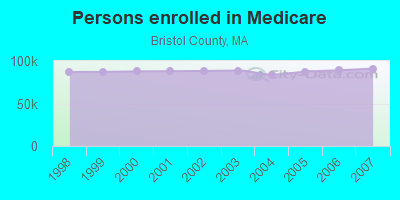
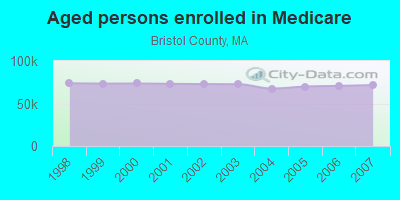
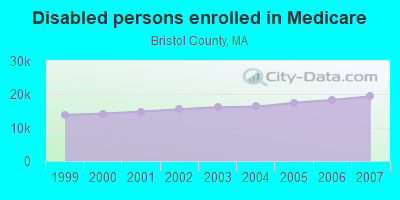
Persons enrolled in hospital insurance and/or supplemental medical insurance (Medicare) in July 1, 2007: 91,057 (71,631 aged, 19,426 disabled)
Children under 18 without health insurance coverage in 2007: 6,504 (5%)
Most common underlying causes of death in Bristol County, Massachusetts in 1999 - 2019:
- Atherosclerotic heart disease (8,382)
- Bronchus or lung, unspecified - Malignant neoplasms (6,689)
- Acute myocardial infarction, unspecified (5,599)
- Unspecified dementia (4,921)
- Chronic obstructive pulmonary disease, unspecified (3,982)
- Pneumonia, unspecified (3,172)
- Alzheimer disease, unspecified (2,767)
- Congestive heart failure (2,761)
- Stroke, not specified as haemorrhage or infarction (2,440)
- Atherosclerotic cardiovascular disease, so described (2,228)
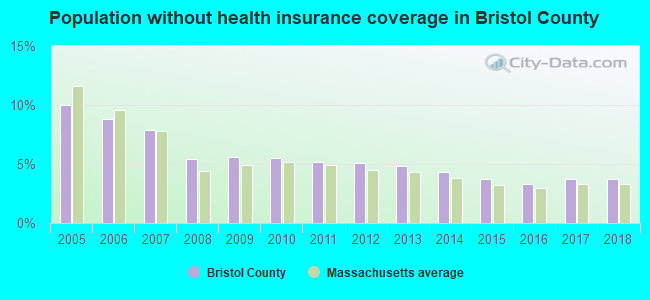
Population without health insurance coverage in 2000: 9%
Children under 18 without health insurance coverage in 2000: 4%
Short term general hospital admissions per 100,000 population in 2004: 10,199
Short term general hospital beds per 100,000 population in 2004: 215
Emergency room visits per 100,000 population in 2004: 54,087
General practice office based MDs per 100,000 population in 2005: 1,216
Medical specialist MDs per 100,000 population in 2005: 874
Dentists per 100,000 population in 1998: 21
Total births per 100,000 population, July 2005 - July 2006 : 40
Total deaths per 100,000 population, July 2005 - July 2006: 98
Limited-service eating places per 100,000 population in 2005 : 16
Beer, wine & liquor stores per 100,000 population in 2005: 1
Homicides per 1,000,000 population from 2000 to 2006: 26.1. This is less than state average.
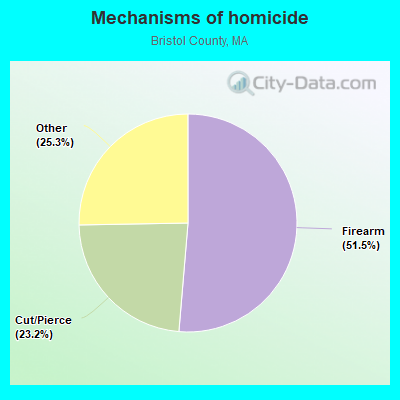
- Firearm - 13.4
- Cut/Pierce - 6.1
- Other - 6.6
Suicides per 1,000,000 population from 2000 to 2006: 62.7. This is less than state average.
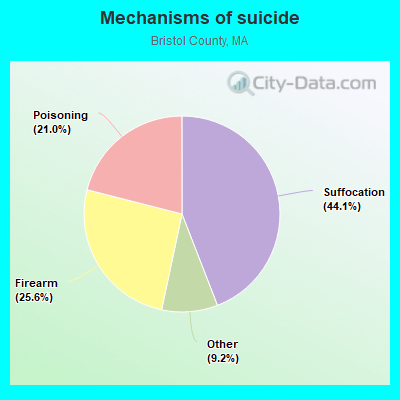
- Suffocation - 27.7
- Firearm - 16.1
- Poisoning - 13.2
- Other - 5.8
Household type by relationship:
Households: 580,068- Male householders: 106,124 (30,032 living alone), Female householders: 127,070 (36,573 living alone)
102,626 spouses (100,918 opposite-sex spouses), 21,253 unmarried partners, (20,473 opposite-sex unmarried partners), 160,527 children (153,052 natural, 4,392 adopted, 3,083 stepchildren), 13,380 grandchildren, 3,234 brothers or sisters, 7,936 parents, 1,105 foster children, 10,121 other relatives, 12,735 non-relatives
- In group quarters: 13,957
Size of family households: 63,191 2-persons, 34,946 3-persons, 31,761 4-persons, 12,308 5-persons, 3,947 6-persons, 2,813 7-or-more-persons.
Size of nonfamily households: 66,605 1-person, 15,705 2-persons, 1,308 3-persons, 447 4-persons, 122 5-persons, 41 6-persons.
61,739 married couples with children.
39,632 single-parent households (9,078 men, 30,554 women).
79.3% of residents of Bristol speak English at home.
5.9% of residents speak Spanish at home (64% speak English very well, 10% speak English well, 13% speak English not well, 13% don't speak English at all).
12.9% of residents speak other Indo-European language at home (63% speak English very well, 20% speak English well, 11% speak English not well, 6% don't speak English at all).
1.2% of residents speak Asian or Pacific Island language at home (59% speak English very well, 18% speak English well, 18% speak English not well, 4% don't speak English at all).
0.8% of residents speak other language at home (57% speak English very well, 26% speak English well, 4% speak English not well, 13% don't speak English at all).
In fiscal year 2004:
Federal Government expenditure: $3,525,670,000 ($6,432 per capita)
Department of Defense expenditure: $535,533,000
Federal direct payments to individuals for retirement and disability: $1,224,078,000
Federal other direct payments to individuals: $786,274,000
Federal direct payments not to individuals: $9,562,000
Federal grants: $887,355,000
Federal procurement contracts: $519,847,000 ($483,440,000 Department of Defense)
Federal salaries and wages: $98,554,000 ($18,407,000 Department of Defense)
Federal Government direct loans: $78,545,000
Federal guaranteed/insured loans: $300,271,000
Federal Government insurance: $487,292,000
Population change from April 1, 2000 to July 1, 2005:
Births: 34,810| Here: | 64 per 1000 residents |
| State: | 67 per 1000 residents |
Deaths: 27,232
| Here: | 50 per 1000 residents |
| State: | 46 per 1000 residents |
Net international migration: +4,320
| Here: | +8 per 1000 residents |
| State: | +25 per 1000 residents |
Net internal migration: +403
| Here: | |
| State: |
Total withdrawal of fresh water for public supply: 57.79 millions of gallons per day (29% from ground, 71% from surface)
| Here: | 6.4 |
| State: | 6.5 |
| Here: | 4.4 |
| State: | 4.0 |
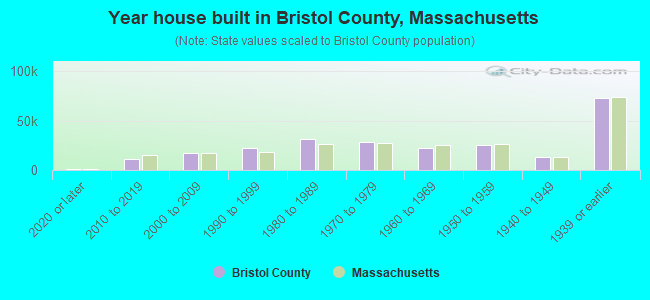
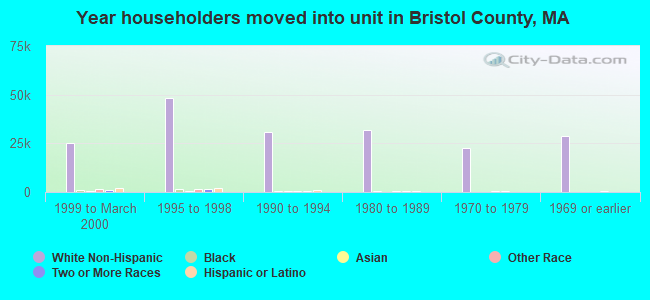
- Year house built in Bristol County, Massachusetts
- 1,1492020 or later
- 11,6582010 to 2019
- 15,4972000 to 2009
- 20,8751990 to 1999
- 29,1571980 to 1989
- 30,0691970 to 1979
- 22,1321960 to 1969
- 25,2801950 to 1959
- 12,5701940 to 1949
- 76,6571939 or earlier
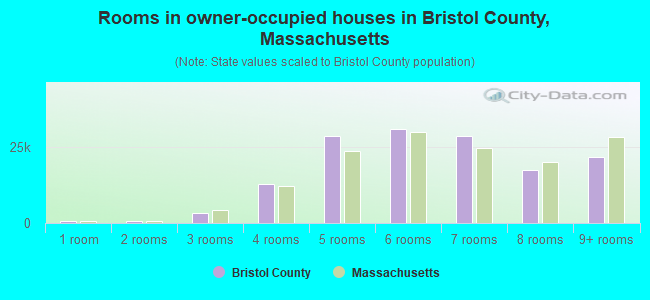
- Rooms in owner-occupied houses in Bristol County, Massachusetts
- 3251 room
- 4042 rooms
- 2,6673 rooms
- 12,5064 rooms
- 26,6535 rooms
- 34,2726 rooms
- 26,5037 rooms
- 19,8638 rooms
- 21,0099+ rooms
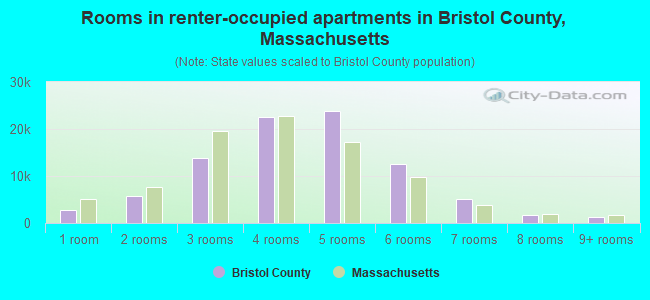
- Rooms in renter-occupied apartments in Bristol County, Massachusetts
- 2,7471 room
- 5,5992 rooms
- 14,7013 rooms
- 23,4644 rooms
- 20,3885 rooms
- 13,1376 rooms
- 4,7097 rooms
- 2,7748 rooms
- 1,4739+ rooms
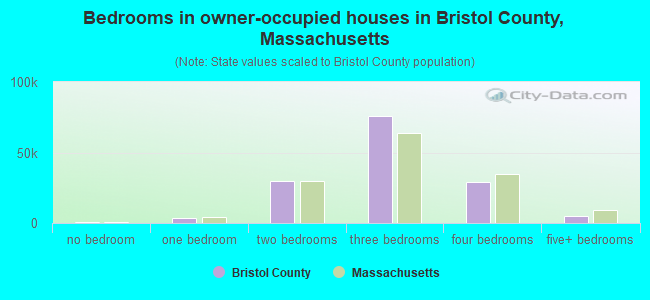
- Bedrooms in owner-occupied houses in Bristol County, Massachusetts
- 383no bedroom
- 3,9941 bedroom
- 28,0222 bedrooms
- 73,0113 bedrooms
- 33,0624 bedrooms
- 5,7305+ bedrooms
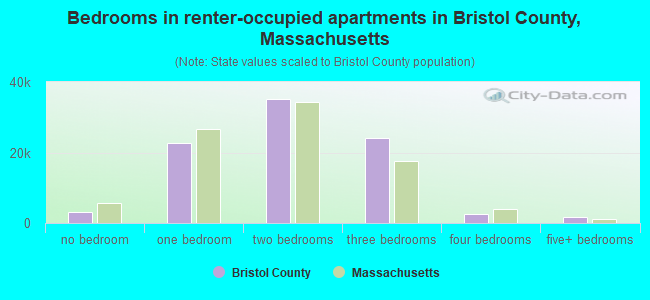
- Bedrooms in renter-occupied apartments in Bristol County, Massachusetts
- 2,950no bedroom
- 22,4881 bedroom
- 36,2212 bedrooms
- 24,2483 bedrooms
- 2,7834 bedrooms
- 3025+ bedrooms
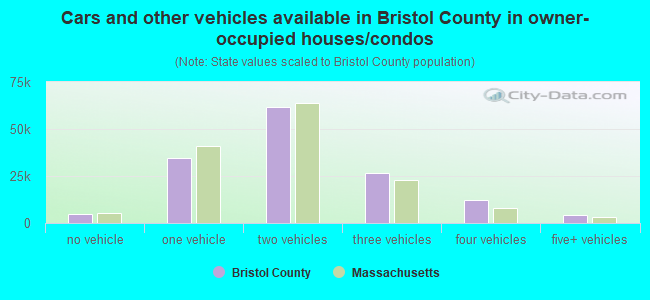
- Cars and other vehicles available in Bristol County in owner-occupied houses/condos
- 4,409no vehicle
- 34,8851 vehicle
- 62,9072 vehicles
- 25,5553 vehicles
- 11,8684 vehicles
- 4,5785+ vehicles
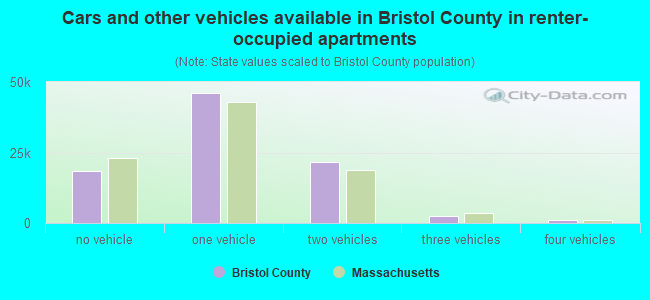
- Cars and other vehicles available in Bristol County in renter-occupied apartments
- 17,455no vehicle
- 44,0311 vehicle
- 22,6892 vehicles
- 3,7653 vehicles
- 9484 vehicles
- 1045+ vehicles
90.9% of Bristol County residents lived in the same house 1 years ago.
Out of people who lived in different houses, 36% lived in this county.
Out of people who lived in different counties, 61% lived in Massachusetts.
| Bristol County: | 90.9% |
| State average: | 87.7% |
Place of birth for U.S.-born residents:
- This state: 378,920
- Other state: 106,147
- Northeast: 76,115
- Midwest: 7,958
- South: 15,147
- West: 6,927
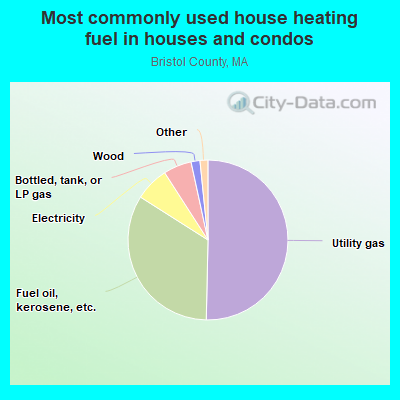
- 51.5%Utility gas
- 33.5%Fuel oil, kerosene, etc.
- 6.5%Electricity
- 5.3%Bottled, tank, or LP gas
- 1.7%Wood
- 1.0%Other fuel
- 0.3%Solar energy
- 0.1%Coal or coke
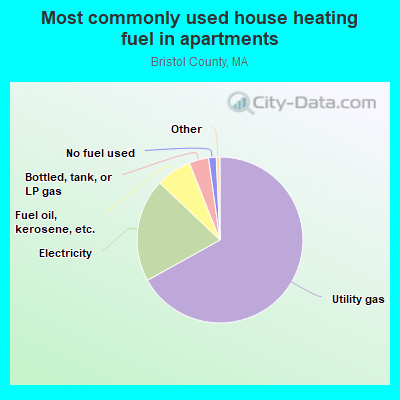
- 64.4%Utility gas
- 23.1%Electricity
- 7.5%Fuel oil, kerosene, etc.
- 4.1%Bottled, tank, or LP gas
- 0.5%Other fuel
- 0.3%Solar energy
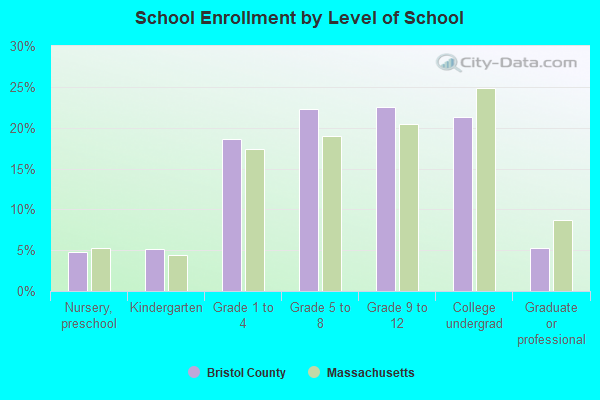
Private vs. public school enrollment:
| Here: | 9.9% |
| Massachusetts: | 10.3% |
| Here: | 9.8% |
| Massachusetts: | 12.3% |
| Here: | 38.5% |
| Massachusetts: | 51.2% |

Bristol County government finances - Expenditure in 2018:
- Bond Funds - Cash and Securities: $424,000
- Charges - Other: $4,250,000
Other: $2,466,000
Elementary and Secondary Education School Lunch: $61,000
Elementary and Secondary Education School Lunch: $35,000
- Construction - Elementary and Secondary Education: $2,000
- Current Operations - Elementary and Secondary Education: $9,153,000
Elementary and Secondary Education: $8,986,000
General - Other: $8,085,000
General - Other: $5,253,000
Central Staff Services: $4,588,000
Central Staff Services: $4,009,000
General Public Buildings: $1,817,000
General Public Buildings: $1,631,000
Financial Administration: $435,000
Financial Administration: $399,000
Judicial and Legal Services: $362,000
- Federal Intergovernmental - Other: $504,000
- General - Interest on Debt: $56,000
Interest on Debt: $36,000
- Intergovernmental to Local - Other - Elementary and Secondary Education: $1,000
- Local Intergovernmental - Education: $2,701,000
Education: $2,137,000
- Long Term Debt - Beginning Outstanding - Unspecified Public Purpose: $924,000
Outstanding Unspecified Public Purpose: $880,000
Beginning Outstanding - Unspecified Public Purpose: $813,000
Outstanding Unspecified Public Purpose: $763,000
Retired Unspecified Public Purpose: $50,000
Retired Unspecified Public Purpose: $44,000
- Miscellaneous - General Revenue - Other: $288,000
Interest Earnings: $203,000
Interest Earnings: $155,000
General Revenue - Other: $138,000
Donations From Private Sources: $4,000
- Other Capital Outlay - Elementary and Secondary Education: $986,000
Elementary and Secondary Education: $234,000
- Other Funds - Cash and Securities: $27,047,000
Cash and Securities: $5,562,000
- State Intergovernmental - Education: $16,396,000
Education: $4,677,000
General Local Government Support: $1,391,000
General Local Government Support: $224,000
- Tax - Property: $10,353,000
Property: $10,113,000
Other Selective Sales: $3,970,000
Other Selective Sales: $3,172,000
- Total Salaries and Wages: $6,722,000
: $5,446,000
Bristol County government finances - Revenue in 2018:
- Bond Funds - Cash and Securities: $424,000
- Charges - Other: $4,250,000
Other: $2,466,000
Elementary and Secondary Education School Lunch: $61,000
Elementary and Secondary Education School Lunch: $35,000
- Construction - Elementary and Secondary Education: $2,000
- Current Operations - Elementary and Secondary Education: $9,153,000
Elementary and Secondary Education: $8,986,000
General - Other: $8,085,000
General - Other: $5,253,000
Central Staff Services: $4,588,000
Central Staff Services: $4,009,000
General Public Buildings: $1,817,000
General Public Buildings: $1,631,000
Financial Administration: $435,000
Financial Administration: $399,000
Judicial and Legal Services: $362,000
- Federal Intergovernmental - Other: $504,000
- General - Interest on Debt: $56,000
Interest on Debt: $36,000
- Intergovernmental to Local - Other - Elementary and Secondary Education: $1,000
- Local Intergovernmental - Education: $2,701,000
Education: $2,137,000
- Long Term Debt - Beginning Outstanding - Unspecified Public Purpose: $924,000
Outstanding Unspecified Public Purpose: $880,000
Beginning Outstanding - Unspecified Public Purpose: $813,000
Outstanding Unspecified Public Purpose: $763,000
Retired Unspecified Public Purpose: $50,000
Retired Unspecified Public Purpose: $44,000
- Miscellaneous - General Revenue - Other: $288,000
Interest Earnings: $203,000
Interest Earnings: $155,000
General Revenue - Other: $138,000
Donations From Private Sources: $4,000
- Other Capital Outlay - Elementary and Secondary Education: $986,000
Elementary and Secondary Education: $234,000
- Other Funds - Cash and Securities: $27,047,000
Cash and Securities: $5,562,000
- State Intergovernmental - Education: $16,396,000
Education: $4,677,000
General Local Government Support: $1,391,000
General Local Government Support: $224,000
- Tax - Property: $10,353,000
Property: $10,113,000
Other Selective Sales: $3,970,000
Other Selective Sales: $3,172,000
- Total Salaries and Wages: $6,722,000
: $5,446,000
Bristol County government finances - Debt in 2018:
- Bond Funds - Cash and Securities: $424,000
- Charges - Other: $4,250,000
Other: $2,466,000
Elementary and Secondary Education School Lunch: $61,000
Elementary and Secondary Education School Lunch: $35,000
- Construction - Elementary and Secondary Education: $2,000
- Current Operations - Elementary and Secondary Education: $9,153,000
Elementary and Secondary Education: $8,986,000
General - Other: $8,085,000
General - Other: $5,253,000
Central Staff Services: $4,588,000
Central Staff Services: $4,009,000
General Public Buildings: $1,817,000
General Public Buildings: $1,631,000
Financial Administration: $435,000
Financial Administration: $399,000
Judicial and Legal Services: $362,000
- Federal Intergovernmental - Other: $504,000
- General - Interest on Debt: $56,000
Interest on Debt: $36,000
- Intergovernmental to Local - Other - Elementary and Secondary Education: $1,000
- Local Intergovernmental - Education: $2,701,000
Education: $2,137,000
- Long Term Debt - Beginning Outstanding - Unspecified Public Purpose: $924,000
Outstanding Unspecified Public Purpose: $880,000
Beginning Outstanding - Unspecified Public Purpose: $813,000
Outstanding Unspecified Public Purpose: $763,000
Retired Unspecified Public Purpose: $50,000
Retired Unspecified Public Purpose: $44,000
- Miscellaneous - General Revenue - Other: $288,000
Interest Earnings: $203,000
Interest Earnings: $155,000
General Revenue - Other: $138,000
Donations From Private Sources: $4,000
- Other Capital Outlay - Elementary and Secondary Education: $986,000
Elementary and Secondary Education: $234,000
- Other Funds - Cash and Securities: $27,047,000
Cash and Securities: $5,562,000
- State Intergovernmental - Education: $16,396,000
Education: $4,677,000
General Local Government Support: $1,391,000
General Local Government Support: $224,000
- Tax - Property: $10,353,000
Property: $10,113,000
Other Selective Sales: $3,970,000
Other Selective Sales: $3,172,000
- Total Salaries and Wages: $6,722,000
: $5,446,000
Bristol County government finances - Cash and Securities in 2018:
- Bond Funds - Cash and Securities: $424,000
- Charges - Other: $4,250,000
Other: $2,466,000
Elementary and Secondary Education School Lunch: $61,000
Elementary and Secondary Education School Lunch: $35,000
- Construction - Elementary and Secondary Education: $2,000
- Current Operations - Elementary and Secondary Education: $9,153,000
Elementary and Secondary Education: $8,986,000
General - Other: $8,085,000
General - Other: $5,253,000
Central Staff Services: $4,588,000
Central Staff Services: $4,009,000
General Public Buildings: $1,817,000
General Public Buildings: $1,631,000
Financial Administration: $435,000
Financial Administration: $399,000
Judicial and Legal Services: $362,000
- Federal Intergovernmental - Other: $504,000
- General - Interest on Debt: $56,000
Interest on Debt: $36,000
- Intergovernmental to Local - Other - Elementary and Secondary Education: $1,000
- Local Intergovernmental - Education: $2,701,000
Education: $2,137,000
- Long Term Debt - Beginning Outstanding - Unspecified Public Purpose: $924,000
Outstanding Unspecified Public Purpose: $880,000
Beginning Outstanding - Unspecified Public Purpose: $813,000
Outstanding Unspecified Public Purpose: $763,000
Retired Unspecified Public Purpose: $50,000
Retired Unspecified Public Purpose: $44,000
- Miscellaneous - General Revenue - Other: $288,000
Interest Earnings: $203,000
Interest Earnings: $155,000
General Revenue - Other: $138,000
Donations From Private Sources: $4,000
- Other Capital Outlay - Elementary and Secondary Education: $986,000
Elementary and Secondary Education: $234,000
- Other Funds - Cash and Securities: $27,047,000
Cash and Securities: $5,562,000
- State Intergovernmental - Education: $16,396,000
Education: $4,677,000
General Local Government Support: $1,391,000
General Local Government Support: $224,000
- Tax - Property: $10,353,000
Property: $10,113,000
Other Selective Sales: $3,970,000
Other Selective Sales: $3,172,000
- Total Salaries and Wages: $6,722,000
: $5,446,000
Supplemental Security Income (SSI) in 2006:
- Total number of recipients: 18,519
- Number of aged recipients: 4,471
- Number of blind and disabled recipients: 14,048
- Number of recipients under 18: 1,646
- Number of recipients between 18 and 64: 12,044
- Number of recipients older than 64: 4,829
- Number of recipients also receiving OASDI: 8,150
- Amount of payments (thousands of dollars): 8,700
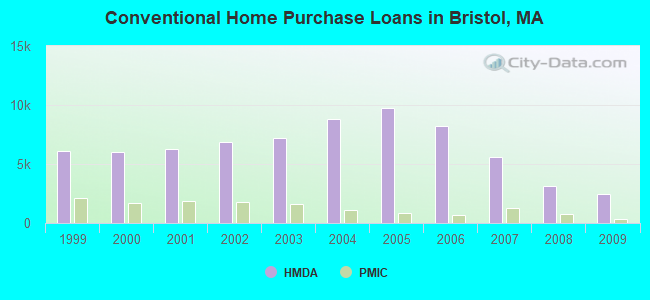
| Home Mortgage Disclosure Act Aggregated Statistics For Year 2009 (Based on 116 full tracts) | ||||||||||||||
| A) FHA, FSA/RHS & VA Home Purchase Loans | B) Conventional Home Purchase Loans | C) Refinancings | D) Home Improvement Loans | E) Loans on Dwellings For 5+ Families | F) Non-occupant Loans on < 5 Family Dwellings (A B C & D) | G) Loans On Manufactured Home Dwelling (A B C & D) | ||||||||
|---|---|---|---|---|---|---|---|---|---|---|---|---|---|---|
| Number | Average Value | Number | Average Value | Number | Average Value | Number | Average Value | Number | Average Value | Number | Average Value | Number | Average Value | |
| LOANS ORIGINATED | 1,630 | $223,846 | 2,492 | $204,402 | 13,204 | $216,643 | 1,028 | $107,792 | 83 | $1,154,373 | 660 | $203,047 | 47 | $57,085 |
| APPLICATIONS APPROVED, NOT ACCEPTED | 91 | $214,000 | 160 | $206,300 | 861 | $229,951 | 79 | $84,532 | 4 | $4,037,000 | 40 | $180,975 | 10 | $63,000 |
| APPLICATIONS DENIED | 313 | $199,748 | 483 | $157,642 | 3,629 | $235,859 | 342 | $91,371 | 21 | $313,381 | 208 | $181,918 | 32 | $52,031 |
| APPLICATIONS WITHDRAWN | 180 | $210,356 | 309 | $206,068 | 2,169 | $230,793 | 94 | $133,766 | 8 | $1,521,500 | 96 | $216,573 | 5 | $67,200 |
| FILES CLOSED FOR INCOMPLETENESS | 66 | $193,788 | 81 | $221,556 | 779 | $235,580 | 43 | $125,977 | 1 | $162,000 | 25 | $198,760 | 2 | $71,000 |
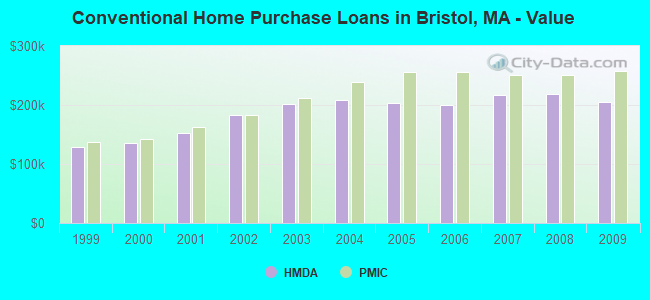
| Private Mortgage Insurance Companies Aggregated Statistics For Year 2009 (Based on 102 full tracts) | ||||||||
| A) Conventional Home Purchase Loans | B) Refinancings | C) Non-occupant Loans on < 5 Family Dwellings (A & B) | D) Loans On Manufactured Home Dwelling (A & B) | |||||
|---|---|---|---|---|---|---|---|---|
| Number | Average Value | Number | Average Value | Number | Average Value | Number | Average Value | |
| LOANS ORIGINATED | 324 | $256,796 | 243 | $277,119 | 6 | $180,167 | 0 | $0 |
| APPLICATIONS APPROVED, NOT ACCEPTED | 116 | $250,974 | 110 | $274,073 | 1 | $196,000 | 1 | $242,000 |
| APPLICATIONS DENIED | 79 | $251,089 | 85 | $275,753 | 0 | $0 | 0 | $0 |
| APPLICATIONS WITHDRAWN | 25 | $271,160 | 51 | $253,902 | 1 | $136,000 | 0 | $0 |
| FILES CLOSED FOR INCOMPLETENESS | 11 | $245,273 | 3 | $218,667 | 1 | $183,000 | 0 | $0 |
| Most common first names in Bristol County, MA among deceased individuals | ||
| Name | Count | Lived (average) |
|---|---|---|
| Mary | 8,405 | 81.6 years |
| John | 5,832 | 74.9 years |
| Joseph | 5,731 | 75.4 years |
| Manuel | 3,962 | 76.1 years |
| William | 3,073 | 74.6 years |
| Maria | 2,959 | 80.1 years |
| George | 2,304 | 74.6 years |
| James | 2,203 | 72.8 years |
| Edward | 1,875 | 73.8 years |
| Alice | 1,853 | 80.6 years |
| Most common last names in Bristol County, MA among deceased individuals | ||
| Last name | Count | Lived (average) |
|---|---|---|
| Medeiros | 1,744 | 75.5 years |
| Souza | 1,307 | 75.9 years |
| Costa | 1,077 | 75.6 years |
| Mello | 1,011 | 76.0 years |
| Perry | 1,007 | 76.4 years |
| Ferreira | 915 | 75.4 years |
| Smith | 906 | 77.1 years |
| Silva | 892 | 77.0 years |
| Sylvia | 892 | 76.3 years |
| Cabral | 815 | 76.2 years |
| Businesses in Bristol County, MA | ||||
| Name | Count | Name | Count | |
|---|---|---|---|---|
| 7-Eleven | 12 | Kohl's | 4 | |
| ALDO | 1 | Kroger | 2 | |
| AMF Bowling | 1 | La-Z-Boy | 3 | |
| AT&T | 11 | Lane Bryant | 3 | |
| Abercrombie & Fitch | 1 | Lane Furniture | 4 | |
| Abercrombie Kids | 1 | LensCrafters | 4 | |
| Ace Hardware | 7 | Little Caesars Pizza | 3 | |
| Advance Auto Parts | 9 | Lowe's | 4 | |
| Aeropostale | 4 | Macy's | 4 | |
| American Eagle Outfitters | 4 | Marriott | 3 | |
| Ann Taylor | 2 | Marshalls | 4 | |
| Applebee's | 5 | MasterBrand Cabinets | 50 | |
| Ashley Furniture | 7 | Mazda | 3 | |
| Audi | 1 | McDonald's | 22 | |
| AutoZone | 10 | Men's Wearhouse | 5 | |
| Avenue | 3 | Motel 6 | 1 | |
| Bakers | 1 | Motherhood Maternity | 6 | |
| Barnes & Noble | 1 | New Balance | 7 | |
| Baskin-Robbins | 1 | New York & Co | 2 | |
| Bath & Body Works | 5 | Nike | 14 | |
| Bed Bath & Beyond | 4 | Nissan | 2 | |
| Best Western | 2 | OfficeMax | 1 | |
| Blockbuster | 1 | Old Country Buffet | 2 | |
| Brookstone | 1 | Old Navy | 3 | |
| Budget Car Rental | 1 | Olive Garden | 3 | |
| Burger King | 13 | Outback | 1 | |
| CVS | 23 | Outback Steakhouse | 1 | |
| Casual Male XL | 2 | Pac Sun | 4 | |
| Charlotte Russe | 2 | Panera Bread | 4 | |
| Chevrolet | 3 | Papa John's Pizza | 3 | |
| Chico's | 1 | Payless | 11 | |
| Chipotle | 1 | Penske | 4 | |
| Circle K | 1 | PetSmart | 1 | |
| Cold Stone Creamery | 2 | Pier 1 Imports | 4 | |
| Coldwater Creek | 1 | Pizza Hut | 2 | |
| Comfort Inn | 2 | Popeyes | 1 | |
| Curves | 6 | Qdoba Mexican Grill | 1 | |
| Dairy Queen | 2 | Quality | 1 | |
| Days Inn | 2 | Quiznos | 2 | |
| Deb | 3 | RadioShack | 12 | |
| Decora Cabinetry | 9 | Ramada | 1 | |
| Domino's Pizza | 9 | Raymour & Flanigan | 2 | |
| DressBarn | 5 | Red Roof Inn | 1 | |
| Dressbarn | 4 | Rite Aid | 22 | |
| Dunkin Donuts | 108 | Ruby Tuesday | 4 | |
| Express | 4 | Rue21 | 2 | |
| Extended Stay America | 1 | Ryder Rental & Truck Leasing | 1 | |
| Famous Footwear | 4 | Sam's Club | 1 | |
| Fashion Bug | 4 | Sears | 11 | |
| FedEx | 62 | Shaw's | 7 | |
| Finish Line | 4 | Spencer Gifts | 4 | |
| Firestone Complete Auto Care | 5 | Sprint Nextel | 12 | |
| Foot Locker | 3 | Staples | 5 | |
| Ford | 5 | Starbucks | 4 | |
| Forever 21 | 2 | Stop & Shop | 11 | |
| Fredericks Of Hollywood | 1 | Subaru | 1 | |
| GNC | 13 | Subway | 34 | |
| GameStop | 13 | Super 8 | 1 | |
| Gap | 2 | T-Mobile | 19 | |
| Gymboree | 2 | T.G.I. Driday's | 5 | |
| H&M | 2 | T.J.Maxx | 5 | |
| H&R Block | 18 | Taco Bell | 6 | |
| Hilton | 4 | Target | 5 | |
| Holiday Inn | 3 | The Limited | 1 | |
| Hollister Co. | 3 | Torrid | 2 | |
| Home Depot | 5 | Toyota | 3 | |
| Honda | 3 | Toys"R"Us | 6 | |
| Hot Topic | 3 | True Value | 5 | |
| Hyundai | 4 | U-Haul | 18 | |
| IHOP | 2 | UPS | 66 | |
| JCPenney | 3 | Verizon Wireless | 9 | |
| JoS. A. Bank | 1 | Victoria's Secret | 4 | |
| Jones New York | 6 | Volkswagen | 3 | |
| Journeys | 3 | Walgreens | 12 | |
| Justice | 5 | Walmart | 7 | |
| KFC | 6 | Wendy's | 14 | |
| Kincaid | 1 | Wet Seal | 2 | |
| Kmart | 3 | World Gym | 1 | |
| Knights Inn | 1 | YMCA | 11 | |
Bristol County on our top lists:
- #14 on the list of "Top 101 counties with the lowest percentage of residents that keep firearms around their homes"
- #29 on the list of "Top 101 counties with the lowest percentage of residents relocating to foreign countries in 2011 (pop. 50,000+)"
- #32 on the list of "Top 101 counties with the most Catholic congregations"
- #32 on the list of "Top 101 counties with the most Catholic congregations (pop. 50,000+)"
- #34 on the list of "Top 101 counties with the highest percentage of residents that smoked 100+ cigarettes in their lives"
- #41 on the list of "Top 101 counties with the most Catholic adherents"
- #41 on the list of "Top 101 counties with the most Catholic adherents (pop. 50,000+)"
- #45 on the list of "Top 101 counties with the lowest percentage of residents that exercised in the past month"
- #46 on the list of "Top 101 counties with the lowest percentage of residents relocating to other counties in 2011 (pop. 50,000+)"
- #47 on the list of "Top 101 counties with the lowest percentage of residents relocating from other counties between 2010 and 2011 (pop. 50,000+)"
- #61 on the list of "Top 101 counties with the worst general health status score of residents (1-5), 3 years of data"
- #64 on the list of "Top 101 counties with the lowest number of infant deaths per 1000 residents 2007-2013 (pop. 50,000+)"
- #66 on the list of "Top 101 counties with the lowest percentage of residents relocating to other counties in 2011"
- #69 on the list of "Top 101 counties with the lowest percentage of residents relocating to foreign countries in 2011"
- #78 on the list of "Top 101 counties with the lowest percentage of residents relocating from other counties between 2010 and 2011"
- #79 on the list of "Top 101 counties with the lowest percentage of residents that visited a dentist within the past year"
- #99 on the list of "Top 101 counties with the largest decrease in the number of births per 1000 residents 2000-2006 to 2007-2013 (pop 50,000+)"
- #101 on the list of "Top 101 counties with the lowest number of births per 1000 residents 2007-2013"
- #101 on the list of "Top 101 counties with the lowest number of births per 1000 residents 2007-2013 (pop 50,000+)"