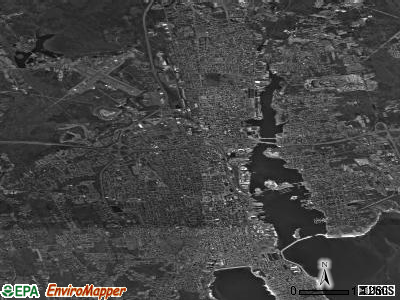
New Bedford, Massachusetts
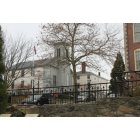
New Bedford: Whaling Museum at the National Historic Park
New Bedford: New Bedford Harbor/ Fairhaven Bridge

New Bedford: Palmer's Island Lighthouse

New Bedford: Fort Tabor Park

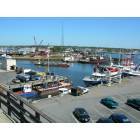
New Bedford: New Bedford Harbor
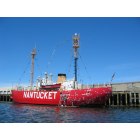
New Bedford: Nantucket Ship being painted in the New Bedford Harbor
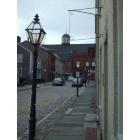
New Bedford: Johnny Cake Hill
New Bedford: Whaling Museum
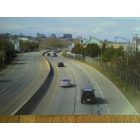
New Bedford: downtown looking from south to north - Rte.18
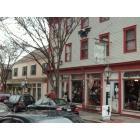
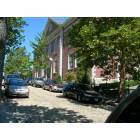
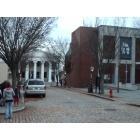
New Bedford: Whaling District
New Bedford: Whaling District streetscape
- see
25
more - add
your
Submit your own pictures of this city and show them to the world
- OSM Map
- General Map
- Google Map
- MSN Map

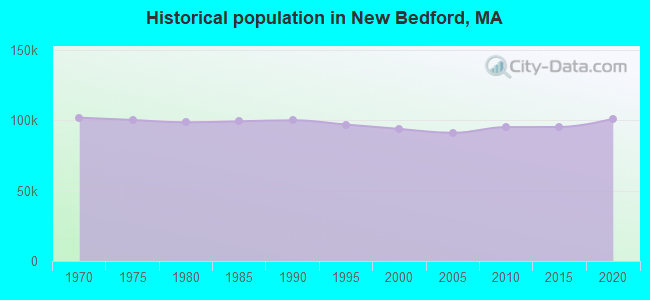
Population change since 2000: +7.4%
 |
| Males: 50,670 | |
| Females: 50,012 |
| Median resident age: | 38.9 years |
| Massachusetts median age: | 40.3 years |
Zip codes: 02740, 02744, 02745, 02746.
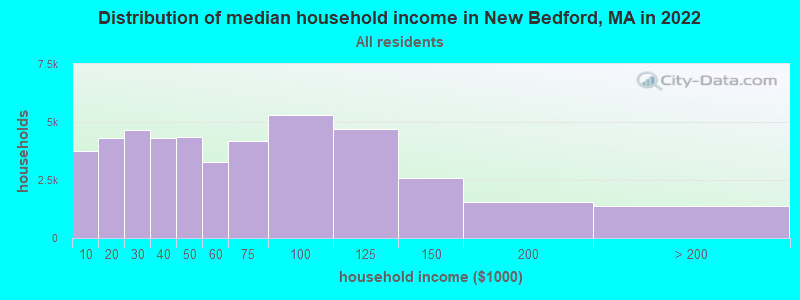
New Bedford Zip Code Map| New Bedford: | $53,024 |
| MA: | $94,488 |
Estimated per capita income in 2022: $29,669 (it was $15,602 in 2000)
New Bedford city income, earnings, and wages data
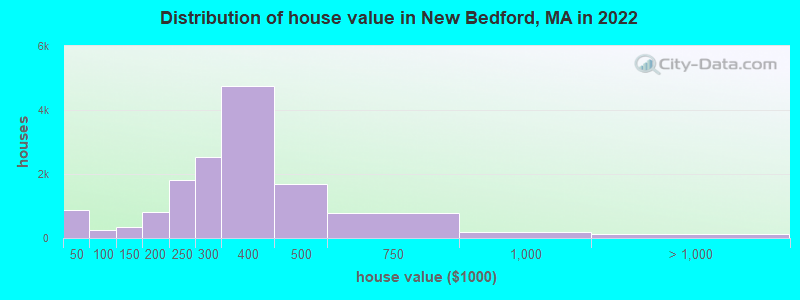
Estimated median house or condo value in 2022: $337,200 (it was $113,500 in 2000)
| New Bedford: | $337,200 |
| MA: | $534,700 |
Mean prices in 2022: all housing units: $313,586; detached houses: $338,047; townhouses or other attached units: $182,958; in 2-unit structures: $245,790; in 3-to-4-unit structures: $306,078; in 5-or-more-unit structures: $234,081
Median gross rent in 2022: $1,037.
(15.9% for White Non-Hispanic residents, 21.6% for Black residents, 31.5% for Hispanic or Latino residents, 28.7% for American Indian residents, 29.4% for other race residents, 22.4% for two or more races residents)
Detailed information about poverty and poor residents in New Bedford, MA


Compare current foreclosures in New Bedford, MA:
| Photo | Address | Area | Beds / Baths | Price | Details |
|---|---|---|---|---|---|

|
#1
Peckham St
New Bedford, MA 02746
|
3,089 sq. feet
|
3 baths 9 beds |
show details | |

|
#2
Dartmouth St
New Bedford, MA 02740
|
2,724 sq. feet
|
3 baths 5 beds |
show details | |

|
#3
Mill St
New Bedford, MA 02740
|
1,542 sq. feet
|
1 baths 3 beds |
show details | |

|
#4
Erin Ct
New Bedford, MA 02745
|
1,814 sq. feet
|
2 baths 3 beds |
show details | |

|
#5
David St
New Bedford, MA 02744
|
3,360 sq. feet
|
3 baths 9 beds |
show details | |

|
#6
Brooklawn Ct
New Bedford, MA 02745
|
1,160 sq. feet
|
1 baths 3 beds |
show details | |

|
#7
Milford St
New Bedford, MA 02745
|
1,186 sq. feet
|
1 baths 3 beds |
show details | |

|
#8
Ashland Pl
New Bedford, MA 02740
|
1,228 sq. feet
|
2 baths 3 beds |
show details | |

|
#9
Delano St
New Bedford, MA 02744
|
846 sq. feet
|
1 baths 2 beds |
show details | |

|
#10
Rounds St
New Bedford, MA 02740
|
1,450 sq. feet
|
1 baths 4 beds |
show details |
| Photo | Address | Area | Beds / Baths | Price | Details |
|---|---|---|---|---|---|

|
#11
Mount Pleasant St
New Bedford, MA 02746
|
2,575 sq. feet
|
1 baths 4 beds |
show details | |

|
#12
Myrtle St
New Bedford, MA 02746
|
3,162 sq. feet
|
3 baths 9 beds |
show details | |

|
#13
Dartmouth St
New Bedford, MA 02740
|
2,724 sq. feet
|
2 baths 5 beds |
show details | |

|
#14
Ocean St
New Bedford, MA 02740
|
2,240 sq. feet
|
2 baths 4 beds |
show details | |

|
#15
Bolton St
New Bedford, MA 02740
|
1,072 sq. feet
|
1 baths 2 beds |
show details | |

|
#16
Austin St # 1
New Bedford, MA 02740
|
2,540 sq. feet
|
2 baths 6 beds |
show details | |

|
#17
Reed St
New Bedford, MA 02740
|
1,742 sq. feet
|
1 baths 4 beds |
show details | |

|
#18
Bayview St
New Bedford, MA 02744
|
1,153 sq. feet
|
1 baths 2 beds |
show details | |

|
#19
Lawrence St
New Bedford, MA 02745
|
1,150 sq. feet
|
2 baths 3 beds |
show details | |

|
#20
Mount Vernon St
New Bedford, MA 02740
|
1,640 sq. feet
|
1 baths 3 beds |
show details |
| Photo | Address | Area | Beds / Baths | Price | Details |
|---|---|---|---|---|---|

|
#21
Cherokee St
New Bedford, MA 02745
|
1,000 sq. feet
|
2 baths 3 beds |
show details | |

|
#22
Holly Tree Ln
New Bedford, MA 02745
|
1,424 sq. feet
|
1 baths 3 beds |
show details | |

|
#23
Fern St
New Bedford, MA 02744
|
1,137 sq. feet
|
2 baths 3 beds |
show details | |

|
#24
Fair St
New Bedford, MA 02740
|
2,474 sq. feet
|
2 baths 6 beds |
show details | |

|
#25
Armsby St
New Bedford, MA 02745
|
1,232 sq. feet
|
1 baths 3 beds |
show details | |

|
#26
Norwell St
New Bedford, MA 02740
|
1,105 sq. feet
|
1 baths 4 beds |
show details | |

|
#27
Belleville Ave
New Bedford, MA 02745
|
1,118 sq. feet
|
1 baths 3 beds |
show details | |

|
#28
Park St
New Bedford, MA 02740
|
1,056 sq. feet
|
1 baths 2 beds |
show details | |

|
#29
Jarry St
New Bedford, MA 02745
|
840 sq. feet
|
1 baths 2 beds |
show details | |

|
#30
Allen St
New Bedford, MA 02740
|
2,202 sq. feet
|
3 baths 5 beds |
show details |
| Photo | Address | Area | Beds / Baths | Price | Details |
|---|---|---|---|---|---|

|
#31
Prairie Ave
New Bedford, MA 02745
|
1,144 sq. feet
|
1 baths 3 beds |
show details | |

|
#32
Joyce St
New Bedford, MA 02745
|
1,367 sq. feet
|
2 baths 2 beds |
show details | |

|
#33
Willis St
New Bedford, MA 02740
|
1,555 sq. feet
|
1 baths 4 beds |
show details | |

|
#34
Potter St
New Bedford, MA 02740
|
2,353 sq. feet
|
1 baths 5 beds |
show details | |

|
#35
Beverly St
New Bedford, MA 02745
|
992 sq. feet
|
2 baths 3 beds |
show details | |

|
#36
Richmond St
New Bedford, MA 02740
|
1,952 sq. feet
|
1 baths 5 beds |
show details | |

|
#37
Lark St
New Bedford, MA 02745
|
1,274 sq. feet
|
1 baths 3 beds |
show details | |

|
#38
Erin Ct
New Bedford, MA 02745
|
1,512 sq. feet
|
1 baths 3 beds |
show details | |

|
#39
Rivet St # 2
New Bedford, MA 02740
|
1,488 sq. feet
|
2 baths 4 beds |
show details | |

|
#40
Sagamore St
New Bedford, MA 02740
|
3,303 sq. feet
|
3 baths 9 beds |
show details |
| Photo | Address | Area | Beds / Baths | Price | Details |
|---|---|---|---|---|---|

|
#41
Covell St
New Bedford, MA 02745
|
4,083 sq. feet
|
3 baths 9 beds |
show details | |

|
#42
Willis St
New Bedford, MA 02740
|
1,879 sq. feet
|
2 baths 5 beds |
show details | |

|
#43
Holly Tree Ln
New Bedford, MA 02745
|
1,025 sq. feet
|
2 baths 3 beds |
show details | |

|
#44
Briarwood Dr
New Bedford, MA 02745
|
1,125 sq. feet
|
1 baths 3 beds |
show details | |

|
#45
Ash St
New Bedford, MA 02740
|
8,497 sq. feet
|
4 baths 6 beds |
show details | |

|
#46
Chancery St
New Bedford, MA 02740
|
1,327 sq. feet
|
1 baths 3 beds |
show details | |

|
#47
Hatch St
New Bedford, MA 02745
|
1,080 sq. feet
|
2 baths 3 beds |
show details | |

|
#48
Priscilla St
New Bedford, MA 02740
|
1,502 sq. feet
|
1 baths 3 beds |
show details | |

|
#49
Bolton St
New Bedford, MA 02740
|
1,072 sq. feet
|
1 baths 2 beds |
show details | |

|
Check over 1 million property listings on Foreclosure.com!
|
browse all offers | |||


- 56,92756.5%White alone
- 23,90223.7%Hispanic
- 8,2318.2%Two or more races
- 5,4245.4%Black alone
- 3,9924.0%Other race alone
- 1,9381.9%Asian alone
- 2620.3%American Indian alone
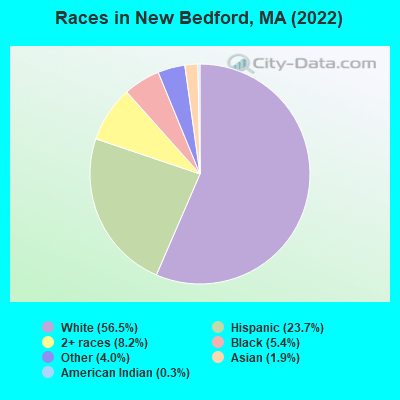
Races in New Bedford detailed stats: ancestries, foreign born residents, place of birth
According to our research of Massachusetts and other state lists, there were 136 registered sex offenders living in New Bedford, Massachusetts as of April 27, 2024.
The ratio of all residents to sex offenders in New Bedford is 699 to 1.
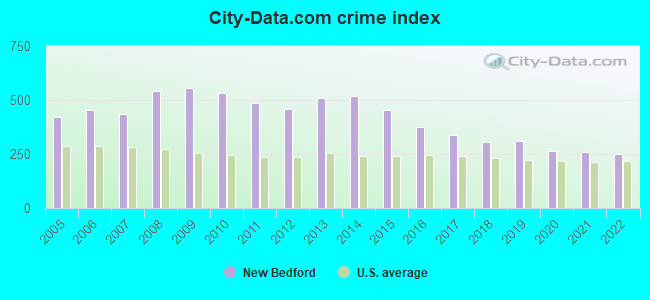
The City-Data.com crime index weighs serious crimes and violent crimes more heavily. Higher means more crime, U.S. average is 246.1. It adjusts for the number of visitors and daily workers commuting into cities.
- means the value is smaller than the state average.- means the value is about the same as the state average.
- means the value is bigger than the state average.
- means the value is much bigger than the state average.
Crime rate in New Bedford detailed stats: murders, rapes, robberies, assaults, burglaries, thefts, arson
Full-time law enforcement employees in 2021, including police officers: 271 (234 officers - 217 male; 17 female).
| Officers per 1,000 residents here: | 2.43 |
| Massachusetts average: | 2.53 |
 Recent articles from our blog. Our writers, many of them Ph.D. graduates or candidates, create easy-to-read articles on a wide variety of topics.

 | What is going on in the Fall River/New Bedford area??? (111 replies) |
| Be careful around the New Bedford Market Basket these days. (51 replies) |
| Another shooting in New Bedford (66 replies) |
| Commuter Rail Extending to New Bedford and Fall River (11 replies) |
| South Coast Rail to New Bedford & Fall River... (20 replies) |
| Gruesome scene in New Bedford (89 replies) |
Latest news from New Bedford, MA collected exclusively by city-data.com from local newspapers, TV, and radio stations
New Bedford, MA City Guides:
Ancestries: Portuguese (36.8%), Cape Verdean (12.3%), Irish (3.1%), English (2.8%), French (2.5%), French Canadian (1.7%).
Current Local Time: EST time zone
Elevation: 50 feet
Land area: 20.1 square miles.
Population density: 5,004 people per square mile (average).
20,819 residents are foreign born (8.1% Europe, 7.4% Latin America, 3.5% Africa).
| This city: | 20.6% |
| Massachusetts: | 17.6% |
Median real estate property taxes paid for housing units with mortgages in 2022: $3,962 (1.1%)
Median real estate property taxes paid for housing units with no mortgage in 2022: $3,916 (1.2%)
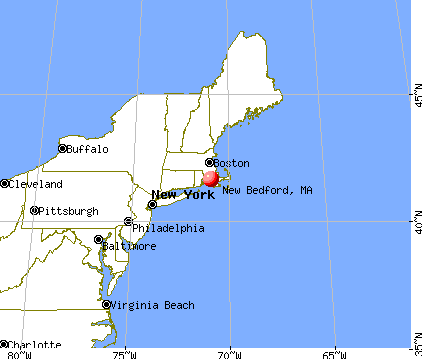
Nearest city with pop. 200,000+: Boston, MA  (47.0 miles , pop. 589,141).
Nearest city with pop. 1,000,000+: Bronx, NY (162.7 miles , pop. 1,332,650).
Nearest cities:
), ), ), Latitude: 41.65 N, Longitude: 70.93 W
Daytime population change due to commuting: -9,416 (-9.4%)
Workers who live and work in this city: 19,748 (42.7%)
Area codes: 508, 774
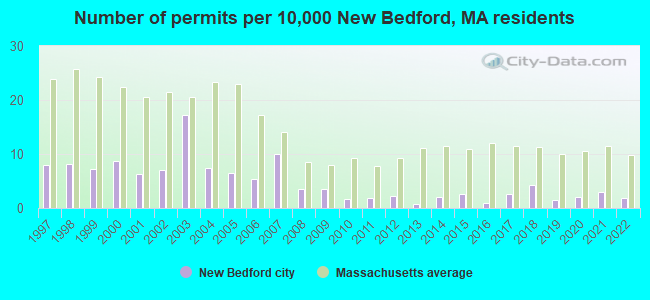
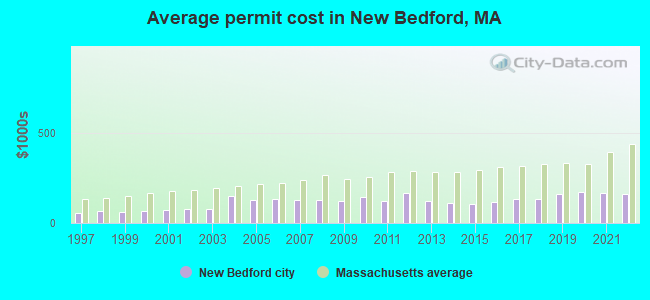
Single-family new house construction building permits:
- 2022: 17 buildings, average cost: $159,100
- 2021: 28 buildings, average cost: $163,700
- 2020: 19 buildings, average cost: $170,300
- 2019: 14 buildings, average cost: $158,300
- 2018: 40 buildings, average cost: $134,600
- 2017: 25 buildings, average cost: $131,000
- 2016: 9 buildings, average cost: $117,800
- 2015: 24 buildings, average cost: $103,200
- 2014: 19 buildings, average cost: $111,500
- 2013: 7 buildings, average cost: $118,900
- 2012: 21 buildings, average cost: $165,200
- 2011: 17 buildings, average cost: $123,300
- 2010: 16 buildings, average cost: $143,500
- 2009: 33 buildings, average cost: $124,300
- 2008: 33 buildings, average cost: $127,500
- 2007: 93 buildings, average cost: $126,800
- 2006: 51 buildings, average cost: $135,400
- 2005: 60 buildings, average cost: $127,600
- 2004: 70 buildings, average cost: $152,400
- 2003: 161 buildings, average cost: $76,500
- 2002: 66 buildings, average cost: $76,900
- 2001: 59 buildings, average cost: $72,600
- 2000: 82 buildings, average cost: $63,900
- 1999: 68 buildings, average cost: $61,200
- 1998: 76 buildings, average cost: $64,300
- 1997: 74 buildings, average cost: $57,000
| Here: | 5.6% |
| Massachusetts: | 3.5% |
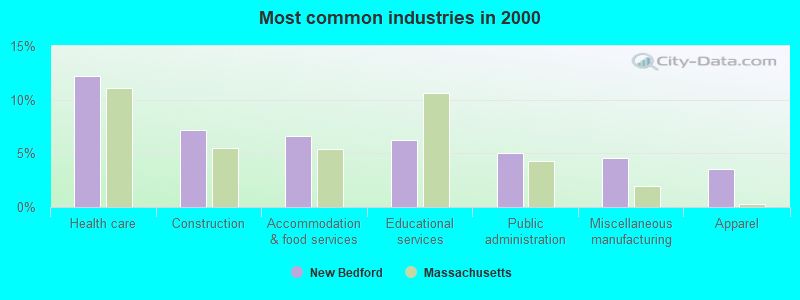
- Health care (12.2%)
- Construction (7.1%)
- Accommodation & food services (6.6%)
- Educational services (6.2%)
- Public administration (5.0%)
- Miscellaneous manufacturing (4.6%)
- Apparel (3.5%)
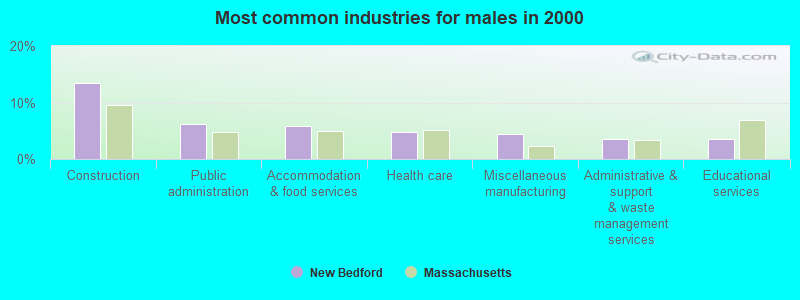
- Construction (13.5%)
- Public administration (6.2%)
- Accommodation & food services (5.9%)
- Health care (4.8%)
- Miscellaneous manufacturing (4.5%)
- Administrative & support & waste management services (3.6%)
- Educational services (3.6%)
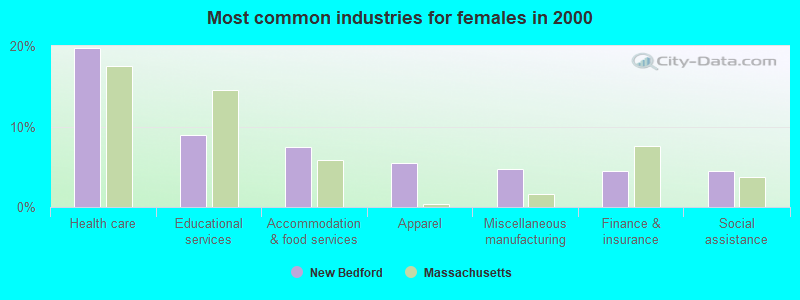
- Health care (19.8%)
- Educational services (8.9%)
- Accommodation & food services (7.4%)
- Apparel (5.5%)
- Miscellaneous manufacturing (4.7%)
- Finance & insurance (4.5%)
- Social assistance (4.4%)
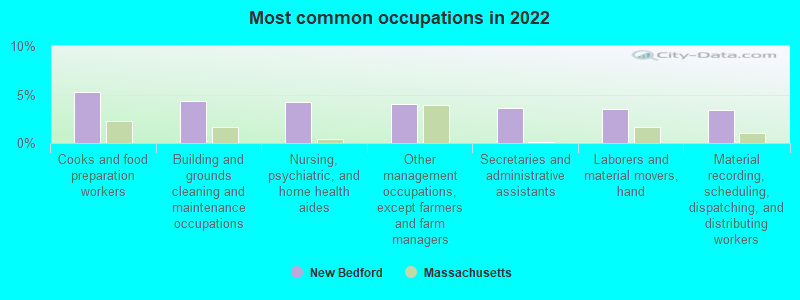
- Cooks and food preparation workers (5.3%)
- Building and grounds cleaning and maintenance occupations (4.4%)
- Nursing, psychiatric, and home health aides (4.2%)
- Other management occupations, except farmers and farm managers (4.1%)
- Secretaries and administrative assistants (3.6%)
- Laborers and material movers, hand (3.5%)
- Material recording, scheduling, dispatching, and distributing workers (3.4%)
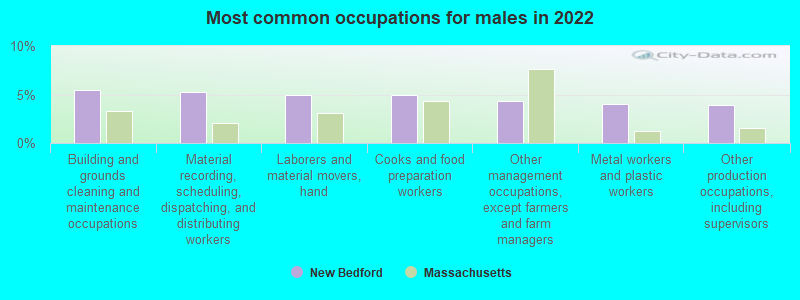
- Building and grounds cleaning and maintenance occupations (5.5%)
- Material recording, scheduling, dispatching, and distributing workers (5.3%)
- Laborers and material movers, hand (5.0%)
- Cooks and food preparation workers (4.9%)
- Other management occupations, except farmers and farm managers (4.3%)
- Metal workers and plastic workers (4.0%)
- Other production occupations, including supervisors (3.9%)

- Nursing, psychiatric, and home health aides (7.8%)
- Secretaries and administrative assistants (7.0%)
- Cooks and food preparation workers (5.7%)
- Supervisors and other personal care and service workers, except child care workers (4.6%)
- Other management occupations, except farmers and farm managers (3.8%)
- Information and record clerks, except customer service representatives (3.6%)
- Cashiers (3.5%)
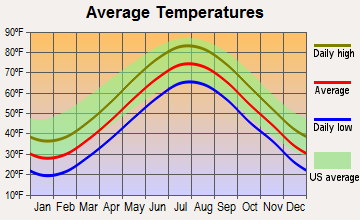
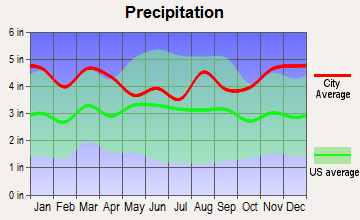
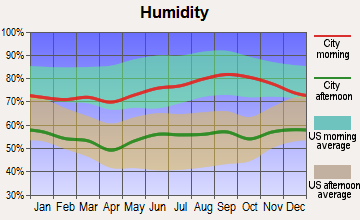
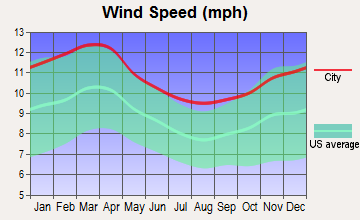
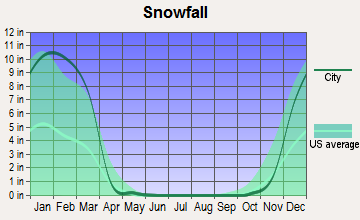
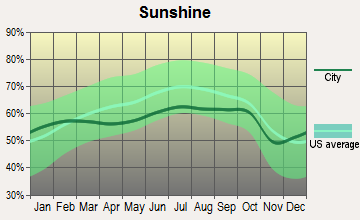
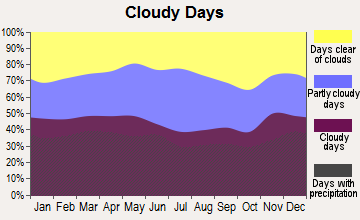
Average climate in New Bedford, Massachusetts
Based on data reported by over 4,000 weather stations
|
|

Tornado activity:
New Bedford-area historical tornado activity is significantly below Massachusetts state average. It is 72% smaller than the overall U.S. average.
On 6/9/1953, a category F3 (max. wind speeds 158-206 mph) tornado 30.8 miles away from the New Bedford city center injured 17 people and caused between $500,000 and $5,000,000 in damages.
On 8/28/1970, a category F2 (max. wind speeds 113-157 mph) tornado 4.0 miles away from the city center caused between $5000 and $50,000 in damages.
Earthquake activity:
New Bedford-area historical earthquake activity is significantly above Massachusetts state average. It is 75% smaller than the overall U.S. average.On 10/7/1983 at 10:18:46, a magnitude 5.3 (5.1 MB, 5.3 LG, 5.1 ML, Class: Moderate, Intensity: VI - VII) earthquake occurred 235.0 miles away from the city center
On 4/20/2002 at 10:50:47, a magnitude 5.3 (5.3 ML, Depth: 3.0 mi) earthquake occurred 242.1 miles away from the city center
On 1/19/1982 at 00:14:42, a magnitude 4.7 (4.5 MB, 4.7 MD, 4.5 LG, Class: Light, Intensity: IV - V) earthquake occurred 132.3 miles away from the city center
On 10/16/2012 at 23:12:25, a magnitude 4.7 (4.7 ML, Depth: 10.0 mi) earthquake occurred 135.3 miles away from New Bedford center
On 4/20/2002 at 10:50:47, a magnitude 5.2 (5.2 MB, 4.2 MS, 5.2 MW, 5.0 MW) earthquake occurred 241.3 miles away from the city center
On 8/22/1992 at 12:20:32, a magnitude 4.8 (4.8 MB, 3.8 MS, 4.7 LG, Depth: 6.2 mi) earthquake occurred 179.0 miles away from the city center
Magnitude types: regional Lg-wave magnitude (LG), body-wave magnitude (MB), duration magnitude (MD), local magnitude (ML), surface-wave magnitude (MS), moment magnitude (MW)
Natural disasters:
The number of natural disasters in Bristol County (23) is greater than the US average (15).Major Disasters (Presidential) Declared: 12
Emergencies Declared: 11
Causes of natural disasters: Floods: 8, Hurricanes: 7, Storms: 5, Snows: 3, Snowstorms: 3, Winter Storms: 3, Blizzards: 2, Explosion: 1, Heavy Rain: 1, Snowfall: 1, Tropical Storm: 1, Wind: 1 (Note: some incidents may be assigned to more than one category).

Main business address for: SEACOAST FINANCIAL SERVICES CORP (SAVINGS INSTITUTIONS, NOT FEDERALLY CHARTERED).
Hospitals in New Bedford:
- NEW BEDFORD REHABILITATION HOSPITAL (4499 ACUSHNET AVENUE)
- PARKWOOD HOSPITAL , INC (4499 ACUSHNET AVENUE)
Home Health Centers in New Bedford:
Nursing Homes in New Bedford:
- BEDFORD VILLAGE NURSING HOME (9 POPE STREET)
- BLAIR HSE NLTC-NEW BEDFORD (397 COUNTY ST)
- FRANCES P MEMORIAL LTC FACILITY (1074 PLEASANT STREET)
- HATHAWAY MANOR EXTENDED CARE (863 HATHAWAY ROAD)
- KRISTEN BETH N H (713 SHAWMUT AVE)
- NEW BEDFORD HEALTH CARE CENTER (221 FITZGERALD DRIVE)
- NEW BEDFORD JEWISH CONVALESCENT HOME, INC (200 HAWTHORN STREET)
- ROYAL TABER STREET NURS AND REHAB CTR (19 TABER STREET)
- SASSAQUIN NURSING HOME, INC (4586 ACUSHNET AVE)
- SOUTHEAST MASS HEALTH AND REHABILITATION CENTER (4586 ACUSHNET AVENUE)
Airports, heliports and other landing facilities located in New Bedford:
- New Bedford Regional Airport (EWB) (Runways: 2, Air Taxi Ops: 7,920, Itinerant Ops: 21,500, Local Ops: 26,985, Military Ops: 492)
- J K L Heliport (4MA4)
- St Luke's Heliport (5MA6)
- Acushnet River Seaplane Base (6MA8)
Colleges/Universities in New Bedford:
- Salter School-New Bedford (Full-time enrollment: 420; Location: 950 Kings Hwy; Private, for-profit; Website: salterschool.com)
- La Baron Hairdressing Academy-New Bedford (Full-time enrollment: 44; Location: 281 Union St; Private, for-profit; Website: labarononline.com)
- Rob Roy Academy-New Bedford (Full-time enrollment: 30; Location: 1872 Acushnet Ave; Private, for-profit; Website: www.rob-roy.com)
Colleges/universities with over 2000 students nearest to New Bedford:
- University of Massachusetts-Dartmouth (about 5 miles; North Dartmouth, MA; Full-time enrollment: 7,545)
- Bristol Community College (about 11 miles; Fall River, MA; FT enrollment: 5,707)
- Roger Williams University (about 17 miles; Bristol, RI; FT enrollment: 4,375)
- Salve Regina University (about 23 miles; Newport, RI; FT enrollment: 2,349)
- Bridgewater State University (about 24 miles; Bridgewater, MA; FT enrollment: 9,802)
- Brown University (about 28 miles; Providence, RI; FT enrollment: 8,458)
- Rhode Island School of Design (about 28 miles; Providence, RI; FT enrollment: 2,714)
Public high schools in New Bedford:
- NEW BEDFORD HIGH (Students: 3,106, Location: 230 HATHAWAY BLVD, Grades: 9-12)
- GR NEW BEDFORD VOCATIONAL TECHNICAL (Students: 2,011, Location: 1121 ASHLEY BLVD, Grades: 9-12)
- GLOBAL LEARNING CHARTER PUBLIC SCHOOL (Location: 190 ASHLEY BOULEVARD, Grades: 5-12, Charter school)
- CITY ON A HILL CHARTER PUBLIC SCHOOL NEW BEDFORD (Location: 777 CHURCH STREET, Grades: 9, Charter school)
- TRINITY DAY ACADEMY (Location: 181 HILLMAN STREET, Grades: 7-12)
- WHALING CITY JUNIOR/SENIOR HIGH SCHOOL (Location: 455 COUNTY STREET, Grades: 6-12)
Private high schools in New Bedford:
Biggest public elementary/middle schools in New Bedford:
- NORMANDIN MIDDLE SCHOOL (Students: 1,209, Location: 81 FELTON ST, Grades: 6-8)
- ROOSEVELT MIDDLE SCHOOL (Students: 798, Location: 119 FREDERICK STREET, Grades: 6-8)
- ALFRED J GOMES (Students: 709, Location: 286 S SECOND STREET, Grades: PK-5)
- KEITH MIDDLE SCHOOL (Students: 661, Location: 225 HATHAWAY BLVD, Grades: 6-8)
- HAYDEN/MCFADDEN (Students: 650, Location: 361 CEDAR GROVE, Grades: PK-5)
- SGT WM H CARNEY ACADEMY (Students: 593, Location: 247 ELM STREET, Grades: PK-5)
- CASIMIR PULASKI (Students: 587, Location: 1097 BRALEY RD, Grades: PK-5)
- JOHN AVERY PARKER (Students: 477, Location: 705 COUNTY STREET, Grades: PK-5)
- JOHN B DEVALLES (Students: 342, Location: 120 KATHERINE STREET, Grades: KG-5)
- CHARLES S ASHLEY (Students: 313, Location: 122 ROCHAMBEAU STREET, Grades: KG-5)
Private elementary/middle schools in New Bedford:
- HOLY FAMILY HOLY NAME SCHOOL (Students: 293, Location: 91 SUMMER ST, Grades: PK-8)
- ST JAMES & ST JOHN SCHOOL (Students: 263, Location: 180 ORCHARD ST, Grades: PK-8)
- ALL SAINTS CATHOLIC SCHOOL (Students: 184, Location: 115 ILLINOIS ST, Grades: PK-8)
- NATIVITY PREPARATORY SCHOOL OF NEW BEDFORD (Students: 54, Location: 66 SPRING ST, Grades: 5-8, Boys only)
- OUR SISTER'S SCHOOL (Students: 54, Location: 145 BROWNELL AVE, Grades: 5-8, Girls only)
Library in New Bedford:
- NEW BEDFORD FREE PUBLIC LIBRARY (Operating income: $2,102,955; Location: 613 PLEASANT STREET; 369,196 books; 523 e-books; 13,297 audio materials; 9,608 video materials; 3 local licensed databases; 34 state licensed databases; 1 other licensed databases; 756 print serial subscriptions; 27 electronic serial subscriptions)
User-submitted facts and corrections:
- Normandin is now a middle school, and has grades 06-08 added by Nerwen
- hospital - St Lukes Hospital
Points of interest:
Notable locations in New Bedford: Bedford Industrial Park (A), Doane Memorial Field (B), Massachusetts State Pier (C), New Bedford Community Center (D), New Bedford West Barrier Light (E), New Bedford East Barrier Light (F), North Hill Plaza (G), Stop and Shop Center (H), New Bedford EMS (I), Stat Ambulance Service of New England (J), New Bedford City Hall (K), House of Corrections (L), New Bedford Fire Department Station 9 (M), New Bedford Fire Department Station 8 (N), New Bedford Fire Department Station 5 (O), New Bedford Fire Department Station 7 (P), New Bedford Fire Department Station 11 (Q), New Bedford Fire Department Station 6 (R), New Bedford Fire Department Station 1 Headquarters (S), New Bedford Free Public Library (T). Display/hide their locations on the map
Main business address in New Bedford: SEACOAST FINANCIAL SERVICES CORP (A). Display/hide its location on the map
Churches in New Bedford include: Saint James Church (A), Sacred Heart Church (B), Calvary Church (C), Saint Theresas Church (D), Clifford Chapel (E). Display/hide their locations on the map
Cemeteries: Reynolds Cemetery (1), Sacred Heart Cemetery (2), Polish National Cemetery (3), Saint Marys Cemetery (4), Peckham West Cemetery (5), Sacred Heart Cemetery (6), Oak Grove Cemetery (7). Display/hide their locations on the map
Lakes, reservoirs, and swamps: Sassaquin Pond (A), Turner Pond (B), Acushnet Cedar Swamp (C), Hobomock Swamp (D). Display/hide their locations on the map
River: Acushnet River (A). Display/hide its location on the map
Parks in New Bedford include: Central New Bedford Historic District (1), Hazelwood Park (2), Buttonwood Park (3), Brooklawn Park (4), Ashley Park (5). Display/hide their locations on the map
Tourist attractions: Fort Tabor Military Museum (1000 South Rodney French Blvd) (1), Buttonwood Park Zoological Society (Cultural Attractions- Events- & Facilities; 425 Hawthorn Street) (2), Centro LUZO AMER Club Inc (Cultural Attractions- Events- & Facilities; 34 Beetle Street) (3), United States Government - Interior Dept- National Park Service (Recreation Areas; 37 North 2nd Street) (4), Martin Vending Inc (Amusement & Theme Parks; 79 Beetle Street) (5), Mac's Amusements (Amusement & Theme Parks; 79 Beetle Street) (6), New Bedford City - Libraries- Branches- Casa de Saudade (58 Crapo Street) (7), New Bedford City - Libraries (613 Pleasant Street) (8), New Bedford City - Libraries- Branches- Lawler (745 Rockdale Avenue) (9). Display/hide their approximate locations on the map
Hotels: Captain Haskell's Octagon House (347 Union Street) (1), Days Inn (500 Hathaway Road) (2). Display/hide their approximate locations on the map
Courts: Mass Commonwealth - Trial Court- District Court Dept- New Bedford Div- Connecting All Departm (75 North 6th Street) (1), Mass Commonwealth - Trial Court- Probate & Family Court (505 Pleasant Street) (2). Display/hide their approximate locations on the map
Birthplace of: Paul Clayton (folksinger) - Male singer, Tynisha Keli - Female singer, Anthony Barboza - Photographer and artist, Joseph Barboza - Boxer, Dave Leitao - Basketball player-coach, John Tukey - Mathematician, Albert Pinkham Ryder - Artist, Arnie Oliver - Soccer player-coach, Moses Hicks Grinnell - Politician, Benjamin F. White (Montana politician) - 9th Governor of Montana Territory.
Drinking water stations with addresses in New Bedford that have no violations reported:
- NEW BEDFORD DEPT. OF PUB. INFRASTRUCTURE (Population served: 95,727, Primary Water Source Type: Surface water)
| This city: | 2.4 people |
| Massachusetts: | 2.5 people |
| This city: | 60.2% |
| Whole state: | 63.0% |
| This city: | 10.1% |
| Whole state: | 7.0% |
Likely homosexual households (counted as self-reported same-sex unmarried-partner households)
- Lesbian couples: 0.5% of all households
- Gay men: 0.4% of all households
People in group quarters in New Bedford in 2010:
- 1,196 people in nursing facilities/skilled-nursing facilities
- 224 people in residential treatment centers for adults
- 185 people in local jails and other municipal confinement facilities
- 151 people in group homes intended for adults
- 109 people in other noninstitutional facilities
- 59 people in emergency and transitional shelters (with sleeping facilities) for people experiencing homelessness
- 28 people in residential treatment centers for juveniles (non-correctional)
- 8 people in workers' group living quarters and job corps centers
- 6 people in group homes for juveniles (non-correctional)
People in group quarters in New Bedford in 2000:
- 1,291 people in nursing homes
- 216 people in local jails and other confinement facilities (including police lockups)
- 116 people in homes for the mentally ill
- 83 people in other noninstitutional group quarters
- 79 people in homes or halfway houses for drug/alcohol abuse
- 65 people in homes for the mentally retarded
- 55 people in military ships
- 38 people in religious group quarters
- 29 people in other nonhousehold living situations
- 8 people in homes for the physically handicapped
- 6 people in other group homes
Banks with most branches in New Bedford (2011 data):
- Sovereign Bank, National Association: 9 branches. Info updated 2012/01/31: Bank assets: $78,146.9 mil, Deposits: $48,042.9 mil, headquarters in Wilmington, DE, positive income, Commercial Lending Specialization, 718 total offices, Holding Company: Banco Santander, S.A.
- Bank of America, National Association: Pleasant Street Branch, North Branch, New Bedford-Rockdale Place Branch, New Bedford-Cove Street Branch. Info updated 2009/11/18: Bank assets: $1,451,969.3 mil, Deposits: $1,077,176.8 mil, headquarters in Charlotte, NC, positive income, 5782 total offices, Holding Company: Bank Of America Corporation
- RBS Citizens, National Association: New Bedford Stop And Shop Branch, New Bedford Stop & Shop Branch, New Bedford Branch. Info updated 2007/09/19: Bank assets: $106,940.6 mil, Deposits: $75,690.2 mil, headquarters in Providence, RI, positive income, 1135 total offices, Holding Company: Uk Financial Investments Limited
- BankFive: Luzo Community Bank Branch, New Bedford Branch, New Bedford Branch. Info updated 2011/11/15: Bank assets: $720.6 mil, Deposits: $613.3 mil, headquarters in Fall River, MA, positive income, Commercial Lending Specialization, 13 total offices, Holding Company: Bankfive, Mhc
- Webster Bank, National Association: New Bedford Branch, 480 Rockdale Ave Branch, New Bedford Branch. Info updated 2008/12/23: Bank assets: $18,674.3 mil, Deposits: $13,861.5 mil, headquarters in Waterbury, CT, positive income, Commercial Lending Specialization, 167 total offices, Holding Company: Webster Financial Corporation
- Admirals Bank: Rockdale Avenue Branch at 37 Rockdale Avenue, branch established on 2004/03/02; Acushnet Avenue Branch at 1657-1667 Acushnet Avenue, branch established on 2005/11/03. Info updated 2011/07/21: Bank assets: $518.7 mil, Deposits: $462.0 mil, headquarters in Cranston, RI, positive income, Commercial Lending Specialization, 12 total offices
- BayCoast Bank: Ashley Boulevard Branch at 1000 Ashley Boulevard, branch established on 2010/09/01; New Bedford Branch at 95 William Street, branch established on 2004/11/15. Info updated 2012/02/03: Bank assets: $909.2 mil, Deposits: $730.3 mil, headquarters in Fall River, MA, positive income, Commercial Lending Specialization, 14 total offices, Holding Company: Narragansett Financial Corp
- Rockland Trust Company: New Bedford Branch at 833 Ashley Boulevard, branch established on 1999/03/29. Info updated 2009/05/20: Bank assets: $4,974.4 mil, Deposits: $3,903.9 mil, headquarters in Rockland, MA, positive income, Commercial Lending Specialization, 67 total offices, Holding Company: Independent Bank Corp.
- Bristol County Savings Bank: New Bedford Branch at 1307 Ashley Blvd, branch established on 2010/06/07. Info updated 2007/09/11: Bank assets: $1,338.8 mil, Deposits: $1,027.4 mil, headquarters in Taunton, MA, positive income, Commercial Lending Specialization, 13 total offices, Holding Company: Beacon Bancorp
For population 15 years and over in New Bedford:
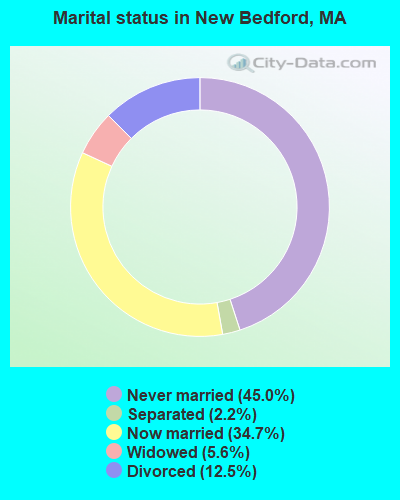
- Never married: 45.0%
- Now married: 34.7%
- Separated: 2.2%
- Widowed: 5.6%
- Divorced: 12.5%
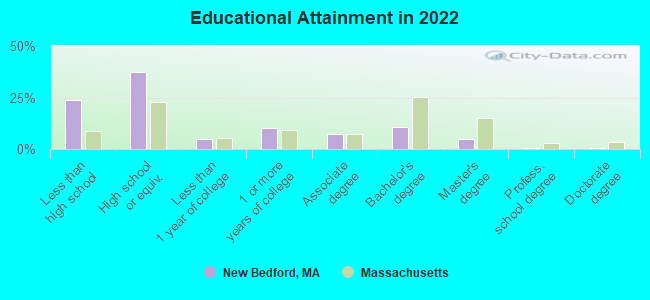
For population 25 years and over in New Bedford:
- High school or higher: 76.2%
- Bachelor's degree or higher: 16.5%
- Graduate or professional degree: 5.9%
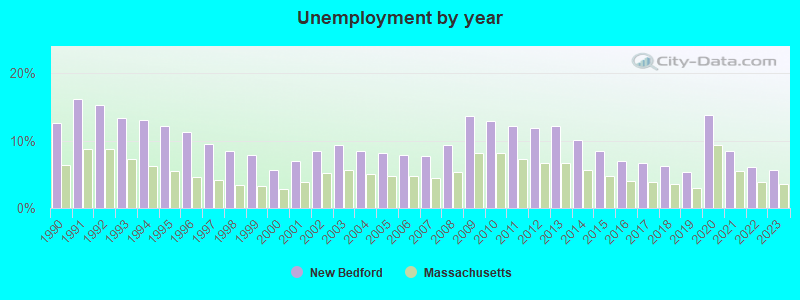
- Unemployed: 8.7%
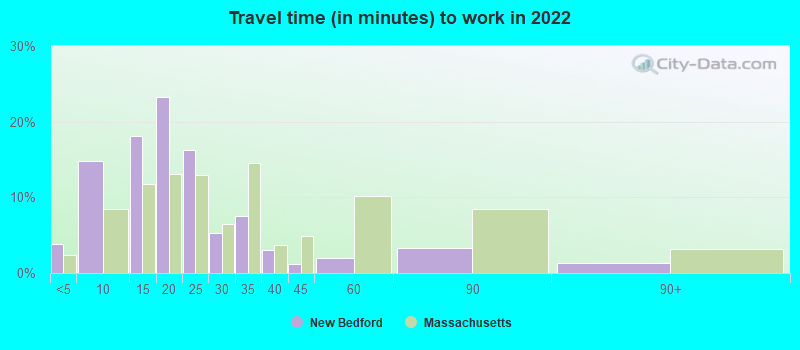
- Mean travel time to work (commute): 21.4 minutes
| Here: | 16.3 |
| Massachusetts average: | 13.0 |
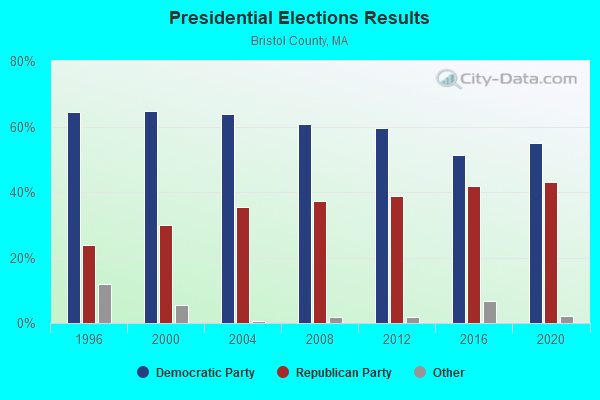
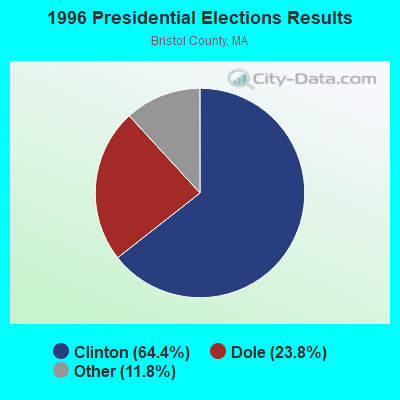
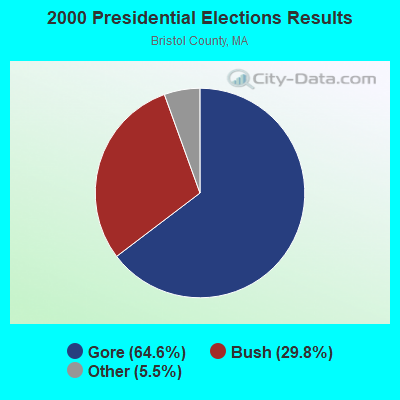

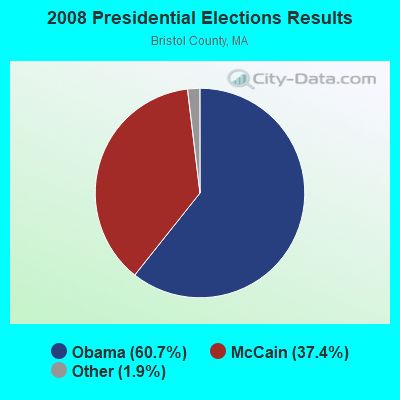
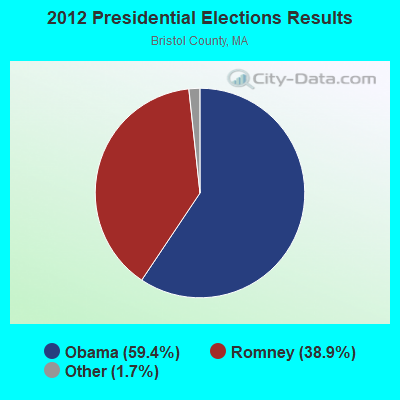


Graphs represent county-level data. Detailed 2008 Election Results
Religion statistics for New Bedford, MA (based on Bristol County data)
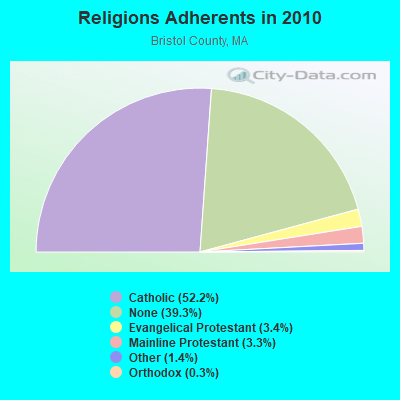
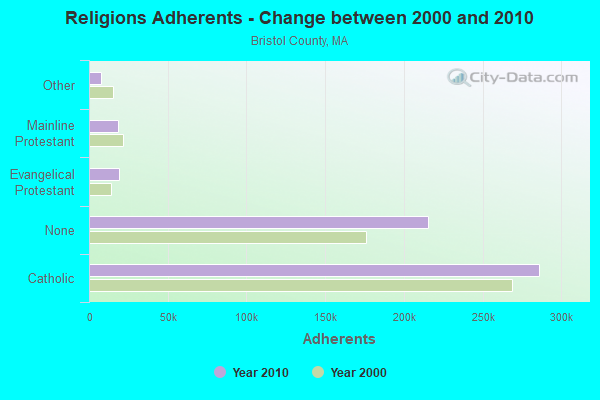
| Religion | Adherents | Congregations |
|---|---|---|
| Catholic | 286,113 | 72 |
| Evangelical Protestant | 18,765 | 128 |
| Mainline Protestant | 18,246 | 83 |
| Other | 7,807 | 33 |
| Orthodox | 1,565 | 4 |
| Black Protestant | 511 | 5 |
| None | 215,278 | - |
Food Environment Statistics:
| Bristol County: | 2.00 / 10,000 pop. |
| State: | 1.98 / 10,000 pop. |
| Here: | 0.09 / 10,000 pop. |
| State: | 0.05 / 10,000 pop. |
| Here: | 1.93 / 10,000 pop. |
| State: | 2.22 / 10,000 pop. |
| Bristol County: | 2.35 / 10,000 pop. |
| Massachusetts: | 1.77 / 10,000 pop. |
| Bristol County: | 8.20 / 10,000 pop. |
| Massachusetts: | 8.76 / 10,000 pop. |
| This county: | 9.5% |
| Massachusetts: | 8.1% |
| Here: | 26.9% |
| State: | 22.5% |
| This county: | 14.4% |
| Massachusetts: | 16.5% |
Health and Nutrition:
| This city: | 48.9% |
| State: | 50.5% |
| New Bedford: | 45.6% |
| State: | 48.0% |
| Here: | 28.6 |
| State: | 28.4 |
| This city: | 21.4% |
| Massachusetts: | 20.7% |
| This city: | 11.4% |
| Massachusetts: | 10.4% |
| New Bedford: | 6.8 |
| Massachusetts: | 6.8 |
| Here: | 33.5% |
| Massachusetts: | 33.4% |
| Here: | 55.2% |
| Massachusetts: | 57.1% |
| This city: | 78.1% |
| Massachusetts: | 79.2% |
More about Health and Nutrition of New Bedford, MA Residents
| Local government employment and payroll (March 2022) | |||||
| Function | Full-time employees | Monthly full-time payroll | Average yearly full-time wage | Part-time employees | Monthly part-time payroll |
|---|---|---|---|---|---|
| Elementary and Secondary - Instruction | 1,843 | $10,533,855 | $68,587 | 213 | $579,412 |
| Elementary and Secondary - Other Total | 451 | $1,777,354 | $47,291 | 29 | $65,240 |
| Police Protection - Officers | 260 | $2,162,250 | $99,796 | 2 | $7,777 |
| Firefighters | 200 | $1,622,542 | $97,353 | 0 | $0 |
| Other and Unallocable | 95 | $479,442 | $60,561 | 8 | $2,662 |
| Water Supply | 84 | $395,303 | $56,472 | 0 | $0 |
| Streets and Highways | 60 | $280,647 | $56,129 | 0 | $0 |
| Health | 59 | $364,051 | $74,044 | 16 | $23,516 |
| Financial Administration | 51 | $277,029 | $65,183 | 5 | $9,865 |
| Other Government Administration | 34 | $196,263 | $69,269 | 16 | $36,731 |
| Parks and Recreation | 31 | $138,982 | $53,799 | 8 | $4,214 |
| Sewerage | 29 | $139,383 | $57,676 | 0 | $0 |
| Local Libraries | 27 | $120,466 | $53,540 | 12 | $13,195 |
| Welfare | 26 | $124,213 | $57,329 | 8 | $11,508 |
| Police - Other | 22 | $163,600 | $89,236 | 6 | $7,148 |
| Housing and Community Development (Local) | 12 | $79,296 | $79,296 | 0 | $0 |
| Judicial and Legal | 11 | $67,064 | $73,161 | 5 | $22,763 |
| Fire - Other | 6 | $26,733 | $53,466 | 0 | $0 |
| Airports | 5 | $29,437 | $70,649 | 1 | $1,353 |
| Natural Resources | 3 | $20,991 | $83,964 | 0 | $0 |
| Totals for Government | 3,309 | $18,998,902 | $68,899 | 329 | $785,381 |
New Bedford government finances - Expenditure in 2021 (per resident):
- Current Operations - Elementary and Secondary Education: $231,580,000 ($2300.11)
General - Other: $34,296,000 ($340.64)
Police Protection: $24,586,000 ($244.19)
Local Fire Protection: $19,333,000 ($192.02)
Sewerage: $14,119,000 ($140.23)
General Public Buildings: $8,128,000 ($80.73)
Water Utilities: $7,249,000 ($72.00)
Solid Waste Management: $5,977,000 ($59.37)
Housing and Community Development: $4,392,000 ($43.62)
Health - Other: $2,963,000 ($29.43)
Libraries: $2,543,000 ($25.26)
Parks and Recreation: $2,384,000 ($23.68)
Financial Administration: $2,206,000 ($21.91)
Public Welfare - Other: $2,200,000 ($21.85)
Regular Highways: $1,715,000 ($17.03)
Central Staff Services: $1,317,000 ($13.08)
Judicial and Legal Services: $989,000 ($9.82)
Protective Inspection and Regulation - Other: $987,000 ($9.80)
Air Transportation: $503,000 ($5.00)
Parking Facilities: $344,000 ($3.42)
Natural Resources - Other: $329,000 ($3.27)
- General - Interest on Debt: $5,969,000 ($59.29)
- Intergovernmental to Local - Other - Elementary and Secondary Education: $7,560,000 ($75.09)
Other - Health - Other: $136,000 ($1.35)
- Intergovernmental to State - Transit Utilities: $1,273,000 ($12.64)
General - Other: $345,000 ($3.43)
- Other Capital Outlay - General - Other: $24,595,000 ($244.28)
Elementary and Secondary Education: $13,240,000 ($131.50)
General Public Building: $9,724,000 ($96.58)
Water Utilities: $707,000 ($7.02)
Local Fire Protection: $658,000 ($6.54)
Regular Highways: $565,000 ($5.61)
Police Protection: $553,000 ($5.49)
Sewerage: $374,000 ($3.71)
Health - Other: $200,000 ($1.99)
Parks and Recreation: $48,000 ($0.48)
Parking Facilities: $40,000 ($0.40)
Libraries: $37,000 ($0.37)
Public Welfare - Other: $5,000 ($0.05)
Housing and Community Development: $4,000 ($0.04)
- Total Salaries and Wages: $128,879,000 ($1280.06)
- Water Utilities - Interest on Debt: $1,202,000 ($11.94)
New Bedford government finances - Revenue in 2021 (per resident):
- Charges - Sewerage: $23,512,000 ($233.53)
Other: $14,208,000 ($141.12)
Elementary and Secondary Education School Lunch: $3,681,000 ($36.56)
Parking Facilities: $994,000 ($9.87)
Air Transportation: $928,000 ($9.22)
Elementary and Secondary Education School Tuition and Transportation: $385,000 ($3.82)
Miscellaneous Commercial Activities: $227,000 ($2.25)
Solid Waste Management: $34,000 ($0.34)
Parks and Recreation: $16,000 ($0.16)
- Federal Intergovernmental - Other: $48,086,000 ($477.60)
Housing and Community Development: $4,201,000 ($41.73)
- Local Intergovernmental - Education: $118,000 ($1.17)
- Miscellaneous - Interest Earnings: $1,179,000 ($11.71)
General Revenue - Other: $414,000 ($4.11)
Donations From Private Sources: $190,000 ($1.89)
Fines and Forfeits: $3,000 ($0.03)
- Revenue - Water Utilities: $15,632,000 ($155.26)
- State Intergovernmental - Education: $206,938,000 ($2055.36)
General Local Government Support: $25,389,000 ($252.17)
Other: $11,210,000 ($111.34)
Sewerage: $4,598,000 ($45.67)
Public Welfare: $1,932,000 ($19.19)
Highways: $1,638,000 ($16.27)
Water Utilities: $112,000 ($1.11)
Housing and Community Development: $10,000 ($0.10)
- Tax - Property: $143,378,000 ($1424.07)
Other Selective Sales: $3,561,000 ($35.37)
Other License: $2,421,000 ($24.05)
New Bedford government finances - Debt in 2021 (per resident):
- Long Term Debt - Outstanding Unspecified Public Purpose: $252,834,000 ($2511.21)
Beginning Outstanding - Unspecified Public Purpose: $214,654,000 ($2132.00)
Issue, Unspecified Public Purpose: $58,550,000 ($581.53)
Retired Unspecified Public Purpose: $20,370,000 ($202.32)
- Short Term Debt Outstanding - Beginning: $44,123,000 ($438.24)
End of Fiscal Year: $18,245,000 ($181.21)
New Bedford government finances - Cash and Securities in 2021 (per resident):
- Bond Funds - Cash and Securities: $8,363,000 ($83.06)
- Other Funds - Cash and Securities: $137,065,000 ($1361.37)
4.76% of this county's 2021 resident taxpayers lived in other counties in 2020 ($70,162 average adjusted gross income)
| Here: | 4.76% |
| Massachusetts average: | 6.35% |
0.01% of residents moved from foreign countries ($64 average AGI)
Bristol County: 0.01% Massachusetts average: 0.01%
Top counties from which taxpayers relocated into this county between 2020 and 2021:
| from Plymouth County, MA | |
| from Norfolk County, MA | |
| from Providence County, RI |
4.63% of this county's 2020 resident taxpayers moved to other counties in 2021 ($72,404 average adjusted gross income)
| Here: | 4.63% |
| Massachusetts average: | 7.18% |
0.01% of residents moved to foreign countries ($83 average AGI)
Bristol County: 0.01% Massachusetts average: 0.02%
Top counties to which taxpayers relocated from this county between 2020 and 2021:
| to Plymouth County, MA | |
| to Providence County, RI | |
| to Norfolk County, MA |
| Businesses in New Bedford, MA | ||||
| Name | Count | Name | Count | |
|---|---|---|---|---|
| 7-Eleven | 5 | MasterBrand Cabinets | 9 | |
| AT&T | 1 | McDonald's | 4 | |
| Advance Auto Parts | 2 | Nike | 4 | |
| Ashley Furniture | 2 | Papa John's Pizza | 1 | |
| AutoZone | 2 | Payless | 1 | |
| Budget Car Rental | 1 | Penske | 1 | |
| Burger King | 2 | RadioShack | 1 | |
| CVS | 4 | Rite Aid | 5 | |
| Days Inn | 1 | Ryder Rental & Truck Leasing | 1 | |
| Decora Cabinetry | 2 | Sprint Nextel | 1 | |
| Domino's Pizza | 3 | Stop & Shop | 2 | |
| Dunkin Donuts | 18 | Subway | 4 | |
| Fashion Bug | 1 | T-Mobile | 1 | |
| FedEx | 9 | True Value | 3 | |
| Ford | 1 | U-Haul | 3 | |
| GNC | 1 | UPS | 11 | |
| H&R Block | 3 | Walgreens | 5 | |
| KFC | 2 | Wendy's | 1 | |
| Lane Furniture | 1 | YMCA | 2 | |
| Marriott | 1 | |||
Strongest AM radio stations in New Bedford:
- WBSM (1420 AM; 5 kW; NEW BEDFORD, MA; Owner: CITADEL BROADCASTING COMPANY)
- WNBH (1340 AM; 1 kW; NEW BEDFORD, MA; Owner: HALL COMMUNICATIONS INC.)
- WALE (990 AM; 50 kW; GREENVILLE, RI; Owner: NORTH AMERICAN BROADCASTING CO., INC.)
- WEEI (850 AM; 50 kW; BOSTON, MA; Owner: ENTERCOM BOSTON LICENSE, LLC)
- WBZ (1030 AM; 50 kW; BOSTON, MA; Owner: INFINITY BROADCASTING OPERATIONS, INC.)
- WRKO (680 AM; 50 kW; BOSTON, MA; Owner: ENTERCOM BOSTON LICENSE, LLC)
- WSAR (1480 AM; 5 kW; FALL RIVER, MA; Owner: BRISTOL COUNTY BROADCASTING, INC.)
- WKOX (1200 AM; 50 kW; FRAMINGHAM, MA; Owner: CAPSTAR TX LIMITED PARTNERSHIP)
- WPRO (630 AM; 5 kW; PROVIDENCE, RI; Owner: CITADEL BROADCASTING COMPANY)
- WBIX (1060 AM; 40 kW; NATICK, MA; Owner: LANGER BROADCASTING CORPORATION)
- WCRN (830 AM; 50 kW; WORCESTER, MA; Owner: CARTER BROADCASTING CORPORATION)
- WWZN (1510 AM; 50 kW; BOSTON, MA; Owner: ROSE CITY RADIO CORPORATION)
- WAMG (890 AM; 25 kW; DEDHAM, MA; Owner: MEGA COMMUNICATIONS OF DEDHAM LICENSEE, LLC)
Strongest FM radio stations in New Bedford:
- WFHN (107.1 FM; FAIRHAVEN, MA; Owner: CITADEL BROADCASTING COMPANY)
- WCTK (98.1 FM; NEW BEDFORD, MA; Owner: HALL COMMUNICATIONS, INC.)
- WJFD-FM (97.3 FM; NEW BEDFORD, MA; Owner: EDMUND DINIS, TRUSTEE)
- WSMU-FM (91.1 FM; NORTH DARTMOUTH, MA; Owner: UNIVERSITY OF MASSACHUSETTS)
- WFHL (88.1 FM; NEW BEDFORD, MA; Owner: NEW BEDFORD CHRISTIAN RADIO, INC.)
- WWBB (101.5 FM; PROVIDENCE, RI; Owner: CLEAR CHANNEL BROADCASTING LICENSES, INC.)
- WKKB (100.3 FM; MIDDLETOWN, RI; Owner: CITADEL BROADCASTING COMPANY)
- WCIB (101.9 FM; FALMOUTH, MA; Owner: QANTUM OF CAPE COD LICENSE COMPANY, LLC)
- WSNE-FM (93.3 FM; TAUNTON, MA; Owner: CAPSTAR TX LIMITED PARTNERSHIP)
- WBMX (98.5 FM; BOSTON, MA; Owner: INFINITY RADIO OPERATIONS INC.)
- WBOS (92.9 FM; BROOKLINE, MA; Owner: GREATER BOSTON RADIO, INC.)
- WXKS-FM (107.9 FM; MEDFORD, MA; Owner: AMFM RADIO LICENSES, L.L.C.)
- WJMN (94.5 FM; BOSTON, MA; Owner: AMFM RADIO LICENSES, L.L.C.)
- WCRB (102.5 FM; WALTHAM, MA; Owner: CHARLES RIVER BROADCASTING WCRB LICE)
- WTKK (96.9 FM; BOSTON, MA; Owner: GREATER BOSTON RADIO, INC.)
- WROR-FM (105.7 FM; FRAMINGHAM, MA; Owner: GREATER BOSTON RADIO, INC.)
- WBRU (95.5 FM; PROVIDENCE, RI; Owner: BROWN BROADCASTING SERVICE, INC.)
- WTWV (101.1 FM; MASHPEE, MA; Owner: BOCH BROADCASTING, L.P.)
- WHJY (94.1 FM; PROVIDENCE, RI; Owner: CAPSTAR TX LIMITED PARTNERSHIP)
- WPRO-FM (92.3 FM; PROVIDENCE, RI; Owner: CITADEL BROADCASTING COMPANY)
TV broadcast stations around New Bedford:
- WLWC (Channel 28; NEW BEDFORD, MA; Owner: C-28 FCC LICENSEE SUBSIDIARY, LLC)
- WLNE-TV (Channel 6; NEW BEDFORD, MA; Owner: FREEDOM BROADCASTING OF SOUTHERN NEW ENGLAND, INC.)
- WNAC-TV (Channel 64; PROVIDENCE, RI; Owner: WNAC, LLC)
- WPRI-TV (Channel 12; PROVIDENCE, RI; Owner: TVL BROADCASTING OF RHODE ISLAND, LLC)
- WJAR (Channel 10; PROVIDENCE, RI; Owner: OUTLET BROADCASTING, INC.)
- WWDP (Channel 46; NORWELL, MA; Owner: NORWELL TELEVISION, LLC)
- WSBE-TV (Channel 36; PROVIDENCE, RI; Owner: RHODE ISLAND PUBLIC TELECOM. AUTHORITY)
- WCVB-TV (Channel 5; BOSTON, MA; Owner: WCVB HEARST-ARGYLE TV, INC.)
- WPXQ (Channel 69; BLOCK ISLAND, RI; Owner: OCEAN STATE TELEVISION, L.L.C.)
- WGBH-TV (Channel 2; BOSTON, MA; Owner: WGBH EDUCATIONAL FOUNDATION)
- WMFP (Channel 62; LAWRENCE, MA; Owner: WSAH LICENSE, INC.)
- WSBK-TV (Channel 38; BOSTON, MA; Owner: VIACOM INC.)
- WLVI-TV (Channel 56; CAMBRIDGE, MA; Owner: WLVI, INC.)
- WBZ-TV (Channel 4; BOSTON, MA; Owner: VIACOM INC.)
- WGBX-TV (Channel 44; BOSTON, MA; Owner: WGBH EDUCATIONAL FOUNDATION)
- WFXT (Channel 25; BOSTON, MA; Owner: FOX TELEVISION STATIONS INC.)
Medal of Honor Recipients
Medal of Honor Recipient born in New Bedford: John Duffey.
- National Bridge Inventory (NBI) Statistics
- 35Number of bridges
- 650ft / 198mTotal length
- $194,772,000Total costs
- 1,021,867Total average daily traffic
- 49,795Total average daily truck traffic
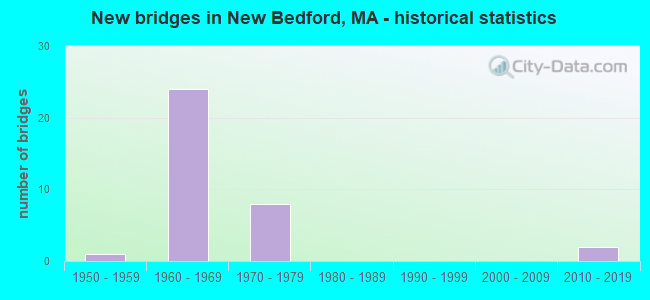
- New bridges - historical statistics
- 11950-1959
- 241960-1969
- 81970-1979
- 22010-2019
FCC Registered Antenna Towers: 157 (See the full list of FCC Registered Antenna Towers)
FCC Registered Commercial Land Mobile Towers: 6 (See the full list of FCC Registered Commercial Land Mobile Towers in New Bedford, MA)
FCC Registered Private Land Mobile Towers: 1 (See the full list of FCC Registered Private Land Mobile Towers)
FCC Registered Broadcast Land Mobile Towers: 33 (See the full list of FCC Registered Broadcast Land Mobile Towers)
FCC Registered Microwave Towers: 36 (See the full list of FCC Registered Microwave Towers in this town)
FCC Registered Paging Towers: 11 (See the full list of FCC Registered Paging Towers)
FCC Registered Maritime Coast & Aviation Ground Towers: 26 (See the full list of FCC Registered Maritime Coast & Aviation Ground Towers)
FCC Registered Amateur Radio Licenses: 280 (See the full list of FCC Registered Amateur Radio Licenses in New Bedford)
FAA Registered Aircraft: 30 (See the full list of FAA Registered Aircraft in New Bedford)
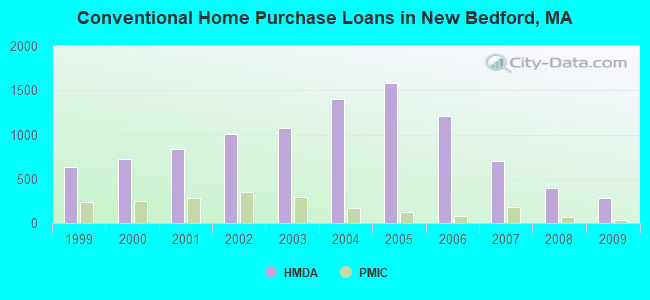
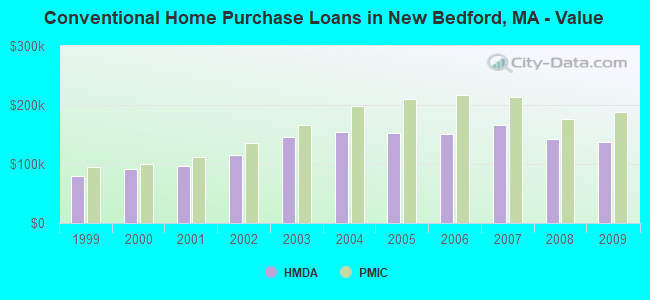
| Home Mortgage Disclosure Act Aggregated Statistics For Year 2009 (Based on 31 full tracts) | ||||||||||||||
| A) FHA, FSA/RHS & VA Home Purchase Loans | B) Conventional Home Purchase Loans | C) Refinancings | D) Home Improvement Loans | E) Loans on Dwellings For 5+ Families | F) Non-occupant Loans on < 5 Family Dwellings (A B C & D) | G) Loans On Manufactured Home Dwelling (A B C & D) | ||||||||
|---|---|---|---|---|---|---|---|---|---|---|---|---|---|---|
| Number | Average Value | Number | Average Value | Number | Average Value | Number | Average Value | Number | Average Value | Number | Average Value | Number | Average Value | |
| LOANS ORIGINATED | 273 | $173,883 | 288 | $137,438 | 1,104 | $168,740 | 84 | $54,667 | 12 | $2,976,833 | 133 | $150,669 | 1 | $134,000 |
| APPLICATIONS APPROVED, NOT ACCEPTED | 13 | $179,077 | 25 | $110,480 | 88 | $183,818 | 8 | $74,250 | 0 | $0 | 10 | $111,300 | 0 | $0 |
| APPLICATIONS DENIED | 58 | $158,776 | 84 | $105,714 | 469 | $185,215 | 46 | $62,022 | 4 | $161,500 | 40 | $146,100 | 0 | $0 |
| APPLICATIONS WITHDRAWN | 33 | $173,939 | 27 | $122,778 | 242 | $179,715 | 9 | $60,667 | 3 | $3,181,000 | 21 | $142,095 | 0 | $0 |
| FILES CLOSED FOR INCOMPLETENESS | 14 | $151,929 | 8 | $153,000 | 72 | $186,278 | 8 | $82,750 | 0 | $0 | 4 | $113,000 | 0 | $0 |
Detailed mortgage data for all 31 tracts in New Bedford, MA
| Private Mortgage Insurance Companies Aggregated Statistics For Year 2009 (Based on 22 full tracts) | ||||||||
| A) Conventional Home Purchase Loans | B) Refinancings | C) Non-occupant Loans on < 5 Family Dwellings (A & B) | D) Loans On Manufactured Home Dwelling (A & B) | |||||
|---|---|---|---|---|---|---|---|---|
| Number | Average Value | Number | Average Value | Number | Average Value | Number | Average Value | |
| LOANS ORIGINATED | 33 | $187,394 | 17 | $213,353 | 0 | $0 | 0 | $0 |
| APPLICATIONS APPROVED, NOT ACCEPTED | 14 | $140,214 | 14 | $224,071 | 0 | $0 | 1 | $242,000 |
| APPLICATIONS DENIED | 5 | $163,800 | 7 | $221,857 | 0 | $0 | 0 | $0 |
| APPLICATIONS WITHDRAWN | 2 | $177,500 | 8 | $217,000 | 0 | $0 | 0 | $0 |
| FILES CLOSED FOR INCOMPLETENESS | 1 | $131,000 | 1 | $183,000 | 1 | $183,000 | 0 | $0 |
2002 - 2018 National Fire Incident Reporting System (NFIRS) incidents
- Fire incident types reported to NFIRS in New Bedford, MA
- 2,93142.8%Structure Fires
- 2,34434.2%Outside Fires
- 1,23818.1%Mobile Property/Vehicle Fires
- 3405.0%Other
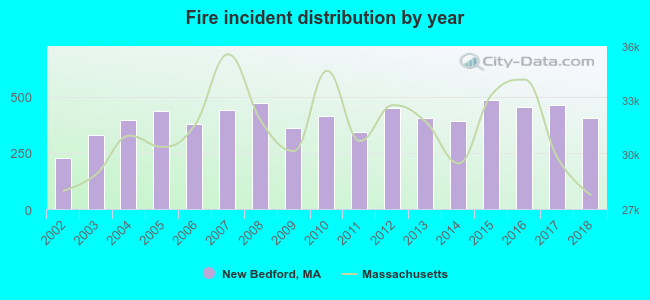 According to the data from the years 2002 - 2018 the average number of fire incidents per year is 403. The highest number of fire incidents - 484 took place in 2015, and the least - 225 in 2002. The data has a rising trend.
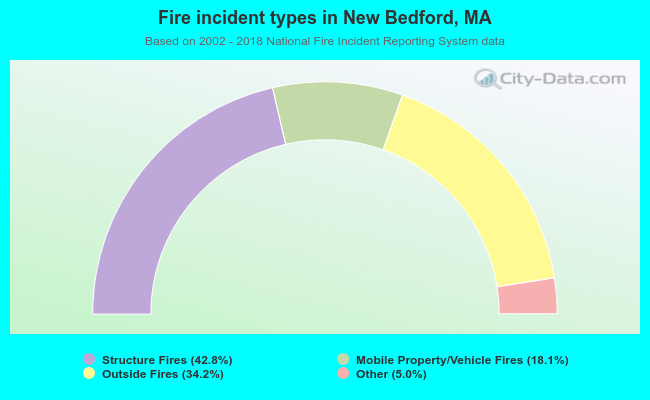 When looking into fire subcategories, the most incidents belonged to: Structure Fires (42.8%), and Outside Fires (34.2%).
Fire-safe hotels and motels in New Bedford, Massachusetts:
- Fairfield Inn & Suites, 185 Macarthur Dr, New Bedford, Massachusetts 02740 , Phone: (774) 634-2000, Fax: (774) 634-2001
- New Bedford Harbor Hotel, 222 Union St, New bedford, Massachusetts 02740 , Phone: (877) 424-6423, Fax: (508) 999-1293
| Most common first names in New Bedford, MA among deceased individuals | ||
| Name | Count | Lived (average) |
|---|---|---|
| Mary | 2,070 | 81.3 years |
| Joseph | 1,430 | 75.5 years |
| John | 1,258 | 74.6 years |
| Manuel | 1,088 | 76.3 years |
| Maria | 992 | 79.9 years |
| William | 624 | 74.3 years |
| George | 487 | 74.4 years |
| Alice | 459 | 80.0 years |
| Jose | 449 | 72.4 years |
| James | 438 | 72.8 years |
| Most common last names in New Bedford, MA among deceased individuals | ||
| Last name | Count | Lived (average) |
|---|---|---|
| Medeiros | 486 | 74.9 years |
| Sylvia | 465 | 75.9 years |
| Souza | 381 | 76.1 years |
| Silva | 349 | 77.0 years |
| Costa | 313 | 75.1 years |
| Mello | 291 | 76.4 years |
| Perry | 273 | 76.5 years |
| Santos | 237 | 74.3 years |
| Correia | 234 | 74.8 years |
| Gomes | 212 | 74.7 years |
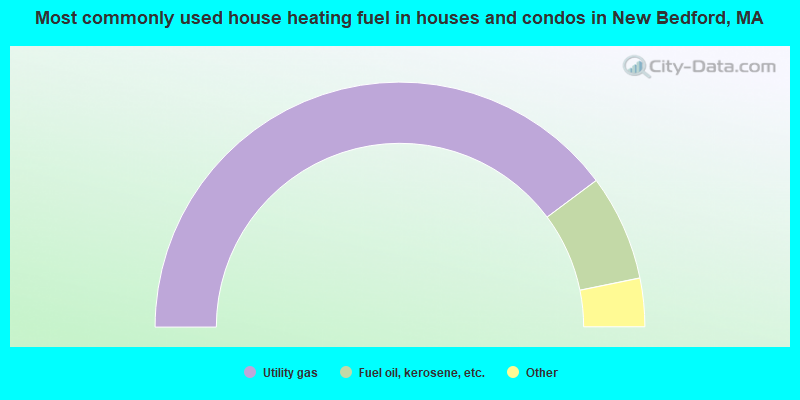
- 79.6%Utility gas
- 14.0%Fuel oil, kerosene, etc.
- 3.2%Electricity
- 1.9%Bottled, tank, or LP gas
- 0.5%Wood
- 0.5%Solar energy
- 0.3%Other fuel
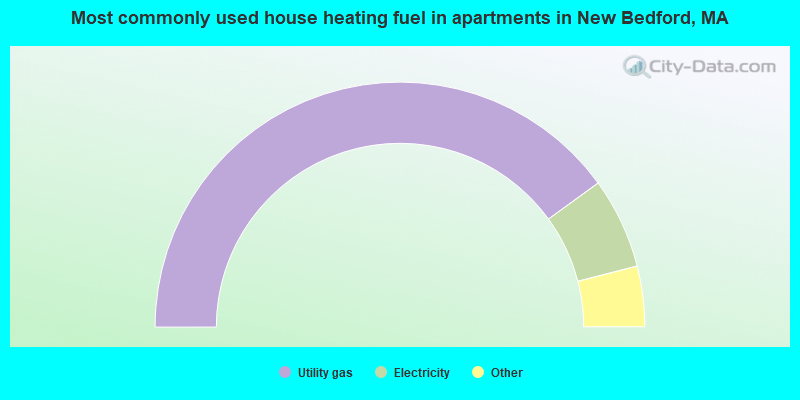
- 80.1%Utility gas
- 12.0%Electricity
- 3.9%Fuel oil, kerosene, etc.
- 2.2%Bottled, tank, or LP gas
- 1.4%No fuel used
- 0.3%Solar energy
- 0.1%Other fuel
New Bedford compared to Massachusetts state average:
- Median household income below state average.
- Median house value below state average.
- Hispanic race population percentage above state average.
- Renting percentage above state average.
- Length of stay since moving in below state average.
- Number of college students below state average.
- Percentage of population with a bachelor's degree or higher below state average.
New Bedford on our top lists:
- #4 on the list of "Top 101 cities with the most residents born in Portugal (population 500+)"
- #4 on the list of "Top 101 cities with the most residents born in Southern Europe (population 500+)"
- #17 on the list of "Top 101 cities with largest percentage of females in industries: health care and social assistance (population 50,000+)"
- #20 on the list of "Top 101 cities with the largest percentage of unmarried partner households (population 50,000+)"
- #23 on the list of "Top 101 cities with the lowest percentage of workers working at home, population 50,000+"
- #24 on the list of "Top 101 cities with largest percentage of females in occupations: healthcare support occupations (population 50,000+)"
- #24 on the list of "Top 101 cities with largest percentage of females in occupations: production occupations (population 50,000+)"
- #29 on the list of "Top 101 cities with the least people having professional degrees (population 50,000+)"
- #30 on the list of "Top 101 cities with largest percentage population decreases in the 1990s) (population 50,000+)"
- #31 on the list of "Top 101 cities with the highest number of assaults per 100,000 residents, excludes tourist destinations and others with a lot of outsiders visiting based on city industries data (population 50,000+)"
- #32 on the list of "Top 101 cities with largest percentage of males in occupations: farming, fishing, and forestry occupations (population 50,000+)"
- #35 on the list of "Top 101 cities with the smallest house values disparities (population 50,000+)"
- #37 on the list of "Top 100 cities with oldest houses (pop. 50,000+)"
- #41 on the list of "Top 101 cities with largest percentage of males in industries: construction (population 50,000+)"
- #44 on the list of "Top 101 cities with the largest percentage of people in military ships (population 1,000+)"
- #46 on the list of "Top 101 cities with largest percentage of males in occupations: production occupations (population 50,000+)"
- #51 on the list of "Top 101 cities with the most residents born in Europe (population 500+)"
- #54 on the list of "Top 100 high-educated but low-earning cities (pop. 50,000+)"
- #58 on the list of "Top 101 cities with the lowest maximum monthly sunshine amount (population 50,000+)"
- #60 on the list of "Top 101 cities with largest percentage of males in industries: agriculture, forestry, fishing and hunting (population 50,000+)"
- #7 (02744) on the list of "Top 101 zip codes with the largest percentage of Portuguese first ancestries"
- #77 (02746) on the list of "Top 101 zip codes with the lowest charity contributions deductions as a percentage of AGI in 2012 (pop 5,000+)"
- #90 (02740) on the list of "Top 101 zip codes with the most museums in 2005"
- #14 on the list of "Top 101 counties with the lowest percentage of residents that keep firearms around their homes"
- #29 on the list of "Top 101 counties with the lowest percentage of residents relocating to foreign countries in 2011 (pop. 50,000+)"
- #32 on the list of "Top 101 counties with the most Catholic congregations"
- #34 on the list of "Top 101 counties with the highest percentage of residents that smoked 100+ cigarettes in their lives"
- #41 on the list of "Top 101 counties with the most Catholic adherents"

|
|
Total of 339 patent applications in 2008-2024.