Estimated zip code population in 2022: 46,608 Zip code population in 2010: 43,087 Zip code population in 2000: 43,391
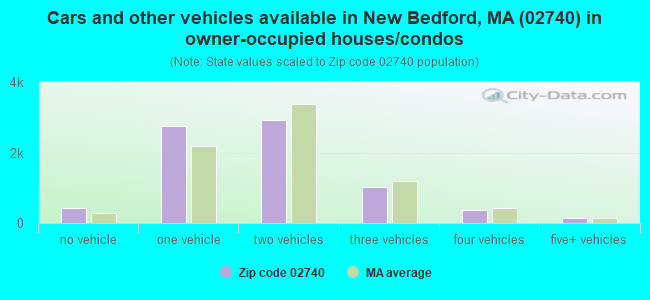
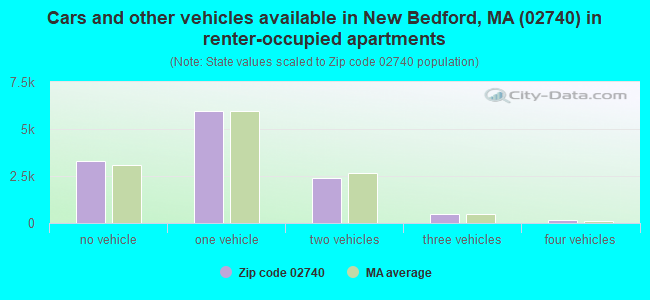
Houses and condos: 20,837 Renter-occupied apartments: 12,294
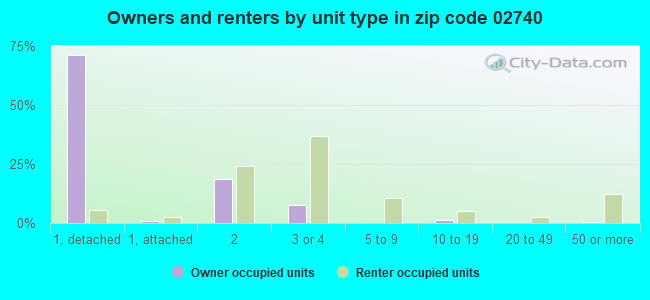
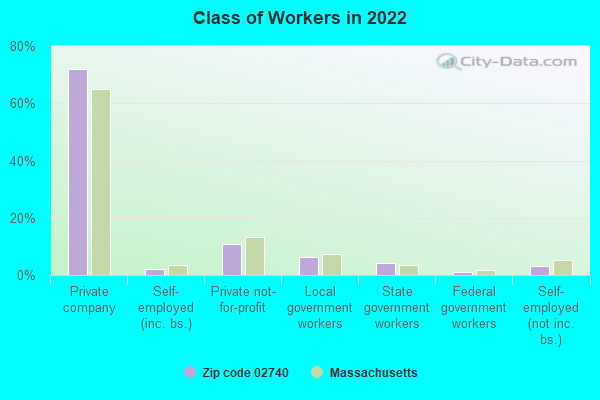
% of renters here:
62%
State:
38%
March 2022 cost of living index in zip code 02740: 131.2 (high, U.S. average is 100)
Land area: 5.7 sq. mi. Water area: 0.8 sq. mi.
Population density: 8,198 people per square mile
(high).
OSM Map
Google Map
MSN Map
OSM Map
General Map
Google Map
MSN Map
OSM Map
Google Map
MSN Map
OSM Map
Google Map
MSN Map
Please wait while loading the map...
Real estate property taxes paid for housing units in 2022:
This zip code:
1.2% ($3,817)
Massachusetts:
1.0% ($5,536)
Median real estate property taxes paid for housing units with mortgages in 2022: $3,707 (1.2%) Median real estate property taxes paid for housing units with no mortgage in 2022: $4,006 (1.4%)
Averages for the 2020 tax year for zip code 02740, filed in 2021:
Average Adjusted Gross Income (AGI) in 2020: $44,864 (Individual Income Tax Returns)
Here:
$44,864
State:
$105,130
Salary/wage: $39,353 (reported on 85.8% of returns)
Here:
$39,353
State:
$82,951
(% of AGI for various income ranges: 1195.5% for AGIs below $25k, 3493.6% for AGIs $25k-50k, 6551.8% for AGIs $50k-75k, 9658.4% for AGIs $75k-100k, 16628.2% for AGIs $100k-200k, 61201.7% for AGIs over 200k)
Taxable interest for individuals: $626 (reported on 19.3% of returns)
This zip code:
$626
Massachusetts:
$2,361
(% of AGI for various income ranges: 8.1% for AGIs below $25k, 6.8% for AGIs $25k-50k, 23.4% for AGIs $50k-75k, 28.3% for AGIs $75k-100k, 57.8% for AGIs $100k-200k, 573.3% for AGIs over 200k)
Ordinary dividends: $3,304 (reported on 7.5% of returns)
Here:
$3,304
State:
$10,365
(% of AGI for various income ranges: 8.2% for AGIs below $25k, 8.9% for AGIs $25k-50k, 30.2% for AGIs $50k-75k, 67.8% for AGIs $75k-100k, 132.5% for AGIs $100k-200k, 2695.0% for AGIs over 200k)
Net capital gain/loss in AGI: +$11,443 (reported on 6.7% of returns)
Here:
+$11,443
State:
+$48,178
(% of AGI for various income ranges: 3.2% for AGIs below $25k, 10.8% for AGIs $25k-50k, 30.5% for AGIs $50k-75k, 110.8% for AGIs $75k-100k, 422.8% for AGIs $100k-200k, 16126.7% for AGIs over 200k)
Profit/loss from business: +$11,145 (reported on 11.0% of returns)
Here:
+$11,145
State:
+$20,792
(% of AGI for various income ranges: 60.0% for AGIs below $25k, 87.8% for AGIs $25k-50k, 186.0% for AGIs $50k-75k, 269.7% for AGIs $75k-100k, 790.6% for AGIs $100k-200k, 5240.0% for AGIs over 200k)
Taxable individual retirement arrangement distribution: $14,187 (reported on 4.3% of returns)
02740:
$14,187
Massachusetts:
$22,790
(% of AGI for various income ranges: 28.5% for AGIs below $25k, 29.1% for AGIs $25k-50k, 91.5% for AGIs $50k-75k, 176.4% for AGIs $75k-100k, 458.7% for AGIs $100k-200k, 2740.0% for AGIs over 200k)
Self-employed (Keogh) retirement plans: $8,867 (reported on 0.1% of returns)
02740:
$8,867
Massachusetts:
$26,868
(% of AGI for various income ranges: 23.5% for AGIs $75k-100k)
Total itemized deductions: $22,518 (reported on 4.5% of returns)
Here:
$22,518
State:
$36,722
(% of AGI for various income ranges: 23.1% for AGIs below $25k, 55.1% for AGIs $25k-50k, 226.8% for AGIs $50k-75k, 383.4% for AGIs $75k-100k, 621.7% for AGIs $100k-200k, 2958.3% for AGIs over 200k)
Charity contributions: $4,332 (reported on 3.3% of returns)
Here:
$4,332
State:
$12,529
(% of AGI for various income ranges: 0.8% for AGIs below $25k, 7.7% for AGIs $25k-50k, 22.5% for AGIs $50k-75k, 44.7% for AGIs $75k-100k, 93.6% for AGIs $100k-200k, 1071.7% for AGIs over 200k)
Taxes paid: $7,369 (reported on 4.4% of returns)
02740:
$7,369
State:
$8,782
(% of AGI for various income ranges: 5.3% for AGIs below $25k, 13.7% for AGIs $25k-50k, 79.5% for AGIs $50k-75k, 139.4% for AGIs $75k-100k, 210.3% for AGIs $100k-200k, 900.0% for AGIs over 200k)
Earned income credit: $2,208 (reported on 21.2% of returns)
Here:
$2,208
State:
$1,909
(% of AGI for various income ranges: 100.5% for AGIs below $25k, 77.1% for AGIs $25k-50k, 0.5% for AGIs $50k-75k)
Percentage of individuals using paid preparers for their 2020 taxes: 94.1%
Here:
94%
State:
92%
(% for various income ranges: 92.7% for AGIs below $25k, 95.1% for AGIs $25k-50k, 94.5% for AGIs $50k-75k, 95.1% for AGIs $75k-100k, 94.6% for AGIs $100k-200k, 90.0% for AGIs over 200k)
Averages for the 2012 tax year for zip code 02740, filed in 2013:
Average Adjusted Gross Income (AGI) in 2012: $37,481 (Individual Income Tax Returns)
Here:
$37,481
State:
$81,425
Salary/wage: $33,134 (reported on 88.6% of returns)
Here:
$33,134
State:
$64,752
(% of AGI for various income ranges: 80.8% for AGIs below $25k, 85.2% for AGIs $25k-50k, 82.1% for AGIs $50k-75k, 80.5% for AGIs $75k-100k, 74.6% for AGIs $100k-200k, 40.0% for AGIs over 200k)
Taxable interest for individuals: $664 (reported on 23.5% of returns)
This zip code:
$664
Massachusetts:
$2,136
(% of AGI for various income ranges: 0.5% for AGIs below $25k, 0.3% for AGIs $25k-50k, 0.3% for AGIs $50k-75k, 0.4% for AGIs $75k-100k, 0.3% for AGIs $100k-200k, 1.1% for AGIs over 200k)
Ordinary dividends: $3,101 (reported on 9.5% of returns)
Here:
$3,101
State:
$9,473
(% of AGI for various income ranges: 0.6% for AGIs below $25k, 0.4% for AGIs $25k-50k, 0.5% for AGIs $50k-75k, 0.7% for AGIs $75k-100k, 1.0% for AGIs $100k-200k, 3.3% for AGIs over 200k)
Net capital gain/loss in AGI: +$7,955 (reported on 6.1% of returns)
Here:
+$7,955
State:
+$31,437
(% of AGI for various income ranges: 0.1% for AGIs $50k-75k, 0.5% for AGIs $75k-100k, 1.1% for AGIs $100k-200k, 14.3% for AGIs over 200k)
Profit/loss from business: +$16,240 (reported on 9.2% of returns)
Here:
+$16,240
State:
+$20,662
(% of AGI for various income ranges: 4.0% for AGIs below $25k, 2.5% for AGIs $25k-50k, 2.9% for AGIs $50k-75k, 3.7% for AGIs $75k-100k, 8.0% for AGIs $100k-200k, 3.8% for AGIs over 200k)
Taxable individual retirement arrangement distribution: $10,764 (reported on 5.6% of returns)
02740:
$10,764
Massachusetts:
$18,892
(% of AGI for various income ranges: 1.6% for AGIs below $25k, 1.2% for AGIs $25k-50k, 1.3% for AGIs $50k-75k, 1.2% for AGIs $75k-100k, 2.6% for AGIs $100k-200k, 2.7% for AGIs over 200k)
Self-employment retirement plans: $15,750 (reported on 0.2% of returns)
02740:
$15,750
Massachusetts:
$20,669
Total itemized deductions: $17,679 (22% of AGI, reported on 19.3% of returns)
Here:
$17,679
State:
$28,907
Here:
22.1% of AGI
State:
18.2% of AGI
(% of AGI for various income ranges: 4.1% for AGIs below $25k, 6.7% for AGIs $25k-50k, 10.0% for AGIs $50k-75k, 11.3% for AGIs $75k-100k, 13.8% for AGIs $100k-200k, 12.0% for AGIs over 200k)
Charity contributions: $1,916 (reported on 14.2% of returns)
Here:
$1,916
State:
$4,208
(% of AGI for various income ranges: 0.2% for AGIs below $25k, 0.4% for AGIs $25k-50k, 0.7% for AGIs $50k-75k, 0.9% for AGIs $75k-100k, 1.2% for AGIs $100k-200k, 1.7% for AGIs over 200k)
Taxes paid: $6,611 (reported on 19.3% of returns)
02740:
$6,611
State:
$13,303
(% of AGI for various income ranges: 0.9% for AGIs below $25k, 2.0% for AGIs $25k-50k, 3.5% for AGIs $50k-75k, 4.3% for AGIs $75k-100k, 6.2% for AGIs $100k-200k, 5.9% for AGIs over 200k)
Earned income credit: $2,200 (reported on 26.5% of returns)
Here:
$2,200
State:
$1,971
(% of AGI for various income ranges: 7.6% for AGIs below $25k, 1.2% for AGIs $25k-50k)
Percentage of individuals using paid preparers for their 2012 taxes: 60.3%
Here:
60%
State:
56%
(% for various income ranges: 56.7% for AGIs below $25k, 59.8% for AGIs $25k-50k, 65.8% for AGIs $50k-75k, 69.1% for AGIs $75k-100k, 70.9% for AGIs $100k-200k, 90.9% for AGIs over 200k)
Averages for the 2004 tax year for zip code 02740, filed in 2005:
Average Adjusted Gross Income (AGI) in 2004: $33,776 (Individual Income Tax Returns)
Here:
$33,776
State:
$62,877
Salary/wage: $30,987 (reported on 88.6% of returns)
Here:
$30,987
State:
$52,969
(% of AGI for various income ranges: 93.5% for AGIs below $10k, 83.0% for AGIs $10k-25k, 87.3% for AGIs $25k-50k, 85.2% for AGIs $50k-75k, 81.5% for AGIs $75k-100k, 63.7% for AGIs over 100k)
Taxable interest for individuals: $1,107 (reported on 37.3% of returns)
This zip code:
$1,107
Massachusetts:
$1,945
(% of AGI for various income ranges: 2.5% for AGIs below $10k, 1.4% for AGIs $10k-25k, 0.9% for AGIs $25k-50k, 1.1% for AGIs $50k-75k, 0.9% for AGIs $75k-100k, 1.6% for AGIs over 100k)
Taxable dividends: $2,529 (reported on 13.0% of returns)
Here:
$2,529
State:
$5,323
(% of AGI for various income ranges: 1.0% for AGIs below $10k, 0.7% for AGIs $10k-25k, 0.4% for AGIs $25k-50k, 0.7% for AGIs $50k-75k, 0.8% for AGIs $75k-100k, 2.5% for AGIs over 100k)
Net capital gain/loss: +$9,128 (reported on 9.6% of returns)
Here:
+$9,128
State:
+$20,377
(% of AGI for various income ranges: -1.0% for AGIs below $10k, 0.3% for AGIs $10k-25k, 0.4% for AGIs $25k-50k, 0.7% for AGIs $50k-75k, 2.0% for AGIs $75k-100k, 11.2% for AGIs over 100k)
Profit/loss from business: +$13,488 (reported on 9.6% of returns)
Here:
+$13,488
State:
+$17,837
(% of AGI for various income ranges: 5.3% for AGIs below $10k, 3.5% for AGIs $10k-25k, 2.8% for AGIs $25k-50k, 2.6% for AGIs $50k-75k, 4.1% for AGIs $75k-100k, 6.8% for AGIs over 100k)
IRA payment deduction: $2,756 (reported on 2.0% of returns)
02740:
$2,756
Massachusetts:
$3,100
(% of AGI for various income ranges: 0.1% for AGIs $10k-25k, 0.2% for AGIs $25k-50k, 0.2% for AGIs $50k-75k, 0.1% for AGIs $75k-100k, 0.1% for AGIs over 100k)
Self-employed pension: $10,242 (reported on 0.3% of returns)
Here:
$10,242
Massachusetts:
$14,516
Total itemized deductions: $15,314 (22% of AGI, reported on 21.9% of returns)
Here:
$15,314
State:
$22,573
Here:
22.2% of AGI
State:
19.5% of AGI
(% of AGI for various income ranges: 5.1% for AGIs below $10k, 5.6% for AGIs $10k-25k, 8.5% for AGIs $25k-50k, 12.4% for AGIs $50k-75k, 14.4% for AGIs $75k-100k, 11.0% for AGIs over 100k)
Charity contributions deductions: $1,699 (2% of AGI, reported on 19.1% of returns)
Here:
$1,699
State:
$3,295
Here:
2.3% of AGI
State:
2.7% of AGI
(% of AGI for various income ranges: 0.2% for AGIs below $10k, 0.4% for AGIs $10k-25k, 0.7% for AGIs $25k-50k, 1.1% for AGIs $50k-75k, 1.2% for AGIs $75k-100k, 1.7% for AGIs over 100k)
Total tax: $4,782 (reported on 70.4% of returns)
02740:
$4,782
State:
$11,494
(% of AGI for various income ranges: 1.9% for AGIs below $10k, 3.9% for AGIs $10k-25k, 7.3% for AGIs $25k-50k, 9.2% for AGIs $50k-75k, 11.2% for AGIs $75k-100k, 20.8% for AGIs over 100k)
Earned income credit: $1,700 (reported on 21.8% of returns)
Here:
$1,700
State:
$1,518
Percentage of individuals using paid preparers for their 2004 taxes: 67.0%
Here:
67%
State:
58%
(% for various income ranges: 59.6% for AGIs below $10k, 66.8% for AGIs $10k-25k, 67.6% for AGIs $25k-50k, 74.1% for AGIs $50k-75k, 74.2% for AGIs $75k-100k, 77.5% for AGIs over 100k)
Likely homosexual households (counted as self-reported same-sex unmarried-partner households)
Lesbian couples: 0.1% of all households
Gay men: 0.1% of all households
Household received Food Stamps/SNAP in the past 12 months: 7,364 Household did not receive Food Stamps/SNAP in the past 12 months: 13,308
Women who had a birth in the past 12 months: 766 (352 now married, 371 unmarried) Women who did not have a birth in the past 12 months: 10,415 (3,121 now married, 7,337 unmarried)
Housing units in zip code 02740 with a mortgage: 4,857 (614 second mortgage, 498 both second mortgage and home equity loan) Houses without a mortgage: 275
Median monthly owner costs for units with a mortgage: $1,839 Median monthly owner costs for units without a mortgage: $756
Residents with income below the poverty level in 2022:
This zip code:
19.4%
Whole state:
10.4%
Residents with income below 50% of the poverty level in 2022:
This zip code:
10.8%
Whole state:
5.1%
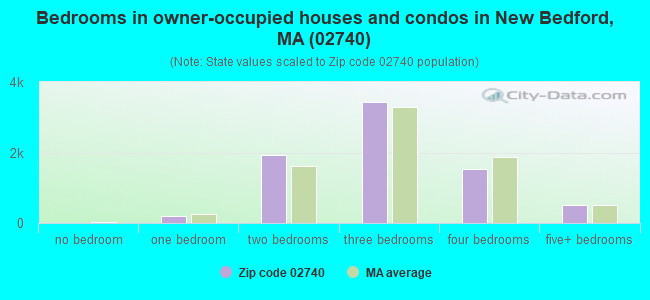
Median number of rooms in houses and condos:
Here:
6.2
State:
6.5
Median number of rooms in apartments:
Here:
4.6
State:
4.0
Notable locations in this zip code not listed on our city pages
Notable locations in zip code 02740: Doane Memorial Field (A), Massachusetts State Pier (B), New Bedford Community Center (C), New Bedford West Barrier Light (D), New Bedford East Barrier Light (E), Stop and Shop Center (F), New Bedford EMS (G), Stat Ambulance Service of New England (H), New Bedford City Hall (I), House of Corrections (J), New Bedford Fire Department Station 7 (K), New Bedford Fire Department Station 6 (L), New Bedford Fire Department Station 1 Headquarters (M), New Bedford Free Public Library (N), Whaling Museum (O), Seamens Bethel Museum (P). Display/hide their locations on the map
Tourist attractions (not listed on the city page) : New Bedford City - Libraries- Reference Desk (613 Pleasant Street), New England Steamship Foundation (24 7th Street), New Bedford Art Museum (608 Pleasant Street), New Bedford Museum Of Glass (46 North Water), New Bedford Fire Museum (51 Bedford Street).
3,727 married couples with children.
5,689 single-parent households (1,560 men, 4,129 women).
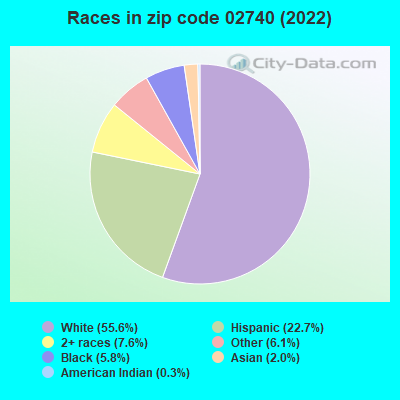
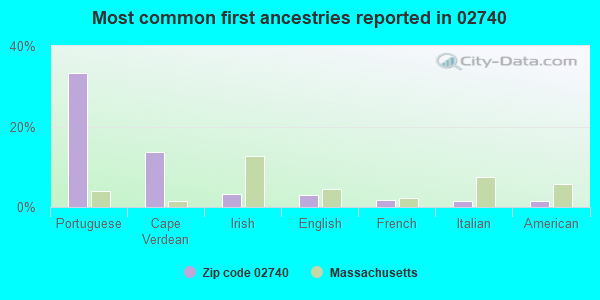
64.9% of residents of 02740 zip code speak English at home.
15.0% of residents speak Spanish at home (58% very well, 22% well, 12% not well, 8% not at all).
17.9% of residents speak other Indo-European language at home (66% very well, 20% well, 9% not well, 5% not at all).
1.0% of residents speak Asian or Pacific Island language at home (54% very well, 28% well, 14% not well, 4% not at all).
1.0% of residents speak other language at home (71% very well, 10% well, 20% not at all).
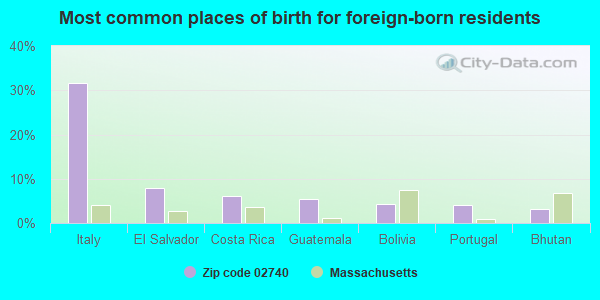
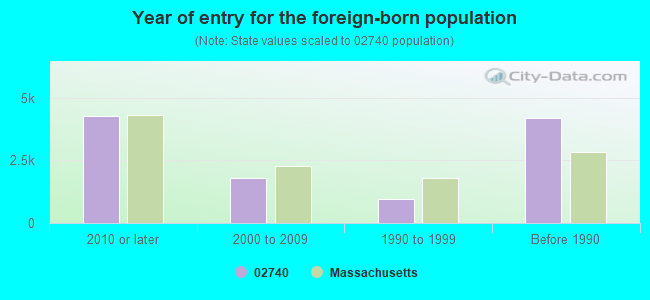
Foreign born population: 8,399 (18.0%) (55.3% of them are naturalized citizens)
Major facilities with environmental interests located in this zip code:
AMERICAN SEAFOODS INTERNATIONAL LLC (40 HERMAN MELVILLE BLVD in NEW BEDFORD, MA)
AIR MINOR (AIRS/AFS) - ICIS-, ENFORCEMENT/COMPLIANCE ACTIVITY (Integrated Compliance Information System) - ICIS-01-2001-0137, FORMAL ENFORCEMENT ACTION CRITERIA AND HAZARDOUS AIR POLLUTANT INVENTORY (Inventory of air pollution sources) Business SIC classification: PREPARED FRESH OR FROZEN FISH AND SEAFOODS
NEW BEDFORD LANDFILL (1103 SHAWMUT AVENUE in NEW BEDFORD, MA)
SUPERFUND (Superfund database) STATE MASTER (MA-EPICS) - RCRAINFO-MAD980503742, HAZARDOUS WASTE PROGRAM CRITERIA AND HAZARDOUS AIR POLLUTANT INVENTORY (Inventory of air pollution sources) (Resource Conservation and Recovery Act (tracking hazardous waste)) Business SIC classification: REFUSE SYSTEMS Business NAICS classification: SOLID WASTE LANDFILL. Organizations: NEW BEDFORD CITY OF (CONTACT/OPERATOR)
, CITY OF NEW BEDFORD (CONTACT/OWNER)
Alternative names: NEW BEDFORD CITY OF, NEW BEDFORD CITY OF LANDFILL, NEW BEDFORD LANDFILL CITY OF
YMCA OF NEW BEDFROD (25 SOUTH WATER ST in NEW BEDFORD, MA)
AIR MINOR (AIRS/AFS) AIR MONITORING SITE (Airborne pollution emission tracking) STATE MASTER (MA-EPICS) - NEI-1200153, AIR PROGRAM CRITERIA AND HAZARDOUS AIR POLLUTANT INVENTORY (Inventory of air pollution sources) Business SIC classification: MEMBERSHIP SPORTS AND RECREATION CLUBS Organizations: YMCA OF NEW BEDFORD (CONTACT/REGULATORY)
Alternative names: YMCA OF NEW BEDFORD
NEW BEDFORD HIGH SCHOOL (230 HATHAWAY BLVD in NEW BEDFORD, MA)
AIR MINOR (AIRS/AFS) (National Center for Education Statistics) - STATE ID-201505 CRITERIA AND HAZARDOUS AIR POLLUTANT INVENTORY (Inventory of air pollution sources) Business SIC classification: ELEMENTARY AND SECONDARY SCHOOLS Alternative names: NEW BEDFORD SCH DIST
KEITH JR HIGH SCHOOL (70 HATHAWAY BLVD in NEW BEDFORD, MA)
AIR MINOR (AIRS/AFS) (National Center for Education Statistics) - STATE ID-201405 CRITERIA AND HAZARDOUS AIR POLLUTANT INVENTORY (Inventory of air pollution sources) Business SIC classification: ELEMENTARY AND SECONDARY SCHOOLS Organizations: NEW BEDFORD (SCHOOL DISTRICT)
Alternative names: KEITH MIDDLE SCHOOL, NEW BED KEITH JR HS, NEW BEDFORD KEITH JUNIOR HIGH SCHOOL, NEW BEDFORD SCH DEPT
NEW BEDFORD GLOBAL LEARNING HMCS (455 COUNTY STREET in NEW BEDFORD, MA)
(National Center for Education Statistics) - STATE ID-472515 Organizations: NEW BEDFORD GLOBAL HMCS (SCHOOL DISTRICT)
ALFRED J GOMES (286 S SECOND STREET in NEW BEDFORD, MA)
(National Center for Education Statistics) - STATE ID-201063 Organizations: NEW BEDFORD (SCHOOL DISTRICT)
NEW BEDFORD (ACUSHNET ESTUARY in NEW BEDFORD, MA)
SUPERFUND NPL (Superfund database) (Integrated Compliance Information System) - ICIS-01-2001-0006, FORMAL ENFORCEMENT ACTION, ICIS-01-1982-0016, ICIS-01-1987-0001, ICIS-01-1993-0022, ICIS-01-1994-0002, Alternative names: NEW BEDFORD SITE
BETSEY B WINSLOW (561 ALLEN STREET in NEW BEDFORD, MA)
(National Center for Education Statistics) - STATE ID-201140 Organizations: NEW BEDFORD (SCHOOL DISTRICT)
ELIZABETH CARTER BROOKS (212 NEMASKET STREET in NEW BEDFORD, MA)
(National Center for Education Statistics) - STATE ID-201015 Organizations: NEW BEDFORD (SCHOOL DISTRICT)
ELLEN R HATHAWAY (256 COURT STREET in NEW BEDFORD, MA)
(National Center for Education Statistics) - STATE ID-201075 Organizations: NEW BEDFORD (SCHOOL DISTRICT)
JOHN AVERY PARKER (705 COUNTY STREET in NEW BEDFORD, MA)
(National Center for Education Statistics) - STATE ID-201115 Organizations: NEW BEDFORD (SCHOOL DISTRICT)
NEW BEDFORD CITY OF (HATHAWAY BLVD in NEW BEDFORD, MA)
(Integrated Compliance Information System) - ICIS-01-2004-7022, FORMAL ENFORCEMENT ACTION
Housing units lacking complete plumbing facilities: 1.4% Housing units lacking complete kitchen facilities: 2.2%
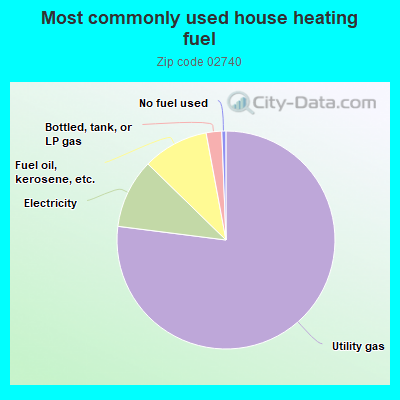
76.4%Utility gas
10.2%Electricity
9.7%Fuel oil, kerosene, etc.
2.3%Bottled, tank, or LP gas
0.6%No fuel used
Population in 1990: 46,426.
Place of birth for U.S.-born residents:
This state: 30,162
Northeast: 3,195
Midwest: 496
South: 880
West: 591
59% of the 02740 zip code residents lived in the same house 5 years ago. Out of people who lived in different houses, 82% lived in this county. Out of people who lived in different counties, 50% lived in Massachusetts.
88% of the 02740 zip code residents lived in the same house 1 year ago. Out of people who lived in different houses, 63% moved from this county. Out of people who lived in different houses, 16% moved from different county within same state. Out of people who lived in different houses, 12% moved from different state. Out of people who lived in different houses, 5% moved from abroad.
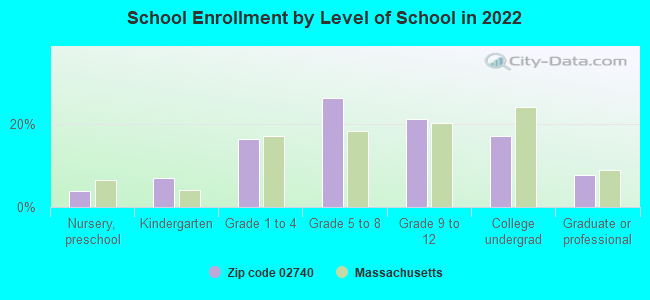
Private vs. public school enrollment:
Students in private schools in grades 1 to 8 (elementary and middle school): 364
Here:
8.0%
Massachusetts:
10.3%
Students in private schools in grades 9 to 12 (high school): 187
Here:
8.3%
Massachusetts:
12.3%
Students in private undergraduate colleges: 185
Here:
10.5%
Massachusetts:
51.2%
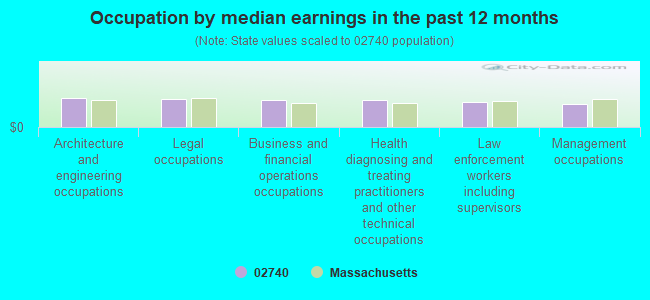
Occupation by median earnings in the past 12 months ($)
76,513Architecture and engineering occupations
73,939Legal occupations
69,959Business and financial operations occupations
69,734Health diagnosing and treating practitioners and other technical occupations
64,742Law enforcement workers including supervisors
60,596Management occupations
Companies with federal contracts located in this zip code (NEW BEDFORD, MA):
REVERE COPPER PRODUCTS, INC (24 N FRONT ST) : $453,242 in 2 contractsin 2004
$256,886 with Navy for Plate, Sheet, Strip, and Foil; Nonferrous Base Metal. Signed on 2004-06-02. Completion date: 2004-10-20.
$196,356, same as above.Signed on 2004-04-16. Completion date: 2004-07-30.
ATLANTIC ENVIRONMENTAL TECHNOL (13 HAMILTON ST; small business) : $131,270 in 2 contractsfrom 2005 to 2006
$131,270 with Army for Architect - Engineer Services (including landscaping, interior layout, and designing). Signed on 2006-06-02. Completion date: 2008-06-02.
$0 with U.S. Army Corps of Engineers - civil program financing only for Other Architect and Engineering Services. Signed on 2005-06-14. Completion date: 2006-06-13.
PARAMOUNT CORP (22 LOGAN ST)
$92,211 with Air Force for Clothing, Special Purpose. Signed on 2005-09-27. Completion date: 2005-10-28.
R A MITCHELL CO INC (103 POPES IS; small business)
$18,136 with Army for Generators and Generators Sets, Electrical. Signed on 2005-07-08. Completion date: 2005-09-09.
DBJ ENTERPRISES, INC (978 GERALDINE STREET; small business)
$6,595 with Department of Defense for Medical and Surgical Instruments, Equipment, and Supplies. Signed on 2005-05-04. Completion date: 2005-05-15.
LYMAN RK & ASSOC (246 UNION ST; small business)
$2,500 with U.S. Army Corps of Engineers - civil program financing only for Real Property Appraisals Services (SIC 6531). Signed on 2003-01-02. Completion date: 2003-02-14.
Top industries in this zip code by the number of employees in 2005:
Health Care and Social Assistance: General Medical and Surgical Hospitals (over 1000 employees: 1 establishment)
Health Care and Social Assistance: Nursing Care Facilities (250-499: 1, 100-249: 2, 50-99: 4)
Arts, Entertainment, and Recreation: Fitness and Recreational Sports Centers (250-499: 1, 20-49: 1, 10-19: 1, 5-9: 1)
Wholesale Trade: Fish and Seafood Merchant Wholesalers (50-99: 1, 20-49: 8, 10-19: 1, 5-9: 3, 1-4: 4)
Health Care and Social Assistance: Other Individual and Family Services (100-249: 1, 50-99: 1, 20-49: 2, 10-19: 2, 5-9: 5, 1-4: 6)
Professional, Scientific, and Technical Services: Offices of Lawyers (10-19: 6, 5-9: 19, 1-4: 67)
2002 - 2018 National Fire Incident Reporting System (NFIRS) incidents
According to the data from the years 2002 - 2018 the average number of fire incidents per year is 227. The highest number of reported fire incidents - 389 took place in 2008, and the least - 88 in 2002. The data has a growing trend.
When looking into fire subcategories, the most reports belonged to: Structure Fires (40.8%), and Outside Fires (35.7%).
Fire incident types reported to NFIRS in Zip Code 02740


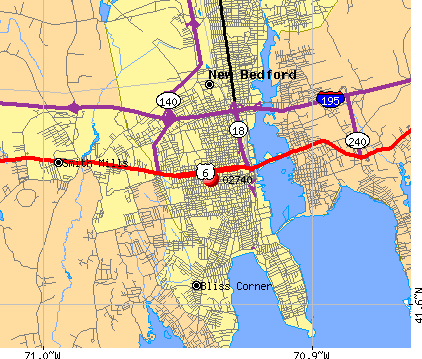 Nearest zip codes: 02746, 02744, 02745, 02719, 02747, 02743.
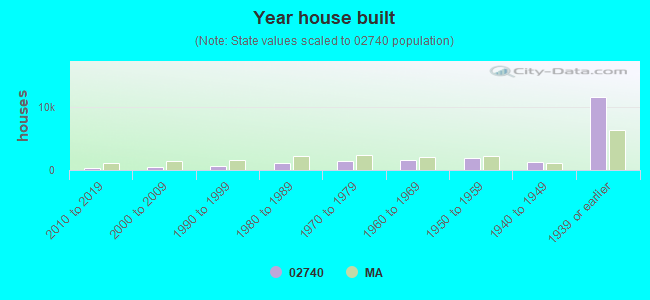


 According to the data from the years 2002 - 2018 the average number of fire incidents per year is 227. The highest number of reported fire incidents - 389 took place in 2008, and the least - 88 in 2002. The data has a growing trend.
 When looking into fire subcategories, the most reports belonged to: Structure Fires (40.8%), and Outside Fires (35.7%).