Estimated zip code population in 2022: 15,893 Zip code population in 2010: 15,873 Zip code population in 2000: 16,159
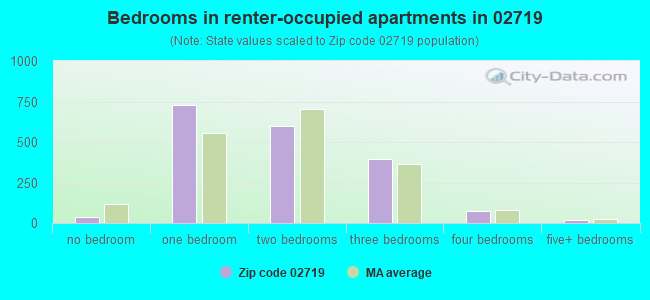
Houses and condos: 7,813 Renter-occupied apartments: 1,847
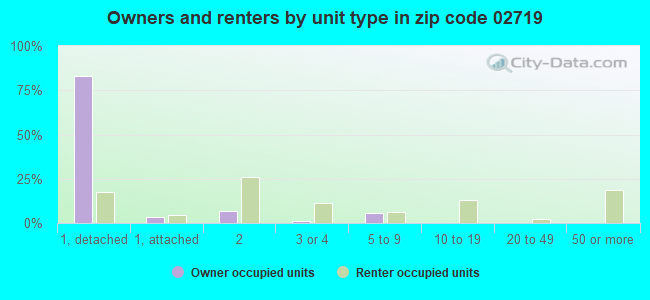
% of renters here:
26%
State:
38%
March 2022 cost of living index in zip code 02719: 129.5 (high, U.S. average is 100)
Land area: 12.3 sq. mi. Water area: 3.4 sq. mi.
Population density: 1,288 people per square mile
(low).
OSM Map
Google Map
MSN Map
OSM Map
General Map
Google Map
MSN Map
OSM Map
Google Map
MSN Map
OSM Map
Google Map
MSN Map
Please wait while loading the map...
Real estate property taxes paid for housing units in 2022:
This zip code:
0.8% ($3,238)
Massachusetts:
1.0% ($5,536)
Median real estate property taxes paid for housing units with mortgages in 2022: $3,263 (0.8%) Median real estate property taxes paid for housing units with no mortgage in 2022: $3,190 (0.8%)
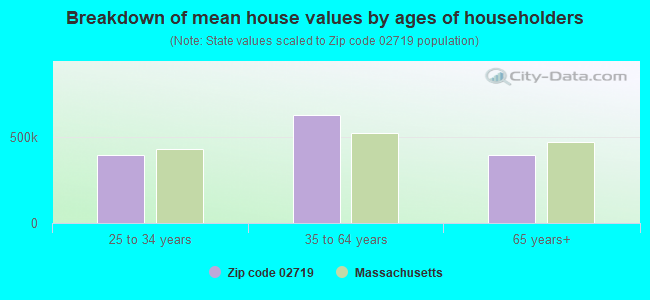
Estimated median house/condo value in 2022: $403,981
02719:
$403,981
Massachusetts:
$534,700
According to our research of Massachusetts and other state lists, there were 5 registered sex offenders living in 02719 zip code as of April 26, 2024. The ratio of all residents to sex offenders in zip code 02719 is 3,262 to 1. The ratio of registered sex offenders to all residents in this zip code is lower than the state average.
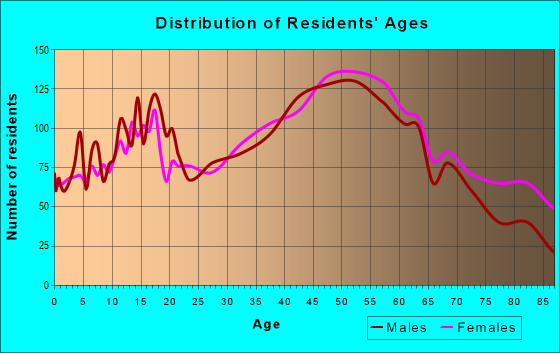
Median resident age:
This zip code:
49.3 years
Massachusetts median age:
40.3 years
Average household size:
This zip code:
2.2 people
Massachusetts:
2.4 people
Averages for the 2020 tax year for zip code 02719, filed in 2021:
Average Adjusted Gross Income (AGI) in 2020: $69,439 (Individual Income Tax Returns)
Here:
$69,439
State:
$105,130
Salary/wage: $58,814 (reported on 79.6% of returns)
Here:
$58,814
State:
$82,951
(% of AGI for various income ranges: 1161.1% for AGIs below $25k, 3318.5% for AGIs $25k-50k, 6346.9% for AGIs $50k-75k, 9417.8% for AGIs $75k-100k, 17841.2% for AGIs $100k-200k, 71065.6% for AGIs over 200k)
Taxable interest for individuals: $966 (reported on 39.0% of returns)
This zip code:
$966
Massachusetts:
$2,361
(% of AGI for various income ranges: 28.4% for AGIs below $25k, 24.1% for AGIs $25k-50k, 38.4% for AGIs $50k-75k, 58.9% for AGIs $75k-100k, 86.0% for AGIs $100k-200k, 1131.1% for AGIs over 200k)
Ordinary dividends: $4,651 (reported on 19.9% of returns)
Here:
$4,651
State:
$10,365
(% of AGI for various income ranges: 32.8% for AGIs below $25k, 42.9% for AGIs $25k-50k, 54.6% for AGIs $50k-75k, 112.5% for AGIs $75k-100k, 231.8% for AGIs $100k-200k, 4098.9% for AGIs over 200k)
Net capital gain/loss in AGI: +$12,388 (reported on 16.9% of returns)
Here:
+$12,388
State:
+$48,178
(% of AGI for various income ranges: 9.8% for AGIs below $25k, 25.1% for AGIs $25k-50k, 63.2% for AGIs $50k-75k, 200.3% for AGIs $75k-100k, 503.7% for AGIs $100k-200k, 12721.1% for AGIs over 200k)
Profit/loss from business: +$21,116 (reported on 14.6% of returns)
Here:
+$21,116
State:
+$20,792
(% of AGI for various income ranges: 93.4% for AGIs below $25k, 163.3% for AGIs $25k-50k, 295.6% for AGIs $50k-75k, 618.5% for AGIs $75k-100k, 803.3% for AGIs $100k-200k, 10182.2% for AGIs over 200k)
Taxable individual retirement arrangement distribution: $16,130 (reported on 10.7% of returns)
02719:
$16,130
Massachusetts:
$22,790
(% of AGI for various income ranges: 104.1% for AGIs below $25k, 142.8% for AGIs $25k-50k, 182.9% for AGIs $50k-75k, 389.8% for AGIs $75k-100k, 532.7% for AGIs $100k-200k, 2703.3% for AGIs over 200k)
Self-employed (Keogh) retirement plans: $19,520 (reported on 0.6% of returns)
02719:
$19,520
Massachusetts:
$26,868
(% of AGI for various income ranges: 62.0% for AGIs $75k-100k, 636.7% for AGIs over 200k)
Total itemized deductions: $24,727 (reported on 9.5% of returns)
Here:
$24,727
State:
$36,722
(% of AGI for various income ranges: 81.4% for AGIs below $25k, 126.0% for AGIs $25k-50k, 341.3% for AGIs $50k-75k, 591.1% for AGIs $75k-100k, 806.4% for AGIs $100k-200k, 3635.6% for AGIs over 200k)
Charity contributions: $4,613 (reported on 6.4% of returns)
Here:
$4,613
State:
$12,529
(% of AGI for various income ranges: 10.8% for AGIs $25k-50k, 21.4% for AGIs $50k-75k, 60.9% for AGIs $75k-100k, 106.9% for AGIs $100k-200k, 967.8% for AGIs over 200k)
Taxes paid: $7,715 (reported on 9.4% of returns)
02719:
$7,715
State:
$8,782
(% of AGI for various income ranges: 14.1% for AGIs below $25k, 25.9% for AGIs $25k-50k, 106.8% for AGIs $50k-75k, 201.2% for AGIs $75k-100k, 280.6% for AGIs $100k-200k, 1056.7% for AGIs over 200k)
Earned income credit: $1,706 (reported on 9.0% of returns)
Here:
$1,706
State:
$1,909
(% of AGI for various income ranges: 50.4% for AGIs below $25k, 42.0% for AGIs $25k-50k)
Percentage of individuals using paid preparers for their 2020 taxes: 93.9%
Here:
94%
State:
92%
(% for various income ranges: 92.4% for AGIs below $25k, 93.4% for AGIs $25k-50k, 95.2% for AGIs $50k-75k, 95.0% for AGIs $75k-100k, 94.6% for AGIs $100k-200k, 94.3% for AGIs over 200k)
Averages for the 2012 tax year for zip code 02719, filed in 2013:
Average Adjusted Gross Income (AGI) in 2012: $55,895 (Individual Income Tax Returns)
Here:
$55,895
State:
$81,425
Salary/wage: $48,714 (reported on 83.3% of returns)
Here:
$48,714
State:
$64,752
(% of AGI for various income ranges: 69.3% for AGIs below $25k, 76.6% for AGIs $25k-50k, 77.2% for AGIs $50k-75k, 77.4% for AGIs $75k-100k, 79.0% for AGIs $100k-200k, 44.4% for AGIs over 200k)
Taxable interest for individuals: $1,040 (reported on 40.7% of returns)
This zip code:
$1,040
Massachusetts:
$2,136
(% of AGI for various income ranges: 1.7% for AGIs below $25k, 0.7% for AGIs $25k-50k, 0.5% for AGIs $50k-75k, 0.6% for AGIs $75k-100k, 0.6% for AGIs $100k-200k, 1.3% for AGIs over 200k)
Ordinary dividends: $3,147 (reported on 19.9% of returns)
Here:
$3,147
State:
$9,473
(% of AGI for various income ranges: 1.6% for AGIs below $25k, 0.8% for AGIs $25k-50k, 0.9% for AGIs $50k-75k, 0.9% for AGIs $75k-100k, 0.8% for AGIs $100k-200k, 2.3% for AGIs over 200k)
Net capital gain/loss in AGI: +$4,564 (reported on 13.9% of returns)
Here:
+$4,564
State:
+$31,437
(% of AGI for various income ranges: 0.2% for AGIs below $25k, 0.3% for AGIs $50k-75k, 0.5% for AGIs $75k-100k, 1.5% for AGIs $100k-200k, 4.2% for AGIs over 200k)
Profit/loss from business: +$21,609 (reported on 14.1% of returns)
Here:
+$21,609
State:
+$20,662
(% of AGI for various income ranges: 7.4% for AGIs below $25k, 3.6% for AGIs $25k-50k, 3.5% for AGIs $50k-75k, 3.2% for AGIs $75k-100k, 6.4% for AGIs $100k-200k, 10.2% for AGIs over 200k)
Taxable individual retirement arrangement distribution: $12,622 (reported on 10.0% of returns)
02719:
$12,622
Massachusetts:
$18,892
(% of AGI for various income ranges: 4.1% for AGIs below $25k, 2.2% for AGIs $25k-50k, 2.0% for AGIs $50k-75k, 2.6% for AGIs $75k-100k, 2.8% for AGIs $100k-200k)
Self-employment retirement plans: $19,180 (reported on 0.6% of returns)
02719:
$19,180
Massachusetts:
$20,669
Total itemized deductions: $19,880 (21% of AGI, reported on 36.7% of returns)
Here:
$19,880
State:
$28,907
Here:
20.8% of AGI
State:
18.2% of AGI
(% of AGI for various income ranges: 11.0% for AGIs below $25k, 10.2% for AGIs $25k-50k, 12.9% for AGIs $50k-75k, 15.2% for AGIs $75k-100k, 14.8% for AGIs $100k-200k, 11.4% for AGIs over 200k)
Charity contributions: $1,703 (reported on 28.3% of returns)
Here:
$1,703
State:
$4,208
(% of AGI for various income ranges: 0.4% for AGIs below $25k, 0.5% for AGIs $25k-50k, 1.0% for AGIs $50k-75k, 0.7% for AGIs $75k-100k, 1.1% for AGIs $100k-200k, 0.9% for AGIs over 200k)
Taxes paid: $8,082 (reported on 36.6% of returns)
02719:
$8,082
State:
$13,303
(% of AGI for various income ranges: 2.7% for AGIs below $25k, 3.0% for AGIs $25k-50k, 4.6% for AGIs $50k-75k, 5.9% for AGIs $75k-100k, 6.6% for AGIs $100k-200k, 6.8% for AGIs over 200k)
Earned income credit: $1,764 (reported on 12.1% of returns)
Here:
$1,764
State:
$1,971
(% of AGI for various income ranges: 3.9% for AGIs below $25k, 0.6% for AGIs $25k-50k)
Percentage of individuals using paid preparers for their 2012 taxes: 62.0%
Here:
62%
State:
56%
(% for various income ranges: 54.7% for AGIs below $25k, 60.8% for AGIs $25k-50k, 64.9% for AGIs $50k-75k, 68.9% for AGIs $75k-100k, 70.5% for AGIs $100k-200k, 92.9% for AGIs over 200k)
Averages for the 2004 tax year for zip code 02719, filed in 2005:
Average Adjusted Gross Income (AGI) in 2004: $44,946 (Individual Income Tax Returns)
Here:
$44,946
State:
$62,877
Salary/wage: $40,420 (reported on 84.7% of returns)
Here:
$40,420
State:
$52,969
(% of AGI for various income ranges: 97.5% for AGIs below $10k, 70.2% for AGIs $10k-25k, 81.7% for AGIs $25k-50k, 81.7% for AGIs $50k-75k, 84.0% for AGIs $75k-100k, 62.0% for AGIs over 100k)
Taxable interest for individuals: $1,130 (reported on 55.9% of returns)
This zip code:
$1,130
Massachusetts:
$1,945
(% of AGI for various income ranges: 5.7% for AGIs below $10k, 2.7% for AGIs $10k-25k, 1.3% for AGIs $25k-50k, 1.0% for AGIs $50k-75k, 0.9% for AGIs $75k-100k, 1.6% for AGIs over 100k)
Taxable dividends: $1,980 (reported on 25.0% of returns)
Here:
$1,980
State:
$5,323
(% of AGI for various income ranges: 3.5% for AGIs below $10k, 1.7% for AGIs $10k-25k, 0.9% for AGIs $25k-50k, 0.6% for AGIs $50k-75k, 0.6% for AGIs $75k-100k, 1.8% for AGIs over 100k)
Net capital gain/loss: +$7,288 (reported on 18.6% of returns)
Here:
+$7,288
State:
+$20,377
(% of AGI for various income ranges: -1.7% for AGIs below $10k, -0.0% for AGIs $10k-25k, 0.4% for AGIs $25k-50k, 0.8% for AGIs $50k-75k, 1.4% for AGIs $75k-100k, 9.3% for AGIs over 100k)
Profit/loss from business: +$15,886 (reported on 15.2% of returns)
Here:
+$15,886
State:
+$17,837
(% of AGI for various income ranges: 5.4% for AGIs below $10k, 6.2% for AGIs $10k-25k, 4.2% for AGIs $25k-50k, 3.6% for AGIs $50k-75k, 5.5% for AGIs $75k-100k, 7.5% for AGIs over 100k)
IRA payment deduction: $3,402 (reported on 3.5% of returns)
02719:
$3,402
Massachusetts:
$3,100
(% of AGI for various income ranges: 0.3% for AGIs $10k-25k, 0.3% for AGIs $25k-50k, 0.3% for AGIs $50k-75k, 0.3% for AGIs $75k-100k, 0.3% for AGIs over 100k)
Self-employed pension: $12,537 (reported on 0.9% of returns)
Here:
$12,537
Massachusetts:
$14,516
(% of AGI for various income ranges: 0.2% for AGIs $50k-75k, 0.3% for AGIs $75k-100k, 0.5% for AGIs over 100k)
Total itemized deductions: $16,080 (22% of AGI, reported on 39.0% of returns)
Here:
$16,080
State:
$22,573
Here:
21.7% of AGI
State:
19.5% of AGI
(% of AGI for various income ranges: 21.5% for AGIs below $10k, 11.0% for AGIs $10k-25k, 12.7% for AGIs $25k-50k, 15.5% for AGIs $50k-75k, 16.1% for AGIs $75k-100k, 12.7% for AGIs over 100k)
Charity contributions deductions: $1,542 (2% of AGI, reported on 35.0% of returns)
Here:
$1,542
State:
$3,295
Here:
2.0% of AGI
State:
2.7% of AGI
(% of AGI for various income ranges: 0.8% for AGIs below $10k, 0.7% for AGIs $10k-25k, 0.9% for AGIs $25k-50k, 1.2% for AGIs $50k-75k, 1.4% for AGIs $75k-100k, 1.6% for AGIs over 100k)
Total tax: $6,226 (reported on 80.7% of returns)
02719:
$6,226
State:
$11,494
(% of AGI for various income ranges: 3.2% for AGIs below $10k, 4.7% for AGIs $10k-25k, 8.0% for AGIs $25k-50k, 9.4% for AGIs $50k-75k, 10.8% for AGIs $75k-100k, 18.0% for AGIs over 100k)
Earned income credit: $1,348 (reported on 9.5% of returns)
Here:
$1,348
State:
$1,518
Percentage of individuals using paid preparers for their 2004 taxes: 64.5%
Here:
64%
State:
58%
(% for various income ranges: 52.8% for AGIs below $10k, 61.9% for AGIs $10k-25k, 63.5% for AGIs $25k-50k, 70.9% for AGIs $50k-75k, 72.0% for AGIs $75k-100k, 80.1% for AGIs over 100k)
Household received Food Stamps/SNAP in the past 12 months: 828 Household did not receive Food Stamps/SNAP in the past 12 months: 6,250
Women who had a birth in the past 12 months: 106 (21 now married, 74 unmarried) Women who did not have a birth in the past 12 months: 3,022 (1,110 now married, 1,912 unmarried)
Housing units in zip code 02719 with a mortgage: 3,346 (620 second mortgage, 13 home equity loan, 318 both second mortgage and home equity loan) Houses without a mortgage: 88
Median monthly owner costs for units with a mortgage: $2,046 Median monthly owner costs for units without a mortgage: $679
Residents with income below the poverty level in 2022:
This zip code:
7.6%
Whole state:
10.4%
Residents with income below 50% of the poverty level in 2022:
This zip code:
3.1%
Whole state:
5.1%
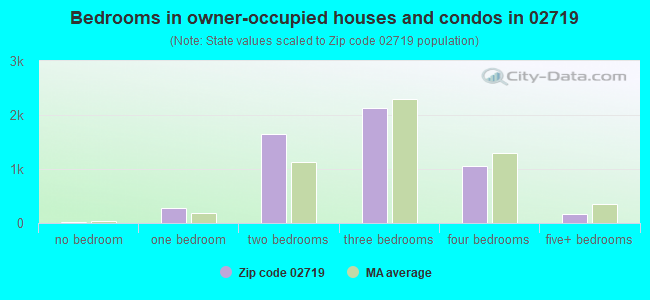
Median number of rooms in houses and condos:
Here:
5.9
State:
6.5
Median number of rooms in apartments:
Here:
3.7
State:
4.0
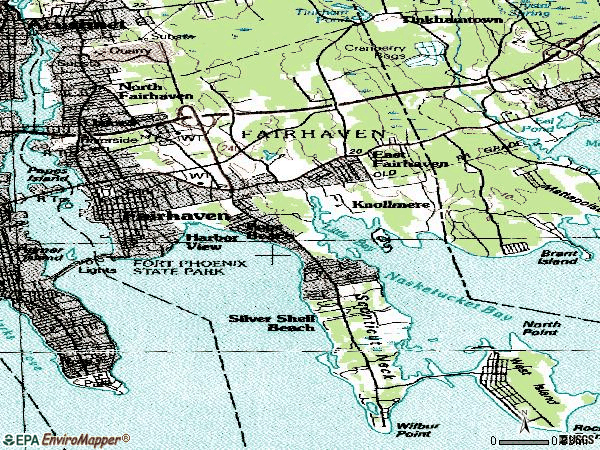
Notable locations in this zip code not listed on our city pages
Notable locations in zip code 02719: Berdon Plaza (A), Fairhaven Plaza (B), Fairhaven Townhall (C), Fairhaven Fire Department (D), Fairhaven High School Library (E), Millicent Library (F). Display/hide their locations on the map
Parks in zip code 02719 include: Fort Phoenix Beach State Reservation (1), Cushman Park (2), Livesey Park (3), South Shore Marshes Wildlife Management Area (4), Camp Echo (5). Display/hide their locations on the map
1,489 married couples with children.
648 single-parent households (320 men, 328 women).
90.1% of residents of 02719 zip code speak English at home.
1.1% of residents speak Spanish at home (41% very well, 34% well, 25% not well).
7.4% of residents speak other Indo-European language at home (70% very well, 13% well, 16% not well, 1% not at all).
1.1% of residents speak Asian or Pacific Island language at home (47% very well, 1% well, 47% not well, 5% not at all).
0.1% of residents speak other language at home (100% very well).
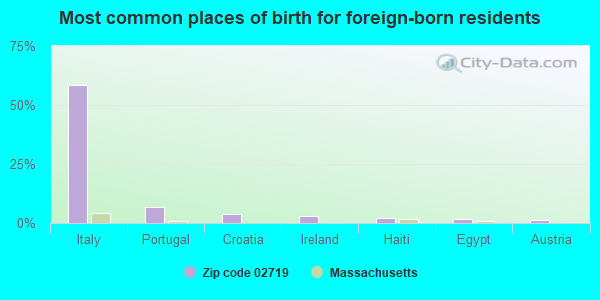
Foreign born population: 853 (5.4%) (86.9% of them are naturalized citizens)
This zip code:
5.4%
Whole state:
18.0%
58%Italy
7%Portugal
4%Croatia
3%Ireland
2%Haiti
2%Egypt
1%Austria
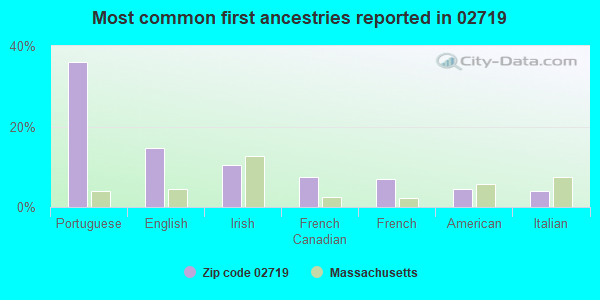
36%Portuguese
15%English
11%Irish
7%French Canadian
7%French
4%American
4%Italian
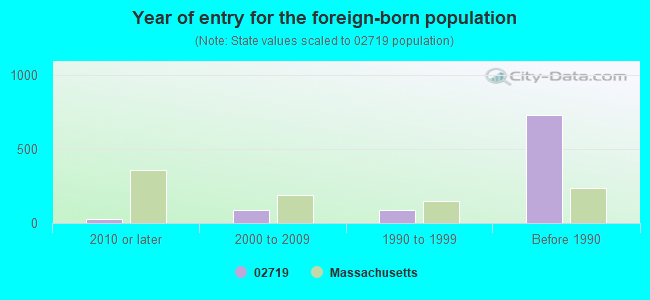
Year of entry for the foreign-born population
292010 or later
852000 to 2009
881990 to 1999
731Before 1990
Major facilities with environmental interests located in this zip code:
ATLAS TACK (PLEASANT ST in FAIRHAVEN, MA)
SUPERFUND NPL (Superfund database) - ICIS-01-2004-0030, FORMAL ENFORCEMENT ACTION, ICIS-01-2004-0033, (Integrated Compliance Information System) - ICIS-01-1999-0104, FORMAL ENFORCEMENT ACTION (Resource Conservation and Recovery Act (tracking hazardous waste)) Business SIC classification: FABRICATED METAL PRODUCTS
OXFORD SCHOOL (347 MAIN ST in FAIRHAVEN, MA)
AIR MINOR (AIRS/AFS) (National Center for Education Statistics) - STATE ID-094015 CRITERIA AND HAZARDOUS AIR POLLUTANT INVENTORY (Inventory of air pollution sources) Business SIC classification: ELEMENTARY AND SECONDARY SCHOOLS Organizations: FAIRHAVEN (SCHOOL DISTRICT)
LEROY WOOD SCHOOL (60 SCONTICUT NECK RD in FAIRHAVEN (TOWN OF), MA)
AIR MONITORING SITE (Airborne pollution emission tracking) (National Center for Education Statistics) - STATE ID-094030 Organizations: FAIRHAVEN (SCHOOL DISTRICT)
EAST FAIRHAVEN (2 NEW BOSTON RD in FAIRHAVEN, MA)
(National Center for Education Statistics) - STATE ID-094010
E-Z BLEACH (4 RIDGECREST AVE in FAIRHAVEN, MA)
COMPLIANCE ACTIVITY (Tracking inspections of insecticide, fungicide, and rodenticide, and toxic substances) - ICIS-01-2003-0082, FORMAL ENFORCEMENT ACTION
AUTO ZONE 5067 (35 BERDON WAY in FAIRHAVEN, MA)
(Resource Conservation and Recovery Act (tracking hazardous waste)) Organizations: AUTO ZONE INC (CONTACT/OWNER)
Alternative names: AUTO ZONE 5067 A D A P INC
MIDAS MUFFLER (204 HUTTLESTON AVE in FAIRHAVEN, MA)
(Resource Conservation and Recovery Act (tracking hazardous waste)) Business NAICS classification: GENERAL AUTOMOTIVE REPAIR.; OTHER AUTOMOTIVE MECHANICAL AND ELECTRICAL REPAIR AND MAINTENANCE. Organizations: MIDAL REALTY CORP (CONTACT/OWNER)
NEW BEDFORD THREAD CO INC (10 HOWLAND STREET in FAIRHAVEN, MA)
AIR MINOR (AIRS/AFS) CRITERIA AND HAZARDOUS AIR POLLUTANT INVENTORY (Inventory of air pollution sources) TRI REPORTER (Tracking of toxic chemicals releasing facilities) Business SIC classification: THREAD MILLS
AT&T FAIRHAVEN (200 MILL ROAD in FAIRHAVEN, MA)
AIR SYNTHETIC MINOR (AIRS/AFS) CRITERIA AND HAZARDOUS AIR POLLUTANT INVENTORY (Inventory of air pollution sources) Conditionally Exempt Small Quantity Generators, less than 100 kg/month of hazardous waste (Resource Conservation and Recovery Act (tracking hazardous waste)) - notification Organizations: AT & T (CONTACT/OPERATOR)
Alternative names: A T & T
BUDS AUTO BODY INC (98 MIDDLE ST in FAIRHAVEN, MA)
(Resource Conservation and Recovery Act (tracking hazardous waste)) Organizations: HARDING WILSON (CONTACT/OWNER)
NYE LUBRICANTS INC (12 HOWLAND RD. in FAIRHAVEN, MA)
Conditionally Exempt Small Quantity Generators, less than 100 kg/month of hazardous waste (Resource Conservation and Recovery Act (tracking hazardous waste)) - notification TRI REPORTER (Tracking of toxic chemicals releasing facilities) Business SIC classification: LUBRICATING OILS AND GREASES Business NAICS classification: PETROLEUM LUBRICATING OIL AND GREASE MANUFACTURING. Organizations: WILLIAM F NYE INC (CONTACT/OWNER)
PARK MOTORS (69 MIDDLE ST in FAIRHAVEN, MA)
(Resource Conservation and Recovery Act (tracking hazardous waste))
E HASTINGS JR HIGH S (30 SCHOOL ST. in FAIRHAVEN, MA)
AIR MINOR (AIRS/AFS) CRITERIA AND HAZARDOUS AIR POLLUTANT INVENTORY (Inventory of air pollution sources) Business SIC classification: ELEMENTARY AND SECONDARY SCHOOLS Alternative names: EAST HASTINGS JR HS, ELIZABETH I. HASTINGS MIDDLE SCHOOL, HASTINGS MIDDLE
Housing units lacking complete plumbing facilities: 1.0% Housing units lacking complete kitchen facilities: 0.2%
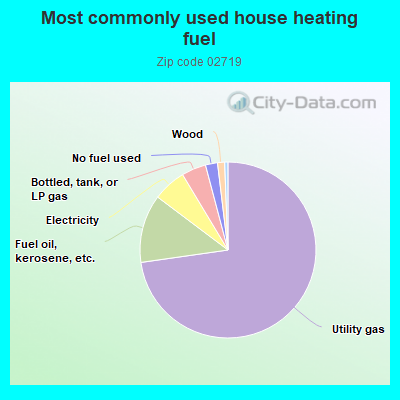
72.6%Utility gas
12.5%Fuel oil, kerosene, etc.
6.1%Electricity
4.5%Bottled, tank, or LP gas
2.2%No fuel used
1.3%Wood
0.6%Other fuel
Population in 1990: 16,141. Population change in the 1990s: +18 (+0.1%).
Place of birth for U.S.-born residents:
This state: 12,883
Northeast: 1,282
Midwest: 258
South: 184
West: 166
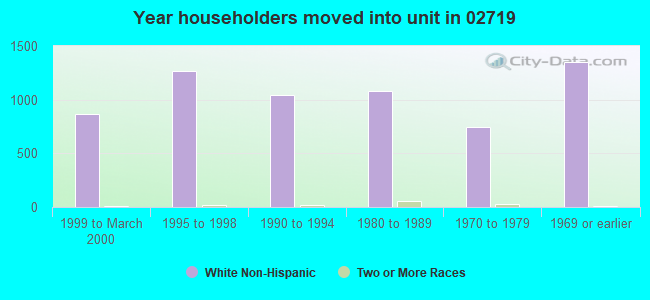
69% of the 02719 zip code residents lived in the same house 5 years ago. Out of people who lived in different houses, 79% lived in this county. Out of people who lived in different counties, 50% lived in Massachusetts.
94% of the 02719 zip code residents lived in the same house 1 year ago. Out of people who lived in different houses, 65% moved from this county. Out of people who lived in different houses, 22% moved from different county within same state. Out of people who lived in different houses, 10% moved from different state. Out of people who lived in different houses, 0% moved from abroad.
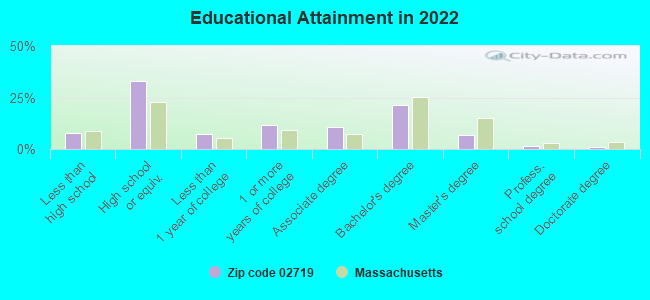
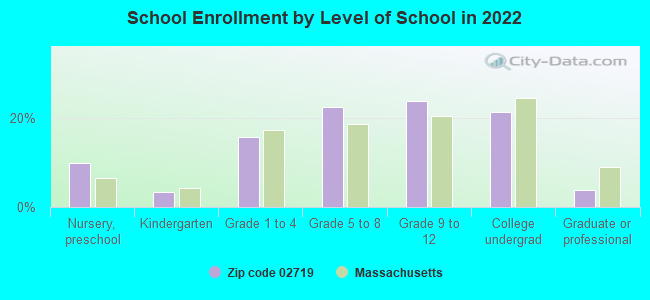
Private vs. public school enrollment:
Students in private schools in grades 1 to 8 (elementary and middle school): 168
Here:
15.6%
Massachusetts:
10.3%
Students in private schools in grades 9 to 12 (high school): 15
Here:
2.3%
Massachusetts:
12.3%
Students in private undergraduate colleges: 199
Here:
33.3%
Massachusetts:
51.2%
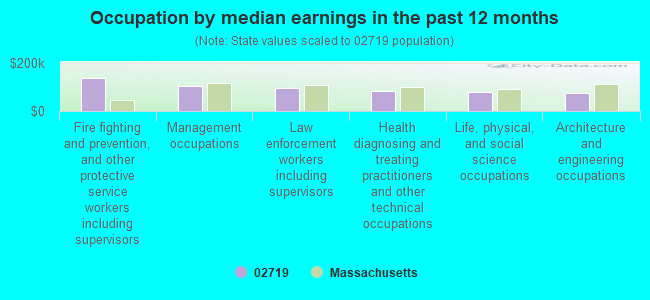
Occupation by median earnings in the past 12 months ($)
138,803Fire fighting and prevention, and other protective service workers including supervisors
104,270Management occupations
95,819Law enforcement workers including supervisors
81,977Health diagnosing and treating practitioners and other technical occupations
79,188Life, physical, and social science occupations
76,695Architecture and engineering occupations
Companies with federal contracts located in this zip code (FAIRHAVEN, MA):
NYE LUBRICANTS, INC (12 HOWLAND ROAD; small business) : $1,840,074 in 27 contractsfrom 2000 to 2006
Contracts for Oils and Greases: Cutting, Lubricating, and Hydraulic by Defense Logistics Agency, Air Force Signed by year:2000: $96,896; 2001: $346,367; 2002: $535,671; 2003: $99,992; 2004: $650,798; 2005: $21,304; 2006: $89,046.
Biggest contracts:
$219,000 with Defense Logistics Agency for Oils and Greases: Cutting, Lubricating, and Hydraulic. Signed on 2001-10-12. Completion date: 2001-11-11.
$99,992, same as above.Signed on 2004-02-02. Completion date: 2004-06-01.
$99,992, same as above.Signed on 2004-03-23. Completion date: 2004-04-08.
$99,992, same as above.Signed on 2004-03-16. Completion date: 2004-04-15.
FAIRHAVEN, TOWN OF (1 BRYANT LN) : $8,087 in 8 contractsfrom 2002 to 2004
Contracts for Guard Services by U.S. Army Corps of Engineers - civil program financing only, Army Signed by year:2000: $0; 2001: $0; 2002: -$264; 2003: $2,253; 2004: $6,098; 2005: $0; 2006: $0.
Biggest contracts:
$3,485 with U.S. Army Corps of Engineers - civil program financing only for Guard Services. Signed on 2004-04-16. Completion date: 2004-08-27.
$3,485 with Army for Guard Services. Signed on 2004-04-16. Completion date: 2004-08-27.
$3,108 with U.S. Army Corps of Engineers - civil program financing only for Guard Services. Signed on 2003-05-09. Completion date: 2003-08-30.
-$264, same as above.Signed on 2002-10-03. Completion date: 2002-09-02.
MORIN & PEPIN INC (158 HUTTLESTON AVE; small business)
$5,400 with U.S. Army Corps of Engineers - civil program financing only for Building Components, Prefabricated. Signed on 2002-06-11. Completion date: 2002-07-17.
DELTA ELECTRIC MOTOR & GENERAT (379 ALDEN RD; small business) : $0 in 2 contractsfrom 2004 to 2005
$20,000 with Navy for Power and Hand Pumps. Signed on 2004-10-01. Completion date: 2005-09-30.
-$20,000, same as above.Signed on 2005-07-15. Completion date: 2005-09-30.
Top industries in this zip code by the number of employees in 2005:
2002 - 2018 National Fire Incident Reporting System (NFIRS) incidents
According to the data from the years 2002 - 2018 the average number of fire incidents per year is 60. The highest number of reported fires - 89 took place in 2007, and the least - 35 in 2013. The data has a declining trend.
When looking into fire subcategories, the most reports belonged to: Outside Fires (39.1%), and Structure Fires (38.1%).
Fire incident types reported to NFIRS in Zip Code 02719


 Nearest zip codes: 02744, 02739, 02740, 02746, 02743, 02745.


 According to the data from the years 2002 - 2018 the average number of fire incidents per year is 60. The highest number of reported fires - 89 took place in 2007, and the least - 35 in 2013. The data has a declining trend.
 When looking into fire subcategories, the most reports belonged to: Outside Fires (39.1%), and Structure Fires (38.1%).