Fall River, Massachusetts

Fall River: Holy Ghost Parade participants march past the Ponta Delgada gates on Water Street.
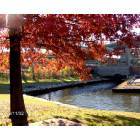
Fall River: Bicentenial Park on a summer evening june 2006
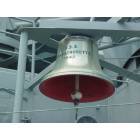
Fall River: Battleship Massachusetts Memorial - Brass Bell
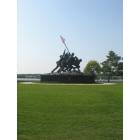
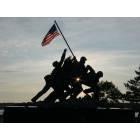
Fall River: World War II Memorial

Fall River: Battleship Massachusetts Memorial
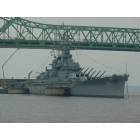
Fall River: Battleship Massachusetts Memorial

Fall River: Holy Ghost Parade participants march past the Ponta Delgada gates on Water Street.
Fall River: "A River Runs Through It"
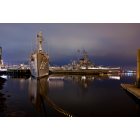
Fall River: Battleship
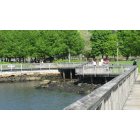
Fall River: Board Walk, at Battle Ship Cove Fall River Ma.
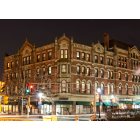
Fall River: Academy Building
- see
24
more - add
your
Submit your own pictures of this city and show them to the world
- OSM Map
- General Map
- Google Map
- MSN Map
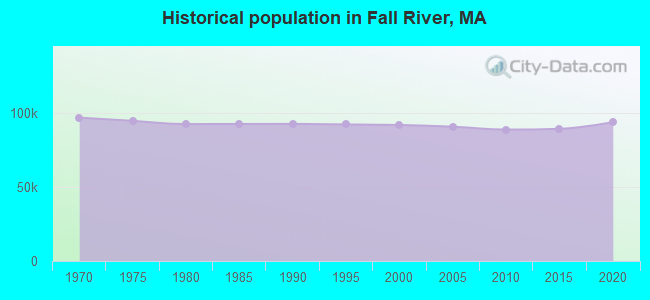
Population change since 2000: +1.9%
 |
| Males: 43,386 | |
| Females: 50,296 |
| Median resident age: | 41.6 years |
| Massachusetts median age: | 40.3 years |
Zip codes: 02720, 02721, 02723, 02724, 02790.
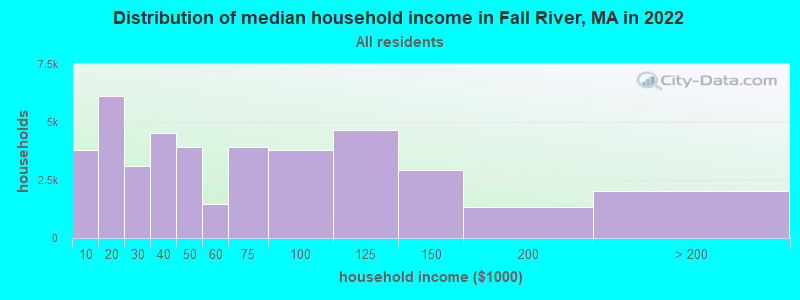
Fall River Zip Code Map| Fall River: | $46,789 |
| MA: | $94,488 |
Estimated per capita income in 2022: $29,944 (it was $16,118 in 2000)
Fall River city income, earnings, and wages data
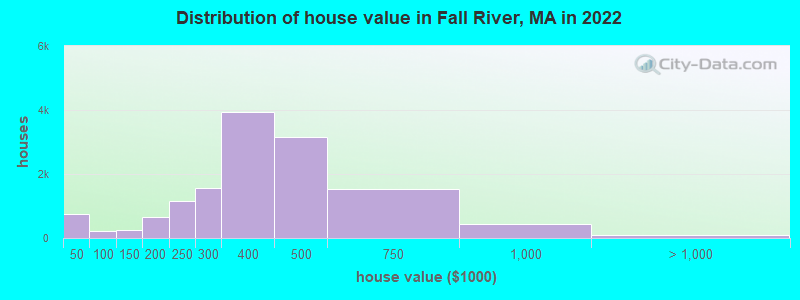
Estimated median house or condo value in 2022: $360,900 (it was $133,900 in 2000)
| Fall River: | $360,900 |
| MA: | $534,700 |
Mean prices in 2022: all housing units: $365,827; detached houses: $372,273; townhouses or other attached units: $353,745; in 2-unit structures: $320,065; in 3-to-4-unit structures: $427,675; in 5-or-more-unit structures: $280,761; mobile homes: $435,017
Median gross rent in 2022: $982.
(16.7% for White Non-Hispanic residents, 22.7% for Black residents, 31.2% for Hispanic or Latino residents, 36.8% for American Indian residents, 35.0% for Native Hawaiian and other Pacific Islander residents, 28.8% for other race residents, 21.9% for two or more races residents)
Detailed information about poverty and poor residents in Fall River, MA


Compare current foreclosures in Fall River, MA:
| Photo | Address | Area | Beds / Baths | Price | Details |
|---|---|---|---|---|---|

|
#1
Albion St
Fall River, MA 02723
|
2,481 sq. feet
|
3 baths 6 beds |
show details | |

|
#2
Wingold St
Fall River, MA 02720
|
1,028 sq. feet
|
1 baths 2 beds |
show details | |

|
#3
Pokross St
Fall River, MA 02724
|
960 sq. feet
|
1 baths 3 beds |
show details | |

|
#4
Haskell St
Fall River, MA 02720
|
1,898 sq. feet
|
2 baths 5 beds |
show details | |

|
#5
Griffin St
Fall River, MA 02724
|
1,800 sq. feet
|
1 baths 3 beds |
show details | |

|
#6
Morton St # 2
Fall River, MA 02720
|
1,994 sq. feet
|
3 baths 6 beds |
show details | |

|
#7
June St Unit 3s
Fall River, MA 02720
|
635 sq. feet
|
1 baths 2 beds |
show details | |

|
#8
President Ave
Fall River, MA 02720
|
4,418 sq. feet
|
4 baths 10 beds |
show details | |

|
#9
California St
Fall River, MA 02723
|
1,670 sq. feet
|
2 baths 4 beds |
show details | |

|
#10
New Boston Rd # 1
Fall River, MA 02720
|
4,036 sq. feet
|
2 baths 6 beds |
show details |
| Photo | Address | Area | Beds / Baths | Price | Details |
|---|---|---|---|---|---|

|
#11
Davol St Unit 614
Fall River, MA 02720
|
625 sq. feet
|
1 baths 1 beds |
show details | |

|
#12
Morton St # 1
Fall River, MA 02720
|
2,970 sq. feet
|
2 baths 6 beds |
show details | |

|
#13
Albany St
Fall River, MA 02720
|
1,315 sq. feet
|
1 baths 2 beds |
show details | |

|
#14
Warner St
Fall River, MA 02720
|
1,678 sq. feet
|
2 baths 3 beds |
show details | |

|
#15
Bay St # 2
Fall River, MA 02721
|
2,257 sq. feet
|
2 baths 3 beds |
show details | |

|
#16
Shore Dr Unit 611
Fall River, MA 02721
|
1,902 sq. feet
|
3 baths 3 beds |
show details | |

|
#17
Pokross St
Fall River, MA 02724
|
1,482 sq. feet
|
2 baths 4 beds |
show details | |

|
#18
Carter St
Fall River, MA 02721
|
1,790 sq. feet
|
1 baths 2 beds |
show details | |

|
#19
Barnaby St
Fall River, MA 02720
|
1,542 sq. feet
|
1 baths 4 beds |
show details | |

|
#20
Eddy St
Fall River, MA 02723
|
936 sq. feet
|
1 baths 4 beds |
show details |
| Photo | Address | Area | Beds / Baths | Price | Details |
|---|---|---|---|---|---|

|
#21
Orswell St
Fall River, MA 02721
|
1,976 sq. feet
|
1 baths 4 beds |
show details | |

|
#22
Highland Ave
Fall River, MA 02720
|
3,613 sq. feet
|
3 baths 4 beds |
show details | |

|
#23
Colfax St
Fall River, MA 02720
|
1,200 sq. feet
|
1 baths 3 beds |
show details | |

|
#24
Charles St
Fall River, MA 02724
|
2,412 sq. feet
|
2 baths 6 beds |
show details | |

|
#25
Ray St
Fall River, MA 02720
|
1,456 sq. feet
|
1 baths 3 beds |
show details | |

|
#26
Wood St
Fall River, MA 02721
|
1,064 sq. feet
|
1 baths 3 beds |
show details | |

|
#27
Plymouth Ave
Fall River, MA 02721
|
2,726 sq. feet
|
2 baths 2 beds |
show details | |

|
#28
Laurel St
Fall River, MA 02724
|
2,958 sq. feet
|
2 baths 2 beds |
show details | |

|
#29
Reney St
Fall River, MA 02723
|
1,146 sq. feet
|
1 baths 4 beds |
show details | |

|
#30
Nichols St
Fall River, MA 02720
|
1,526 sq. feet
|
1 baths 4 beds |
show details |
| Photo | Address | Area | Beds / Baths | Price | Details |
|---|---|---|---|---|---|

|
#31
Mount Pleasant St
Fall River, MA 02720
|
1,013 sq. feet
|
1 baths 3 beds |
show details | |

|
#32
Jepson St
Fall River, MA 02723
|
2,586 sq. feet
|
1 baths 4 beds |
show details | |

|
#33
Gagnon St
Fall River, MA 02723
|
1,279 sq. feet
|
1 baths 3 beds |
show details | |

|
#34
Watson Way
Fall River, MA 02721
|
2,244 sq. feet
|
1 baths 3 beds |
show details | |

|
#35
Bay St
Fall River, MA 02724
|
1,848 sq. feet
|
1 baths 3 beds |
show details | |

|
#36
Brown St
Fall River, MA 02724
|
2,092 sq. feet
|
2 baths 4 beds |
show details | |

|
#37
Newbury St
Fall River, MA 02720
|
2,333 sq. feet
|
2 baths 4 beds |
show details | |

|
#38
Stevens St
Fall River, MA 02721
|
1,602 sq. feet
|
1 baths 3 beds |
show details | |

|
#39
Wade St
Fall River, MA 02721
|
2,407 sq. feet
|
6 baths 6 beds |
show details | |

|
#40
S Beach St
Fall River, MA 02724
|
1,941 sq. feet
|
1 baths 4 beds |
show details |
| Photo | Address | Area | Beds / Baths | Price | Details |
|---|---|---|---|---|---|

|
#41
Townsend St
Fall River, MA 02724
|
1,040 sq. feet
|
1 baths 3 beds |
show details | |

|
#42
Mariano Bishop Blvd
Fall River, MA 02721
|
1,085 sq. feet
|
1 baths 3 beds |
show details | |

|
#43
Lewin St # 8
Fall River, MA 02720
|
1,008 sq. feet
|
1 baths 2 beds |
show details | |

|
#44
Whittier St
Fall River, MA 02724
|
972 sq. feet
|
1 baths 2 beds |
show details | |

|
#45
Baker St
Fall River, MA 02721
|
1,708 sq. feet
|
2 baths 3 beds |
show details | |

|
#46
Slade St
Fall River, MA 02721
|
2,079 sq. feet
|
2 baths 3 beds |
show details | |

|
#47
Walnut St
Fall River, MA 02720
|
4,600 sq. feet
|
4 baths 4 beds |
show details | |

|
#48
Jepson St
Fall River, MA 02723
|
927 sq. feet
|
1 baths 4 beds |
show details | |

|
#49
Rodman St
Fall River, MA 02721
|
1,709 sq. feet
|
1 baths 3 beds |
show details | |

|
Check over 1 million property listings on Foreclosure.com!
|
browse all offers | |||


- 66,74771.2%White alone
- 10,90411.6%Hispanic
- 6,9627.4%Black alone
- 6,0316.4%Two or more races
- 1,7771.9%Asian alone
- 1,2681.4%Other race alone
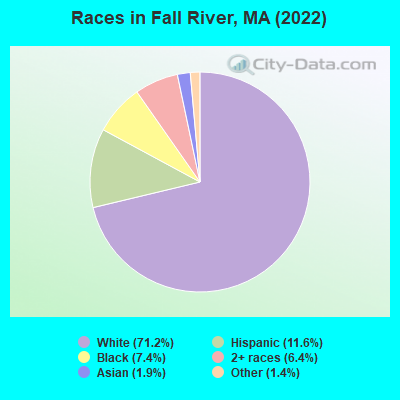
Races in Fall River detailed stats: ancestries, foreign born residents, place of birth
According to our research of Massachusetts and other state lists, there were 127 registered sex offenders living in Fall River, Massachusetts as of April 27, 2024.
The ratio of all residents to sex offenders in Fall River is 700 to 1.
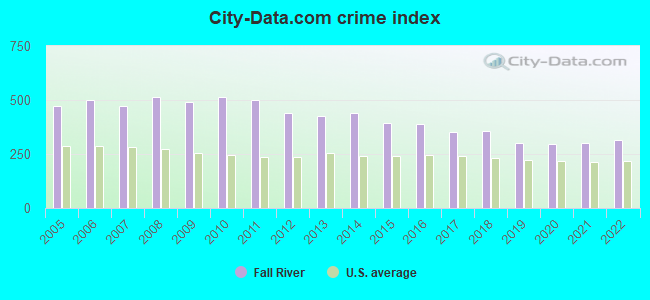
The City-Data.com crime index weighs serious crimes and violent crimes more heavily. Higher means more crime, U.S. average is 246.1. It adjusts for the number of visitors and daily workers commuting into cities.
- means the value is smaller than the state average.- means the value is about the same as the state average.
- means the value is bigger than the state average.
- means the value is much bigger than the state average.
Crime rate in Fall River detailed stats: murders, rapes, robberies, assaults, burglaries, thefts, arson
Full-time law enforcement employees in 2021, including police officers: 269 (222 officers - 207 male; 15 female).
| Officers per 1,000 residents here: | 2.45 |
| Massachusetts average: | 2.53 |
 Recent articles from our blog. Our writers, many of them Ph.D. graduates or candidates, create easy-to-read articles on a wide variety of topics.

 | What is going on in the Fall River/New Bedford area??? (111 replies) |
| More Fall River shootings (52 replies) |
| Insane machete fight in Fall River. Broad daylight. Watch video! (5 replies) |
| Commuter Rail Extending to New Bedford and Fall River (11 replies) |
| Out of control youths at Fall River McDonalds (6 replies) |
| South Coast Rail to New Bedford & Fall River... (20 replies) |
Latest news from Fall River, MA collected exclusively by city-data.com from local newspapers, TV, and radio stations
Fall River, MA City Guides:
Ancestries: Portuguese (44.6%), Irish (4.3%), Cape Verdean (3.8%), English (3.7%), Brazilian (3.5%), American (3.2%).
Current Local Time: EST time zone
Elevation: 200 feet
Land area: 31.0 square miles.
Population density: 3,020 people per square mile (average).
21,237 residents are foreign born (11.6% Europe, 6.4% Latin America).
| This city: | 22.5% |
| Massachusetts: | 17.6% |
Median real estate property taxes paid for housing units with mortgages in 2022: $3,300 (0.9%)
Median real estate property taxes paid for housing units with no mortgage in 2022: $3,525 (1.0%)
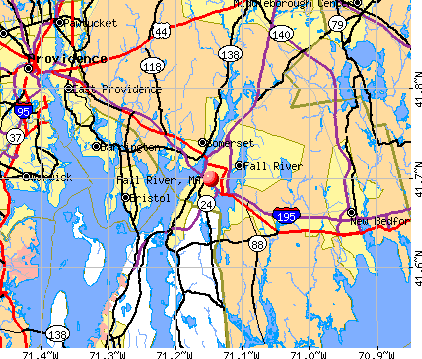
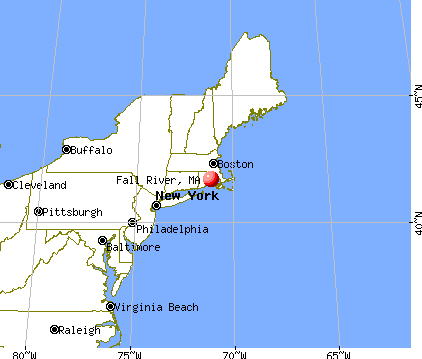
Nearest city with pop. 200,000+: Boston, MA  (43.2 miles , pop. 589,141).
Nearest city with pop. 1,000,000+: Bronx, NY (153.5 miles , pop. 1,332,650).
Nearest cities:
), ), Latitude: 41.70 N, Longitude: 71.15 W
Daytime population change due to commuting: +654 (+0.7%)
Workers who live and work in this city: 16,341 (39.0%)
Area codes: 508, 774
Property values in Fall River, MA
Fall River tourist attractions:
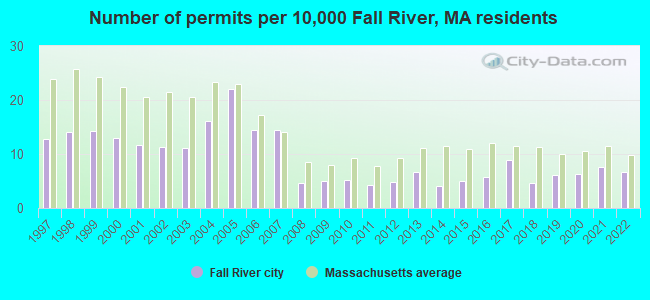
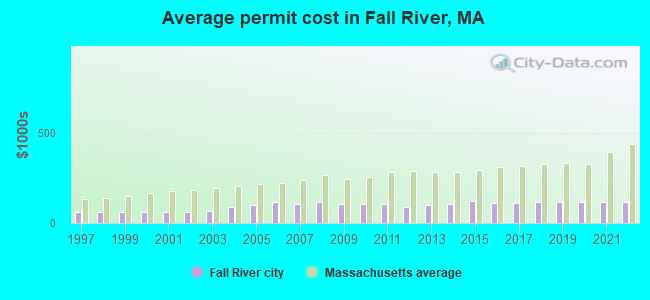
Single-family new house construction building permits:
- 2022: 61 buildings, average cost: $114,800
- 2021: 69 buildings, average cost: $114,700
- 2020: 58 buildings, average cost: $114,800
- 2019: 56 buildings, average cost: $114,400
- 2018: 42 buildings, average cost: $117,100
- 2017: 82 buildings, average cost: $112,100
- 2016: 52 buildings, average cost: $109,600
- 2015: 46 buildings, average cost: $118,700
- 2014: 38 buildings, average cost: $102,500
- 2013: 62 buildings, average cost: $100,500
- 2012: 45 buildings, average cost: $89,100
- 2011: 39 buildings, average cost: $103,300
- 2010: 48 buildings, average cost: $102,600
- 2009: 46 buildings, average cost: $105,400
- 2008: 42 buildings, average cost: $116,700
- 2007: 133 buildings, average cost: $105,900
- 2006: 133 buildings, average cost: $114,300
- 2005: 203 buildings, average cost: $96,500
- 2004: 148 buildings, average cost: $85,800
- 2003: 103 buildings, average cost: $64,000
- 2002: 104 buildings, average cost: $62,000
- 2001: 108 buildings, average cost: $59,300
- 2000: 119 buildings, average cost: $59,300
- 1999: 131 buildings, average cost: $59,300
- 1998: 130 buildings, average cost: $59,200
- 1997: 118 buildings, average cost: $59,300
| Here: | 5.5% |
| Massachusetts: | 3.5% |
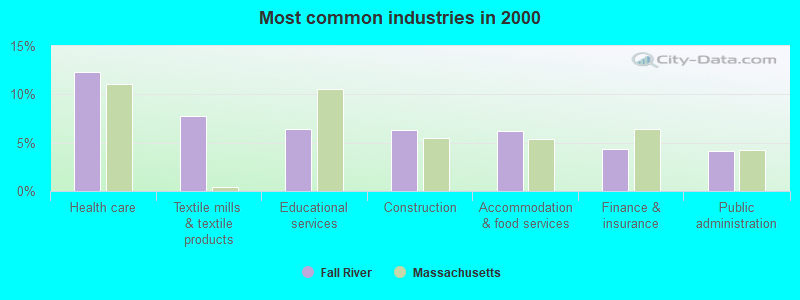
- Health care (12.3%)
- Textile mills & textile products (7.7%)
- Educational services (6.4%)
- Construction (6.3%)
- Accommodation & food services (6.2%)
- Finance & insurance (4.3%)
- Public administration (4.1%)
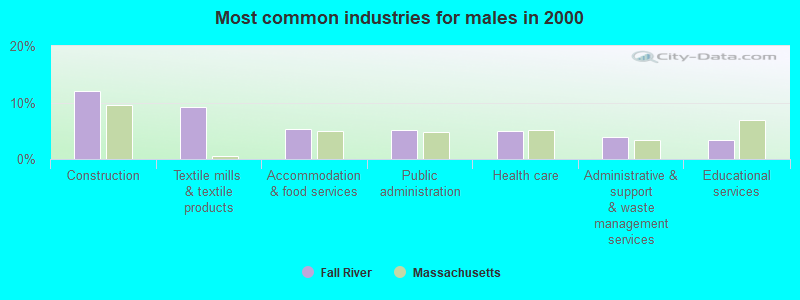
- Construction (12.1%)
- Textile mills & textile products (9.1%)
- Accommodation & food services (5.4%)
- Public administration (5.1%)
- Health care (5.0%)
- Administrative & support & waste management services (3.8%)
- Educational services (3.4%)
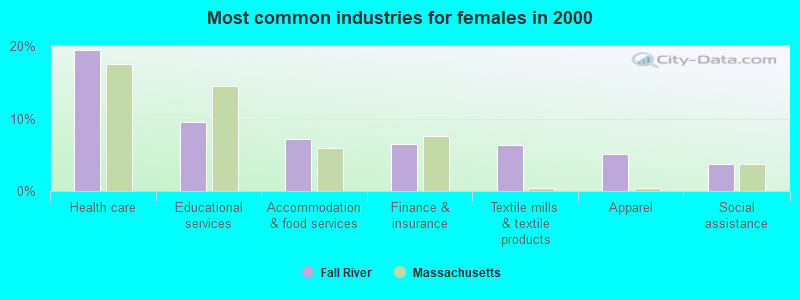
- Health care (19.5%)
- Educational services (9.5%)
- Accommodation & food services (7.1%)
- Finance & insurance (6.5%)
- Textile mills & textile products (6.3%)
- Apparel (5.1%)
- Social assistance (3.7%)
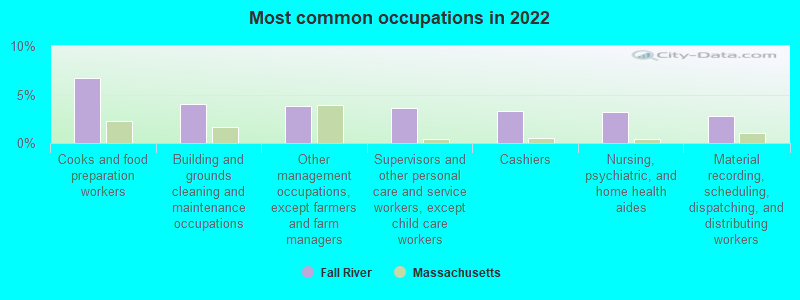
- Cooks and food preparation workers (6.7%)
- Building and grounds cleaning and maintenance occupations (4.0%)
- Other management occupations, except farmers and farm managers (3.8%)
- Supervisors and other personal care and service workers, except child care workers (3.6%)
- Cashiers (3.3%)
- Nursing, psychiatric, and home health aides (3.2%)
- Material recording, scheduling, dispatching, and distributing workers (2.8%)
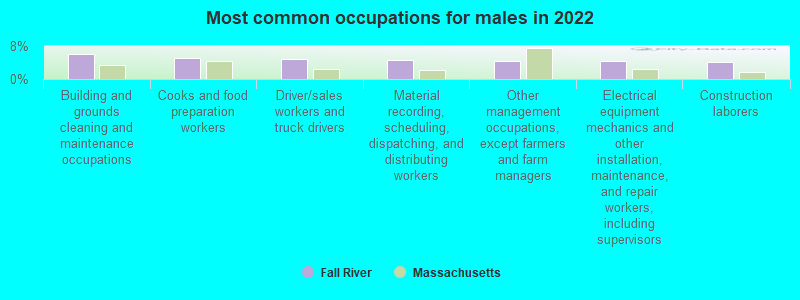
- Building and grounds cleaning and maintenance occupations (6.0%)
- Cooks and food preparation workers (5.1%)
- Driver/sales workers and truck drivers (4.9%)
- Material recording, scheduling, dispatching, and distributing workers (4.5%)
- Other management occupations, except farmers and farm managers (4.3%)
- Electrical equipment mechanics and other installation, maintenance, and repair workers, including supervisors (4.3%)
- Construction laborers (4.2%)
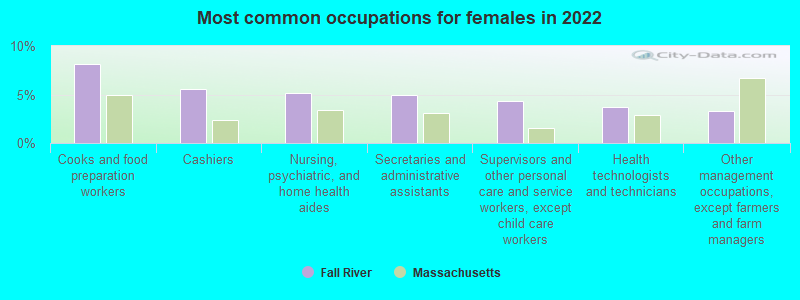
- Cooks and food preparation workers (8.1%)
- Cashiers (5.5%)
- Nursing, psychiatric, and home health aides (5.1%)
- Secretaries and administrative assistants (4.9%)
- Supervisors and other personal care and service workers, except child care workers (4.3%)
- Health technologists and technicians (3.7%)
- Other management occupations, except farmers and farm managers (3.3%)
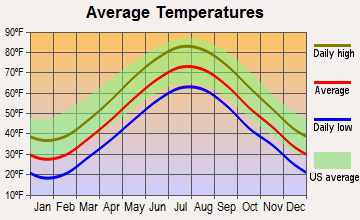
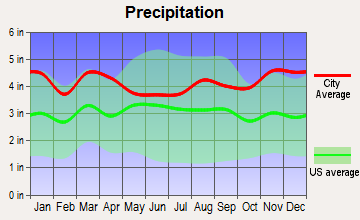
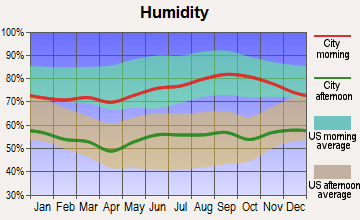
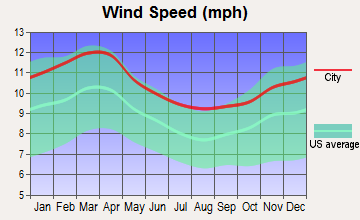
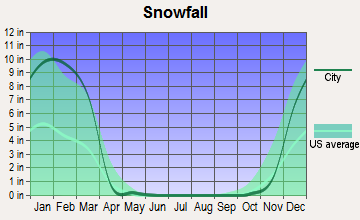
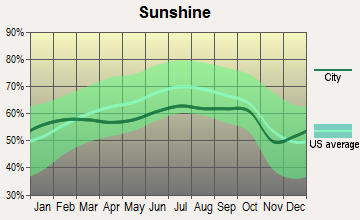
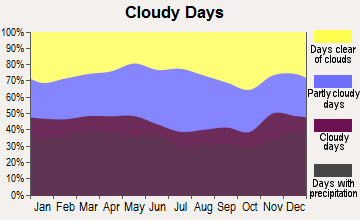
Average climate in Fall River, Massachusetts
Based on data reported by over 4,000 weather stations
|
|

(lower is better)
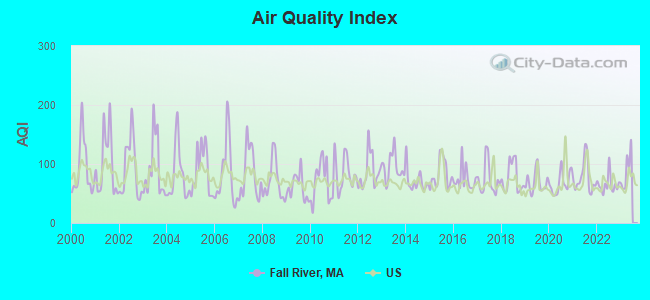
Air Quality Index (AQI) level in 2022 was 65.2. This is about average.
| City: | 65.2 |
| U.S.: | 72.6 |
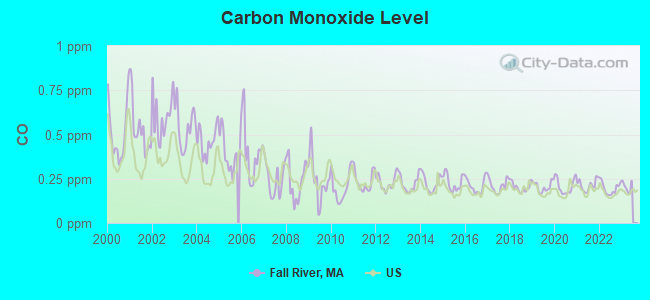
Carbon Monoxide (CO) [ppm] level in 2022 was 0.196. This is better than average. Closest monitor was 14.8 miles away from the city center.
| City: | 0.196 |
| U.S.: | 0.251 |
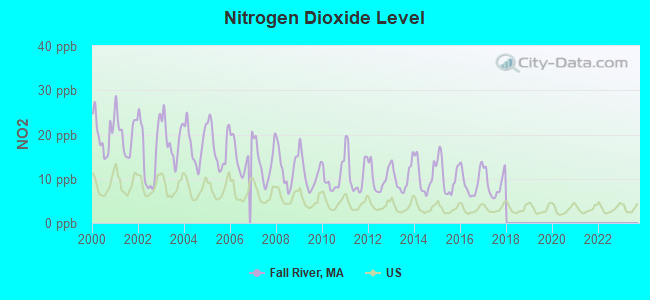
Nitrogen Dioxide (NO2) [ppb] level in 2017 was 8.78. This is significantly worse than average. Closest monitor was 0.3 miles away from the city center.
| City: | 8.78 |
| U.S.: | 5.11 |
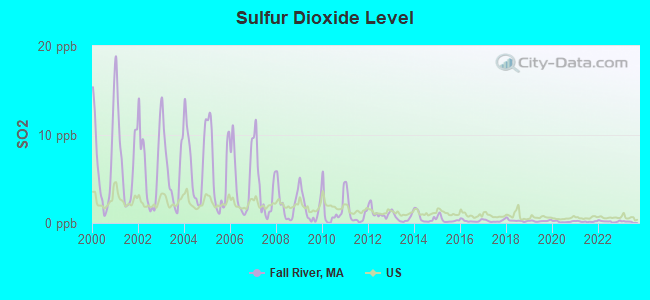
Sulfur Dioxide (SO2) [ppb] level in 2022 was 0.179. This is significantly better than average. Closest monitor was 0.3 miles away from the city center.
| City: | 0.179 |
| U.S.: | 1.515 |
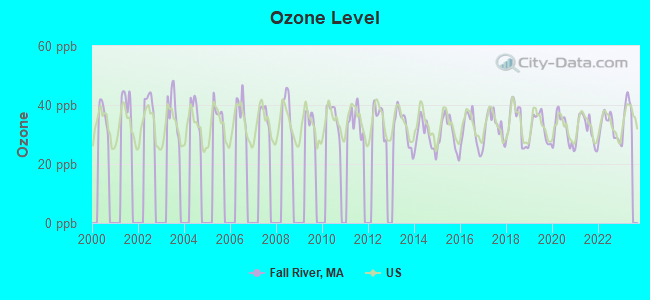
Ozone [ppb] level in 2022 was 32.6. This is about average. Closest monitor was 1.4 miles away from the city center.
| City: | 32.6 |
| U.S.: | 33.3 |
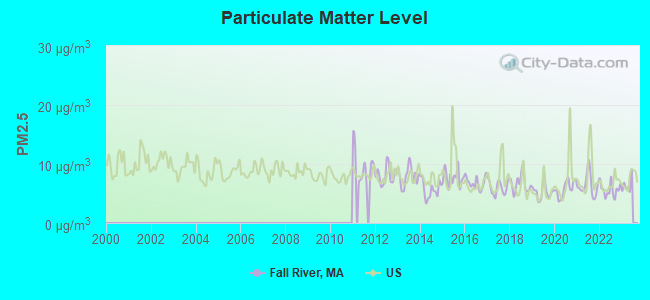
Particulate Matter (PM2.5) [µg/m3] level in 2022 was 5.66. This is significantly better than average. Closest monitor was 1.4 miles away from the city center.
| City: | 5.66 |
| U.S.: | 8.11 |
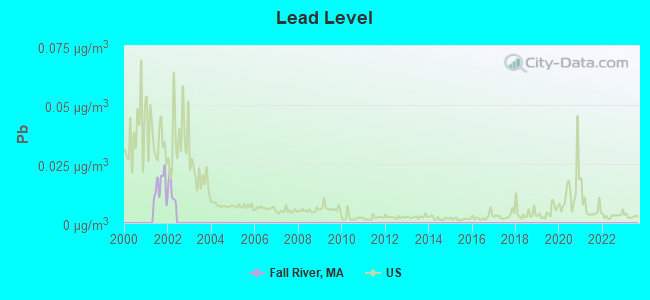
Lead (Pb) [µg/m3] level in 2001 was 0.0156. This is significantly worse than average. Closest monitor was 0.3 miles away from the city center.
| City: | 0.0156 |
| U.S.: | 0.0093 |
Tornado activity:
Fall River-area historical tornado activity is below Massachusetts state average. It is 63% smaller than the overall U.S. average.
On 6/9/1953, a category F3 (max. wind speeds 158-206 mph) tornado 24.5 miles away from the Fall River city center injured 17 people and caused between $500,000 and $5,000,000 in damages.
On 6/9/1953, a category F4 (max. wind speeds 207-260 mph) tornado 45.8 miles away from the city center killed 90 people and injured 1228 people and caused between $50,000,000 and $500,000,000 in damages.
Earthquake activity:
Fall River-area historical earthquake activity is significantly above Massachusetts state average. It is 74% smaller than the overall U.S. average.On 10/7/1983 at 10:18:46, a magnitude 5.3 (5.1 MB, 5.3 LG, 5.1 ML, Class: Moderate, Intensity: VI - VII) earthquake occurred 224.9 miles away from the city center
On 4/20/2002 at 10:50:47, a magnitude 5.3 (5.3 ML, Depth: 3.0 mi) earthquake occurred 233.4 miles away from the city center
On 1/19/1982 at 00:14:42, a magnitude 4.7 (4.5 MB, 4.7 MD, 4.5 LG, Class: Light, Intensity: IV - V) earthquake occurred 126.7 miles away from the city center
On 4/20/2002 at 10:50:47, a magnitude 5.2 (5.2 MB, 4.2 MS, 5.2 MW, 5.0 MW) earthquake occurred 232.5 miles away from the city center
On 10/16/2012 at 23:12:25, a magnitude 4.7 (4.7 ML, Depth: 10.0 mi) earthquake occurred 133.7 miles away from the city center
On 8/22/1992 at 12:20:32, a magnitude 4.8 (4.8 MB, 3.8 MS, 4.7 LG, Depth: 6.2 mi) earthquake occurred 184.5 miles away from the city center
Magnitude types: regional Lg-wave magnitude (LG), body-wave magnitude (MB), duration magnitude (MD), local magnitude (ML), surface-wave magnitude (MS), moment magnitude (MW)
Natural disasters:
The number of natural disasters in Bristol County (23) is greater than the US average (15).Major Disasters (Presidential) Declared: 12
Emergencies Declared: 11
Causes of natural disasters: Floods: 8, Hurricanes: 7, Storms: 5, Snows: 3, Snowstorms: 3, Winter Storms: 3, Blizzards: 2, Explosion: 1, Heavy Rain: 1, Snowfall: 1, Tropical Storm: 1, Wind: 1 (Note: some incidents may be assigned to more than one category).
Main business address for: QUAKER FABRIC CORP /DE/ (BROADWOVEN FABRIC MILS, MAN MADE FIBER & SILK).
Hospitals in Fall River:
- DR JOHN C CORRIGAN MENTAL HEALTH CENTER (49 HILLSIDE STREET)
- HOSPICE AND PALLIATIVE CARE (502 BEDFORD STREET)
- HOSPICE OUTREACH (795 MIDDLE STREET)
- SAINT ANNE'S HOSPITAL (Proprietary, 795 MIDDLE STREET)
- SAME DAY SURGICLINIC (272 STANLEY STREET)
- SOUTHCOAST HOSPITAL GROUP, INC (Voluntary non-profit - Private, 363 HIGHLAND AVENUE)
Nursing Homes in Fall River:
- CATHOLIC MEMORIAL HOME (2446 HIGHLAND AVENUE)
- CLIFF GABLES NURSING HOME (423 MIDDLE ST)
- CLIFF LAWN NURSING HOME (851 HIGHLAND AVE)
- FALL RIVER JEWISH HOME, INC (538 ROBESON STREET)
- FALL RIVER NURSING HOME (1748 HIGHLAND AVE)
- KIMWELL (495 NEW BOSTON ROAD)
- KINDRED TRANSITIONAL CARE AND REHAB-CRAWFORD (273 OAK GROVE AVENUE)
- KINDRED TRANSITIONAL CARE AND REHAB-HIGHLANDER (1748 HIGHLAND AVENUE)
- SARAH BRAYTON NURSING CARE CTR (4901 NORTH MAIN STREET)
- ST ANNE'S HOSPITAL TCU (795 MIDDLE STREET - 3RD FL)
- SUNBRIDGE CARE AND REHAB-FALL RIVER (170 OAK GROVE AVENUE)
Dialysis Facilities in Fall River:
- DIALYSIS CENTER OF FALL RIVER (221-223 WEAVER STREET)
- FALL RIVER KIDNEY CENTER LLC (48 WEAVER STREET)
Home Health Centers in Fall River:
Heliports located in Fall River:
Amtrak station near Fall River:
Colleges/Universities in Fall River:
- Bristol Community College (Full-time enrollment: 5,707; Location: 777 Elsbree St; Public; Website: bristolcc.edu/)
- Salter School-Fall River (Full-time enrollment: 401; Location: 82 Hartwell Street; Private, for-profit; Website: www.salterschool.com)
- Rob Roy Academy-Fall River (Full-time enrollment: 95; Location: 260 S Main St; Private, for-profit; Website: www.rob-roy.com)
- Diman Regional Technical Institute (Full-time enrollment: 84; Location: 251 Stonehaven Rd; Public; Website: dimanregional.org)
Other colleges/universities with over 2000 students near Fall River:
- Roger Williams University (about 7 miles; Bristol, RI; Full-time enrollment: 4,375)
- University of Massachusetts-Dartmouth (about 9 miles; North Dartmouth, MA; FT enrollment: 7,545)
- Brown University (about 17 miles; Providence, RI; FT enrollment: 8,458)
- Rhode Island School of Design (about 17 miles; Providence, RI; FT enrollment: 2,714)
- Johnson & Wales University-Providence (about 17 miles; Providence, RI; FT enrollment: 10,898)
- Community College of Rhode Island (about 18 miles; Warwick, RI; FT enrollment: 10,500)
- Salve Regina University (about 18 miles; Newport, RI; FT enrollment: 2,349)
Public high schools in Fall River:
- B M C DURFEE HIGH (Students: 2,721, Location: 360 ELSBREE STREET, Grades: 9-12)
- ATLANTIS CHARTER SCHOOL (Students: 691, Location: 2501 SOUTH MAIN STREET, Grades: KG-9, Charter school)
- RESILIENCY PREPARATORY SCHOOL (Location: 290 ROCK STREET, Grades: 9-12)
- DIMAN REGIONAL VOCATIONAL TECHNICAL HIGH (Location: 251 STONEHAVEN RD, Grades: 9-12)
Private high schools in Fall River:
- BISHOP CONNOLLY HIGH SCHOOL (Students: 277, Location: 373 ELSBREE ST, Grades: 8-12)
- EAST GATE CHRISTIAN ACADEMY (Students: 50, Location: 397 BAY ST, Grades: PK-9)
- FALL RIVER DEACONESS HOME SCHOOL (Students: 24, Location: 603 ROCK ST, Grades: 7-12, Girls only)
- ST VINCENT SCHOOL (Students: 22, Location: 2425 HIGHLAND AVE, Grades: 7-12)
Biggest public elementary/middle schools in Fall River:
- MORTON MIDDLE (Students: 691, Location: 1135 NORTH MAIN STREET, Grades: 6-8)
- WILLIAM S GREENE (Students: 574, Location: 409 CAMBRIDGE STREET, Grades: PK-5)
- NORTH END ELEMENTARY (Students: 556, Location: 1899 MERIDAN STREET, Grades: PK-5)
- MATTHEW J KUSS MIDDLE (Students: 495, Location: 52 GLOBE MILLS AVENUE, Grades: 6-8)
- JOHN J DORAN (Students: 490, Location: 101 FOUNTAIN STREET, Grades: PK-8)
- SPENCER BORDEN (Students: 458, Location: 1400 PRESIDENT AVENUE, Grades: PK-5)
- JAMES TANSEY (Students: 281, Location: 711 RAY STREET, Grades: KG-5)
- SAMUEL WATSON (Students: 224, Location: 935 EASTERN AVENUE, Grades: KG-5)
- LETOURNEAU ELEMENTARY SCHOOL (Students: 171, Location: 323 ANTHONY STREET, Grades: PK-5)
- TALBOT INNOVATION SCHOOL (Location: 124 MELROSE STREET, Grades: 6-8)
Private elementary/middle schools in Fall River:
- HOLY TRINITY SCHOOL (Students: 238, Location: 64 LAMPHOR ST, Grades: PK-8)
- HOLY NAME SCHOOL (Students: 234, Location: 850 PEARCE ST, Grades: PK-8)
- ESPIRITO SANTO PAROCHIAL SCHOOL (Students: 205, Location: 143 EVERETT ST, Grades: PK-8)
- ST MICHAEL SCHOOL (Students: 204, Location: 209 ESSEX ST, Grades: PK-8)
- ST STANISLAUS SCHOOL (Students: 190, Location: 37 ROCKLAND ST, Grades: PK-8)
- ANTIOCH SCHOOL (Students: 84, Location: 618 ROCK ST, Grades: PK-8)
- SETON ACADEMY FOR GIRLS (Students: 51, Location: 1262 N HIGH ST, Grades: PK-8, Girls only)
Library in Fall River:
- FALL RIVER PUBLIC LIBRARY (Operating income: $1,194,301; Location: 104 NORTH MAIN ST.; 175,799 books; 523 e-books; 5,259 audio materials; 5,994 video materials; 1 local licensed databases; 34 state licensed databases; 1 other licensed databases; 213 print serial subscriptions; 2 electronic serial subscriptions)
Points of interest:
Notable locations in Fall River: Alumni Field (A), Tecumseh Mill Number One (B), Durfee Union Millplace (C), Fall River Center (D), South Main Marketplace (E), Globe Wharf (F), Union Mills (G), Davol Mills (H), American Linen Company Row Houses (I), Durfee Mills (J), Church-Tory House (K), Remington-Borden House (L), Borden-Jennings House (M), Lafayette-Durfee House (N), William C Davol, Junior House (O), Academy Building (P), Pocasset Firehouse Number Seven (Q), Andrew J Borden House (R), Fall River Public Library (S), Carr-Osborn House (T). Display/hide their locations on the map
Shopping Centers: New Harbour Mall Shopping Center (1), Somerset Mall (2), Country Club Shopping Center (3), Harbour Mall (4). Display/hide their locations on the map
Main business address in Fall River: QUAKER FABRIC CORP /DE/ (A). Display/hide its location on the map
Churches in Fall River include: Saint Marys Cathedral (A), Santo Christo Church (B), Church of the Ascension (C), First Congregational Church (D), Saint Jean the Baptist (E), Saint Williams Church (F), Saint Elizabeth Church (G), Notre Dame Cathedral (H), Quarry Street Church (I). Display/hide their locations on the map
Cemeteries: Beth El Cemetery (1), Saint Marys Cemetery (2), Polish Cemetery (3), Jewish Cemetery (4), Oak Grove Cemetery (5), Notre Dame Cemetery (6), Oak Tree Cemetery (7). Display/hide their locations on the map
Lakes, reservoirs, and swamps: Cook Pond (A), Watuppa Pond (B), Cook Pond (C), Firestone Pond (D), Copicut Reservoir (E), Bleachery Ponds (F), King Phillips Swamp (G), Pond Swamp (H). Display/hide their locations on the map
Streams, rivers, and creeks: Quequechan River (A), Queen Gutter Brook (B), Miller Brook (C), King Philip Brook (D), Quiquechan River (E), Blossom Brook (F), Steep Brook (G). Display/hide their locations on the map
Parks in Fall River include: Maplewood Park (1), Lafayette Park (2), Pulaski Park (3), Abbott Playground (4), Chew Playground (5), Ruggles Park (6), North Park (7), Buffington Park (8), Kennedy Park (9). Display/hide their locations on the map
Tourist attractions: Fall River Historical Society (Museums; 451 Rock Street) (1), Mass Commonwealth - Superior Court- Trial Court- Fall River Law Lib (Cultural Attractions- Events- & Facilities; 441 North Main Street) (2), Marine Museum of Fall River (Cultural Attractions- Events- & Facilities; 70 Water Street) (3), Video-Link (Amusement & Theme Parks; 371 Lake Avenue) (4), Tri-Star Vending (Amusement & Theme Parks; 371 Lake Avenue) (5), Millennium Fun Center (Amusement & Theme Parks; 374 William S Canning Boulevard) (6), Bigtop Kiddie Playland & Restaurant (Amusement & Theme Parks; 35 Mariano Bishop Boulevard) (7), Lazer Gate (Arcades & Amusements; 288 Plymouth Avenue) (8). Display/hide their approximate locations on the map
Hotels: Leisure Travel (260 Eastern Ave.) (1), Best Western Fall River (360 Airport Rd) (2), 1873 House Bed and Breakfast (621 Second Street) (3). Display/hide their approximate locations on the map
Courts: Mass Commonwealth - Trial Court- Southeastern Housing Court (289 Rock Street) (1), Mass Commonwealth - Trial Court- Superior Court- Clerk Of Courts Ofc (441 North Main Street) (2), Mass Commonwealth - Trial Court- Superior Court- Custodians Ofc (441 North Main Street) (3), Mass Commonwealth - Trial Court- Superior Court- Superior Court Probation (441 North Main Street) (4), Bristol County - Second District Court- District Attorney's Ofc (38 Rock Street) (5), Bristol County Second District Court (45 Rock Street) (6), Mass Commonwealth - Trial Court- Bristol Juvenile Court at Fall River (289 Rock Street) (7), Mass Commonwealth - Trial Court- Bristol Probate and Family Court at Fall R (289 Rock Street) (8), Mass Commonwealth - Trial Court- Bristol Probate And Family Court At Fall River- Interpretor Ser (289 Rock Street) (9). Display/hide their approximate locations on the map
Birthplace of: Joe Raposo - Composer, Thomas J. Hudner, Jr. - Navy Medal of Honor recipient, Luke Urban - Football player and coach, Bob Doyle (inventor) - Inventor, Greg Gagne (baseball) - Baseball player, Hank the Angry Drunken Dwarf - Entertainer, Ira Sharkansky - Political scientist, Emeril Lagasse - (born 1959), Chef, Jack Brennan - Nixon post-presidential chief of staff, Bert Patenaude - Soccer player.
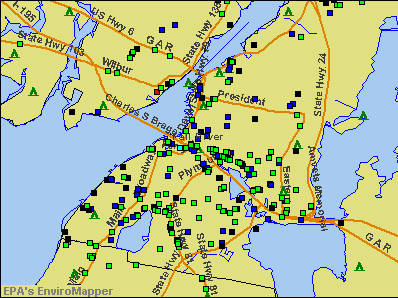
Drinking water stations with addresses in Fall River and their reported violations in the past:
FALL RIVER WATER DEPARTMENT (Population served: 94,000, Surface water):Past health violations:WESTPORT SENIOR VILLAGE (Population served: 150, Groundwater):Past monitoring violations:
- MCL, Average - Between OCT-2013 and DEC-2013, Contaminant: TTHM. Follow-up actions: St AO (w/o penalty) issued (MAR-21-2014)
- MCL, Average - Between JUL-2013 and SEP-2013, Contaminant: TTHM. Follow-up actions: St AO (w/o penalty) issued (MAR-21-2014)
- MCL, Acute (TCR) - In JUL-2008, Contaminant: Coliform. Follow-up actions: St AO (w/o penalty) issued (NOV-25-2008), St Compliance achieved (NOV-25-2008)
- MCL, Monthly (TCR) - In OCT-2005, Contaminant: Coliform. Follow-up actions: St AO (w/o penalty) issued (NOV-20-2007), St Compliance achieved (NOV-20-2007)
- MCL, Acute (TCR) - In AUG-2005, Contaminant: Coliform. Follow-up actions: St AO (w/o penalty) issued (NOV-20-2007), St Compliance achieved (NOV-20-2007)
- MCL, Monthly (TCR) - In AUG-2005, Contaminant: Coliform. Follow-up actions: St AO (w/o penalty) issued (NOV-20-2007), St Compliance achieved (NOV-20-2007)
- Monitoring, Repeat Major (TCR) - In JUN-2010, Contaminant: Coliform (TCR). Follow-up actions: St AO (w/o penalty) issued (AUG-30-2010), St Compliance achieved (AUG-30-2010)
- Water Quality Parameter M/R - In JAN-01-2010, Contaminant: Lead and Copper Rule
- Water Quality Parameter M/R - In JAN-01-2010, Contaminant: Lead and Copper Rule. Follow-up actions: St AO (w/o penalty) issued (FEB-10-2013), St Compliance achieved (MAR-12-2013)
- Treatment Technique Precursor Removal - Between JAN-2007 and MAR-2007, Contaminant: CARBON, TOTAL. Follow-up actions: St AO (w/o penalty) issued (APR-19-2007)
- Notification, Public - In OCT-2005, Contaminant: Coliform (TCR). Follow-up actions: St AO (w/o penalty) issued (NOV-20-2007), St Compliance achieved (NOV-20-2007)
- One minor monitoring violation
- 3 other older monitoring violations
Past health violations:BRANTALS RESTAURANT AND CATERING (Serves RI, Population served: 100, Groundwater):Past monitoring violations:
- MCL, Monthly (TCR) - In NOV-2013, Contaminant: Coliform. Follow-up actions: St AO (w/o penalty) issued (FEB-28-2014), St Compliance achieved (FEB-28-2014)
- MCL, Monthly (TCR) - In APR-2013, Contaminant: Coliform. Follow-up actions: St AO (w/o penalty) issued (MAY-30-2013), St Compliance achieved (JUN-04-2013)
- MCL, Monthly (TCR) - In JAN-2013, Contaminant: Coliform. Follow-up actions: St AO (w/o penalty) issued (MAY-30-2013), St Compliance achieved (JUN-04-2013)
- MCL, Monthly (TCR) - In MAY-2012, Contaminant: Coliform. Follow-up actions: St AO (w/o penalty) issued (AUG-31-2012)
- MCL, Monthly (TCR) - In JAN-2012, Contaminant: Coliform. Follow-up actions: St AO (w/o penalty) issued (APR-30-2012), St Compliance achieved (APR-30-2012)
- MCL, Monthly (TCR) - In JUL-2011, Contaminant: Coliform. Follow-up actions: St AO (w/o penalty) issued (NOV-28-2011), St Compliance achieved (DEC-20-2011)
- 3 other older health violations
- One routine major monitoring violation
- One minor monitoring violation
Past monitoring violations:SSTAR OF RHODE ISLAND (Serves RI, Population served: 70, Groundwater):
- 2 routine major monitoring violations
- One regular monitoring violation
Past monitoring violations:M.A.M.O. LLC (Address: 657 PLEASANT STREET , Population served: 35, Groundwater):
- Follow-up Or Routine LCR Tap M/R - In JAN-01-2011, Contaminant: Lead and Copper Rule. Follow-up actions: St Public Notif requested (FEB-14-2012), St Formal NOV issued (FEB-14-2012), St Violation/Reminder Notice (FEB-14-2012), St Public Notif received (MAY-14-2012), St Compliance achieved (JUL-11-2012)
Past health violations:Past monitoring violations:
- MCL, Monthly (TCR) - In FEB-2007, Contaminant: Coliform. Follow-up actions: St AO (w/o penalty) issued (FEB-04-2008), St Compliance achieved (SEP-30-2012)
- MCL, Monthly (TCR) - In OCT-2006, Contaminant: Coliform. Follow-up actions: St AO (w/o penalty) issued (FEB-04-2008), St Compliance achieved (SEP-30-2012)
- MCL, Monthly (TCR) - In JAN-2006, Contaminant: Coliform. Follow-up actions: St AO (w/o penalty) issued (FEB-01-2006)
- MCL, Monthly (TCR) - In DEC-2005, Contaminant: Coliform. Follow-up actions: St AO (w/o penalty) issued (FEB-01-2006)
- MCL, Monthly (TCR) - In NOV-2005, Contaminant: Coliform. Follow-up actions: St AO (w/o penalty) issued (FEB-01-2006)
- Follow-up Or Routine LCR Tap M/R - In JAN-01-2012, Contaminant: Lead and Copper Rule. Follow-up actions: St AO (w/o penalty) issued (JAN-31-2012), St Compliance achieved (SEP-30-2012)
- Water Quality Parameter M/R - In JAN-01-2012, Contaminant: Lead and Copper Rule. Follow-up actions: St AO (w/o penalty) issued (AUG-13-2012), St Compliance achieved (AUG-27-2012)
- Follow-up Or Routine LCR Tap M/R - In JUL-01-2011, Contaminant: Lead and Copper Rule. Follow-up actions: St AO (w/o penalty) issued (AUG-23-2011), St Compliance achieved (SEP-30-2012)
- Follow-up Or Routine LCR Tap M/R - In JUL-01-2010, Contaminant: Lead and Copper Rule. Follow-up actions: St AO (w/o penalty) issued (AUG-31-2010), St Compliance achieved (SEP-30-2012)
- Water Quality Parameter M/R - In JAN-01-2007, Contaminant: Lead and Copper Rule. Follow-up actions: St AO (w/o penalty) issued (FEB-25-2010), St Compliance achieved (SEP-30-2012)
- 4 routine major monitoring violations
- 3 minor monitoring violations
- One other older monitoring violation
| This city: | 2.3 people |
| Massachusetts: | 2.5 people |
| This city: | 58.2% |
| Whole state: | 63.0% |
| This city: | 9.0% |
| Whole state: | 7.0% |
Likely homosexual households (counted as self-reported same-sex unmarried-partner households)
- Lesbian couples: 0.5% of all households
- Gay men: 0.3% of all households
People in group quarters in Fall River in 2010:
- 994 people in nursing facilities/skilled-nursing facilities
- 347 people in other noninstitutional facilities
- 133 people in group homes intended for adults
- 79 people in emergency and transitional shelters (with sleeping facilities) for people experiencing homelessness
- 65 people in residential treatment centers for adults
- 54 people in group homes for juveniles (non-correctional)
- 36 people in workers' group living quarters and job corps centers
- 17 people in residential treatment centers for juveniles (non-correctional)
- 6 people in hospitals with patients who have no usual home elsewhere
- 4 people in college/university student housing
People in group quarters in Fall River in 2000:
- 1,351 people in nursing homes
- 108 people in residential treatment centers for emotionally disturbed children
- 93 people in homes for the mentally retarded
- 93 people in other noninstitutional group quarters
- 76 people in homes or halfway houses for drug/alcohol abuse
- 53 people in religious group quarters
- 48 people in other nonhousehold living situations
- 39 people in homes for the mentally ill
- 17 people in other group homes
- 13 people in short-term care, detention or diagnostic centers for delinquent children
Banks with most branches in Fall River (2011 data):
- BayCoast Bank: Robeson Street Branch, Stafford Road Branch, Union Branch, Baycoast Bank, Pleasant Street Branch, Troy Street Branch. Info updated 2012/02/03: Bank assets: $909.2 mil, Deposits: $730.3 mil, local headquarters, positive income, Commercial Lending Specialization, 14 total offices, Holding Company: Narragansett Financial Corp
- BankFive: North Branch, Bankfive, Main Street Branch, Pleasant Street Branch, President Avenue Branch, Thirteenth Street Branch. Info updated 2011/11/15: Bank assets: $720.6 mil, Deposits: $613.3 mil, local headquarters, positive income, Commercial Lending Specialization, 13 total offices, Holding Company: Bankfive, Mhc
- Bank of America, National Association: Fall River Main Branch, Stafford Square Branch, Fall River - Mariano Branch. Info updated 2009/11/18: Bank assets: $1,451,969.3 mil, Deposits: $1,077,176.8 mil, headquarters in Charlotte, NC, positive income, 5782 total offices, Holding Company: Bank Of America Corporation
- Sovereign Bank, National Association: Harbour Mall Branch at 430 William Canning Boulevard, branch established on 1970/10/28; North Main Street Branch at 141 North Main Street, branch established on 1828/01/01. Info updated 2012/01/31: Bank assets: $78,146.9 mil, Deposits: $48,042.9 mil, headquarters in Wilmington, DE, positive income, Commercial Lending Specialization, 718 total offices, Holding Company: Banco Santander, S.A.
- RBS Citizens, National Association: Fall River Stop & Shop Rodma at 501 Rodman Street, branch established on 2002/03/27; Fall River Stop & Shop Branch at 333 Mariano Bishop Boulevard, branch established on 2002/06/19. Info updated 2007/09/19: Bank assets: $106,940.6 mil, Deposits: $75,690.2 mil, headquarters in Providence, RI, positive income, 1135 total offices, Holding Company: Uk Financial Investments Limited
- Webster Bank, National Association: 1450 Plymouth Avenue Branch at 1450 Plymouth Avenue, branch established on 1946/07/08; First Fed Sav Bank Of America Branch at 33 Sullivan Drive, branch established on 1946/07/08. Info updated 2008/12/23: Bank assets: $18,674.3 mil, Deposits: $13,861.5 mil, headquarters in Waterbury, CT, positive income, Commercial Lending Specialization, 167 total offices, Holding Company: Webster Financial Corporation
- Rockland Trust Company: Brayton Avenue Branch at 855 Brayton Avenue, branch established on 1981/11/05; Fall River Branch at 249 Linden St, branch established on 1975/05/22. Info updated 2009/05/20: Bank assets: $4,974.4 mil, Deposits: $3,903.9 mil, headquarters in Rockland, MA, positive income, Commercial Lending Specialization, 67 total offices, Holding Company: Independent Bank Corp.
- Mechanics' Co-operative Bank: Lafayette Federal Savings Bank Branc at 60 Bedford Street, branch established on 1894/01/01. Info updated 2011/09/20: Bank assets: $386.4 mil, Deposits: $340.4 mil, headquarters in Taunton, MA, positive income, Commercial Lending Specialization, 8 total offices, Holding Company: Mechanics Bancorp, Mhc
- Admirals Bank: Pleasant Street-Fall River North Bra at 215 Pleasant Street, branch established on 2004/05/24. Info updated 2011/07/21: Bank assets: $518.7 mil, Deposits: $462.0 mil, headquarters in Cranston, RI, positive income, Commercial Lending Specialization, 12 total offices
For population 15 years and over in Fall River:
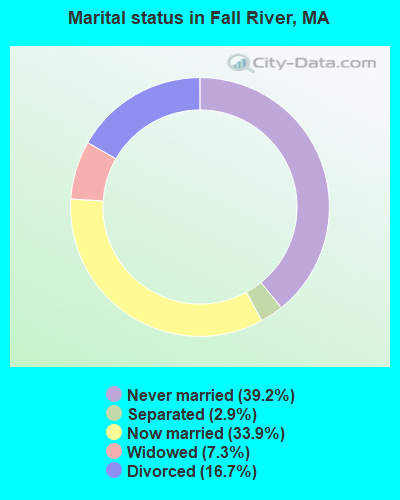
- Never married: 39.2%
- Now married: 33.9%
- Separated: 2.9%
- Widowed: 7.3%
- Divorced: 16.7%
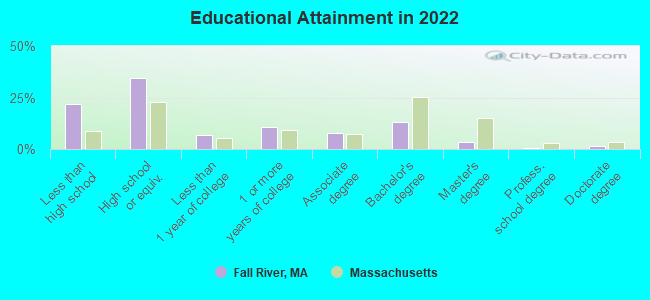
For population 25 years and over in Fall River:
- High school or higher: 78.0%
- Bachelor's degree or higher: 18.8%
- Graduate or professional degree: 5.8%
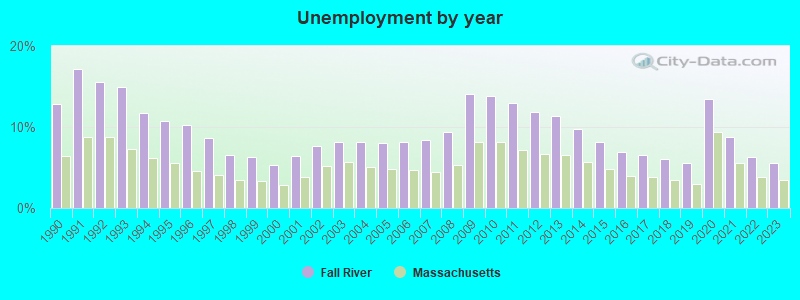
- Unemployed: 5.9%
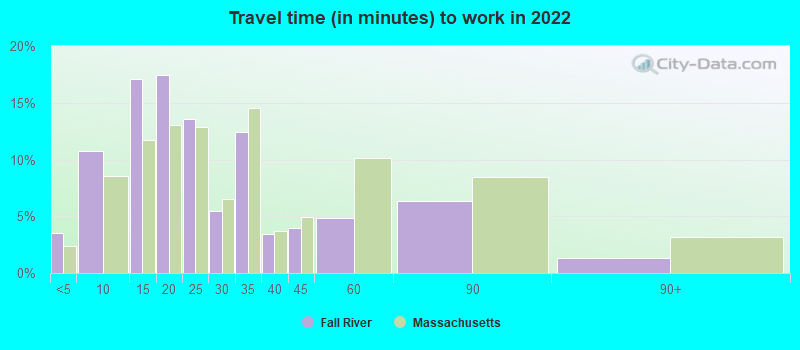
- Mean travel time to work (commute): 23.7 minutes
| Here: | 16.1 |
| Massachusetts average: | 13.0 |
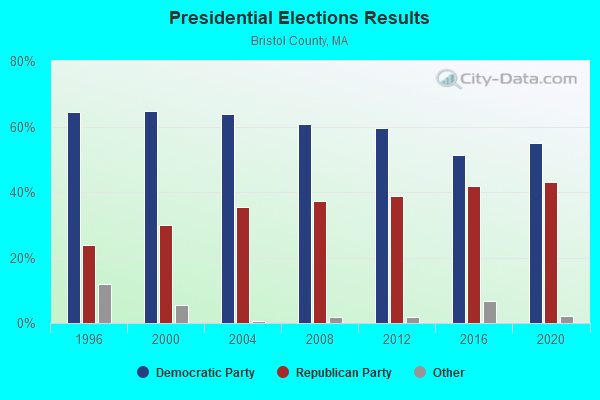
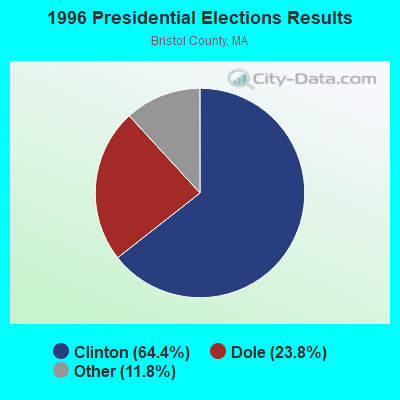
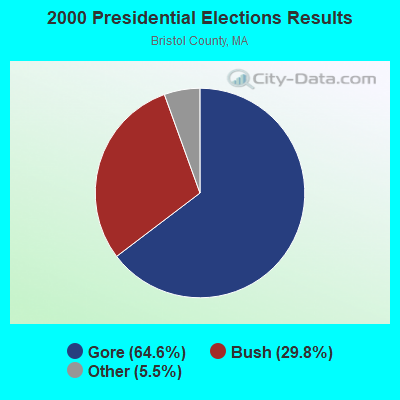

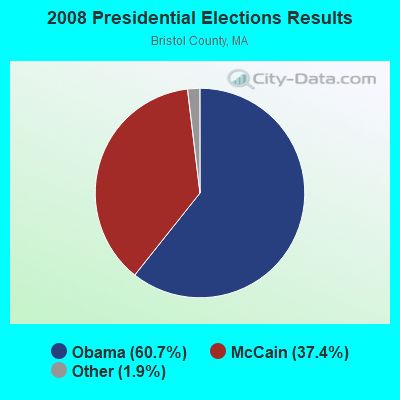
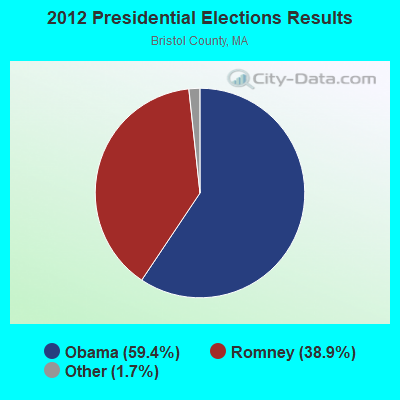


Graphs represent county-level data. Detailed 2008 Election Results
Religion statistics for Fall River, MA (based on Bristol County data)
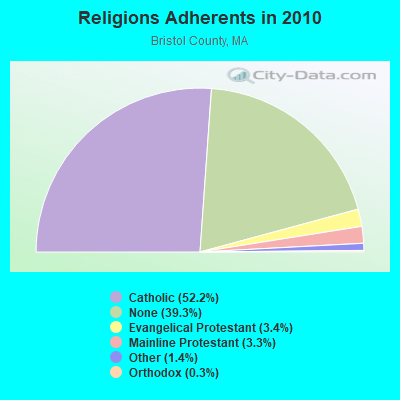
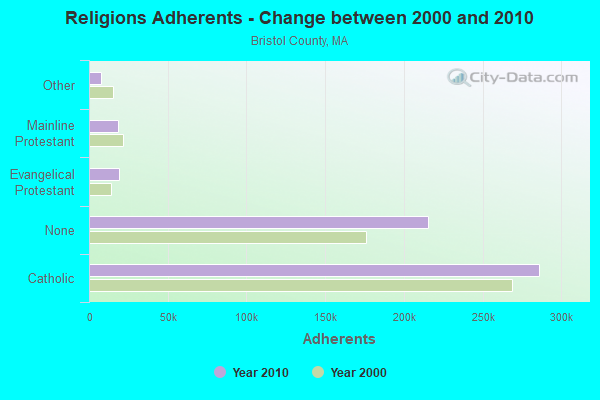
| Religion | Adherents | Congregations |
|---|---|---|
| Catholic | 286,113 | 72 |
| Evangelical Protestant | 18,765 | 128 |
| Mainline Protestant | 18,246 | 83 |
| Other | 7,807 | 33 |
| Orthodox | 1,565 | 4 |
| Black Protestant | 511 | 5 |
| None | 215,278 | - |
Food Environment Statistics:
| Here: | 2.00 / 10,000 pop. |
| State: | 1.98 / 10,000 pop. |
| This county: | 0.09 / 10,000 pop. |
| Massachusetts: | 0.05 / 10,000 pop. |
| Bristol County: | 1.93 / 10,000 pop. |
| Massachusetts: | 2.22 / 10,000 pop. |
| This county: | 2.35 / 10,000 pop. |
| Massachusetts: | 1.77 / 10,000 pop. |
| Bristol County: | 8.20 / 10,000 pop. |
| Massachusetts: | 8.76 / 10,000 pop. |
| This county: | 9.5% |
| State: | 8.1% |
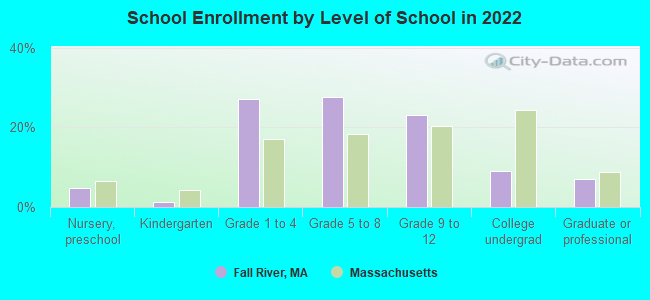
| Here: | 26.9% |
| State: | 22.5% |
| Bristol County: | 14.4% |
| State: | 16.5% |
Health and Nutrition:
| Fall River: | 49.2% |
| Massachusetts: | 50.5% |
| This city: | 45.5% |
| State: | 48.0% |
| This city: | 28.7 |
| Massachusetts: | 28.4 |
| Fall River: | 21.1% |
| Massachusetts: | 20.7% |
| Here: | 11.5% |
| Massachusetts: | 10.4% |
| This city: | 6.9 |
| Massachusetts: | 6.8 |
| Fall River: | 33.3% |
| State: | 33.4% |
| Here: | 55.5% |
| Massachusetts: | 57.1% |
| Fall River: | 77.6% |
| Massachusetts: | 79.2% |
More about Health and Nutrition of Fall River, MA Residents
| Local government employment and payroll (March 2022) | |||||
| Function | Full-time employees | Monthly full-time payroll | Average yearly full-time wage | Part-time employees | Monthly part-time payroll |
|---|---|---|---|---|---|
| Elementary and Secondary - Instruction | 1,440 | $8,604,624 | $71,705 | 40 | $86,085 |
| Elementary and Secondary - Other Total | 337 | $1,499,455 | $53,393 | 143 | $185,267 |
| Police Protection - Officers | 196 | $2,871,426 | $175,802 | 0 | $0 |
| Firefighters | 195 | $1,377,208 | $84,751 | 0 | $0 |
| Fire - Other | 76 | $370,318 | $58,471 | 0 | $0 |
| Solid Waste Management | 46 | $183,935 | $47,983 | 0 | $0 |
| Water Supply | 41 | $357,609 | $104,666 | 0 | $0 |
| Police - Other | 39 | $269,640 | $82,966 | 25 | $17,442 |
| Other Government Administration | 37 | $183,893 | $59,641 | 20 | $4,050 |
| Other and Unallocable | 31 | $261,559 | $101,249 | 0 | $0 |
| Financial Administration | 30 | $332,838 | $133,135 | 0 | $0 |
| Streets and Highways | 26 | $233,875 | $107,942 | 0 | $0 |
| Local Libraries | 18 | $127,402 | $84,935 | 0 | $0 |
| Housing and Community Development (Local) | 13 | $133,612 | $123,334 | 0 | $0 |
| Parks and Recreation | 13 | $46,928 | $43,318 | 0 | $0 |
| Health | 12 | $99,455 | $99,455 | 0 | $0 |
| Sewerage | 11 | $77,126 | $84,137 | 0 | $0 |
| Welfare | 8 | $43,918 | $65,877 | 9 | $808 |
| Judicial and Legal | 4 | $28,996 | $86,988 | 0 | $0 |
| Totals for Government | 2,573 | $17,103,817 | $79,769 | 237 | $293,652 |
Fall River government finances - Expenditure in 2021 (per resident):
- Construction - General - Other: $94,333,000 ($1006.95)
Sewerage: $790,000 ($8.43)
Elementary and Secondary Education: $128,000 ($1.37)
Water Utilities: $15,000 ($0.16)
- Current Operations - Elementary and Secondary Education: $193,299,000 ($2063.35)
General - Other: $33,618,000 ($358.85)
Police Protection: $22,579,000 ($241.02)
Local Fire Protection: $15,684,000 ($167.42)
Sewerage: $11,777,000 ($125.71)
Solid Waste Management: $9,223,000 ($98.45)
Housing and Community Development: $6,877,000 ($73.41)
Regular Highways: $5,321,000 ($56.80)
Water Utilities: $4,648,000 ($49.61)
Financial Administration: $2,158,000 ($23.04)
Public Welfare - Other: $1,886,000 ($20.13)
Parks and Recreation: $1,758,000 ($18.77)
Protective Inspection and Regulation - Other: $1,119,000 ($11.94)
Libraries: $1,092,000 ($11.66)
Central Staff Services: $964,000 ($10.29)
Judicial and Legal Services: $657,000 ($7.01)
Health - Other: $321,000 ($3.43)
- General - Interest on Debt: $12,147,000 ($129.66)
- Intergovernmental to Local - Other - Elementary and Secondary Education: $6,133,000 ($65.47)
Other - Health - Other: $145,000 ($1.55)
- Intergovernmental to State - Transit Utilities: $1,474,000 ($15.73)
General - Other: $393,000 ($4.20)
- Other Capital Outlay - Water Utilities: $19,983,000 ($213.31)
Elementary and Secondary Education: $13,036,000 ($139.15)
General - Other: $3,447,000 ($36.79)
Sewerage: $491,000 ($5.24)
Police Protection: $38,000 ($0.41)
- Total Salaries and Wages: $102,825,000 ($1097.60)
- Water Utilities - Interest on Debt: $1,203,000 ($12.84)
Fall River government finances - Revenue in 2021 (per resident):
- Charges - Sewerage: $29,928,000 ($319.46)
Other: $13,926,000 ($148.65)
Elementary and Secondary Education School Lunch: $2,735,000 ($29.19)
Parking Facilities: $1,533,000 ($16.36)
Elementary and Secondary Education School Tuition and Transportation: $115,000 ($1.23)
Elementary and Secondary Education - Other: $1,000 ($0.01)
- Federal Intergovernmental - Other: $45,031,000 ($480.68)
Housing and Community Development: $4,978,000 ($53.14)
Sewerage: $218,000 ($2.33)
Highways: $20,000 ($0.21)
- Local Intergovernmental - Education: $530,000 ($5.66)
- Miscellaneous - General Revenue - Other: $79,275,000 ($846.21)
Donations From Private Sources: $795,000 ($8.49)
Interest Earnings: $474,000 ($5.06)
Fines and Forfeits: $1,000 ($0.01)
- Revenue - Water Utilities: $18,640,000 ($198.97)
- State Intergovernmental - Education: $234,519,000 ($2503.35)
General Local Government Support: $26,177,000 ($279.42)
Other: $9,647,000 ($102.98)
Public Welfare: $1,485,000 ($15.85)
Highways: $1,360,000 ($14.52)
Sewerage: $77,000 ($0.82)
Housing and Community Development: $9,000 ($0.10)
- Tax - Property: $119,212,000 ($1272.52)
Other Selective Sales: $4,564,000 ($48.72)
Other License: $2,653,000 ($28.32)
Fall River government finances - Debt in 2021 (per resident):
- Long Term Debt - Outstanding Unspecified Public Purpose: $358,372,000 ($3825.41)
Beginning Outstanding - Unspecified Public Purpose: $293,882,000 ($3137.02)
Issue, Unspecified Public Purpose: $90,174,000 ($962.55)
Retired Unspecified Public Purpose: $25,684,000 ($274.16)
- Short Term Debt Outstanding - Beginning: $62,739,000 ($669.70)
End of Fiscal Year: $18,892,000 ($201.66)
Fall River government finances - Cash and Securities in 2021 (per resident):
- Bond Funds - Cash and Securities: $34,720,000 ($370.62)
- Other Funds - Cash and Securities: $72,107,000 ($769.70)
4.76% of this county's 2021 resident taxpayers lived in other counties in 2020 ($70,162 average adjusted gross income)
| Here: | 4.76% |
| Massachusetts average: | 6.35% |
0.01% of residents moved from foreign countries ($64 average AGI)
Bristol County: 0.01% Massachusetts average: 0.01%
Top counties from which taxpayers relocated into this county between 2020 and 2021:
| from Plymouth County, MA | |
| from Norfolk County, MA | |
| from Providence County, RI |
4.63% of this county's 2020 resident taxpayers moved to other counties in 2021 ($72,404 average adjusted gross income)
| Here: | 4.63% |
| Massachusetts average: | 7.18% |
0.01% of residents moved to foreign countries ($83 average AGI)
Bristol County: 0.01% Massachusetts average: 0.02%
Top counties to which taxpayers relocated from this county between 2020 and 2021:
| to Plymouth County, MA | |
| to Providence County, RI | |
| to Norfolk County, MA |
| Businesses in Fall River, MA | ||||
| Name | Count | Name | Count | |
|---|---|---|---|---|
| 7-Eleven | 2 | MasterBrand Cabinets | 3 | |
| AT&T | 1 | McDonald's | 4 | |
| Ace Hardware | 2 | New Balance | 1 | |
| Advance Auto Parts | 2 | Nike | 7 | |
| Applebee's | 1 | Papa John's Pizza | 2 | |
| Audi | 1 | Payless | 1 | |
| AutoZone | 2 | Penske | 1 | |
| Burger King | 3 | Popeyes | 1 | |
| Burlington Coat Factory | 1 | RadioShack | 2 | |
| CVS | 4 | Rite Aid | 7 | |
| Comfort Inn | 1 | Sears | 1 | |
| Curves | 1 | Shaw's | 2 | |
| Domino's Pizza | 3 | Sprint Nextel | 1 | |
| Dunkin Donuts | 17 | Staples | 1 | |
| FedEx | 10 | Stop & Shop | 2 | |
| Firestone Complete Auto Care | 1 | Subway | 6 | |
| Ford | 1 | T-Mobile | 2 | |
| GNC | 2 | Taco Bell | 1 | |
| GameStop | 1 | U-Haul | 4 | |
| H&R Block | 3 | UPS | 13 | |
| Hyundai | 1 | Vans | 1 | |
| Jones New York | 1 | Volkswagen | 1 | |
| KFC | 1 | Walgreens | 2 | |
| Kmart | 1 | Walmart | 1 | |
| Lane Furniture | 1 | Wendy's | 2 | |
| Little Caesars Pizza | 1 | YMCA | 1 | |
Strongest AM radio stations in Fall River:
- WHTB (1400 AM; 1 kW; FALL RIVER, MA; Owner: SNE BROADCASTING, LTD.(A MASS. CORP))
- WSAR (1480 AM; 5 kW; FALL RIVER, MA; Owner: BRISTOL COUNTY BROADCASTING, INC.)
- WPRO (630 AM; 5 kW; PROVIDENCE, RI; Owner: CITADEL BROADCASTING COMPANY)
- WALE (990 AM; 50 kW; GREENVILLE, RI; Owner: NORTH AMERICAN BROADCASTING CO., INC.)
- WHJJ (920 AM; 5 kW; PROVIDENCE, RI)
- WEEI (850 AM; 50 kW; BOSTON, MA; Owner: ENTERCOM BOSTON LICENSE, LLC)
- WSKO (790 AM; 5 kW; PROVIDENCE, RI; Owner: CITADEL BROADCASTING COMPANY)
- WBZ (1030 AM; 50 kW; BOSTON, MA; Owner: INFINITY BROADCASTING OPERATIONS, INC.)
- WBSM (1420 AM; 5 kW; NEW BEDFORD, MA; Owner: CITADEL BROADCASTING COMPANY)
- WRKO (680 AM; 50 kW; BOSTON, MA; Owner: ENTERCOM BOSTON LICENSE, LLC)
- WKOX (1200 AM; 50 kW; FRAMINGHAM, MA; Owner: CAPSTAR TX LIMITED PARTNERSHIP)
- WRNI (1290 AM; 10 kW; PROVIDENCE, RI; Owner: WRNI FOUNDATION)
- WPMZ (1110 AM; daytime; 5 kW; EAST PROVIDENCE, RI; Owner: VIDEO MUNDO B/CASTING CO., LLC)
Strongest FM radio stations in Fall River:
- WWBB (101.5 FM; PROVIDENCE, RI; Owner: CLEAR CHANNEL BROADCASTING LICENSES, INC.)
- WKKB (100.3 FM; MIDDLETOWN, RI; Owner: CITADEL BROADCASTING COMPANY)
- WSNE-FM (93.3 FM; TAUNTON, MA; Owner: CAPSTAR TX LIMITED PARTNERSHIP)
- WSMU-FM (91.1 FM; NORTH DARTMOUTH, MA; Owner: UNIVERSITY OF MASSACHUSETTS)
- WCTK (98.1 FM; NEW BEDFORD, MA; Owner: HALL COMMUNICATIONS, INC.)
- WJFD-FM (97.3 FM; NEW BEDFORD, MA; Owner: EDMUND DINIS, TRUSTEE)
- WBRU (95.5 FM; PROVIDENCE, RI; Owner: BROWN BROADCASTING SERVICE, INC.)
- WHJY (94.1 FM; PROVIDENCE, RI; Owner: CAPSTAR TX LIMITED PARTNERSHIP)
- WFHN (107.1 FM; FAIRHAVEN, MA; Owner: CITADEL BROADCASTING COMPANY)
- WPRO-FM (92.3 FM; PROVIDENCE, RI; Owner: CITADEL BROADCASTING COMPANY)
- WWLI (105.1 FM; PROVIDENCE, RI; Owner: CITADEL BROADCASTING COMPANY)
- WBMX (98.5 FM; BOSTON, MA; Owner: INFINITY RADIO OPERATIONS INC.)
- WBOS (92.9 FM; BROOKLINE, MA; Owner: GREATER BOSTON RADIO, INC.)
- WJMN (94.5 FM; BOSTON, MA; Owner: AMFM RADIO LICENSES, L.L.C.)
- WCRB (102.5 FM; WALTHAM, MA; Owner: CHARLES RIVER BROADCASTING WCRB LICE)
- WTKK (96.9 FM; BOSTON, MA; Owner: GREATER BOSTON RADIO, INC.)
- WROR-FM (105.7 FM; FRAMINGHAM, MA; Owner: GREATER BOSTON RADIO, INC.)
- WXKS-FM (107.9 FM; MEDFORD, MA; Owner: AMFM RADIO LICENSES, L.L.C.)
- WMJX (106.7 FM; BOSTON, MA; Owner: GREATER BOSTON RADIO, INC.)
- WGBH (89.7 FM; BOSTON, MA; Owner: WGBH EDUCATIONAL FOUNDATION)
TV broadcast stations around Fall River:
- WLNE-TV (Channel 6; NEW BEDFORD, MA; Owner: FREEDOM BROADCASTING OF SOUTHERN NEW ENGLAND, INC.)
- WNAC-TV (Channel 64; PROVIDENCE, RI; Owner: WNAC, LLC)
- WPRI-TV (Channel 12; PROVIDENCE, RI; Owner: TVL BROADCASTING OF RHODE ISLAND, LLC)
- WJAR (Channel 10; PROVIDENCE, RI; Owner: OUTLET BROADCASTING, INC.)
- WLWC (Channel 28; NEW BEDFORD, MA; Owner: C-28 FCC LICENSEE SUBSIDIARY, LLC)
- WSBE-TV (Channel 36; PROVIDENCE, RI; Owner: RHODE ISLAND PUBLIC TELECOM. AUTHORITY)
- WWDP (Channel 46; NORWELL, MA; Owner: NORWELL TELEVISION, LLC)
- WPXQ (Channel 69; BLOCK ISLAND, RI; Owner: OCEAN STATE TELEVISION, L.L.C.)
- WCVB-TV (Channel 5; BOSTON, MA; Owner: WCVB HEARST-ARGYLE TV, INC.)
- WGBH-TV (Channel 2; BOSTON, MA; Owner: WGBH EDUCATIONAL FOUNDATION)
- WHDH-TV (Channel 7; BOSTON, MA; Owner: WHDH-TV)
- WMFP (Channel 62; LAWRENCE, MA; Owner: WSAH LICENSE, INC.)
- WSBK-TV (Channel 38; BOSTON, MA; Owner: VIACOM INC.)
- WLVI-TV (Channel 56; CAMBRIDGE, MA; Owner: WLVI, INC.)
- WBZ-TV (Channel 4; BOSTON, MA; Owner: VIACOM INC.)
- WGBX-TV (Channel 44; BOSTON, MA; Owner: WGBH EDUCATIONAL FOUNDATION)
- WFXT (Channel 25; BOSTON, MA; Owner: FOX TELEVISION STATIONS INC.)
- WRIW-LP (Channel 50; PROVIDENCE, RI; Owner: ZGS PROVIDENCE, INC.)
Medal of Honor Recipients
Medal of Honor Recipients born in Fall River: Michael O'Regan, Thomas Jerome, Jr. Hudner.
- National Bridge Inventory (NBI) Statistics
- 68Number of bridges
- 1,693ft / 516mTotal length
- $216,861,000Total costs
- 1,568,717Total average daily traffic
- 79,407Total average daily truck traffic
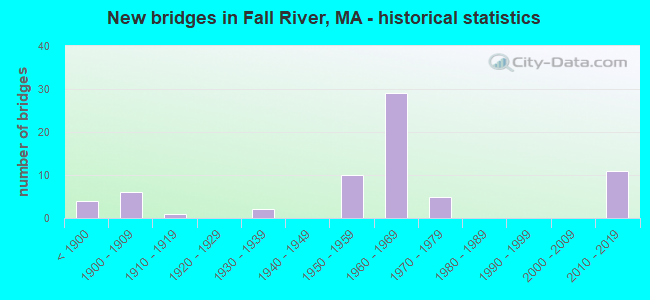
- New bridges - historical statistics
- 4Before 1900
- 61900-1909
- 11910-1919
- 21930-1939
- 101950-1959
- 291960-1969
- 51970-1979
- 112010-2019
FCC Registered Antenna Towers: 57 (See the full list of FCC Registered Antenna Towers)
FCC Registered Commercial Land Mobile Towers: 3 (See the full list of FCC Registered Commercial Land Mobile Towers in Fall River, MA)
FCC Registered Private Land Mobile Towers: 14 (See the full list of FCC Registered Private Land Mobile Towers)
FCC Registered Broadcast Land Mobile Towers: 45 (See the full list of FCC Registered Broadcast Land Mobile Towers)
FCC Registered Microwave Towers: 51 (See the full list of FCC Registered Microwave Towers in this town)
FCC Registered Paging Towers: 19 (See the full list of FCC Registered Paging Towers)
FCC Registered Maritime Coast & Aviation Ground Towers: 5 (See the full list of FCC Registered Maritime Coast & Aviation Ground Towers)
FCC Registered Amateur Radio Licenses: 236 (See the full list of FCC Registered Amateur Radio Licenses in Fall River)
FAA Registered Aircraft Manufacturers and Dealers: 1 (See the full list of FAA Registered Manufacturers and Dealers in Fall River)
FAA Registered Aircraft: 12 (See the full list of FAA Registered Aircraft)
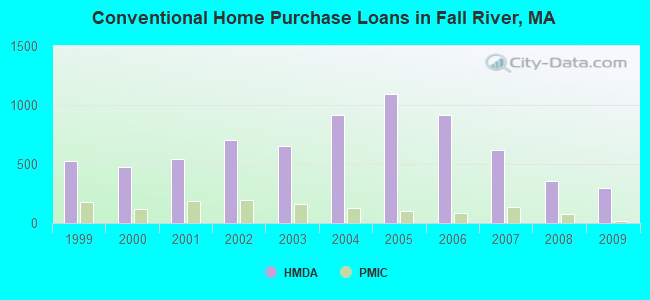
| Home Mortgage Disclosure Act Aggregated Statistics For Year 2009 (Based on 25 full tracts) | ||||||||||||||
| A) FHA, FSA/RHS & VA Home Purchase Loans | B) Conventional Home Purchase Loans | C) Refinancings | D) Home Improvement Loans | E) Loans on Dwellings For 5+ Families | F) Non-occupant Loans on < 5 Family Dwellings (A B C & D) | G) Loans On Manufactured Home Dwelling (A B C & D) | ||||||||
|---|---|---|---|---|---|---|---|---|---|---|---|---|---|---|
| Number | Average Value | Number | Average Value | Number | Average Value | Number | Average Value | Number | Average Value | Number | Average Value | Number | Average Value | |
| LOANS ORIGINATED | 192 | $191,688 | 297 | $145,785 | 1,003 | $174,629 | 124 | $90,694 | 45 | $250,889 | 81 | $132,037 | 1 | $176,000 |
| APPLICATIONS APPROVED, NOT ACCEPTED | 12 | $191,000 | 15 | $129,800 | 77 | $183,740 | 10 | $100,400 | 2 | $189,500 | 4 | $115,750 | 0 | $0 |
| APPLICATIONS DENIED | 52 | $167,346 | 80 | $104,562 | 397 | $196,892 | 48 | $78,000 | 11 | $228,182 | 35 | $133,657 | 0 | $0 |
| APPLICATIONS WITHDRAWN | 23 | $189,826 | 29 | $135,276 | 184 | $195,913 | 7 | $129,571 | 5 | $525,800 | 9 | $144,444 | 1 | $140,000 |
| FILES CLOSED FOR INCOMPLETENESS | 13 | $158,923 | 6 | $123,167 | 65 | $199,862 | 3 | $125,000 | 1 | $162,000 | 6 | $121,000 | 0 | $0 |
Detailed mortgage data for all 25 tracts in Fall River, MA
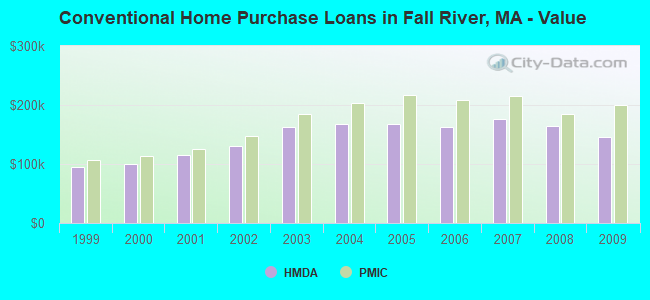
| Private Mortgage Insurance Companies Aggregated Statistics For Year 2009 (Based on 21 full tracts) | ||||||
| A) Conventional Home Purchase Loans | B) Refinancings | C) Non-occupant Loans on < 5 Family Dwellings (A & B) | ||||
|---|---|---|---|---|---|---|
| Number | Average Value | Number | Average Value | Number | Average Value | |
| LOANS ORIGINATED | 16 | $200,188 | 27 | $213,111 | 1 | $166,000 |
| APPLICATIONS APPROVED, NOT ACCEPTED | 8 | $168,875 | 13 | $203,231 | 0 | $0 |
| APPLICATIONS DENIED | 7 | $171,000 | 7 | $221,286 | 0 | $0 |
| APPLICATIONS WITHDRAWN | 1 | $177,000 | 4 | $205,500 | 0 | $0 |
| FILES CLOSED FOR INCOMPLETENESS | 1 | $285,000 | 0 | $0 | 0 | $0 |
2002 - 2018 National Fire Incident Reporting System (NFIRS) incidents
- Fire incident types reported to NFIRS in Fall River, MA
- 4,23949.8%Structure Fires
- 2,78032.7%Outside Fires
- 1,16313.7%Mobile Property/Vehicle Fires
- 3303.9%Other
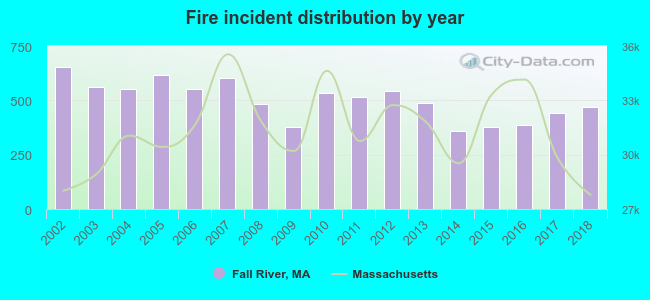 Based on the data from the years 2002 - 2018 the average number of fire incidents per year is 501. The highest number of fires - 652 took place in 2002, and the least - 361 in 2014. The data has a decreasing trend.
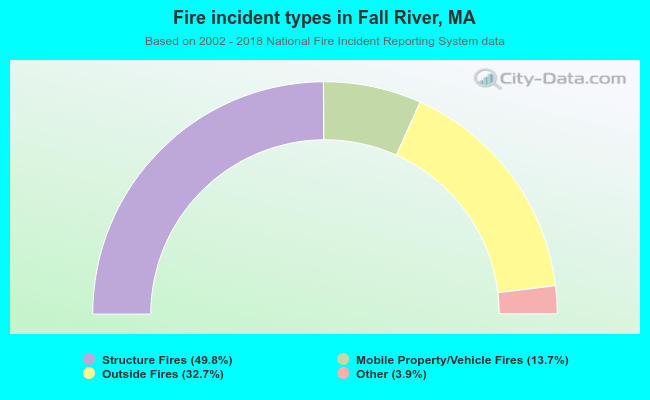 When looking into fire subcategories, the most reports belonged to: Structure Fires (49.8%), and Outside Fires (32.7%).
| Most common first names in Fall River, MA among deceased individuals | ||
| Name | Count | Lived (average) |
|---|---|---|
| Mary | 2,140 | 81.5 years |
| Joseph | 1,482 | 75.4 years |
| John | 1,420 | 74.9 years |
| Manuel | 1,316 | 75.5 years |
| Maria | 1,022 | 79.6 years |
| William | 637 | 74.7 years |
| James | 496 | 73.3 years |
| Alice | 419 | 79.8 years |
| George | 419 | 73.7 years |
| Margaret | 418 | 80.9 years |
| Most common last names in Fall River, MA among deceased individuals | ||
| Last name | Count | Lived (average) |
|---|---|---|
| Medeiros | 574 | 75.4 years |
| Souza | 418 | 75.8 years |
| Cabral | 360 | 75.6 years |
| Mello | 354 | 75.9 years |
| Ferreira | 342 | 74.3 years |
| Oliveira | 298 | 75.8 years |
| Costa | 286 | 74.4 years |
| Silvia | 283 | 75.4 years |
| Pacheco | 235 | 74.8 years |
| Moniz | 228 | 76.1 years |
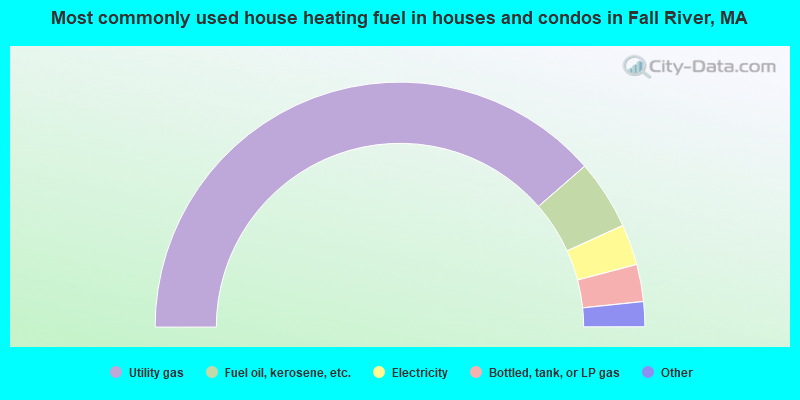
- 77.2%Utility gas
- 9.2%Fuel oil, kerosene, etc.
- 5.4%Electricity
- 4.9%Bottled, tank, or LP gas
- 1.4%Solar energy
- 1.1%Wood
- 0.7%Other fuel
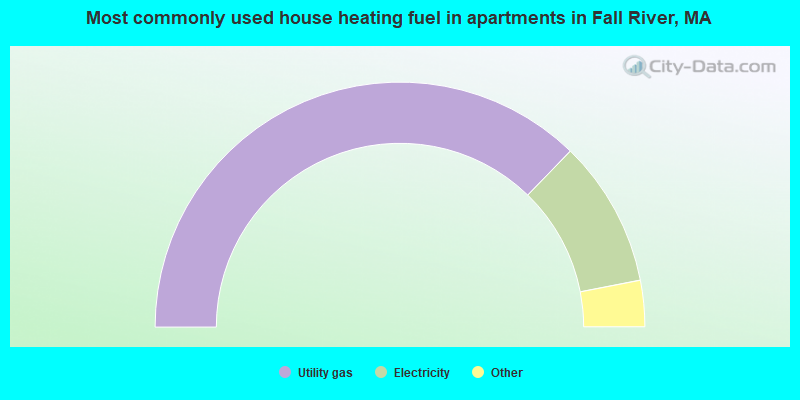
- 74.5%Utility gas
- 19.4%Electricity
- 2.9%Bottled, tank, or LP gas
- 1.8%Fuel oil, kerosene, etc.
- 0.9%Solar energy
- 0.5%Other fuel
Fall River compared to Massachusetts state average:
- Median household income below state average.
- Unemployed percentage below state average.
- Renting percentage above state average.
- Number of college students below state average.
- Percentage of population with a bachelor's degree or higher below state average.
Fall River on our top lists:
- #3 on the list of "Top 101 cities with the most residents born in Portugal (population 500+)"
- #3 on the list of "Top 101 cities with the most residents born in Southern Europe (population 500+)"
- #6 on the list of "Top 101 cities with the lowest percentage of workers working at home, population 50,000+"
- #14 on the list of "Top 101 cities with largest percentage of females in occupations: healthcare support occupations (population 50,000+)"
- #14 on the list of "Top 101 cities with largest percentage of males in occupations: personal care and service occupations (population 50,000+)"
- #14 on the list of "Top 101 cities with the smallest precipitation differences during a year (population 50,000+)"
- #18 on the list of "Top 101 cities with the smallest house values disparities (population 50,000+)"
- #24 on the list of "Top 100 cities with oldest houses (pop. 50,000+)"
- #29 on the list of "Top 101 cities with largest percentage of females in occupations: health technologists and technicians (population 50,000+)"
- #30 on the list of "Top 101 cities with the lowest cost per building permit (population 50,000+)"
- #30 on the list of "Top 101 cities with the most residents born in Europe (population 500+)"
- #32 on the list of "Top 100 cities with highest percentage of renters (pop. 50,000+)"
- #33 on the list of "Top 101 cities with largest percentage of males in industries: health care and social assistance (population 50,000+)"
- #34 on the list of "Top 101 cities with the highest number of assaults per 100,000 residents, excludes tourist destinations and others with a lot of outsiders visiting based on city industries data (population 50,000+)"
- #38 on the list of "Top 101 cities with largest percentage of males in occupations: construction and extraction occupations (population 50,000+)"
- #41 on the list of "Top 101 cities with the smallest percentage of one, detached housing units in structures (20,000+ housing units)"
- #51 on the list of "Top 100 least-educated cities (pop. 50,000+)"
- #52 on the list of "Top 101 cities with the largest percentage population decrease from 2000 (population 50,000+)"
- #52 on the list of "Top 101 cities with largest percentage of females in industries: accommodation and food services (population 50,000+)"
- #53 on the list of "Top 101 cities with largest percentage of females in occupations: food preparation and serving related occupations (population 50,000+)"
- #9 (02724) on the list of "Top 101 zip codes with the largest percentage of Portuguese first ancestries"
- #72 (02723) on the list of "Top 101 zip codes with the lowest charity contributions deductions as a percentage of AGI in 2012 (pop 5,000+)"
- #14 on the list of "Top 101 counties with the lowest percentage of residents that keep firearms around their homes"
- #29 on the list of "Top 101 counties with the lowest percentage of residents relocating to foreign countries in 2011 (pop. 50,000+)"
- #32 on the list of "Top 101 counties with the most Catholic congregations"
- #34 on the list of "Top 101 counties with the highest percentage of residents that smoked 100+ cigarettes in their lives"
- #41 on the list of "Top 101 counties with the most Catholic adherents"

|
|
Total of 154 patent applications in 2008-2024.