Cambridge, Massachusetts
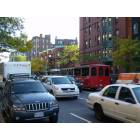
Cambridge: Columbus Park, Boston, MA
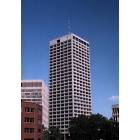
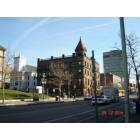
Cambridge: building in cambridge
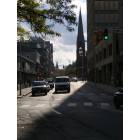
Cambridge: Cambridge MA

Cambridge: bridge
Cambridge: cambridge
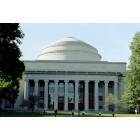
Cambridge: M.I.T.
Cambridge: eastgate
Cambridge: Cambridge, MA
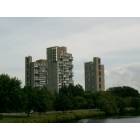
Cambridge: apartments
Cambridge: Back Bay area, Boston, MA
Cambridge: Cambridge MA
- see
13
more - add
your
Submit your own pictures of this city and show them to the world
- OSM Map
- General Map
- Google Map
- MSN Map
Population change since 2000: +16.9%
 |
| Males: 59,287 | |
| Females: 59,201 |
| Median resident age: | 29.6 years |
| Massachusetts median age: | 40.3 years |
Zip codes: 02139, 02140, 02141, 02142.
Cambridge Zip Code Map| Cambridge: | $109,358 |
| MA: | $94,488 |
Estimated per capita income in 2022: $70,762 (it was $31,156 in 2000)
Cambridge city income, earnings, and wages data
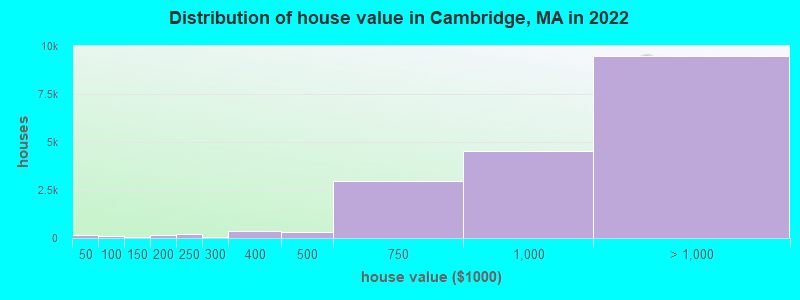
Estimated median house or condo value in 2022: over $1,000,000 (it was $331,600 in 2000)
| Cambridge: | over $1,000,000 |
| MA: | $534,700 |
Mean prices in 2022: all housing units: over $1,000,000; detached houses: over $1,000,000; townhouses or other attached units: over $1,000,000; in 2-unit structures: over $1,000,000; in 3-to-4-unit structures: $881,306; in 5-or-more-unit structures: $860,276
Median gross rent in 2022: $2,417.
(12.2% for White Non-Hispanic residents, 22.3% for Black residents, 17.6% for Hispanic or Latino residents, 37.9% for American Indian residents, 19.1% for other race residents, 11.9% for two or more races residents)
Detailed information about poverty and poor residents in Cambridge, MA


- 65,23855.1%White alone
- 23,77420.1%Asian alone
- 12,60910.6%Black alone
- 9,7858.3%Hispanic
- 6,6725.6%Two or more races
- 3320.3%Other race alone
- 590.05%Native Hawaiian and Other
Pacific Islander alone - 200.02%American Indian alone
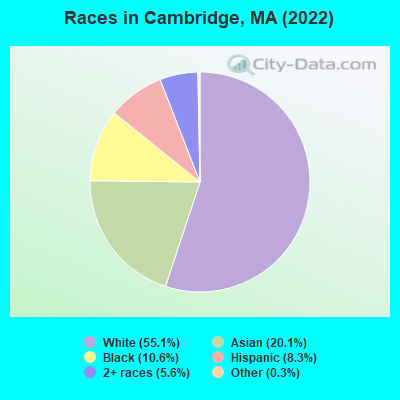
Races in Cambridge detailed stats: ancestries, foreign born residents, place of birth
According to our research of Massachusetts and other state lists, there were 15 registered sex offenders living in Cambridge, Massachusetts as of April 27, 2024.
The ratio of all residents to sex offenders in Cambridge is 7,376 to 1.
The ratio of registered sex offenders to all residents in this city is much lower than the state average.
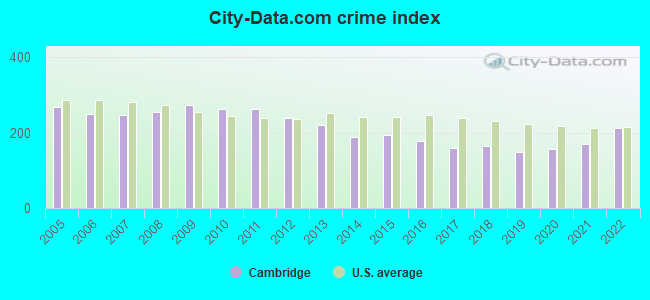
The City-Data.com crime index weighs serious crimes and violent crimes more heavily. Higher means more crime, U.S. average is 246.1. It adjusts for the number of visitors and daily workers commuting into cities.
- means the value is smaller than the state average.- means the value is about the same as the state average.
- means the value is bigger than the state average.
Crime rate in Cambridge detailed stats: murders, rapes, robberies, assaults, burglaries, thefts, arson
Full-time law enforcement employees in 2021, including police officers: 303 (262 officers - 230 male; 32 female).
| Officers per 1,000 residents here: | 2.15 |
| Massachusetts average: | 2.53 |
 Recent articles from our blog. Our writers, many of them Ph.D. graduates or candidates, create easy-to-read articles on a wide variety of topics.

 | Looking for affordable areas around Cambridge for families (57 replies) |
| One1 job in Hartford 1 in Cambridge - Best town to live (51 replies) |
| Two men shot near Central Square Cambridge (59 replies) |
| Relocating to Brookline / Cambridge from Chicago (52 replies) |
| Somerville vs Cambridge (buying) (4 replies) |
| commute to Cambridge from Soutborough? (26 replies) |
Latest news from Cambridge, MA collected exclusively by city-data.com from local newspapers, TV, and radio stations
Cambridge, MA City Guides:
Ancestries: Irish (5.0%), Italian (4.4%), European (4.1%), German (3.2%), English (3.1%), American (2.7%).
Current Local Time: EST time zone
Elevation: 30 feet
Land area: 6.43 square miles.
Population density: 18,431 people per square mile (very high).
35,937 residents are foreign born (14.0% Asia, 6.3% Europe, 5.2% Latin America).
| This city: | 30.6% |
| Massachusetts: | 17.6% |
Median real estate property taxes paid for housing units with mortgages in 2022: $3,948 (0.4%)
Median real estate property taxes paid for housing units with no mortgage in 2022: $4,892 (0.5%)
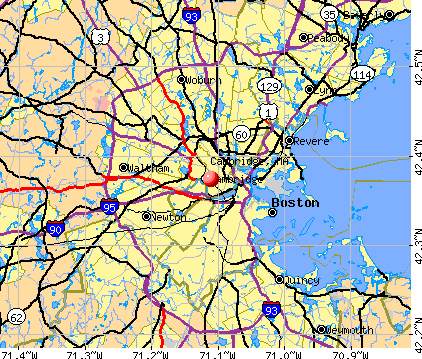
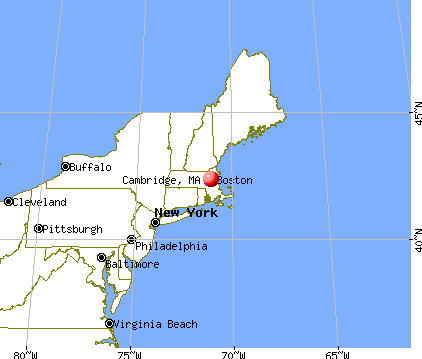
Nearest city with pop. 200,000+: Boston, MA  (3.8 miles , pop. 589,141).
Nearest city with pop. 1,000,000+: Bronx, NY (177.7 miles , pop. 1,332,650).
Nearest cities:
Latitude: 42.37 N, Longitude: 71.11 W
Daytime population change due to commuting: +56,589 (+47.8%)
Workers who live and work in this city: 41,790 (59.7%)
Area codes: 617, 857, 508

Cambridge tourist attractions:
- CambridgeSide Galleria, Cambridge, MA
- Boston Marriott Cambridge
- Hotel Marlowe a Kimpton Hotel
- The Inn at Harvard
- The Inn at Harvard
- Royal Sonesta Hotel Boston
- Hampton Inn Boston
- Boston Marriott Cambridge
- Le Meridien Cambridge
- Hyatt Regency Cambridge
- Courtyard by Marriott Boston Cambridge
- Sheraton Commander Hotel
- Best Western Hotel Tria
- Kendall Hotel
- Holiday Inn Express Boston
- Charles Hotel in Harvard Square
Cambridge, Massachusetts accommodation & food services, waste management - Economy and Business Data
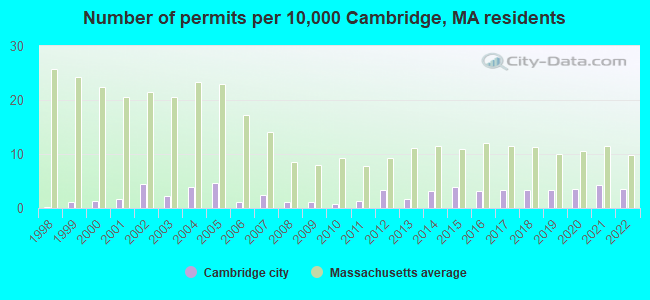
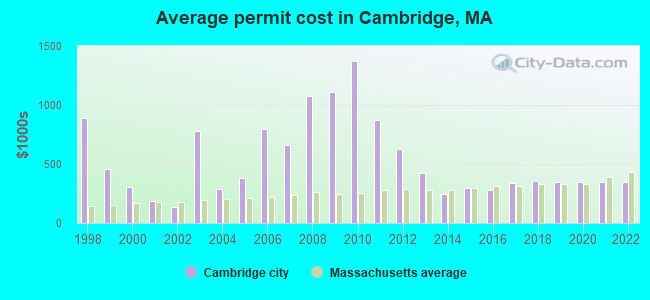
Single-family new house construction building permits:
- 2022: 36 buildings, average cost: $348,600
- 2021: 43 buildings, average cost: $348,500
- 2020: 35 buildings, average cost: $348,900
- 2019: 34 buildings, average cost: $347,400
- 2018: 34 buildings, average cost: $354,100
- 2017: 33 buildings, average cost: $336,500
- 2016: 31 buildings, average cost: $279,400
- 2015: 39 buildings, average cost: $292,800
- 2014: 31 buildings, average cost: $247,900
- 2013: 16 buildings, average cost: $419,700
- 2012: 33 buildings, average cost: $625,900
- 2011: 14 buildings, average cost: $873,400
- 2010: 8 buildings, average cost: $1,369,300
- 2009: 11 buildings, average cost: $1,108,100
- 2008: 12 buildings, average cost: $1,078,700
- 2007: 25 buildings, average cost: $658,500
- 2006: 12 buildings, average cost: $800,300
- 2005: 47 buildings, average cost: $383,000
- 2004: 39 buildings, average cost: $285,200
- 2003: 22 buildings, average cost: $776,300
- 2002: 45 buildings, average cost: $135,500
- 2001: 16 buildings, average cost: $183,100
- 2000: 13 buildings, average cost: $306,800
- 1999: 11 buildings, average cost: $454,100
- 1998: 2 buildings, average cost: $893,500
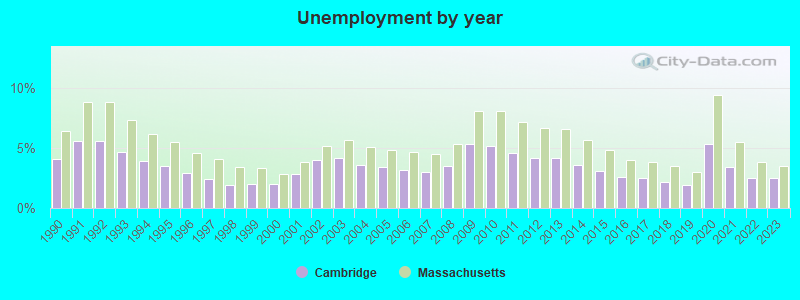
| Here: | 2.5% |
| Massachusetts: | 3.5% |
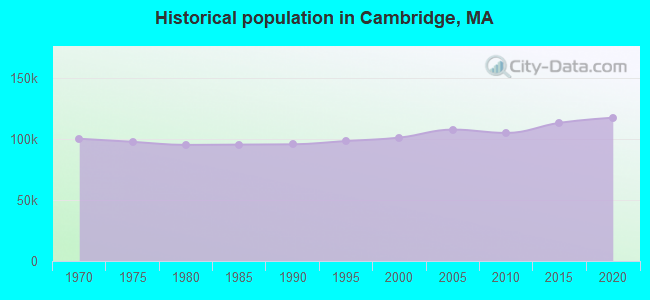
Population change in the 1990s: +5,503 (+5.7%).
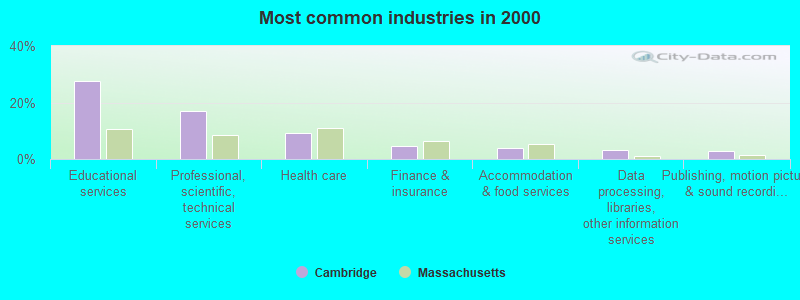
- Educational services (27.7%)
- Professional, scientific, technical services (16.8%)
- Health care (9.3%)
- Finance & insurance (4.7%)
- Accommodation & food services (3.9%)
- Data processing, libraries, other information services (3.1%)
- Publishing, motion picture & sound recording industries (3.0%)
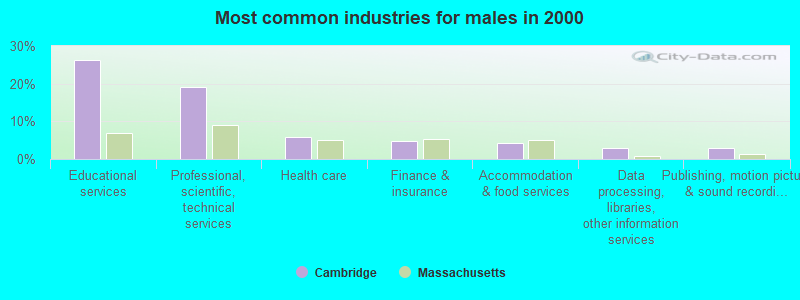
- Educational services (26.2%)
- Professional, scientific, technical services (19.1%)
- Health care (5.9%)
- Finance & insurance (4.7%)
- Accommodation & food services (4.2%)
- Data processing, libraries, other information services (3.0%)
- Publishing, motion picture & sound recording industries (2.9%)
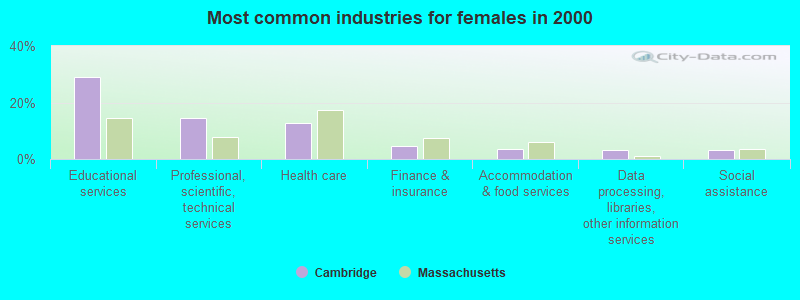
- Educational services (29.2%)
- Professional, scientific, technical services (14.6%)
- Health care (12.7%)
- Finance & insurance (4.7%)
- Accommodation & food services (3.5%)
- Data processing, libraries, other information services (3.2%)
- Social assistance (3.1%)
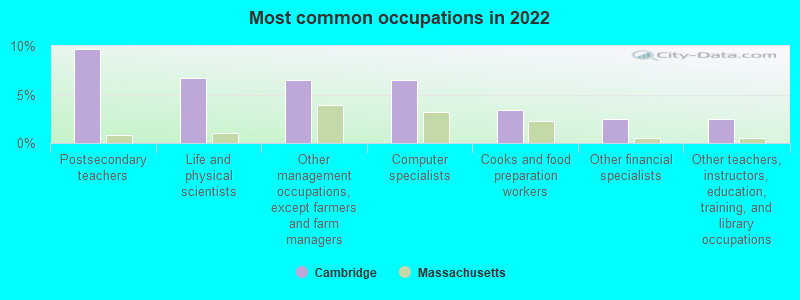
- Postsecondary teachers (9.7%)
- Life and physical scientists (6.7%)
- Other management occupations, except farmers and farm managers (6.5%)
- Computer specialists (6.5%)
- Cooks and food preparation workers (3.4%)
- Other financial specialists (2.5%)
- Other teachers, instructors, education, training, and library occupations (2.5%)
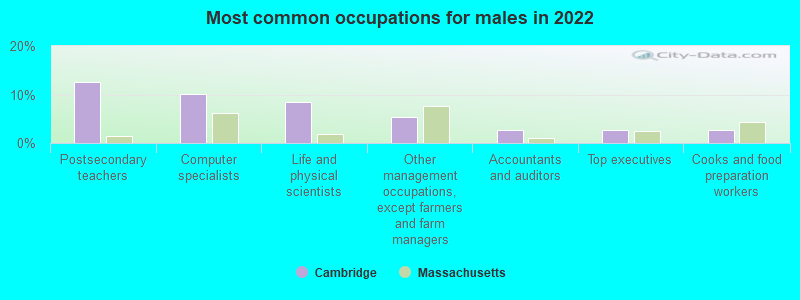
- Postsecondary teachers (12.5%)
- Computer specialists (10.1%)
- Life and physical scientists (8.5%)
- Other management occupations, except farmers and farm managers (5.4%)
- Accountants and auditors (2.8%)
- Top executives (2.7%)
- Cooks and food preparation workers (2.7%)
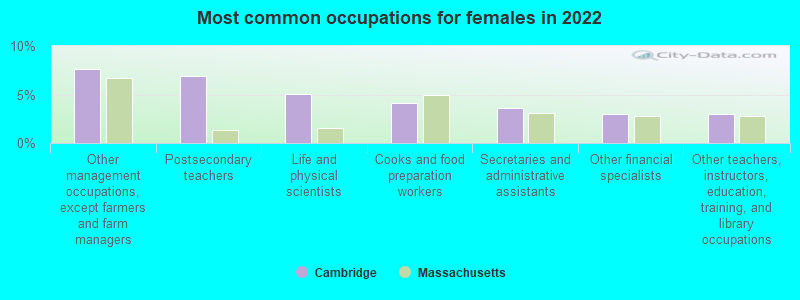
- Other management occupations, except farmers and farm managers (7.6%)
- Postsecondary teachers (6.9%)
- Life and physical scientists (5.0%)
- Cooks and food preparation workers (4.1%)
- Secretaries and administrative assistants (3.6%)
- Other financial specialists (3.0%)
- Other teachers, instructors, education, training, and library occupations (3.0%)
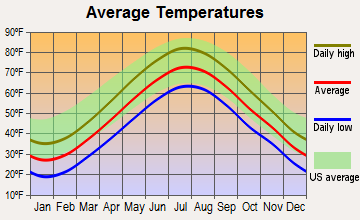
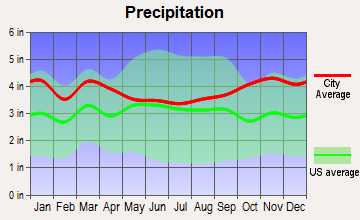
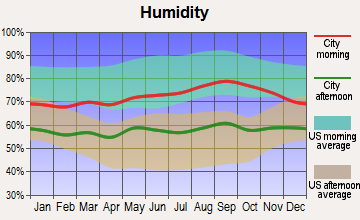
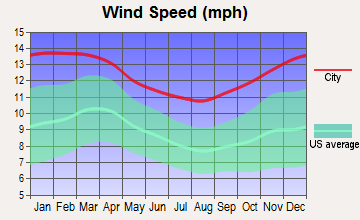
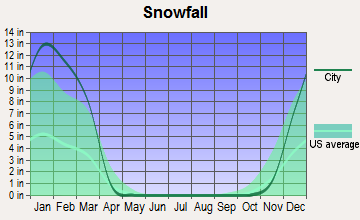
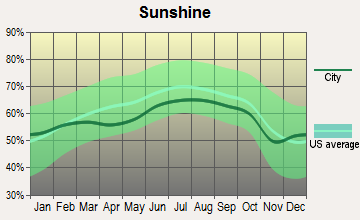
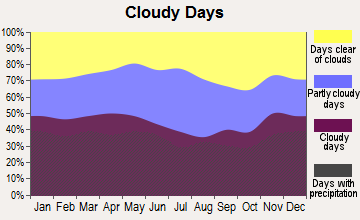
Average climate in Cambridge, Massachusetts
Based on data reported by over 4,000 weather stations
|
|

(lower is better)
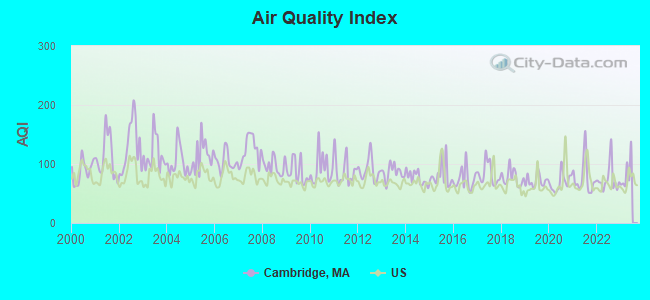
Air Quality Index (AQI) level in 2022 was 74.3. This is about average.
| City: | 74.3 |
| U.S.: | 72.6 |
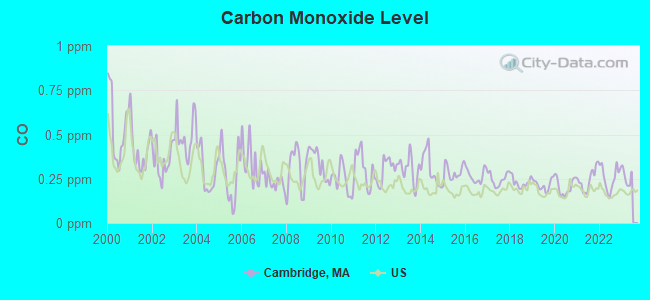
Carbon Monoxide (CO) [ppm] level in 2022 was 0.256. This is about average. Closest monitor was 1.9 miles away from the city center.
| City: | 0.256 |
| U.S.: | 0.251 |
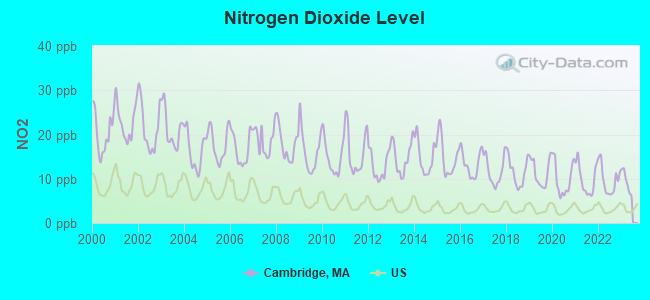
Nitrogen Dioxide (NO2) [ppb] level in 2022 was 9.63. This is significantly worse than average. Closest monitor was 0.7 miles away from the city center.
| City: | 9.63 |
| U.S.: | 5.11 |
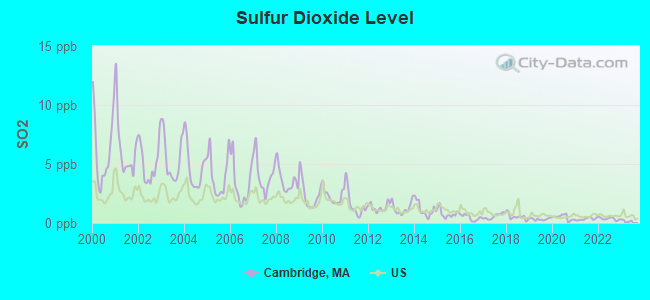
Sulfur Dioxide (SO2) [ppb] level in 2022 was 0.358. This is significantly better than average. Closest monitor was 0.7 miles away from the city center.
| City: | 0.358 |
| U.S.: | 1.515 |
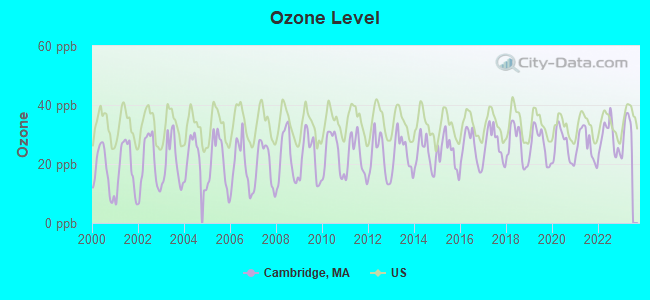
Ozone [ppb] level in 2022 was 28.9. This is about average. Closest monitor was 1.9 miles away from the city center.
| City: | 28.9 |
| U.S.: | 33.3 |
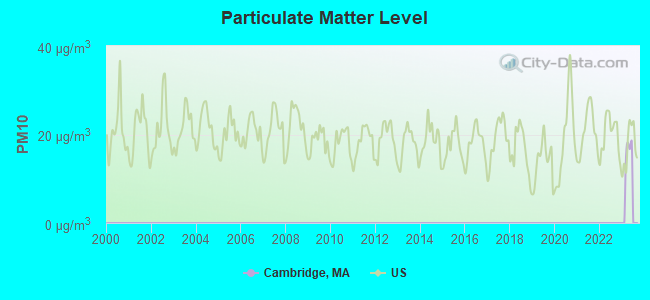
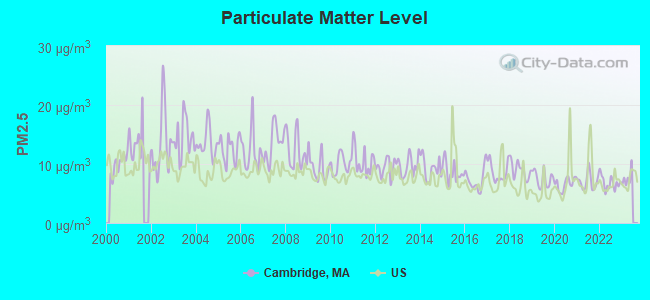
Particulate Matter (PM2.5) [µg/m3] level in 2022 was 6.83. This is about average. Closest monitor was 1.9 miles away from the city center.
| City: | 6.83 |
| U.S.: | 8.11 |
Tornado activity:
Cambridge-area historical tornado activity is near Massachusetts state average. It is 43% smaller than the overall U.S. average.
On 6/9/1953, a category F4 (max. wind speeds 207-260 mph) tornado 21.5 miles away from the Cambridge city center killed 90 people and injured 1228 people and caused between $50,000,000 and $500,000,000 in damages.
On 9/29/1974, a category F3 (max. wind speeds 158-206 mph) tornado 16.8 miles away from the city center injured one person and caused between $50,000 and $500,000 in damages.
Earthquake activity:
Cambridge-area historical earthquake activity is significantly above Massachusetts state average. It is 73% smaller than the overall U.S. average.On 10/7/1983 at 10:18:46, a magnitude 5.3 (5.1 MB, 5.3 LG, 5.1 ML, Class: Moderate, Intensity: VI - VII) earthquake occurred 196.2 miles away from the city center
On 4/20/2002 at 10:50:47, a magnitude 5.3 (5.3 ML, Depth: 3.0 mi) earthquake occurred 196.8 miles away from the city center
On 1/19/1982 at 00:14:42, a magnitude 4.7 (4.5 MB, 4.7 MD, 4.5 LG, Class: Light, Intensity: IV - V) earthquake occurred 81.7 miles away from Cambridge center
On 10/16/2012 at 23:12:25, a magnitude 4.7 (4.7 ML, Depth: 10.0 mi) earthquake occurred 87.7 miles away from the city center
On 4/20/2002 at 10:50:47, a magnitude 5.2 (5.2 MB, 4.2 MS, 5.2 MW, 5.0 MW) earthquake occurred 196.2 miles away from the city center
On 8/22/1992 at 12:20:32, a magnitude 4.8 (4.8 MB, 3.8 MS, 4.7 LG, Depth: 6.2 mi) earthquake occurred 229.8 miles away from Cambridge center
Magnitude types: regional Lg-wave magnitude (LG), body-wave magnitude (MB), duration magnitude (MD), local magnitude (ML), surface-wave magnitude (MS), moment magnitude (MW)
Natural disasters:
The number of natural disasters in Middlesex County (31) is a lot greater than the US average (15).Major Disasters (Presidential) Declared: 17
Emergencies Declared: 14
Causes of natural disasters: Floods: 12, Storms: 9, Hurricanes: 6, Snowstorms: 6, Winter Storms: 5, Blizzards: 2, Snows: 2, Explosion: 1, Heavy Rain: 1, Snowfall: 1, Water Main Break: 1, Wind: 1 (Note: some incidents may be assigned to more than one category).
Main business address for: SAPIENT CORP (SERVICES-COMPUTER INTEGRATED SYSTEMS DESIGN), ARIAD PHARMACEUTICALS INC (BIOLOGICAL PRODUCTS (NO DIAGNOSTIC SUBSTANCES)), ALNYLAM PHARMACEUTICALS, INC. (PHARMACEUTICAL PREPARATIONS), FORRESTER RESEARCH INC (SERVICES-ENGINEERING, ACCOUNTING, RESEARCH, MANAGEMENT), ARTISOFT INC (SERVICES-PREPACKAGED SOFTWARE), GENZYME CORP (BIOLOGICAL PRODUCTS (NO DIAGNOSTIC SUBSTANCES)), TRANSKARYOTIC THERAPIES INC (BIOLOGICAL PRODUCTS (NO DIAGNOSTIC SUBSTANCES)), CURIS INC (BIOLOGICAL PRODUCTS (NO DIAGNOSTIC SUBSTANCES)) and 22 other public companies.
Hospitals in Cambridge:
- CAMBRIDGE HEALTH ALLIANCE (Government - Local, provides emergency services, 1493 CAMBRIDGE STREET)
- HARVARD UNIVERSITY HEALTH SERV-STILLMAN INFIRMARY (75 MOUNT AUBURN STREET)
- MOUNT AUBURN HOSPITAL (Voluntary non-profit - Private, 330 MOUNT AUBURN STREET)
- OTIS HOSPITAL (85 OTIS ST)
Nursing Homes in Cambridge:
- CAMBRIDGE REHABILITATION AND NURSING CENTER (8 DANA STREET)
- CANTABRIDGIA HEALTH CARE NSG FAC (195 PROSPECT STREET)
- COREY SKILLED NURSING FACILITY (1 RUSSELL STREET)
- HARVARD MANOR NURSING HOME (273 HARVARD ST)
- JANE ELIZABETH HOUSE NSG HOME (6 PRENTISS ST)
- MAYOR MICHAEL J NEVILLE MANOR (650 CONCORD AVE)
- NEVILLE CENTER AT FRESH POND FOR NURSING AND REHAB (640 CONCORD AVENUE)
- SANCTA MARIA NURSING FACILITY (799 CONCORD AVENUE)
- VERNON HALL NURSING HOME (8 DANA ST)
- YOUVILLE HEALTHCARE CENTER INC (1575 CAMBRIDGE STREET)
Dialysis Facilities in Cambridge:
Home Health Centers in Cambridge:
Amtrak stations near Cambridge:
- 3 miles: BACK BAY (BOSTON, 145 DARTMOUTH ST.) . Services: ticket office, partially wheelchair accessible, enclosed waiting area, public restrooms, public payphones, vending machines, ATM, paid short-term parking, paid long-term parking, call for car rental service, taxi stand, public transit connection.
- 3 miles: BOSTON, NORTH STATION (BOSTON, 126 CAUSEWAY ST.) . Services: ticket office, enclosed waiting area.
- 4 miles: BOSTON (SO. STA) (BOSTON, ATLANTIC AVE. & SUMMER ST.) . Services: ticket office, fully wheelchair accessible, enclosed waiting area, public restrooms, public payphones, full-service food facilities and snack bar, ATM, paid short-term parking, paid long-term parking, call for car rental service, taxi stand, intercity bus service, public transit connection.
Colleges/Universities in Cambridge:
- Harvard University (Full-time enrollment: 20,857; Location: Massachusetts Hall; Private, not-for-profit; Website: www.harvard.edu; Offers Doctor's degree)
- Massachusetts Institute of Technology (Full-time enrollment: 13,548; Location: 77 Massachusetts Avenue; Private, not-for-profit; Website: web.mit.edu/student/; Offers Doctor's degree)
- Lesley University (Full-time enrollment: 4,317; Location: 29 Everett St; Private, not-for-profit; Website: www.lesley.edu; Offers Doctor's degree)
- Cambridge College (Full-time enrollment: 2,782; Location: 1000 Massachusetts Avenue; Private, not-for-profit; Website: www.cambridgecollege.edu; Offers Doctor's degree)
- Hult International Business School (Full-time enrollment: 680; Location: 1 Education Street; Private, not-for-profit; Website: www.hult.edu; Offers Master's degree)
- Le Cordon Bleu College of Culinary Arts-Cambridge (Full-time enrollment: 655; Location: 215 First St; Private, for-profit; Website: www.chefs.edu/boston)
- Longy School of Music of Bard College (Full-time enrollment: 168; Location: 27 Garden Street; Private, not-for-profit; Website: www.longy.edu; Offers Master's degree)
- Episcopal Divinity School (Full-time enrollment: 62; Location: 99 Brattle St; Private, not-for-profit; Website: www.eds.edu; Offers Doctor's degree)
Other colleges/universities with over 2000 students near Cambridge:
- Boston University (about 2 miles; Boston, MA; Full-time enrollment: 29,780)
- Bunker Hill Community College (about 3 miles; Boston, MA; FT enrollment: 8,814)
- Berklee College of Music (about 3 miles; Boston, MA; FT enrollment: 4,726)
- Emerson College (about 3 miles; Boston, MA; FT enrollment: 4,657)
- Emmanuel College (about 3 miles; Boston, MA; FT enrollment: 2,287)
- Tufts University (about 3 miles; Medford, MA; FT enrollment: 9,041)
- Simmons College (about 3 miles; Boston, MA; FT enrollment: 4,048)
Public high schools in Cambridge:
- CAMBRIDGE RINDGE AND LATIN (Students: 1,608, Location: 459 BROADWAY AVE, Grades: 9-12)
- PROSPECT HILL ACADEMY CHARTER SCHOOL (Students: 864, Location: 50 ESSEX STREET, Grades: KG-12, Charter school)
- COMMUNITY CHARTER SCHOOL OF CAMBRIDGE (Students: 178, Location: 245 BENT STREET, Grades: 6-12, Charter school)
Private high schools in Cambridge:
Biggest public elementary/middle schools in Cambridge:
- KING OPEN (Students: 486, Location: 850 CAMBRIDGE STREET, Grades: PK-5)
- PEABODY (Students: 426, Location: 70 RINDGE AVENUE, Grades: PK-5)
- GRAHAM AND PARKS (Students: 403, Location: 44 LINNAEAN STREET, Grades: PK-5)
- KENNEDY-LONGFELLOW (Students: 391, Location: 158 SPRING STREET, Grades: PK-5)
- MARIA L. BALDWIN (Students: 366, Location: 28 SACRAMENTO STREET, Grades: PK-5)
- MORSE (Students: 336, Location: 40 GRANITE STREET, Grades: PK-5)
- AMIGOS SCHOOL (Students: 315, Location: 15 UPTON STREET, Grades: PK-8)
- BENJAMIN BANNEKER CHARTER PUBLIC SCHOOL (Students: 310, Location: 21 NOTRE DAME AVENUE, Grades: KG-6, Charter school)
- JOHN M TOBIN (Students: 304, Location: 197 VASSAL LANE, Grades: PK-5)
- CAMBRIDGEPORT (Students: 274, Location: 89 ELM STREET, Grades: PK-5)
Private elementary/middle schools in Cambridge:
- SHADY HILL SCHOOL (Students: 518, Location: 178 COOLIDGE HILL, Grades: PK-8)
- ST PETER ELEMENTARY SCHOOL (Students: 226, Location: 96 CONCORD AVE, Grades: PK-8)
- CAMBRIDGE MONTESSORI SCHOOL (Students: 224, Location: 161 GARDEN ST, Grades: PK-8)
- FAYERWEATHER STREET SCHOOL (Students: 193, Location: 765 CONCORD AVE, Grades: PK-8)
- CAMBRIDGE FRIENDS SCHOOL (Students: 192, Location: 5 CADBURY RD, Grades: PK-8)
- MALIK ACADEMY/ AL BUSTAN PRESCHOOL (Students: 91, Location: 808 MEMORIAL DR, Grades: PK-5)
- BOSTON ARCHDIOCESAN CHOIR SCHOOL (Students: 42, Location: 29 MOUNT AUBURN ST, Grades: 5-8, Boys only)
- THE HENRY BUCKNER SCHOOL (Students: 37, Location: 85 BISHOP RICHARD ALLEN DR, Grades: PK-1)
Library in Cambridge:
Points of interest:
Notable locations in Cambridge: Cutter Square (A), Hoyt Field (B), Harvard Observatory (C), Stop amd Shop Center (D), Acorn Office Park (E), Alumni Swimming Pool (F), Cambridge Office Park (G), Fresh Pond Municipal Golf Course (H), Gold Star Pool (I), Great Court (J), Porter Square Station (K), University Park (L), Charlesgate Yacht Club (M), Fresh Pond Golf Course (N), Agassiz Community Center (O), Aggasiz House (P), Aiken Building (Q), Albany Street Garage (R), Alumni Center (S), American Academy of Arts and Sciences (T). Display/hide their locations on the map
Shopping Centers: Fresh Pond Shopping Center (1), Cambridgeside Galleria Shopping Center (2), Central Plaza Shopping Center (3), Central Square Mall Shopping Center (4), Fresh Pond Mall Shopping Center (5), Porter Square Shopping Center (6), The Atrium Shopping Center (7). Display/hide their locations on the map
Main business address in Cambridge include: SAPIENT CORP (A), ARIAD PHARMACEUTICALS INC (B), ALNYLAM PHARMACEUTICALS, INC. (C), FORRESTER RESEARCH INC (D), ARTISOFT INC (E), GENZYME CORP (F), TRANSKARYOTIC THERAPIES INC (G), CURIS INC (H). Display/hide their locations on the map
Churches in Cambridge include: Sacred Heart Parish Church (A), Western Avenue Baptist Church (B), Transcendental Meditation Center (C), Santo Cristo Center (D), Saint Peters Episcopal Church (E), Saint Pauls Catholic Church (F), Saint Marys Orthodox Church (G), Saint Marys Church of the Annunciation Catholic Church (H), Saint James Episcopal Church (I). Display/hide their locations on the map
Cemeteries: Belmont Cemetery (1), Cambridge Cemetery (2), Burial Hill Cemetery (3), Old Burying Ground (4), North Cambridge Catholic Cemetery (5). Display/hide their locations on the map
Lakes, reservoirs, and swamps: Blacks Nook (A), Fresh Pond (B), Jerrys Pond (C), Lily Pond (D), Little Fresh Pond (E), Perch Pond (F), Salt Marsh (G). Display/hide their locations on the map
Rivers: Little River (A), Millers River (B). Display/hide their locations on the map
Parks in Cambridge include: Hastings Square (1), Jackson Gardens (2), Jefferson Park (3), John A Ahern Field (4), John Bridge Statue (5), John F Kennedy Park (6), John Harvard Statue (7), LaFayette Square (8), Law School Yard (9). Display/hide their locations on the map
Beach: Magazine Beach (A). Display/hide its location on the map
Tourist attractions: Art Interactive (Museums; 130 Bishop Richard Allen), Hooper-Lee-Nichols House (Historical Places & Services; 159 Brattle Street), Cambridge Historical Society (Historical Places & Services; 159 Brattle Street), Mass Commonwealth - Courts- Supreme Judicial Court- Middlesex County (Cultural Attractions- Events- & Facilities; Law Library), Mount Auburn Cemetery (Botanical Gardens; 580 Mount Auburn St), Harvard Museum of Natural History (Cultural Attractions- Events- & Facilities; 26 Oxford Street), Museum of Useful Things (Cultural Attractions- Events- & Facilities; 49 Brattle Street # B), Harvard University - Academic & Administrative Departments- Harvard Art Mus (Cultural Attractions- Events- & Facilities; 371 Harvard Street Apt 2D), Harvard University -Semitic Museum (Cultural Attractions- Events- & Facilities; 6 Divinity Avenue).
Hotels: Amory Guest House (62 Amory St), Harding House (288 Harvard Street), Boston Marriott (2 Cambridge Ctr), Best Western Homestead (220 Alewife Brook Parkway), Hestia Home Management (369 Columbia Street), Hampton Inn (191 Monsignor Obrien Highway), Holiday Inn Express Hotel & Suites (250 Monsignor O'brien Highway), Pallysadoe (575 Memorial Drive), Howard Johnson (777 Memorial Drive).
Courts: Comm Of Mass Dmh Cambridge Court Clinic (40 Thorndike), Mass Commonwealth - Courts- Supreme Judicial Court- Middlesex County (Law Library), Cambridge City - Cambridge Housing Authority- Work Force-Newtowne C (119 Windsor Street).
Birthplace of: Cornelius Shea - Labor leader, Bill Everett - Comic book writer-artist, Tip O'Neill - Politician, Charles Peirce, Warren Fales Draper - General, Anne McCaffrey - (born 1926), fantasy author, Joe Kelley - Baseball player, Dane Cook - Actor and comedian, E. E. Cummings, James Russell Lowell - (1819-1891), writer.
Drinking water stations with addresses in Cambridge and their reported violations in the past:
CAMBRIDGE WATER DEPARTMENT (Population served: 105,162, Surface water):Past monitoring violations:
- One regular monitoring violation
| This city: | 2.0 people |
| Massachusetts: | 2.5 people |
| This city: | 39.6% |
| Whole state: | 63.0% |
| This city: | 8.5% |
| Whole state: | 7.0% |
Likely homosexual households (counted as self-reported same-sex unmarried-partner households)
- Lesbian couples: 0.9% of all households
- Gay men: 0.7% of all households
People in group quarters in Cambridge in 2010:
- 15,864 people in college/university student housing
- 415 people in other noninstitutional facilities
- 303 people in emergency and transitional shelters (with sleeping facilities) for people experiencing homelessness
- 277 people in nursing facilities/skilled-nursing facilities
- 137 people in group homes intended for adults
- 34 people in residential treatment centers for adults
- 25 people in workers' group living quarters and job corps centers
- 22 people in correctional facilities intended for juveniles
- 15 people in group homes for juveniles (non-correctional)
- 6 people in correctional residential facilities
- 4 people in in-patient hospice facilities
People in group quarters in Cambridge in 2000:
- 13,199 people in college dormitories (includes college quarters off campus)
- 415 people in other noninstitutional group quarters
- 272 people in nursing homes
- 227 people in local jails and other confinement facilities (including police lockups)
- 207 people in religious group quarters
- 164 people in other nonhousehold living situations
- 79 people in homes for the mentally ill
- 52 people in other group homes
- 33 people in homes or halfway houses for drug/alcohol abuse
- 9 people in homes for the mentally retarded
- 3 people in hospitals/wards and hospices for chronically ill
- 3 people in hospices or homes for chronically ill
- 3 people in wards in general hospitals for patients who have no usual home elsewhere
Banks with most branches in Cambridge (2011 data):
- Bank of America, National Association: 8 branches. Info updated 2009/11/18: Bank assets: $1,451,969.3 mil, Deposits: $1,077,176.8 mil, headquarters in Charlotte, NC, positive income, 5782 total offices, Holding Company: Bank Of America Corporation
- RBS Citizens, National Association: Lechmere Square Branch, Kendall Square Branch, Cambridge Dunkin Donuts, Harvard Square Branch, Central Square-West Branch. Info updated 2007/09/19: Bank assets: $106,940.6 mil, Deposits: $75,690.2 mil, headquarters in Providence, RI, positive income, 1135 total offices, Holding Company: Uk Financial Investments Limited
- Cambridge Trust Company: Kendall Square Branch, Huron Branch, at 1336 Massachusetts Avenue, Massachusetts Avenue Branch, Mit At University Park Branch. Info updated 2006/09/29: Bank assets: $1,275.9 mil, Deposits: $1,129.9 mil, local headquarters, positive income, Mortgage Lending Specialization, 13 total offices, Holding Company: Cambridge Bancorp
- Cambridge Savings Bank: Https://www.Cambridgesavings.com Bra, Cambridge Street Branch, Porter Square Shopping Center Branch, Central Square Branch, at 1374 Massachusetts Avenue. Info updated 2007/01/05: Bank assets: $2,316.4 mil, Deposits: $1,902.8 mil, local headquarters, positive income, Commercial Lending Specialization, 18 total offices, Holding Company: Cambridge Financial Group, Inc.
- Citibank, National Association: Porter Square Branch, 709 Central Square, Harvard Square Financial Center, Kendall Square Branch. Info updated 2012/01/10: Bank assets: $1,288,658.0 mil, Deposits: $882,541.0 mil, headquarters in Sioux Falls, SD, positive income, International Specialization, 1048 total offices, Holding Company: Citigroup Inc.
- Eastern Bank: Fresh Pond Mall Branch, Central Square Branch, Harvard Square Branch, Kendall Square Branch. Info updated 2011/03/30: Bank assets: $7,812.9 mil, Deposits: $6,295.8 mil, headquarters in Boston, MA, positive income, Commercial Lending Specialization, 94 total offices, Holding Company: Eastern Bank Corporation
- East Cambridge Savings Bank: Cambridge Branch, Cambridge Branch, Cambridge Branch, at 292 Cambridge Street. Info updated 2007/04/09: Bank assets: $803.6 mil, Deposits: $690.6 mil, local headquarters, positive income, 9 total offices
- Sovereign Bank, National Association: Central Square Branch at 515 Massachusetts Avenue, branch established on 1892/01/01; Harvard Square Branch at 1420 Massachusetts Ave, branch established on 2005/08/08. Info updated 2012/01/31: Bank assets: $78,146.9 mil, Deposits: $48,042.9 mil, headquarters in Wilmington, DE, positive income, Commercial Lending Specialization, 718 total offices, Holding Company: Banco Santander, S.A.
- TD Bank, National Association: Harvard Square Branch at 1270 Massachusettes Avenue, branch established on 2010/06/25; Cambridge Fresh Pond Branch at 235 Alewife Brook Parkway, branch established on 2010/01/16. Info updated 2010/10/04: Bank assets: $188,912.6 mil, Deposits: $153,149.8 mil, headquarters in Wilmington, DE, positive income, 1314 total offices, Holding Company: Toronto-Dominion Bank, The
- 6 other banks with 6 local branches
For population 15 years and over in Cambridge:
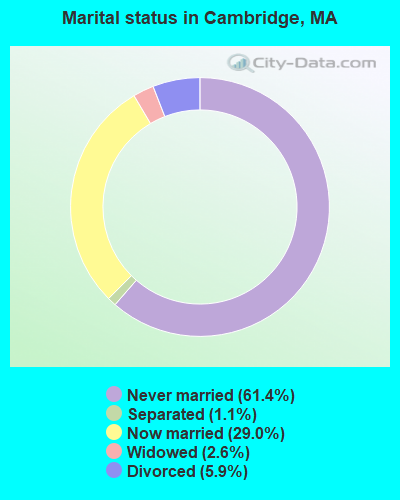
- Never married: 61.4%
- Now married: 29.0%
- Separated: 1.1%
- Widowed: 2.6%
- Divorced: 5.9%
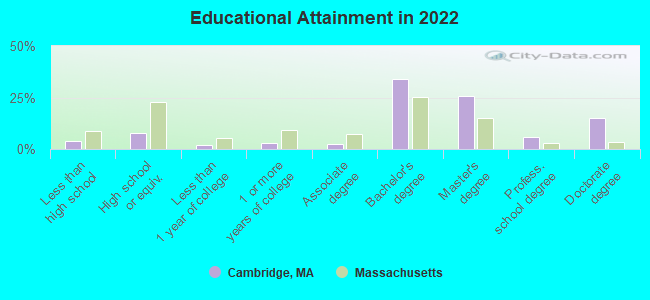
For population 25 years and over in Cambridge:
- High school or higher: 96.4%
- Bachelor's degree or higher: 81.1%
- Graduate or professional degree: 46.9%
- Unemployed: 6.1%
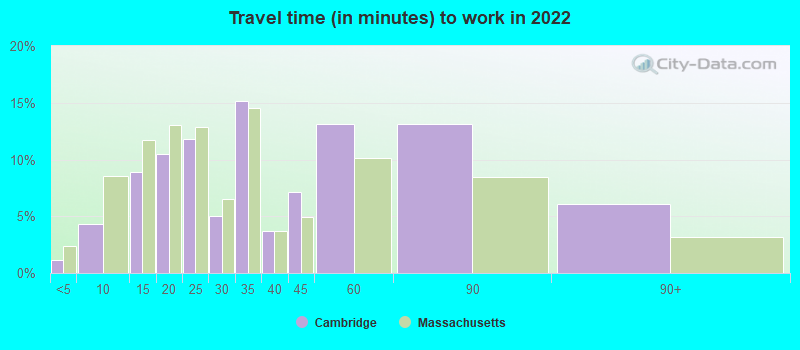
- Mean travel time to work (commute): 17.0 minutes
| Here: | 10.5 |
| Massachusetts average: | 13.0 |
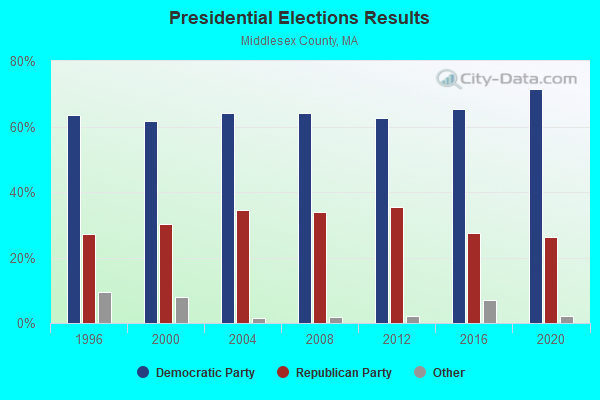
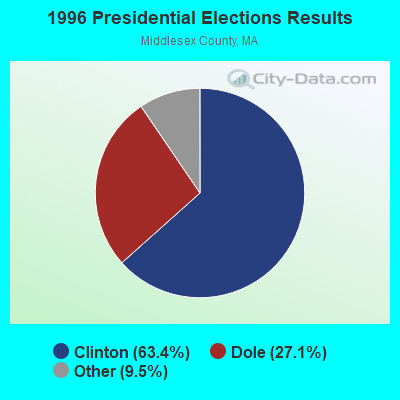
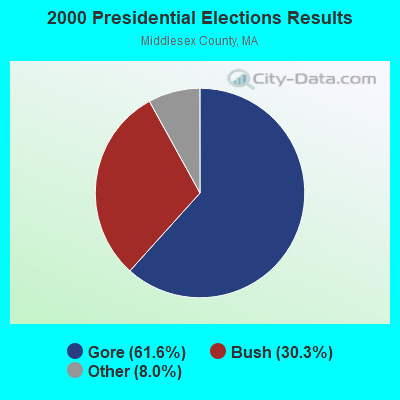
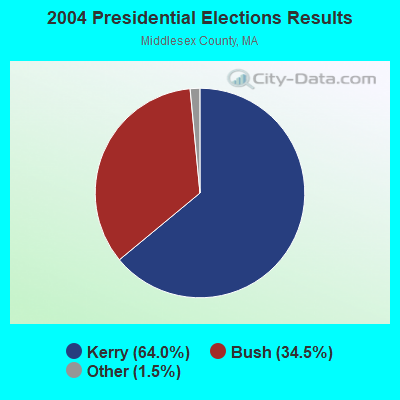
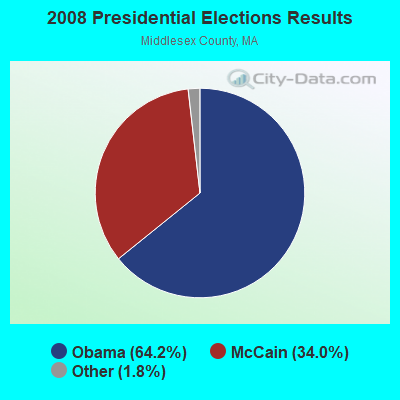
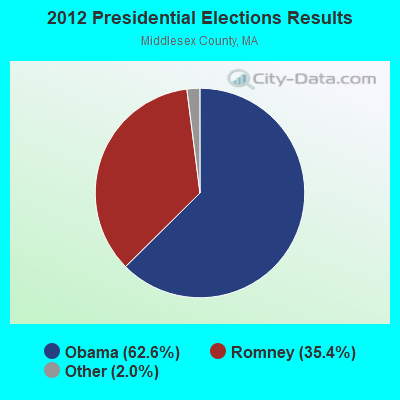
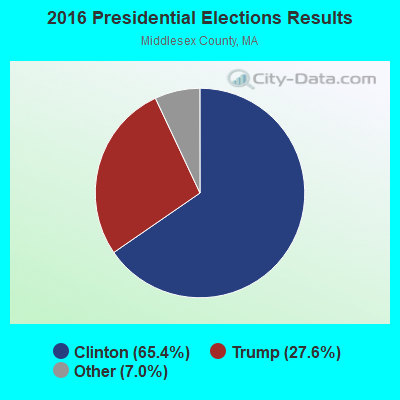
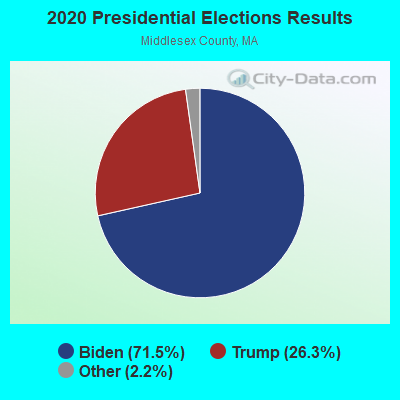
Graphs represent county-level data. Detailed 2008 Election Results
Neighborhoods in Cambridge:
(Cambridge, Massachusetts Neighborhood Map)- Larchwood neighborhood
- MIT (Massachusetts Institute of Technology) neighborhood
- Mid Cambridge neighborhood
- Neighborhood Four neighborhood
- North Cambridge neighborhood
- Porter Square neighborhood
- Riverside neighborhood
- Strawberry Hill neighborhood
- Wellington Harrington neighborhood
- West Cambridge (Huron Village) neighborhood
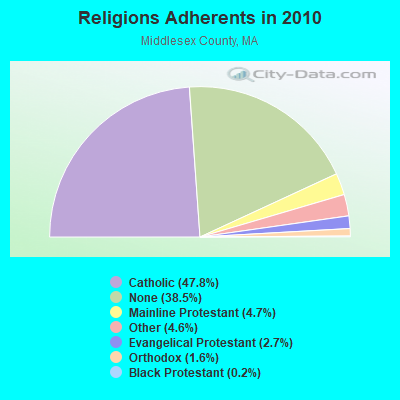
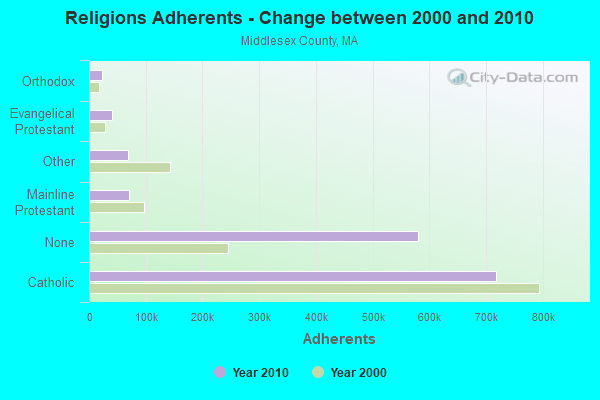
Religion statistics for Cambridge, MA (based on Middlesex County data)
| Religion | Adherents | Congregations |
|---|---|---|
| Catholic | 718,209 | 107 |
| Mainline Protestant | 70,053 | 269 |
| Other | 68,480 | 199 |
| Evangelical Protestant | 41,270 | 304 |
| Orthodox | 23,641 | 28 |
| Black Protestant | 2,276 | 8 |
| None | 579,156 | - |
Food Environment Statistics:
| This county: | 1.71 / 10,000 pop. |
| Massachusetts: | 1.98 / 10,000 pop. |
| This county: | 0.03 / 10,000 pop. |
| Massachusetts: | 0.05 / 10,000 pop. |
| Middlesex County: | 2.14 / 10,000 pop. |
| State: | 2.22 / 10,000 pop. |
| Middlesex County: | 1.38 / 10,000 pop. |
| State: | 1.77 / 10,000 pop. |
| Middlesex County: | 7.84 / 10,000 pop. |
| Massachusetts: | 8.76 / 10,000 pop. |
| This county: | 7.8% |
| Massachusetts: | 8.1% |
| This county: | 21.5% |
| Massachusetts: | 22.5% |
| Middlesex County: | 18.0% |
| Massachusetts: | 16.5% |
Health and Nutrition:
| Here: | 54.5% |
| Massachusetts: | 50.5% |
| This city: | 55.8% |
| Massachusetts: | 48.0% |
| Cambridge: | 27.1 |
| Massachusetts: | 28.4 |
| This city: | 17.0% |
| Massachusetts: | 20.7% |
| Cambridge: | 9.1% |
| State: | 10.4% |
| Here: | 6.9 |
| State: | 6.8 |
| Cambridge: | 27.9% |
| Massachusetts: | 33.4% |
| This city: | 63.5% |
| State: | 57.1% |
| Here: | 84.2% |
| Massachusetts: | 79.2% |
More about Health and Nutrition of Cambridge, MA Residents
| Local government employment and payroll (March 2022) | |||||
| Function | Full-time employees | Monthly full-time payroll | Average yearly full-time wage | Part-time employees | Monthly part-time payroll |
|---|---|---|---|---|---|
| Hospitals | 2,889 | $28,403,370 | $117,979 | 1,095 | $8,192,127 |
| Elementary and Secondary - Instruction | 1,423 | $9,915,170 | $83,614 | 128 | $240,735 |
| Elementary and Secondary - Other Total | 292 | $1,841,850 | $75,692 | 92 | $131,230 |
| Firefighters | 267 | $2,448,911 | $110,063 | 0 | $0 |
| Police Protection - Officers | 264 | $3,969,050 | $180,411 | 16 | $86,800 |
| Welfare | 215 | $1,257,391 | $70,180 | 436 | $657,576 |
| Streets and Highways | 194 | $1,433,768 | $88,687 | 6 | $26,133 |
| Other Government Administration | 144 | $1,163,306 | $96,942 | 29 | $95,449 |
| Other and Unallocable | 97 | $799,596 | $98,919 | 18 | $41,947 |
| Financial Administration | 95 | $821,872 | $103,815 | 13 | $49,551 |
| Local Libraries | 76 | $493,954 | $77,993 | 59 | $138,167 |
| Water Supply | 61 | $402,553 | $79,191 | 1 | $640 |
| Solid Waste Management | 57 | $362,257 | $76,265 | 1 | $492 |
| Police - Other | 49 | $414,926 | $101,615 | 4 | $15,152 |
| Parks and Recreation | 47 | $363,293 | $92,756 | 7 | $7,471 |
| Sewerage | 19 | $177,679 | $112,218 | 0 | $0 |
| Judicial and Legal | 13 | $128,920 | $119,003 | 0 | $0 |
| Fire - Other | 9 | $102,610 | $136,813 | 3 | $16,882 |
| Housing and Community Development (Local) | 7 | $63,599 | $109,027 | 1 | $799 |
| Totals for Government | 6,218 | $54,564,075 | $105,302 | 1,909 | $9,701,152 |
Cambridge government finances - Expenditure in 2021 (per resident):
- Construction - General - Other: $38,965,000 ($328.85)
Regular Highways: $26,268,000 ($221.69)
Sewerage: $18,090,000 ($152.67)
Elementary and Secondary Education: $14,989,000 ($126.50)
General Public Buildings: $10,820,000 ($91.32)
Hospitals: $10,181,000 ($85.92)
Water Utilities: $3,618,000 ($30.53)
- Current Operations - Hospitals: $654,220,000 ($5521.40)
Elementary and Secondary Education: $249,481,000 ($2105.54)
General - Other: $112,839,000 ($952.32)
Police Protection: $42,897,000 ($362.04)
Local Fire Protection: $32,379,000 ($273.27)
Parks and Recreation: $20,924,000 ($176.59)
Protective Inspection and Regulation - Other: $16,953,000 ($143.08)
Water Utilities: $11,633,000 ($98.18)
Libraries: $9,539,000 ($80.51)
Solid Waste Management: $8,762,000 ($73.95)
Regular Highways: $8,393,000 ($70.83)
Financial Administration: $7,585,000 ($64.01)
Central Staff Services: $5,098,000 ($43.03)
General Public Buildings: $4,431,000 ($37.40)
Housing and Community Development: $3,911,000 ($33.01)
Sewerage: $2,898,000 ($24.46)
Judicial and Legal Services: $2,464,000 ($20.80)
Public Welfare - Other: $802,000 ($6.77)
Parking Facilities: $798,000 ($6.73)
- General - Interest on Debt: $18,905,000 ($159.55)
- Intergovernmental to Local - Other - Elementary and Secondary Education: $1,294,000 ($10.92)
Other - Health - Other: $69,000 ($0.58)
Other - Central Staff Services: $64,000 ($0.54)
Other - Transit Utilities: $3,000 ($0.03)
- Intergovernmental to State - Transit Utilities: $10,660,000 ($89.97)
General - Other: $401,000 ($3.38)
- Other Capital Outlay - Hospitals: $7,091,000 ($59.85)
General - Other: $3,432,000 ($28.96)
Elementary and Secondary Education: $2,652,000 ($22.38)
Regular Highways: $500,000 ($4.22)
Police Protection: $201,000 ($1.70)
Local Fire Protection: $141,000 ($1.19)
Protective Inspection and Regulation - Other: $94,000 ($0.79)
Parks and Recreation: $44,000 ($0.37)
Water Utilities: $38,000 ($0.32)
Financial Administration: $1,000 ($0.01)
- Total Salaries and Wages: $145,827,000 ($1230.73)
Cambridge government finances - Revenue in 2021 (per resident):
- Charges - Hospital Public: $389,738,000 ($3289.26)
Sewerage: $54,122,000 ($456.77)
Parking Facilities: $8,257,000 ($69.69)
Other: $6,250,000 ($52.75)
Parks and Recreation: $1,120,000 ($9.45)
Elementary and Secondary Education School Lunch: $812,000 ($6.85)
Housing and Community Development: $440,000 ($3.71)
Elementary and Secondary Education - Other: $24,000 ($0.20)
- Federal Intergovernmental - Other: $45,040,000 ($380.12)
Health and Hospitals: $6,886,000 ($58.12)
Housing and Community Development: $1,485,000 ($12.53)
Education: $558,000 ($4.71)
- Local Intergovernmental - Health and Hospitals: $7,450,000 ($62.88)
- Miscellaneous - General Revenue - Other: $31,404,000 ($265.04)
Interest Earnings: $18,406,000 ($155.34)
Fines and Forfeits: $6,006,000 ($50.69)
Donations From Private Sources: $524,000 ($4.42)
- Revenue - Water Utilities: $16,651,000 ($140.53)
- State Intergovernmental - Health and Hospitals: $265,533,000 ($2241.01)
Education: $33,157,000 ($279.83)
General Local Government Support: $31,190,000 ($263.23)
Other: $6,042,000 ($50.99)
Public Welfare: $491,000 ($4.14)
Highways: $123,000 ($1.04)
Sewerage: $45,000 ($0.38)
- Tax - Property: $484,478,000 ($4088.84)
Other License: $58,549,000 ($494.13)
Other Selective Sales: $4,342,000 ($36.65)
Cambridge government finances - Debt in 2021 (per resident):
- Long Term Debt - Outstanding Unspecified Public Purpose: $493,426,000 ($4164.35)
Beginning Outstanding - Unspecified Public Purpose: $486,677,000 ($4107.39)
Issue, Unspecified Public Purpose: $88,310,000 ($745.31)
Retired Unspecified Public Purpose: $81,561,000 ($688.35)
Cambridge government finances - Cash and Securities in 2021 (per resident):
- Bond Funds - Cash and Securities: $207,957,000 ($1755.09)
- Other Funds - Cash and Securities: $675,188,000 ($5698.37)
- Sinking Funds - Cash and Securities: $79,000 ($0.67)
6.91% of this county's 2021 resident taxpayers lived in other counties in 2020 ($102,955 average adjusted gross income)
| Here: | 6.91% |
| Massachusetts average: | 6.35% |
0.01% of residents moved from foreign countries ($137 average AGI)
Middlesex County: 0.01% Massachusetts average: 0.01%
Top counties from which taxpayers relocated into this county between 2020 and 2021:
| from Suffolk County, MA | |
| from Essex County, MA | |
| from Norfolk County, MA |
8.22% of this county's 2020 resident taxpayers moved to other counties in 2021 ($123,369 average adjusted gross income)
| Here: | 8.22% |
| Massachusetts average: | 7.18% |
0.01% of residents moved to foreign countries ($124 average AGI)
Middlesex County: 0.01% Massachusetts average: 0.02%
Top counties to which taxpayers relocated from this county between 2020 and 2021:
| to Suffolk County, MA | |
| to Essex County, MA | |
| to Worcester County, MA |
| Businesses in Cambridge, MA | ||||
| Name | Count | Name | Count | |
|---|---|---|---|---|
| 7-Eleven | 5 | KFC | 1 | |
| ALDO | 3 | LensCrafters | 1 | |
| AT&T | 4 | Macy's | 1 | |
| Abercrombie & Fitch | 1 | Marriott | 2 | |
| Ace Hardware | 1 | MasterBrand Cabinets | 1 | |
| Aeropostale | 1 | McDonald's | 2 | |
| American Eagle Outfitters | 2 | Men's Wearhouse | 1 | |
| Ann Taylor | 3 | Motherhood Maternity | 2 | |
| Apple Store | 1 | New Balance | 4 | |
| Bakers | 1 | Nike | 23 | |
| Bally Total Fitness | 1 | Old Navy | 1 | |
| Banana Republic | 1 | Pac Sun | 1 | |
| Baskin-Robbins | 2 | Payless | 2 | |
| Bath & Body Works | 1 | PetSmart | 1 | |
| Bebe | 1 | Pier 1 Imports | 1 | |
| Ben & Jerry's | 1 | Qdoba Mexican Grill | 1 | |
| Best Western | 1 | Quiznos | 1 | |
| Blockbuster | 1 | RadioShack | 5 | |
| Brookstone | 1 | Rite Aid | 3 | |
| Budget Car Rental | 1 | Sears | 1 | |
| Burger King | 2 | Sephora | 1 | |
| CVS | 4 | Shaw's | 3 | |
| Charlotte Russe | 1 | Sheraton | 1 | |
| Chipotle | 2 | Sprint Nextel | 1 | |
| Crate & Barrel | 1 | Staples | 2 | |
| DHL | 2 | Starbucks | 10 | |
| Domino's Pizza | 1 | Subway | 4 | |
| Dunkin Donuts | 14 | T-Mobile | 3 | |
| Express | 1 | T.J.Maxx | 1 | |
| FedEx | 33 | Taco Bell | 2 | |
| Finish Line | 1 | The Cheesecake Factory | 1 | |
| Foot Locker | 1 | Toys"R"Us | 1 | |
| GNC | 2 | Trader Joe's | 2 | |
| GameStop | 1 | True Value | 3 | |
| Gap | 2 | U-Haul | 1 | |
| H&M | 1 | UPS | 32 | |
| H&R Block | 6 | Urban Outfitters | 1 | |
| Hilton | 1 | Vans | 8 | |
| Holiday Inn | 1 | Verizon Wireless | 3 | |
| Hollister Co. | 1 | Victoria's Secret | 1 | |
| Honda | 1 | Walgreens | 1 | |
| IHOP | 1 | Wendy's | 1 | |
| J.Crew | 1 | Wet Seal | 1 | |
| Jones New York | 5 | Whole Foods Market | 3 | |
| Journeys | 1 | YMCA | 1 | |
Strongest AM radio stations in Cambridge:
- WWZN (1510 AM; 50 kW; BOSTON, MA; Owner: ROSE CITY RADIO CORPORATION)
- WEZE (590 AM; 5 kW; BOSTON, MA; Owner: NEW ENGLAND CONTINENTAL MEDIA, INC.)
- WRKO (680 AM; 50 kW; BOSTON, MA; Owner: ENTERCOM BOSTON LICENSE, LLC)
- WEEI (850 AM; 50 kW; BOSTON, MA; Owner: ENTERCOM BOSTON LICENSE, LLC)
- WXKS (1430 AM; 5 kW; EVERETT, MA; Owner: AMFM RADIO LICENSES, L.L.C.)
- WILD (1090 AM; daytime; 5 kW; BOSTON, MA; Owner: RADIO ONE OF BOSTON LICENSES, LLC)
- WRCA (1330 AM; 25 kW; WALTHAM, MA; Owner: WRCA LICENSE, LLC)
- WBZ (1030 AM; 50 kW; BOSTON, MA; Owner: INFINITY BROADCASTING OPERATIONS, INC.)
- WUNR (1600 AM; 20 kW; BROOKLINE, MA; Owner: CHAMPION BROADCASTING SYSTEMS, INC.)
- WNTN (1550 AM; 10 kW; NEWTON, MA; Owner: COLT COMMUNICATIONS, LLC)
- WKOX (1200 AM; 50 kW; FRAMINGHAM, MA; Owner: CAPSTAR TX LIMITED PARTNERSHIP)
- WBPS (1150 AM; 5 kW; BOSTON, MA; Owner: MEGA COMMUNICATIONS OF BOSTON LICENSEE, L.L.C.)
- WBIX (1060 AM; 40 kW; NATICK, MA; Owner: LANGER BROADCASTING CORPORATION)
Strongest FM radio stations in Cambridge:
- WXKS-FM (107.9 FM; MEDFORD, MA; Owner: AMFM RADIO LICENSES, L.L.C.)
- WMJX (106.7 FM; BOSTON, MA; Owner: GREATER BOSTON RADIO, INC.)
- WBCN (104.1 FM; BOSTON, MA; Owner: HEMISPHERE BROADCASTING CORPORATION)
- WZLX (100.7 FM; BOSTON, MA; Owner: INFINITY BROADCASTING CORPORATION OF BOSTON)
- WERS (88.9 FM; BOSTON, MA; Owner: EMERSON COLLEGE)
- W267AI (101.3 FM; BOSTON, MA; Owner: MCC BROADCASTING COMPANY, INC.)
- WMBR (88.1 FM; CAMBRIDGE, MA; Owner: TECHNOLOGY BROADCASTING CORPORATION)
- WHRB (95.3 FM; CAMBRIDGE, MA; Owner: HARVARD RADIO BROADCASTING CO., INC.)
- WBMX (98.5 FM; BOSTON, MA; Owner: INFINITY RADIO OPERATIONS INC.)
- WJMN (94.5 FM; BOSTON, MA; Owner: AMFM RADIO LICENSES, L.L.C.)
- WBOS (92.9 FM; BROOKLINE, MA; Owner: GREATER BOSTON RADIO, INC.)
- WCRB (102.5 FM; WALTHAM, MA; Owner: CHARLES RIVER BROADCASTING WCRB LICE)
- WTKK (96.9 FM; BOSTON, MA; Owner: GREATER BOSTON RADIO, INC.)
- WROR-FM (105.7 FM; FRAMINGHAM, MA; Owner: GREATER BOSTON RADIO, INC.)
- WBUR-FM (90.9 FM; BOSTON, MA; Owner: TRUSTEES OF BOSTON UNIVERSITY)
- WGBH (89.7 FM; BOSTON, MA; Owner: WGBH EDUCATIONAL FOUNDATION)
- WFNX (101.7 FM; LYNN, MA; Owner: MCC BROADCASTING COMPANY, INC.)
- WODS (103.3 FM; BOSTON, MA; Owner: INFINITY BROADCASTING OPERATIONS, INC.)
- WMFO (91.5 FM; MEDFORD, MA; Owner: TUFTS UNIVERSITY)
- WZBC (90.3 FM; NEWTON, MA; Owner: TRUSTEES OF BOSTON COLLEGE)
TV broadcast stations around Cambridge:
- WBPX (Channel 68; BOSTON, MA; Owner: PAXSON BOSTON-68 LICENSE, INC.)
- WTMU-LP (Channel 32; BOSTON, MA; Owner: ZGS BOSTON, INC.)
- WCEA-LP (Channel 58; BOSTON, MA; Owner: CHANNEL 19 TV CORPORATION)
- WCVB-TV (Channel 5; BOSTON, MA; Owner: WCVB HEARST-ARGYLE TV, INC.)
- WGBH-TV (Channel 2; BOSTON, MA; Owner: WGBH EDUCATIONAL FOUNDATION)
- WHDH-TV (Channel 7; BOSTON, MA; Owner: WHDH-TV)
- WMFP (Channel 62; LAWRENCE, MA; Owner: WSAH LICENSE, INC.)
- WSBK-TV (Channel 38; BOSTON, MA; Owner: VIACOM INC.)
- WLVI-TV (Channel 56; CAMBRIDGE, MA; Owner: WLVI, INC.)
- WBZ-TV (Channel 4; BOSTON, MA; Owner: VIACOM INC.)
- WGBX-TV (Channel 44; BOSTON, MA; Owner: WGBH EDUCATIONAL FOUNDATION)
- WFXT (Channel 25; BOSTON, MA; Owner: FOX TELEVISION STATIONS INC.)
- W40BO (Channel 40; BOSTON, MA; Owner: PAXSON COMMUNICATIONS LPTV, INC.)
- WUTF (Channel 66; MARLBOROUGH, MA; Owner: TELEFUTURA BOSTON LLC)
- WWDP (Channel 46; NORWELL, MA; Owner: NORWELL TELEVISION, LLC)
- WUNI (Channel 27; WORCESTER, MA; Owner: ENTRAVISION HOLDINGS, LLC)
- WFXZ-CA (Channel 24; BOSTON, MA; Owner: BOSTON BROADCASTING CORP.)
- WLNE-TV (Channel 6; NEW BEDFORD, MA; Owner: FREEDOM BROADCASTING OF SOUTHERN NEW ENGLAND, INC.)
- WPRI-TV (Channel 12; PROVIDENCE, RI; Owner: TVL BROADCASTING OF RHODE ISLAND, LLC)
- WNAC-TV (Channel 64; PROVIDENCE, RI; Owner: WNAC, LLC)
- WJAR (Channel 10; PROVIDENCE, RI; Owner: OUTLET BROADCASTING, INC.)
- WSBE-TV (Channel 36; PROVIDENCE, RI; Owner: RHODE ISLAND PUBLIC TELECOM. AUTHORITY)
- WHDN-LP (Channel 26; BOSTON, MA; Owner: GUENTER MARKSTEINER)
- WNDS (Channel 50; DERRY, NH; Owner: CTV OF DERRY, INC)
Medal of Honor Recipients
Medal of Honor Recipient born in Cambridge: Joseph Xavier Grant.
- National Bridge Inventory (NBI) Statistics
- 18Number of bridges
- 407ft / 124mTotal length
- $128,892,000Total costs
- 490,797Total average daily traffic
- 15,792Total average daily truck traffic
- 914,888Total future (year 2031) average daily traffic
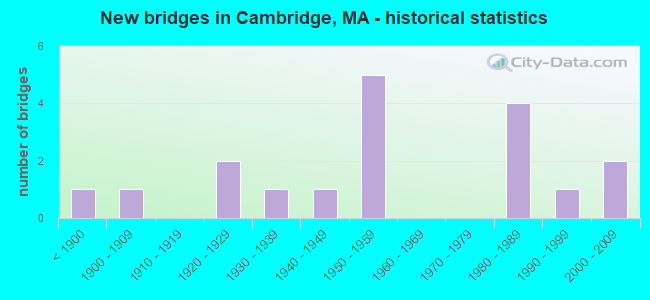
- New bridges - historical statistics
- 1Before 1900
- 11900-1909
- 21920-1929
- 11930-1939
- 11940-1949
- 51950-1959
- 41980-1989
- 11990-1999
- 22000-2009
FCC Registered Antenna Towers: 27 (See the full list of FCC Registered Antenna Towers)
FCC Registered Commercial Land Mobile Towers: 1 (See the full list of FCC Registered Commercial Land Mobile Towers in Cambridge, MA)
FCC Registered Private Land Mobile Towers: 1 (See the full list of FCC Registered Private Land Mobile Towers)
FCC Registered Broadcast Land Mobile Towers: 63 (See the full list of FCC Registered Broadcast Land Mobile Towers)
FCC Registered Microwave Towers: 142 (See the full list of FCC Registered Microwave Towers in this town)
FCC Registered Paging Towers: 3 (See the full list of FCC Registered Paging Towers)
FCC Registered Maritime Coast & Aviation Ground Towers: 3 (See the full list of FCC Registered Maritime Coast & Aviation Ground Towers)
FCC Registered Amateur Radio Licenses: 698 (See the full list of FCC Registered Amateur Radio Licenses in Cambridge)
FAA Registered Aircraft: 43 (See the full list of FAA Registered Aircraft in Cambridge)
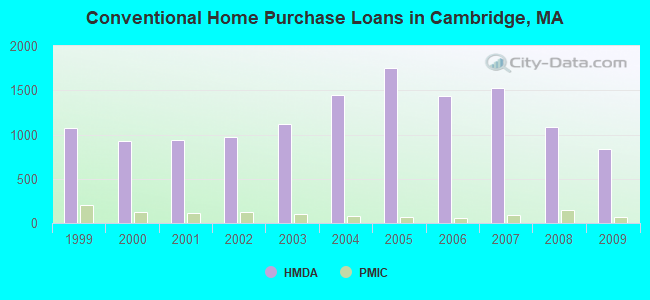
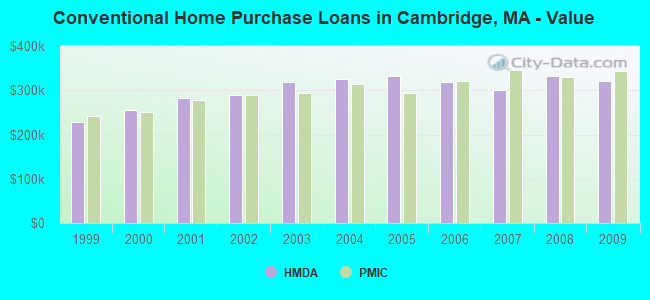
| Home Mortgage Disclosure Act Aggregated Statistics For Year 2009 (Based on 30 full tracts) | ||||||||||||
| A) FHA, FSA/RHS & VA Home Purchase Loans | B) Conventional Home Purchase Loans | C) Refinancings | D) Home Improvement Loans | E) Loans on Dwellings For 5+ Families | F) Non-occupant Loans on < 5 Family Dwellings (A B C & D) | |||||||
|---|---|---|---|---|---|---|---|---|---|---|---|---|
| Number | Average Value | Number | Average Value | Number | Average Value | Number | Average Value | Number | Average Value | Number | Average Value | |
| LOANS ORIGINATED | 37 | $407,811 | 831 | $320,267 | 2,257 | $325,053 | 93 | $273,344 | 25 | $1,798,280 | 236 | $357,589 |
| APPLICATIONS APPROVED, NOT ACCEPTED | 1 | $401,000 | 47 | $365,213 | 145 | $351,559 | 6 | $223,000 | 2 | $1,475,000 | 13 | $416,923 |
| APPLICATIONS DENIED | 19 | $331,316 | 113 | $310,381 | 457 | $350,333 | 26 | $139,423 | 2 | $3,050,000 | 86 | $314,384 |
| APPLICATIONS WITHDRAWN | 9 | $357,667 | 90 | $368,289 | 286 | $333,423 | 10 | $375,200 | 1 | $6,000,000 | 31 | $365,290 |
| FILES CLOSED FOR INCOMPLETENESS | 1 | $268,000 | 23 | $335,783 | 135 | $320,556 | 5 | $73,000 | 0 | $0 | 18 | $290,778 |
Detailed mortgage data for all 30 tracts in Cambridge, MA
| Private Mortgage Insurance Companies Aggregated Statistics For Year 2009 (Based on 30 full tracts) | ||||
| A) Conventional Home Purchase Loans | B) Refinancings | |||
|---|---|---|---|---|
| Number | Average Value | Number | Average Value | |
| LOANS ORIGINATED | 64 | $342,938 | 62 | $322,887 |
| APPLICATIONS APPROVED, NOT ACCEPTED | 10 | $356,100 | 12 | $316,500 |
| APPLICATIONS DENIED | 13 | $304,077 | 7 | $385,857 |
| APPLICATIONS WITHDRAWN | 3 | $362,667 | 2 | $287,500 |
| FILES CLOSED FOR INCOMPLETENESS | 2 | $323,000 | 0 | $0 |
2002 - 2018 National Fire Incident Reporting System (NFIRS) incidents
- Fire incident types reported to NFIRS in Cambridge, MA
- 11,52884.3%Structure Fires
- 1,69112.4%Outside Fires
- 3402.5%Mobile Property/Vehicle Fires
- 1180.9%Other
 According to the data from the years 2002 - 2018 the average number of fires per year is 805. The highest number of fire incidents - 1,113 took place in 2017, and the least - 483 in 2005. The data has a rising trend.
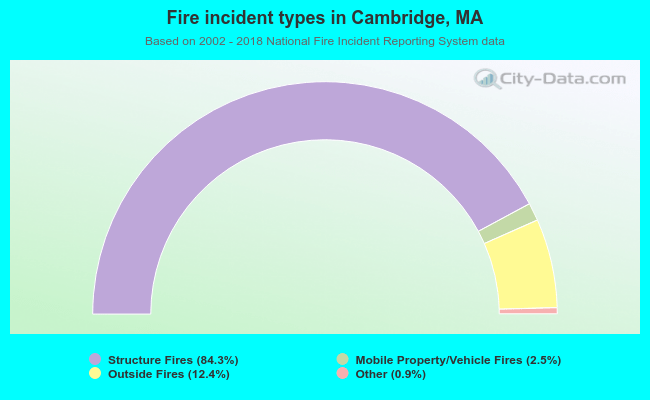 When looking into fire subcategories, the most incidents belonged to: Structure Fires (84.3%), and Outside Fires (12.4%).
Fire-safe hotels and motels in Cambridge, Massachusetts:
- Royal Sonesta Hotel, 40 Edwin Land Blvd, Cambridge, Massachusetts 02142 , Phone: (617) 806-4200, Fax: (617) 806-4232
- The Inn At Harvard, 1201 Massachusetts Ave, Cambridge, Massachusetts 02138 , Phone: (617) 491-2222, Fax: (617) 491-6520
- Courtyard By Marriott Boston-Cambridge, 777 Memorial Dr, Cambridge, Massachusetts 02139 , Phone: (617) 492-7777, Fax: (617) 492-6038
- Le Meridien Cambridge, 20 Sidney St, Cambridge, Massachusetts 02139 , Phone: (617) 577-0200, Fax: (617) 494-8366
- Charles Hotel, One Bennett St, Cambridge, Massachusetts 02138 , Phone: (617) 864-1200, Fax: (617) 661-5053
- Holiday Inn Express Hotel & Suites, 250 Monsignor O'brien Hwy, Cambridge, Massachusetts 02141 , Phone: (617) 577-7600, Fax: (617) 354-1313
- Hampton Inn Boston/Cambridge, 191 Monsignor O'brien Hwy, Cambridge, Massachusetts 02141 , Phone: (617) 494-5300, Fax: (617) 494-6569
- Best Western Hotel Tria, 220 Alewife Brook Pkwy, Cambridge, Massachusetts 02138 , Phone: (617) 491-8000, Fax: (617) 491-4932
- 6 other hotels and motels
| Most common first names in Cambridge, MA among deceased individuals | ||
| Name | Count | Lived (average) |
|---|---|---|
| Mary | 1,369 | 81.6 years |
| John | 964 | 74.1 years |
| Joseph | 585 | 73.7 years |
| Margaret | 545 | 81.5 years |
| William | 541 | 74.3 years |
| Helen | 448 | 79.9 years |
| James | 444 | 73.9 years |
| George | 348 | 75.4 years |
| Catherine | 340 | 81.4 years |
| Anna | 338 | 82.0 years |
| Most common last names in Cambridge, MA among deceased individuals | ||
| Last name | Count | Lived (average) |
|---|---|---|
| Sullivan | 199 | 76.0 years |
| Murphy | 172 | 77.4 years |
| Smith | 148 | 78.1 years |
| Johnson | 122 | 75.3 years |
| Brown | 113 | 79.7 years |
| Mccarthy | 94 | 76.0 years |
| Walsh | 81 | 77.3 years |
| Mahoney | 81 | 76.3 years |
| Williams | 78 | 76.2 years |
| Kelley | 77 | 74.3 years |
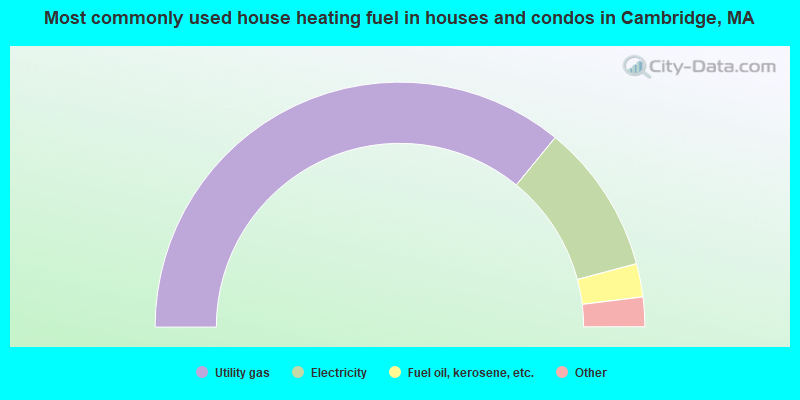
- 71.8%Utility gas
- 19.8%Electricity
- 4.4%Fuel oil, kerosene, etc.
- 1.8%Bottled, tank, or LP gas
- 0.9%Solar energy
- 0.8%No fuel used
- 0.5%Other fuel
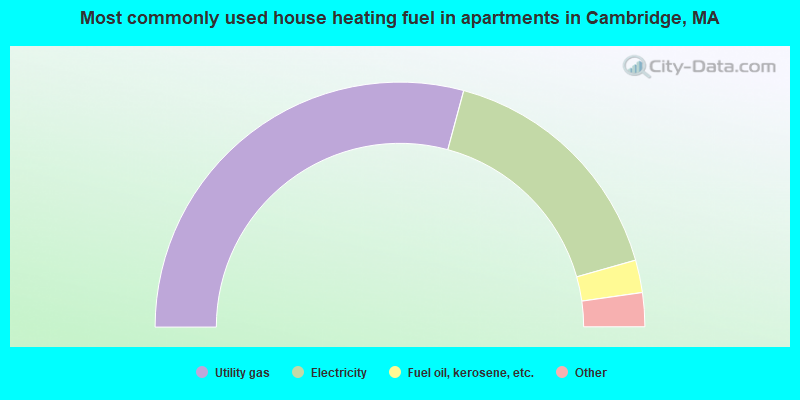
- 58.4%Utility gas
- 32.8%Electricity
- 4.3%Fuel oil, kerosene, etc.
- 2.2%No fuel used
- 1.6%Bottled, tank, or LP gas
- 0.6%Other fuel
- 0.1%Coal or coke
Cambridge compared to Massachusetts state average:
- Median house value above state average.
- Unemployed percentage below state average.
- Black race population percentage above state average.
- Median age significantly below state average.
- Foreign-born population percentage above state average.
- Renting percentage above state average.
- Number of rooms per house below state average.
- Number of college students above state average.
- Percentage of population with a bachelor's degree or higher significantly above state average.
Cambridge on our top lists:
- #1 on the list of "Top 101 cities with the biggest local government total salary and wages expenses per resident (population 10,000+)"
- #1 on the list of "Top 101 cities with largest percentage of males in occupations: life, physical, and social science occupations (population 50,000+)"
- #3 on the list of "Top 101 cities with the lowest percentage of family households, population 100,000+"
- #3 on the list of "Top 101 cities with largest percentage of females in occupations: life, physical, and social science occupations (population 50,000+)"
- #4 on the list of "Top 101 cities with the most people having Master's or Doctorate degrees (population 50,000+)"
- #5 on the list of "Top 101 cities with the most people having Doctorate degrees (population 50,000+)"
- #6 on the list of "Top 101 cities with largest percentage of males in industries: educational services (population 50,000+)"
- #6 on the list of "Top 101 cities with largest percentage of males in occupations: education, training, and library occupations (population 50,000+)"
- #9 on the list of "Top 101 cities with largest percentage of females in occupations: architecture and engineering occupations (population 50,000+)"
- #9 on the list of "Top 100 best educated cities (highest percentage of bachelor degree holding residents) (pop. 50,000+)"
- #9 on the list of "Top 101 cities with the smallest percentage of one, detached housing units in structures (20,000+ housing units)"
- #10 on the list of "Top 101 cities with the smallest differences between morning and afternoon humidity (population 50,000+)"
- #10 on the list of "Top 101 cities with the smallest humidity differences during a year (population 50,000+)"
- #11 on the list of "Top 101 cities with the highest cost per building permit(population 50,000+)"
- #11 on the list of "Top 101 cities with the most people taking subway or elevated to work (population 5,000+)"
- #12 on the list of "Top 101 cities with largest percentage of males in industries: professional, scientific, and technical services (population 50,000+)"
- #12 on the list of "Top 101 cities with largest percentage of females in industries: professional, scientific, and technical services (population 50,000+)"
- #13 on the list of "Top 101 cities with the largest percentage of likely lesbian couples (counted as self-reported female-female unmarried-partner households) (population 50,000+)"
- #13 on the list of "Top 101 cities with the biggest property tax revenues per resident (population 10,000+)"
- #14 on the list of "Top 101 cities with largest percentage of males in occupations: business and financial operations occupations (population 50,000+)"
- #37 (02139) on the list of "Top 101 zip codes with the most big companies in 2005 (at least 1000 employees)"
- #86 (02142) on the list of "Top 101 zip codes with the highest 2012 average reported profit/loss from business (pop 1,000+)"
- #94 (02141) on the list of "Top 101 zip codes with the largest percentage of Portuguese first ancestries (pop 5,000+)"
- #4 on the list of "Top 101 counties with the most Orthodox adherents"
- #7 on the list of "Top 101 counties with the most Catholic adherents"
- #7 on the list of "Top 101 counties with the most Mainline Protestant congregations"
- #7 on the list of "Top 101 counties with the most Orthodox congregations"
- #8 on the list of "Top 101 counties with the lowest percentage of residents that keep firearms around their homes"

|
|
Total of 16083 patent applications in 2008-2024.